1. Introduction
The development of the energy sector is one of the priorities for most governments around the world [
1]. Major world powers are undertaking large-scale projects to build power plants and transport routes to address their energy issues [
2,
3]. Underdeveloped and developing countries are no exception, especially since USD 3.4 trillion of investment would be needed to fund the infrastructure gap in Africa alone. It is extremely important to ensure that renewable energy projects are funded in an inclusive manner, i.e., by including any technology or fuel that is important for the future [
4]. Power plants often occupy large areas and generally produce greenhouse gases, harmful gases, and pollution [
4], which contribute to environmental problems such as global warming. With global warming increasing over the years, these countries will be forced to turn to so-called renewable energies [
4].
The widespread use of hydrogen fuel cell technologies and the production of green hydrogen have an impact on energy production and environmental protection. In addition, the harmful gases produced by the use of fossil fuels make it necessary to push forward research into more environmentally friendly and sustainable alternatives. As a result, most countries around the world are considering replacing polluting energy sources with so-called green energies. Hydrogen is therefore an interesting alternative that is already being explored in developed countries, and exploration in Africa is imperative and would help reduce and prevent pollution and the proliferation of greenhouse gases, thereby mitigating global warming.
Geologically and geographically available renewable energy sources are relatively abundant and free, which is hardly the case for fossil fuels.
The use of solar and wind energy resources increased significantly between 1996 and 2013, rising from less than 50.0 GW in 1996 to just over 300.0 GW in 2013 [
5].
Several scientific studies [
4,
5,
6,
7,
8,
9,
10,
11,
12,
13,
14,
15,
16,
17,
18,
19,
20,
21,
22,
23,
24] have demonstrated the reliability and cost-effectiveness of using Hybrid Renewable Energy Systems (HRESs) and the benefits of considering hydrogen over fossil fuels to meet electricity needs (
Table 1,
Table 2 and
Table 3).
Table 1 shows that HRESs exist worldwide.
Table 2 shows that in America, Europe, and Asia, numerous studies are being conducted on HRESs using hydrogen.
Table 3 shows that studies are also underway in Africa on the use of HRESs using hydrogen.
The aim of this paper is to determine the hybrid energy system best suited to addressing the energy problem in the study area, and then to make successive substitutions of different energy sources, starting with the most polluting, in order to assess the possibilities for transitioning the energy used in the area to green hydrogen. The applications considered do not have access to the electricity grid, and battery storage is used in the assessment of the reliability of the proposed systems. Household electricity consumption is 7.7 kWh/day with a peak of 1.4 kW, and the deferrable load is 1.5 kWh/day with a peak of 0.2 kW (
Table 4). The possibility of using green hydrogen as a clean fuel to replace diesel is being studied here in order to reduce and prevent atmospheric pollution and the proliferation of greenhouse gases with the aim of mitigating their effects on the environment (global warming).
2. Materials and Methods
2.1. Climate Data
Located at coordinates 2° to 13° north latitude and 9° to 16° east longitude, Cameroon still faces electrification problems in both urban and rural areas, which could affect the country’s sustainable development. Between 2014 and 2021, the rate of access to electricity in Cameroon increased by nearly 2%, from 58.4% to 60.2%, according to the results of the 5th Cameroon Household Survey, published on 24 April 2024, by the National Institute of Statistics (INS) [
27]. The rate of access to electricity reaches 87.6% in urban areas of Cameroon, but is only 28.4% in rural areas [
28]. This situation highlights the marked imbalance in electrification between cities and the countryside, making rural populations the most disadvantaged in this sector. The lack of energy services in rural areas and the ongoing energy crisis in urban and peri-urban areas, the resurgence of the harmful effects of climate change, the widespread shift to renewable energy, and Cameroon’s strong potential for renewable energy mean that Cameroon should consider the effective deployment of renewable energy, despite the needs expressed and all the development challenges, the assessment of the political and legal framework with regard to the situation of renewable energies in Cameroon, and in comparison with the situation in other countries. In fact, Cameroon receives an average of 4.4 kWh/m
2/day in terms of solar radiation, with a temperature of 21.6 °C and an average wind speed of 3.0 m/s.
Given that the availability of energy potential depends on the geography of the area studied [
5], Homer Pro software (3.16.2 version) was used to extract solar, wind, and temperature data from different areas of the country, and an interpolation was made in ArcGIS 10.8 software.
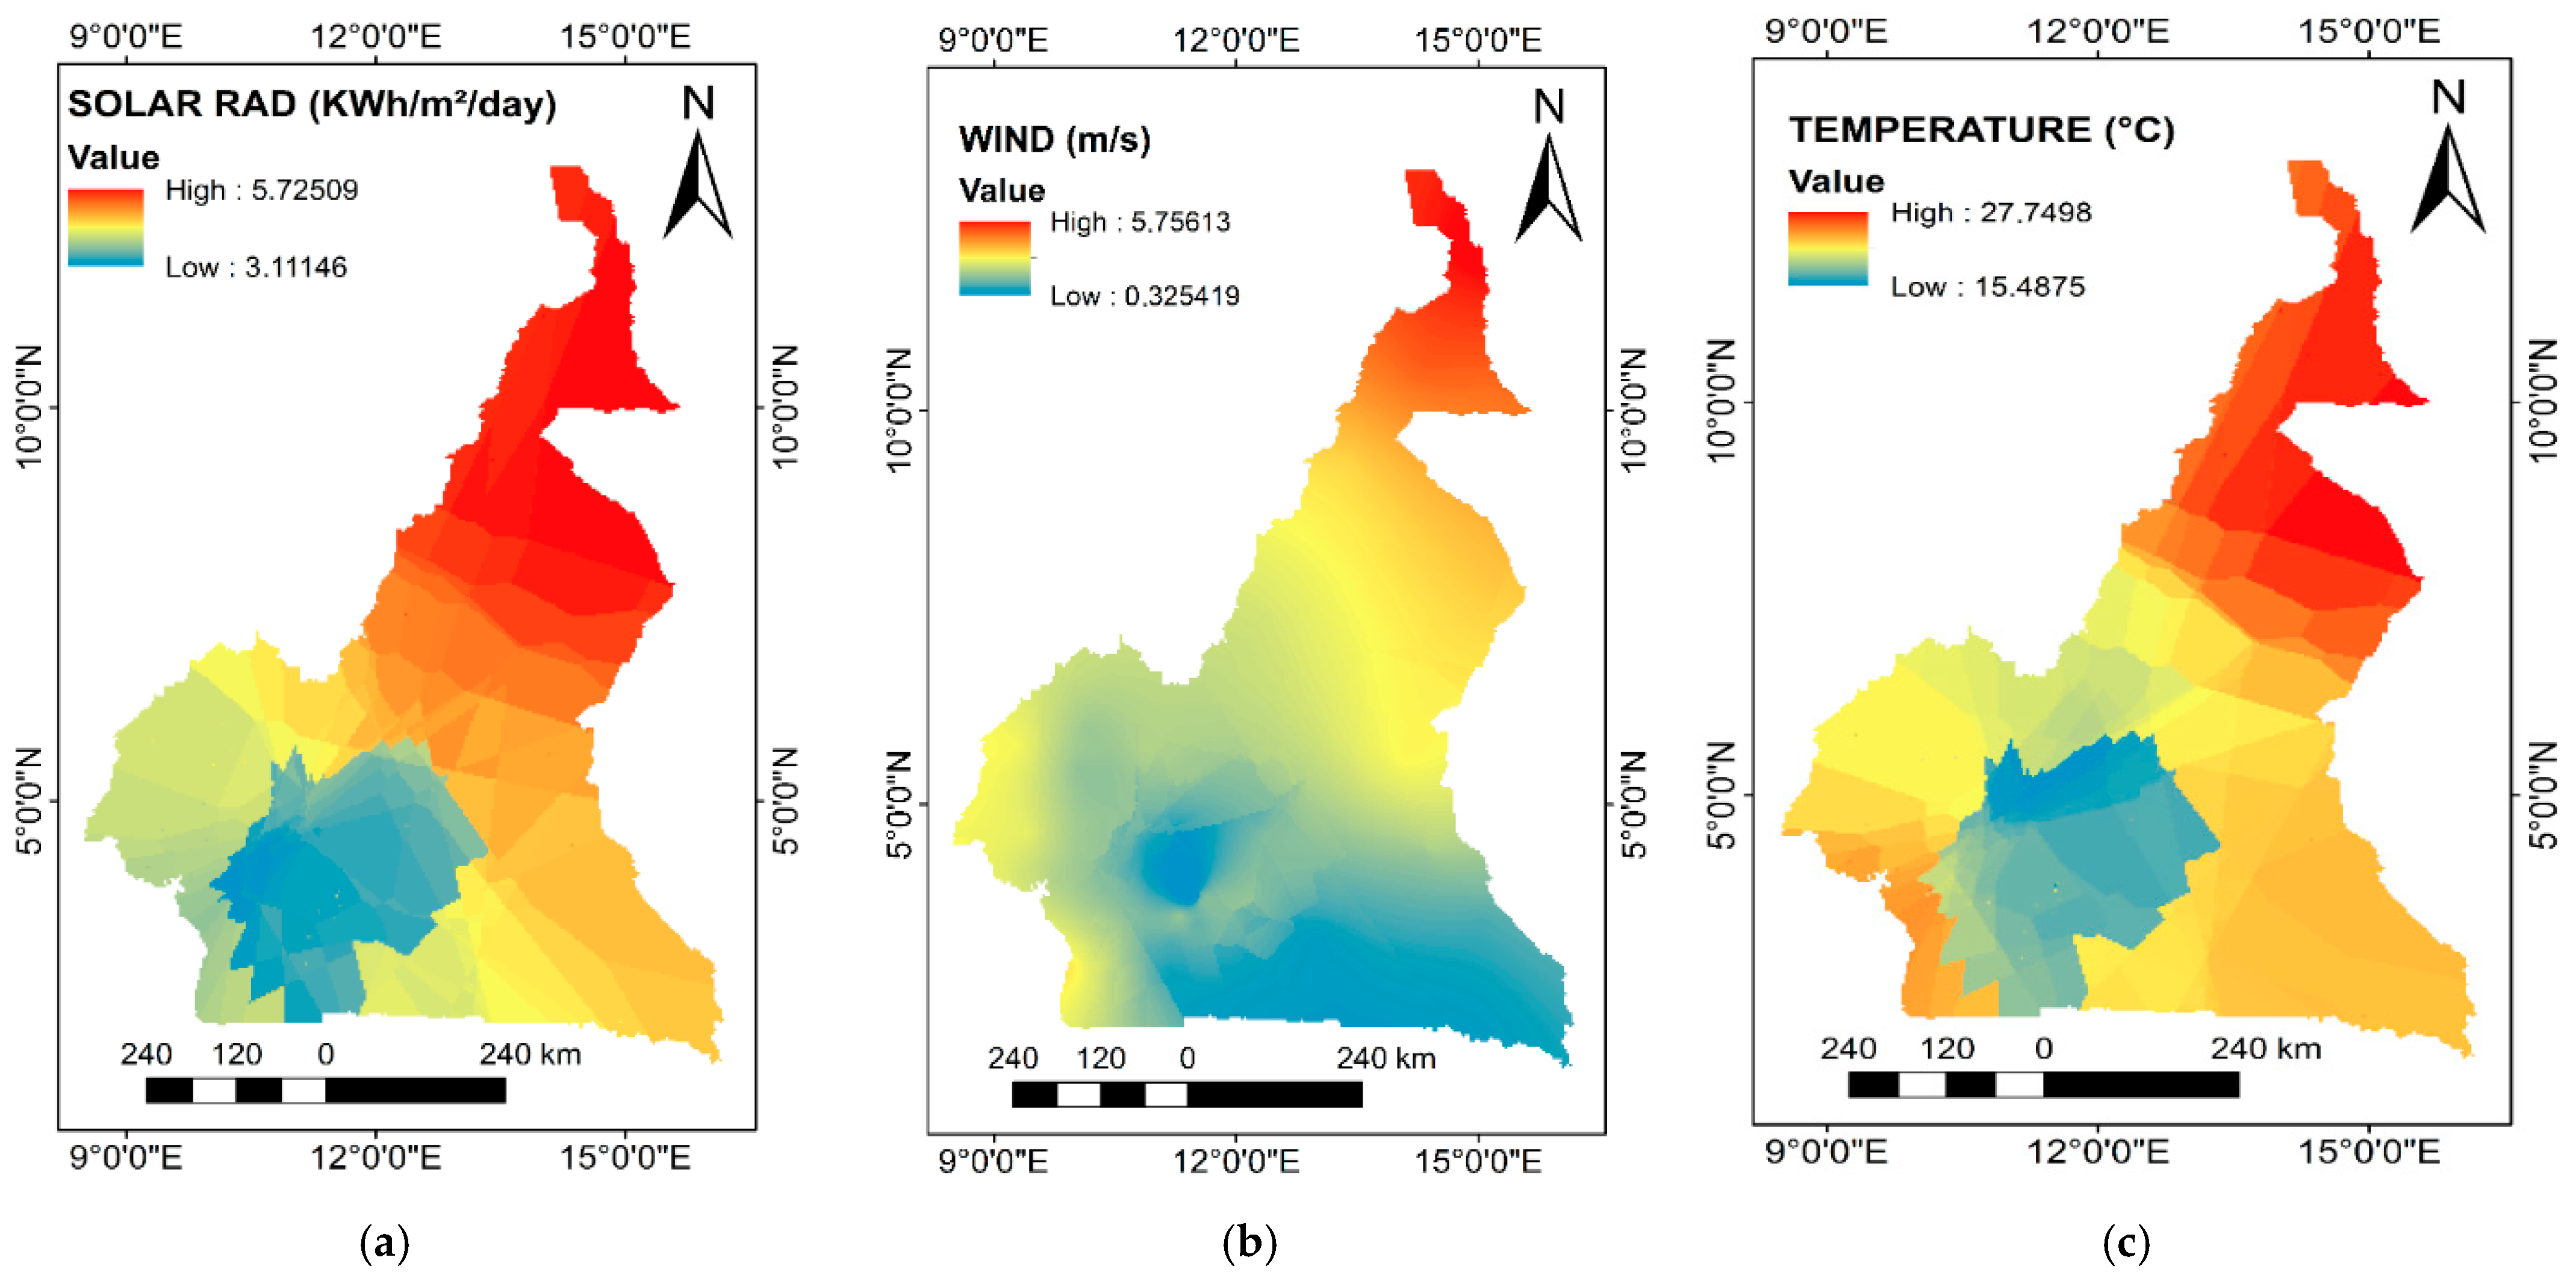
Figure 1 shows the distribution of the three natural parameters that enable the configuration of renewable energy systems.
2.1.1. Solar Radiation
Solar radiation data for the various points considered are obtained using Homer Pro software. The solar radiation incident on the horizontal surface of the study area is 4.6 kWh/m
2/day. January and February are the months with the highest solar radiation, while August has the lowest.
Figure 1a shows the variations in solar radiation in Cameroon. The maximum and minimum values are 5.7 kWh/m
2/day and 3.1 kWh/m
2/day, respectively. High radiation levels are observed in the north, making this area suitable for photovoltaic energy exploitation. In addition, a decreasing variation in solar radiation can be observed from the north to south of the study area, with lower variations in the central part of the southern equatorial zone.
2.1.2. Wind Speed
The average annual wind speed for the study area is around 3.1 m/s. These values are measured and recorded at a height of 10 m. The highest average monthly wind speed occurs in August [
29], and average wind speeds for the months of the year range from 1.7 m/s to 1.8 m/s.
Figure 1b shows the different variations in wind speeds in the area. The maximum and minimum values are 5.8 m/s and 0.3 m/s, respectively. Wind speeds decrease from north to south, with minimum values in the central part of the south and southeast of the equatorial zone. The strongest winds are observed between 10° and 13°05 north latitude in the northern part, making this the most suitable area for installing wind turbines.
2.1.3. Temperature
Temperature data for the study area were obtained using Homer Pro software, with the highest temperatures ranging from 24.1 (in March) to 24.0 (in February) degrees Celsius. The lowest temperatures were observed in July (21.9 °C).
Figure 1c shows the temperature variations in the area. The maximum and minimum values are 27.7 °C and 15.5 °C, respectively. The high solar radiation observed in the north may mean that this part could be classified as an area with high potential for photovoltaic energy [
30]. The spatial variation in solar data and the spatial variation in temperature may be positively correlated with each other.
Figure 1.
Distribution of resources: (a) solar radiation, (b) wind speed, (c) temperature.
Figure 1.
Distribution of resources: (a) solar radiation, (b) wind speed, (c) temperature.
2.2. Organization Chart
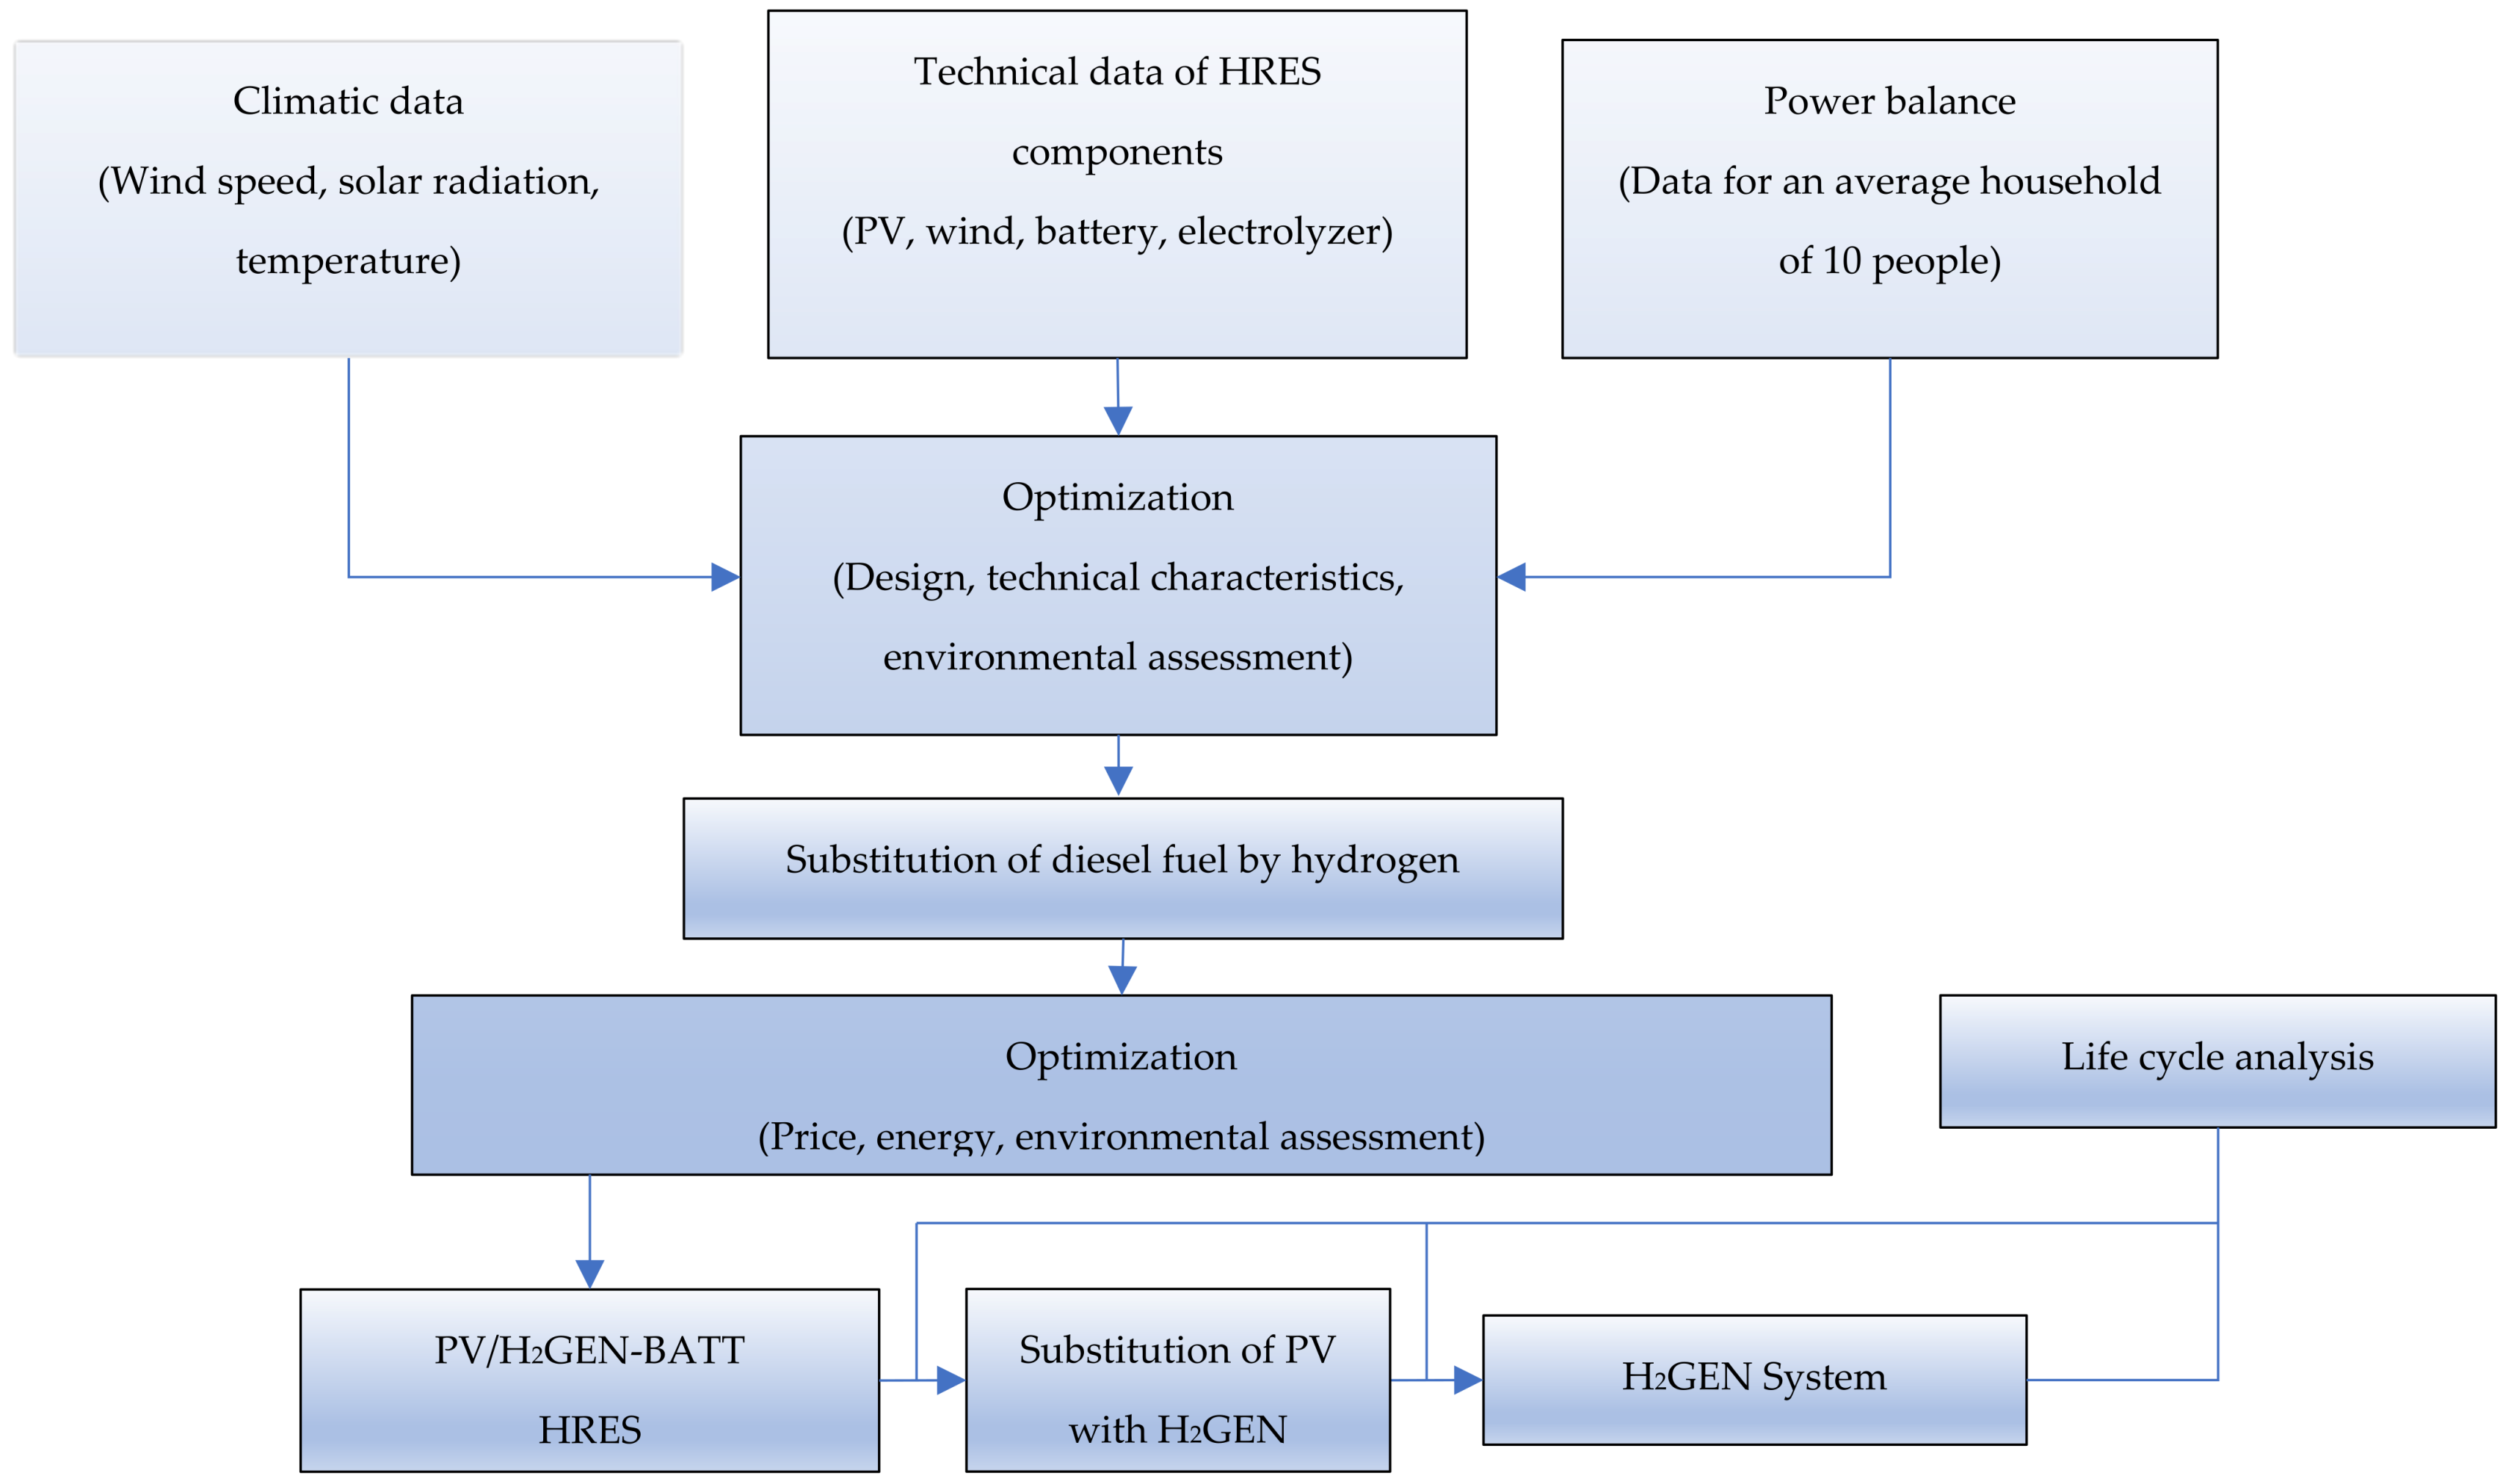
The organization chart below summarizes all of the methodological information used to carry out this work (
Figure 2).
2.3. Homer Pro Software
Designed to simulate and optimize hybrid electrical systems, the Homer Pro software (3.16.2 version) is a versatile package. Based on the best possible match between supply and demand, this software package performs a large number of hourly simulations. It assesses the technical feasibility of a system to determine whether it can meet electrical and thermal loads while determining the total NPC of the system, expressed by Equation (1) [
31].
where Ctot represents the total annual cost of the system (in USD/year), i is the annual interest rate (%), Tp is the project lifetime, and CRF is the capital recovery factor, expressed as Equation (2).
where n represents the number of years of the project. In the Homer Pro software, the payback cost is calculated as Equation (3).
where Crc represents the replacement cost of the equipment (USD), Trem represents the remaining life of the equipment (years), and Tcom represents the life of the component (years). In addition, the discounted Cost Of Energy (COE) Equation (4) is calculated as follows:
where Etot is the total annual electricity consumption (kWh/year).
The environmental analysis was carried out using life cycle assessment. In this analysis, greenhouse gas emissions linked to the production of green hydrogen were considered negligible [
32] and other emissions linked to the production of system components were taken into account.
3. Results
3.1. System Configuration
The study area was divided into four geographical regions: the Greater North (including the cities of Garoua, Maroua, and Ngaoundere), the Greater South (including the cities of Ebolowa, Douala, and Yaounde), the Greater East (including the city of Bertoua), and the Greater West (including the cities of Bafoussam, Buea, and Bamenda).
Table 5 presents the data for these different cities.
The components of the system used as input data in the Homer Pro software are summarized in
Table 6. These components and their characteristics are retained and used as input data for other regions of Cameroon to determine the profitability of the system based on climate data (sun, wind, and temperature).
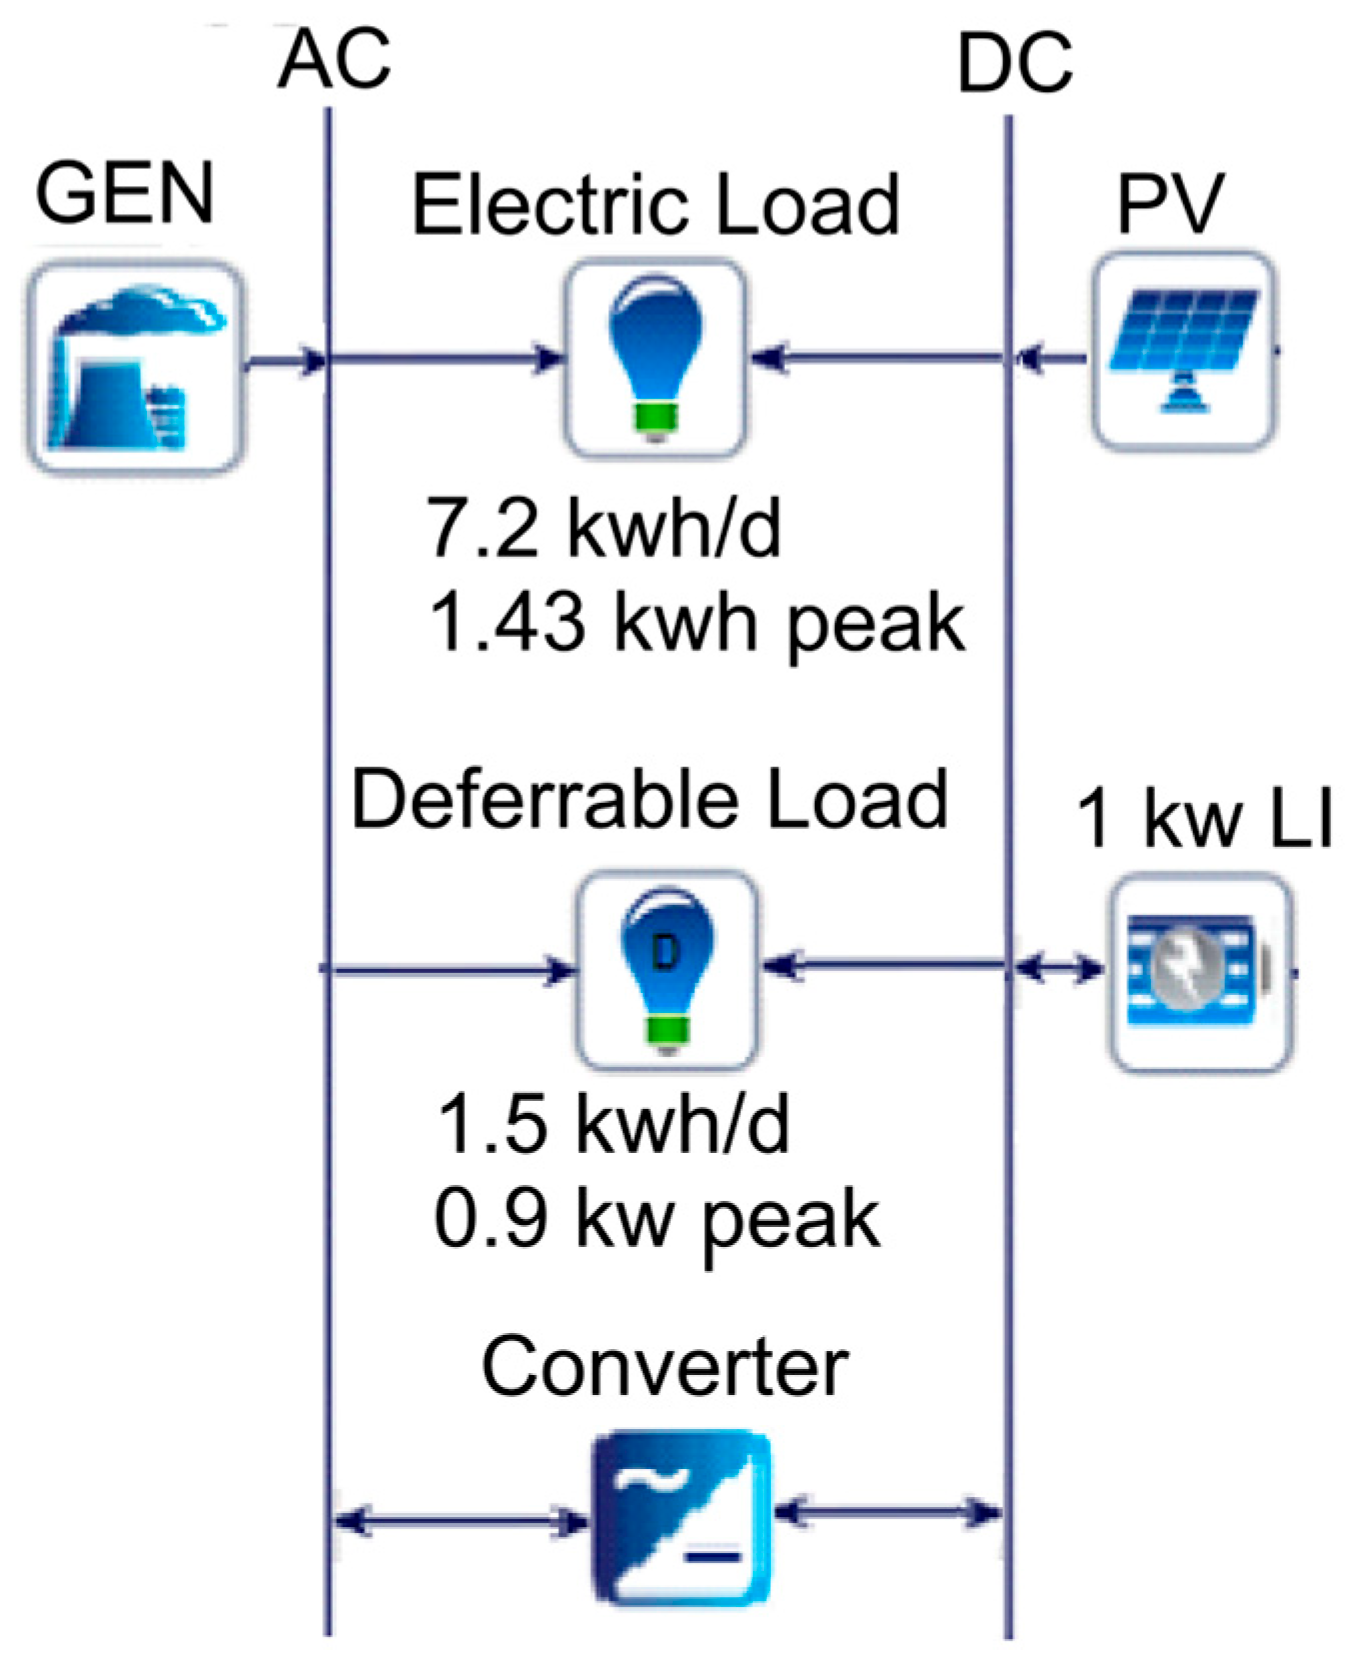
The system configuration will be based not only on climatic conditions to ensure the judicious and objective choice of components, but also on demand; the system is intended to be disconnected from the electricity grid in order to provide reliable and low-cost energy to households.
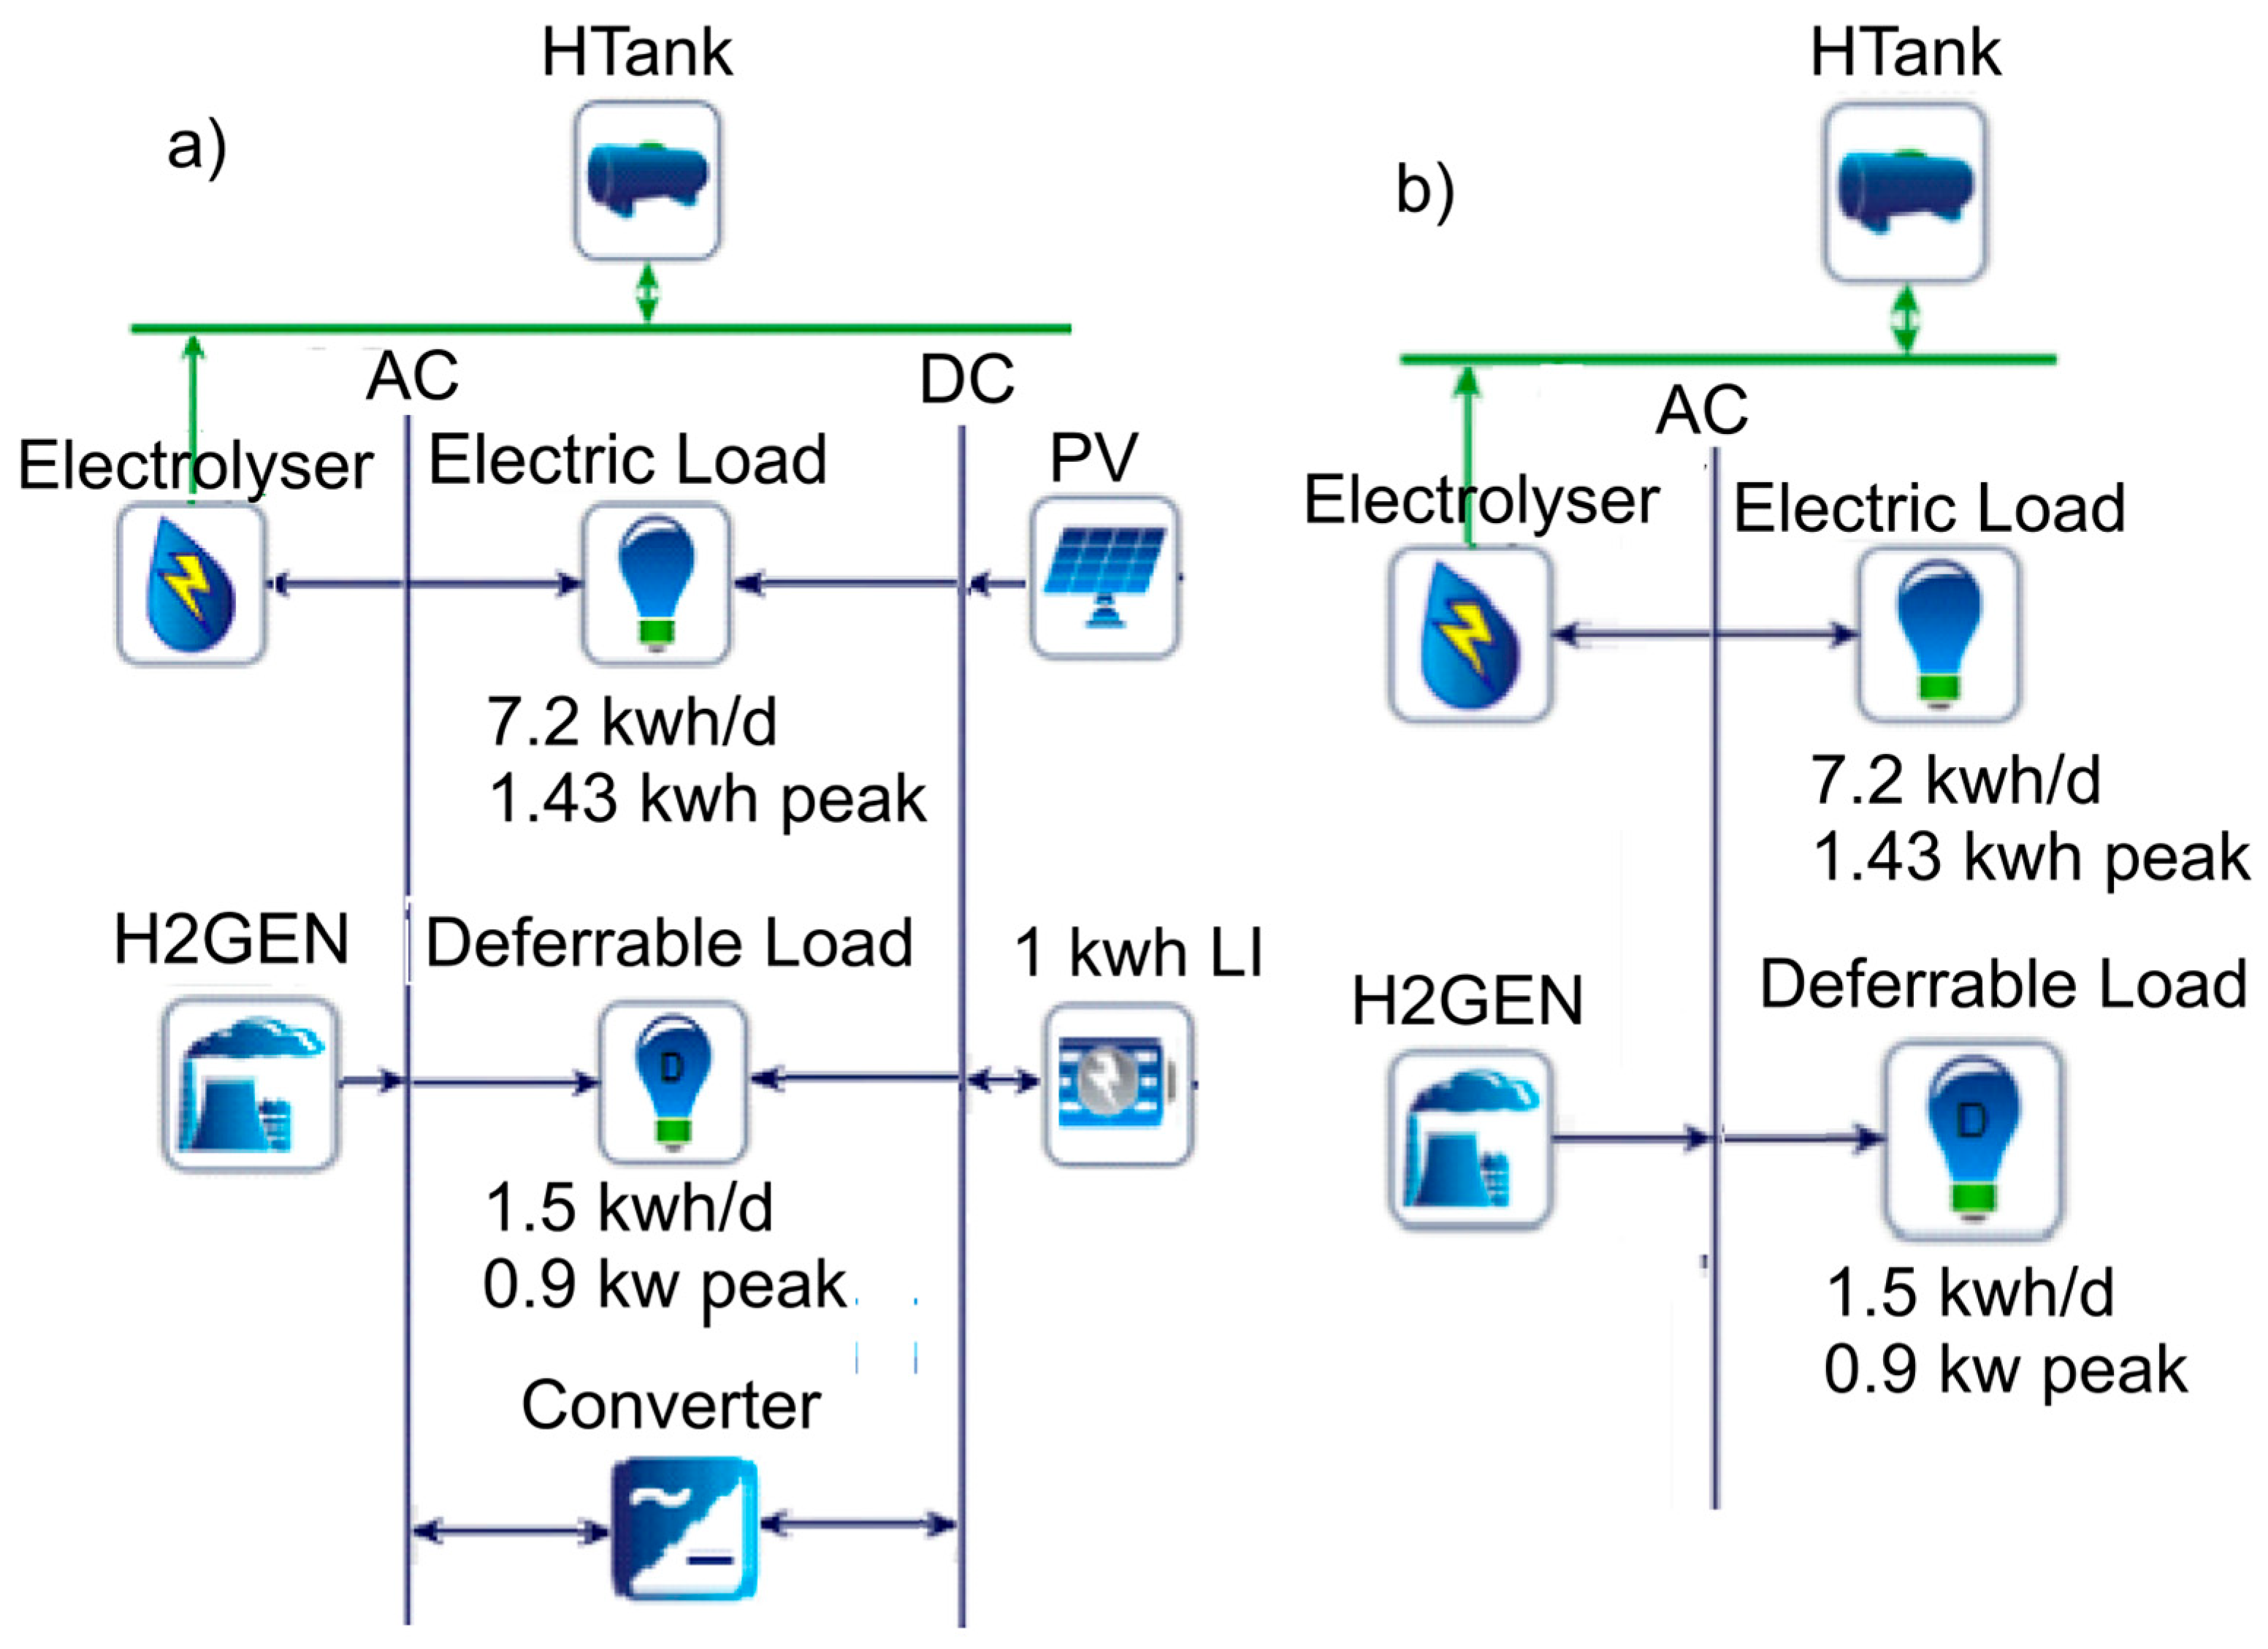
Figure 3 shows the system configuration adapted to the geographical boundaries of the areas under consideration.
The input data in the Homer Pro software for the analyses of these systems are listed in
Table 6. Note that these analyses performed by the software will provide the best-case scenario for each system. The monetary values in the analysis are in US dollars (USD) as of 30 January 2025; with a value of USD 1.3/l for diesel.
3.1.1. Technical and Economic Aspects
After analyzing the input data in the software, the results are presented according to two aspects that allow conclusions to be drawn about the importance of applying HRESs in the Central African sub-region, particularly in Cameroon.
Table 7 presents the results of the best scenarios (the results of optimization using Homer Pro software) for each region in terms of Net Present Cost (NPC), Cost Of Energy (COE), Operation and Maintenance Cost (O&M cost), and Renewable Fraction (RF) in the 10 regions of the country.
The overall architecture, regardless of the region, shows that the best configuration proposed is the PV–Diesel–Battery option with an average NPC of USD 19,267 and an average COE of USD 0.4/kWh.
It consists of a Generic flat Photovoltaic (PV) module (2.5 kW), Auto Genset (1.6 kW), Generic 1.0 kWh li-ion, a system converter (1.0 kW), and cyclic charging.
The Net Present Cost (NPC) values range from USD 17.3 to USD 20.6, with an average of USD 19.3. The COE values vary between USD 0.39 and USD 0.47/kWh, with an average of USD 0.4/kWh, while O&M costs vary between USD 528 and USD 734/year, with an average value of USD 648/year while the RF (Renewable Fraction) varies between 58.8% and 75.0% for an average value of 65.7%. These results show that, regardless of the location within the country, the variations in all parameters (NPC, COE, and O&M) are small and the capital remains virtually the same for most cities.
Details of the NPC breakdown for different cities according to the system that was deemed the best scenario during the Homer analysis, namely PV–Diesel–Battery, are shown in
Table 8.
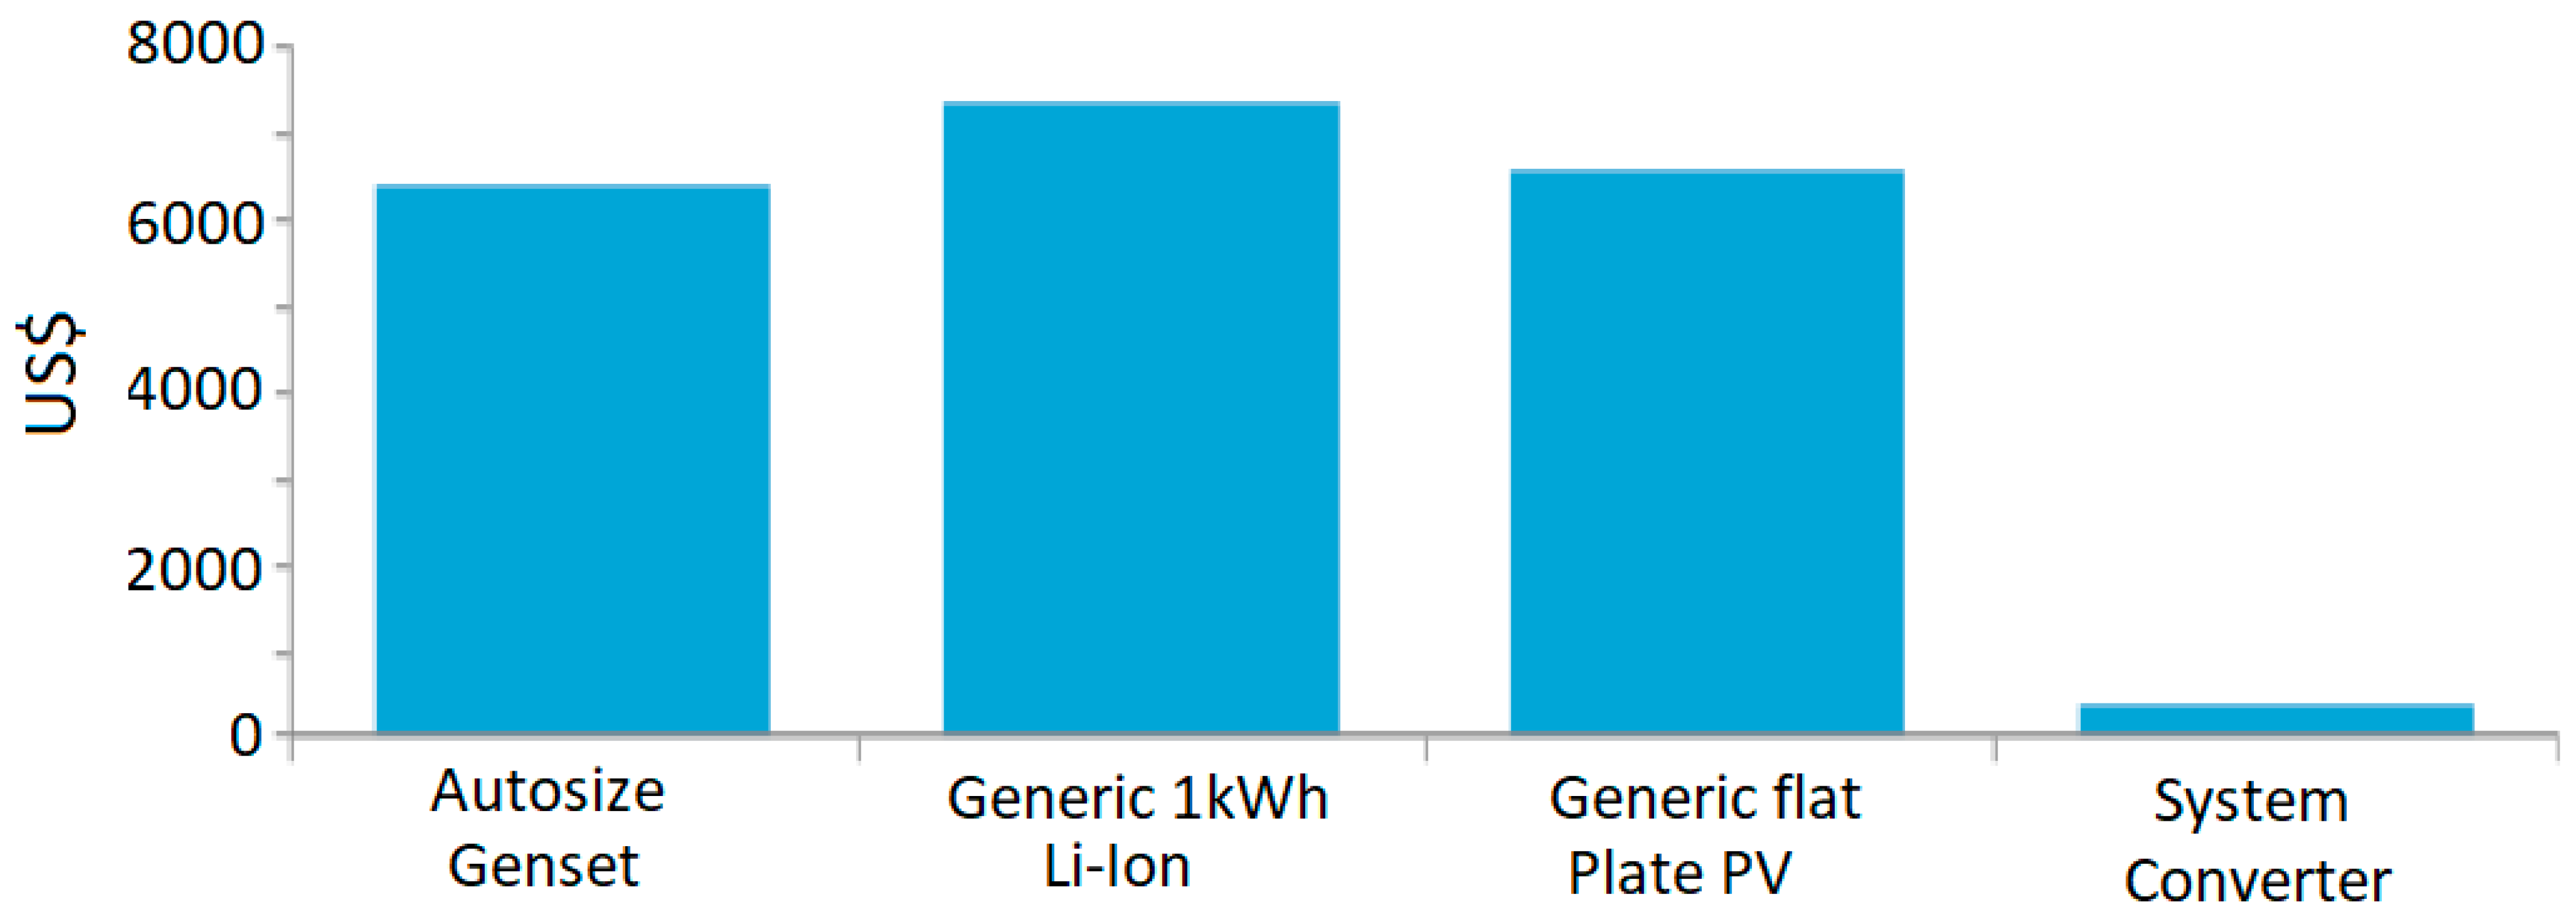
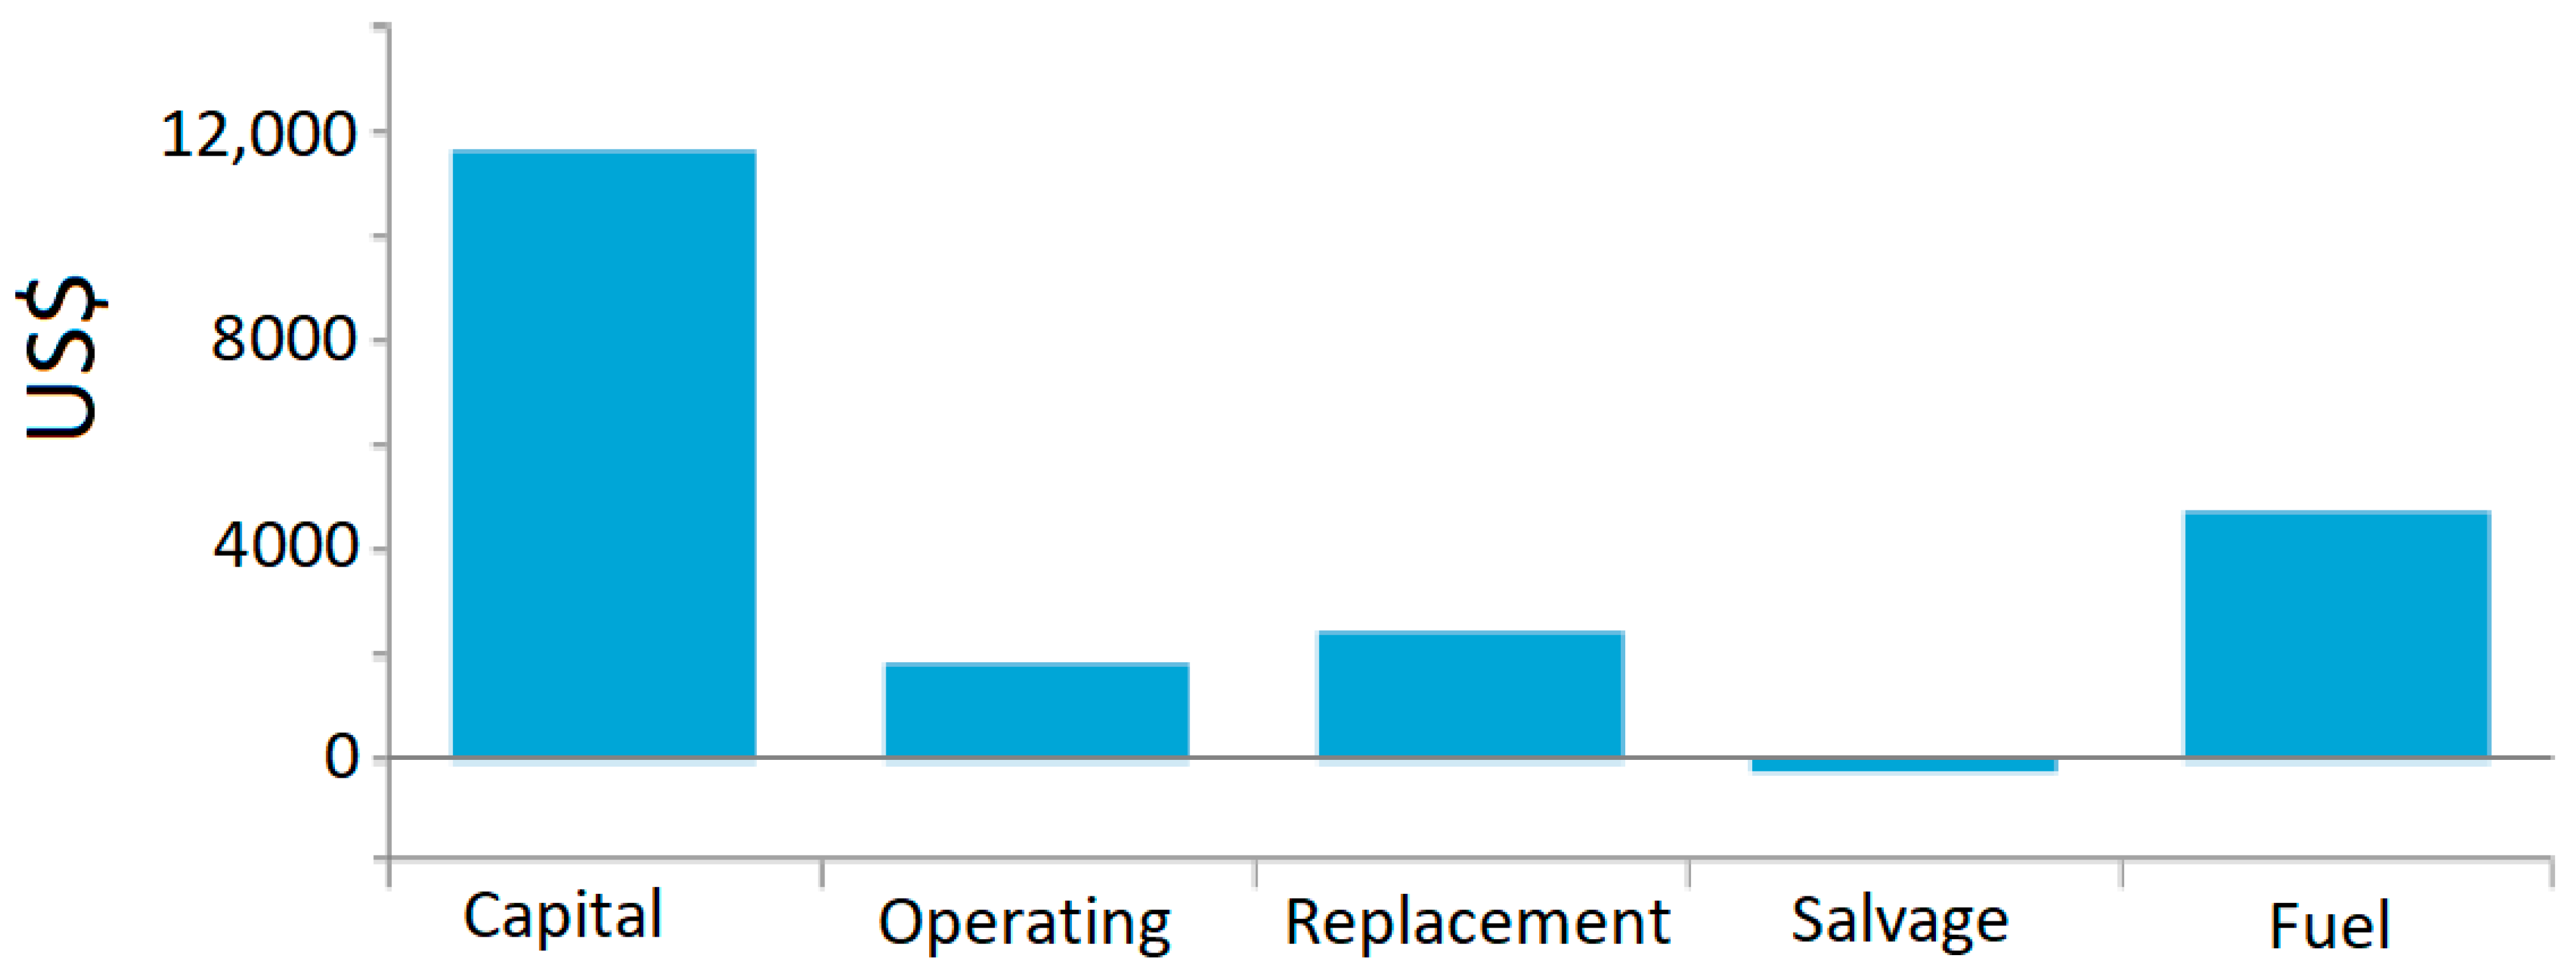
Figure 4 and
Figure 5 provide more information on the distribution of system costs.
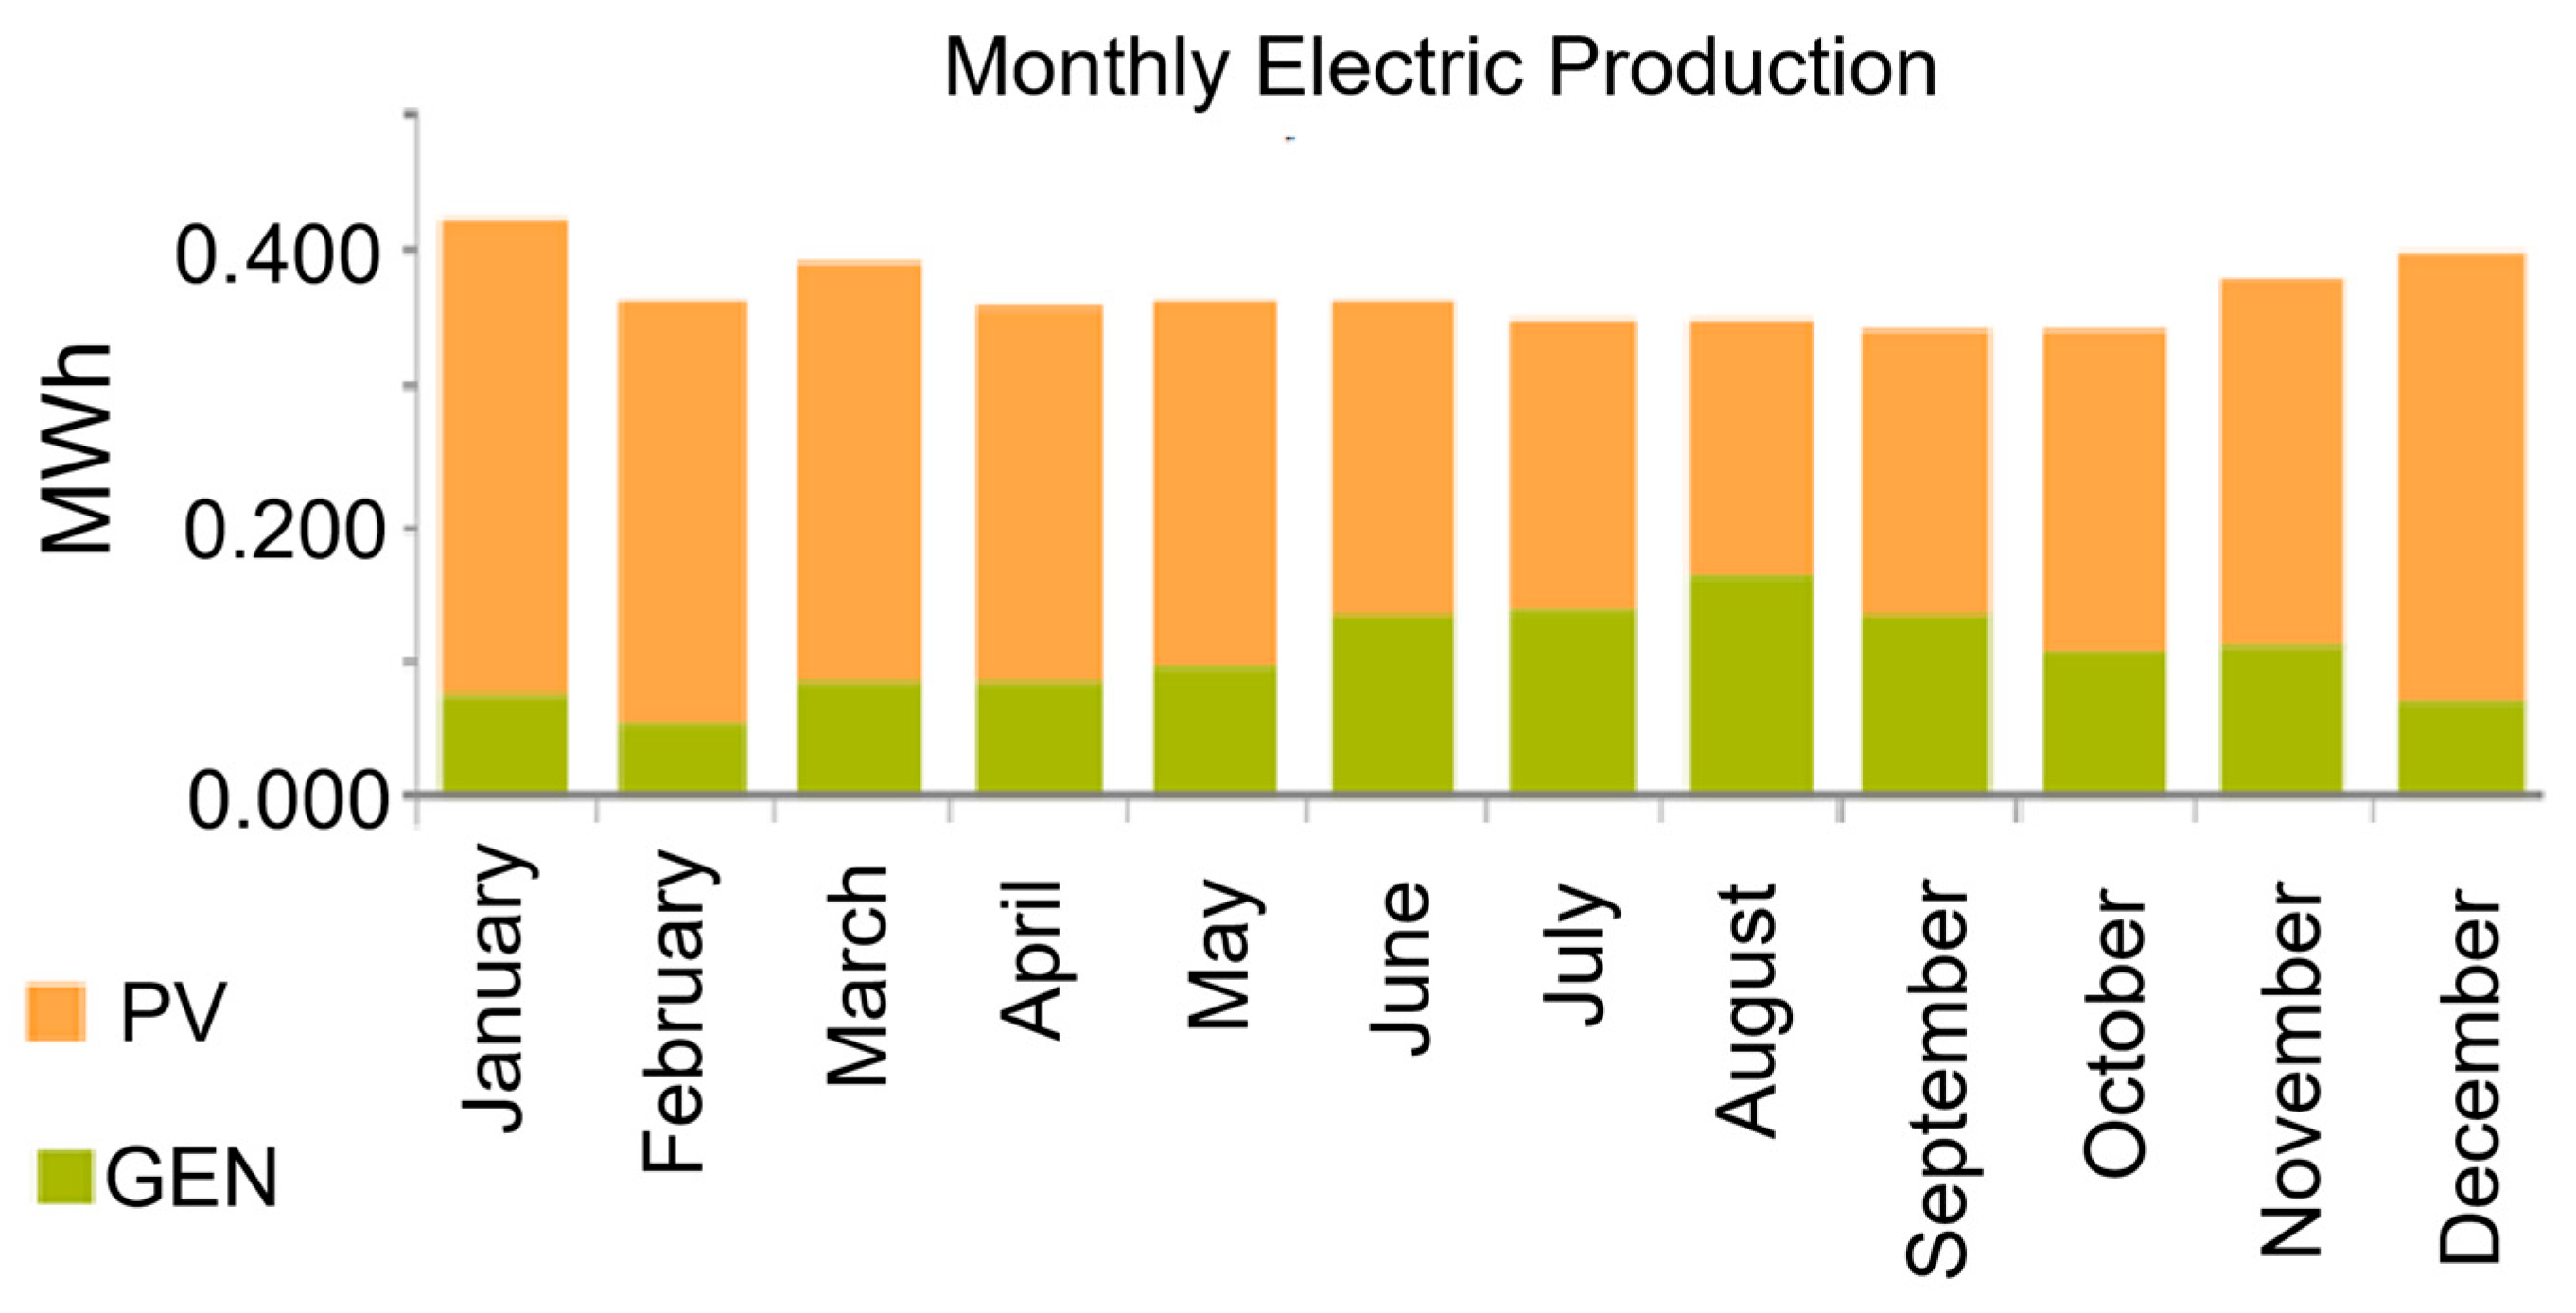
The high cost of the system for each city is due to the high cost of the battery and PV module compared with other components. The system’s electricity production is mainly generated by the PV module, as shown in
Figure 6. The diesel generator therefore acts as an alternative solution (preventive in case the PV does not meet the load) in electricity production, which means that the PV alone could meet the demand in each city according to the trend shown in
Figure 6.
3.1.2. Environmental Aspect
The environmental aspect here is based on the assessment of the proportions of waste from the use of the diesel generator, in particular CO
2 and other harmful gases, as shown in
Table 8. Although most of the electricity is generated by the photovoltaic module, the impact of the generator’s emissions on the environment should not be overlooked. Comparing the masses of pollutant emissions, we see an average emission of 1017.2 kg/year for CO
2, 6.5 kg/year for CO, 0.2 kg/year for UHC, 0.1 kg/year for PM, 2.4 kg/year of SO
2, and 6.0 kg/year of NO
X for all ten regions in the area.
Table 9 illustrates the total amount of pollutants considered per year, and we can see that the proportion of CO
2 from the generator’s fossil fuel (diesel) is higher than the others (CO, UHC, PM, SO
2, and NO
x), a finding also noted by [
33], due to the fact that carbon is the main component of fuel [
34].
Cameroon, like other countries in the world and in sub-Saharan Africa, is moving towards the energy transition, and data collected on the possibility of using cleaner fuels such as green hydrogen, for example, would be a welcome, environmentally responsible alternative in the fight against global warming and its effects on the environment.
3.2. Replacing Different Energy Sources with Hydrogen Generators
Hybrid PV/DG-BATT HRESs are systems that produce significant amounts of greenhouse gases. Environmental protection objectives aim for near-zero greenhouse gas production. The most suitable energy sources for meeting these criteria are renewable energy sources, in general, and hydrogen generators in particular.
Technologies for producing green hydrogen and constructing hydrogen-powered electric generators have improved considerably, and the cost of producing electricity in this way has fallen significantly over the years, to the point where hydrogen generators are now affordable for people in both developed and developing countries [
35]. In addition, 1.0 kg of hydrogen produces 2.5 to 3.0 times more energy than conventional fossil fuels [
35]. In the first part of this work, it was demonstrated that the PV/DG-BATT HRES hybrid system is the most suitable among the energy sources already in use in the study area. The aim of this work is to propose a system that is both economical and environmentally friendly. To this end, two substitutions of the energy sources used in the PV/DG-BATT HRES were made to obtain a PV/H
2GEN-BATT system and then an H
2GEN system (
Table 10). Technical and economic analyses were carried out for these two systems, including an assessment of the customs clearance price of equipment and hydrogen in this country. Customs duties were considered at 0%, 50%, and 100%.
3.2.1. Replacing the Diesel Generator with a Hydrogen Generator
Replacing the GEN with the H
2GEN in the PV/DG-BATT hybrid system resulted in the PV/H
2GEN-BATT system (
Figure 7a). Across the ten data collection sites, this system has an average NPC of 12,596.9 USD, 16,918.8 USD, and 21,233.4 USD (
Table 11) and an average COE of 0.4 USD, 0.2 USD, 0.2 USD, and 0.3 USD, with customs duties considered at 0%, 50%, and 100% of the equipment price, respectively (
Table 12). The fuel consumption of hydrogen generators was assessed in each city in the study area, and the average annual hydrogen consumption was 79.4 Kg/years for customs duties considered at 0%, 50%, and 100% of the equipment price (
Table 13).
3.2.2. Replacement of Diesel Generators and Photovoltaics with H2GEN
Replacing PV with H
2GEN in the PV/H
2GEN-BATT hybrid system led to the H
2GEN system (
Figure 7b). At the ten data collection sites, this system has an average NPC of 14,860.5 USD, 22,178.1 USD, and 29,717.7 USD (
Table 11) and an average COE of 0.2 USD, 0.3 USD, and 0.4 USD for customs duties considered at 0%, 50%, and 100% of the equipment price, respectively (
Table 12).
The fuel consumption of hydrogen generators was assessed in each city in the study area, and the average annual hydrogen consumption was 251.5, 251.5, and 251.5 kg/year for customs duties considered at 0%, 50%, and 100% of the equipment price, respectively (
Table 13).
Figure 7.
Systems obtained after substitution of GEN then PV, (a) PV/H2GEN-BATT, (b) H2GEN.
Figure 7.
Systems obtained after substitution of GEN then PV, (a) PV/H2GEN-BATT, (b) H2GEN.
4. Discussion
The aim of this paper was to determine the hybrid energy system best suited to addressing the energy problem in the study area, and then to make successive substitutions of different energy sources, starting with the most polluting, in order to assess the possibilities for transitioning the energy used in the area to green hydrogen.
4.1. Best HRES (PV-DG-Batt HRES) Configuration for the Study Area
The optimization shows that the PV/DG-Batt system is currently the most suitable energy solution for the area [
4,
5,
6,
7,
8,
9,
10,
11]. It is estimated to have an average Net Present Cost (NPC) of USD 19,267 and an average Cost Of Energy (COE) of USD 0.4/kWh [
5]. These values show little variation from one region to another. The photovoltaic module is the main source of electricity production (68.3% on average), while the diesel generator plays a complementary role (31.6% on average) in electricity production for the household. This suggests that PV alone could cover most of the energy demand, thereby reinforcing the renewable nature of the solution [
6]. Despite the backup role of diesel, polluting emissions are inevitable [
11]. Maximum values of 1080 kg/year of CO
2, 3.4 kg/year of CO, 0.3 kg/year of UHC, 0.04 kg/year of PM, 2.6 kg/year of SO
2, and 8.8 kg/year of NO
X were obtained for the ten regions in the study area. Replacing diesel with hydrogen is attractive, especially from an environmental perspective, as it significantly reduces the carbon footprint and preserves sustainable living conditions, thereby strengthening environmental protection worldwide, since hydrogen combustion produces only water [
18].
4.2. Successive Substitutions of Different Energy Sources by Hydrogen
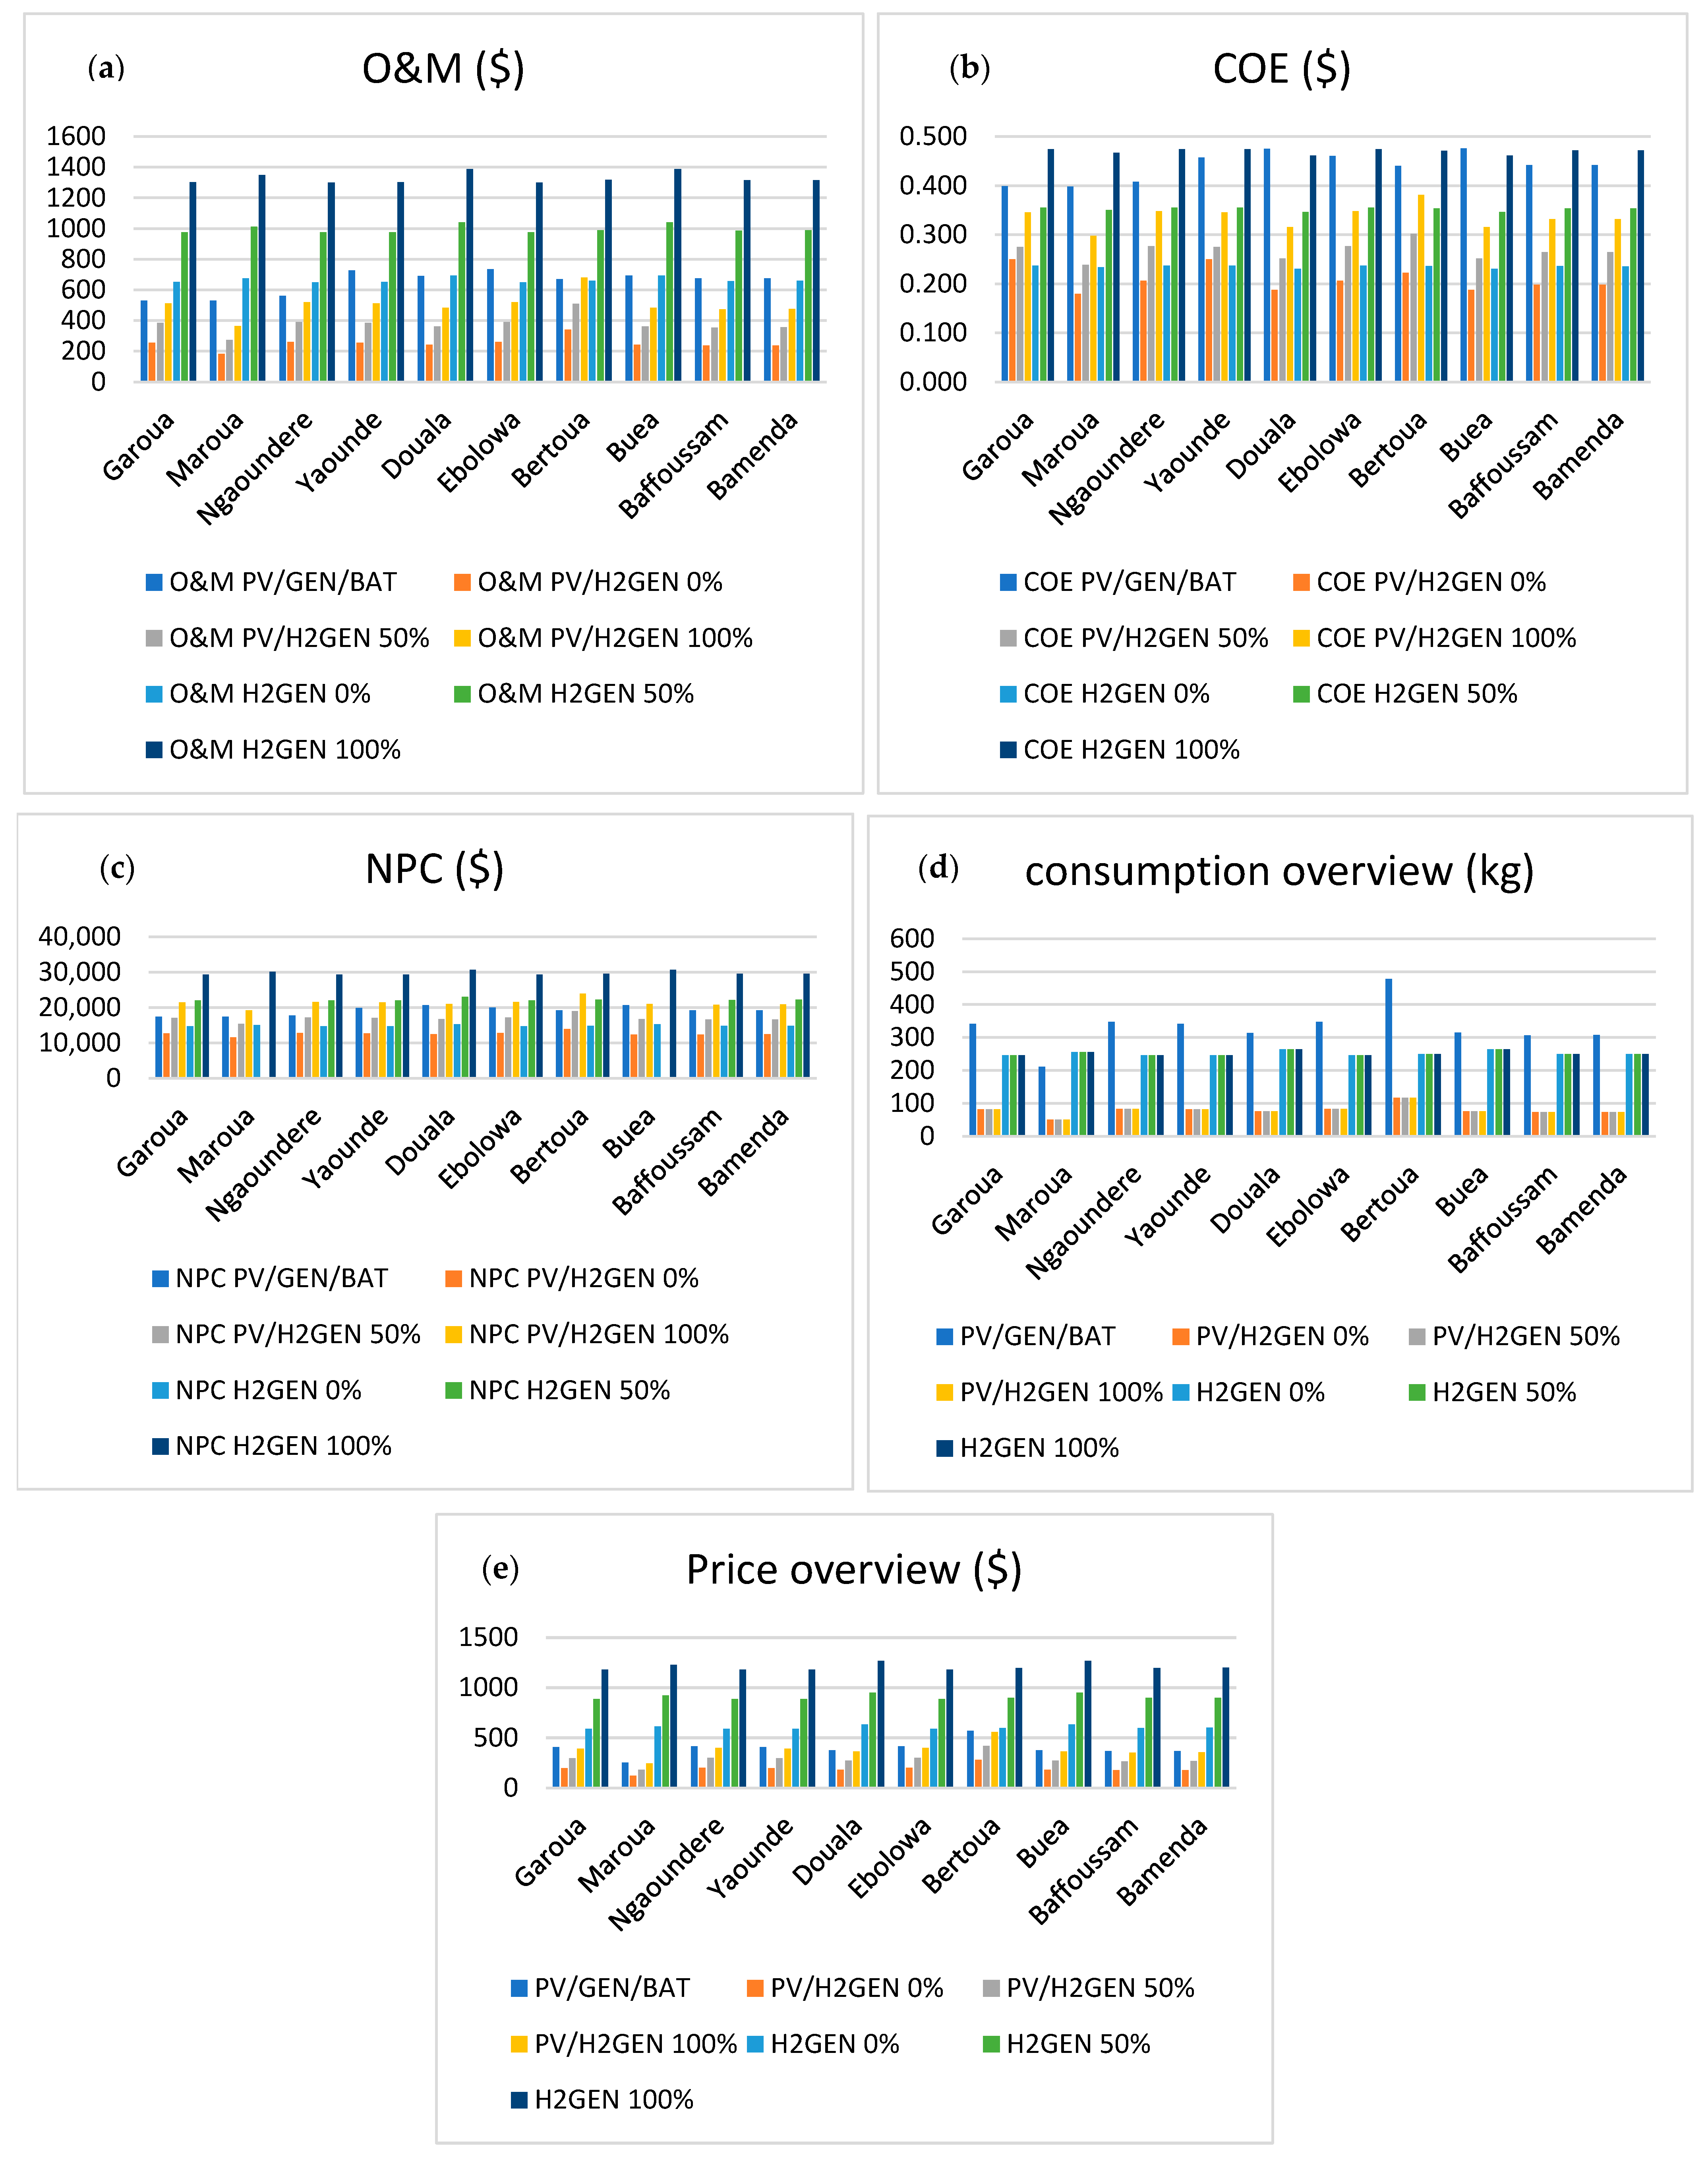
The most cost-effective system with the most favorable operating and maintenance (O&M) costs is the PV/H
2GEN system, while the most expensive system to maintain is the H
2GEN system with customs duties at 100% of the purchase price of the equipment. The PVH
2GEN system has lower O&M costs than the PV/DG-BATT system for customs duties ranging from 0% to 100% of the price of equipment and fuel (hydrogen). The H
2GEN system remains more favorable than the PV/DG-BATT system when customs duties are 0%. This is no longer the case above 50% (
Figure 8a). Similarly, the system with the most favorable COE is PV/H
2GEN with 0% customs duties, followed by the H
2GEN system with 0% customs duties. The PV/H
2GEN and H
2GEN systems all have lower COEs than the PV/DG-BATT system, except for H
2GEN with 100% customs duty (
Figure 8b).
The PV/DG-BATT hybrid system appears to be a very costly solution when looking at the NPC values (
Figure 8c). We can see that the PV/H
2GEN and H
2GEN systems with 0% customs duties remain the most favorable.
The annual mass consumption of hydrogen is lower than that of diesel (
Figure 8d,
Table 12) [
21]. Considering a purchase price of hydrogen at USD 2.4/kg, after tracing the trend curve, based on data aligned with China’s [
37,
38], we see that for the same energy demand, the costs generated by hydrogen are lower than those imposed by diesel, even when customs duties are set at 100% (
Figure 8e,
Table 12). The results of replacing fossil fuel generators with hydrogen generators are beneficial in terms of environmental protection and lead to a reduction in energy costs of around 2.1 times the cost of diesel and a reduction in mass of around 2.7 times the mass of diesel. The integration of hydrogen, particularly at high duty cycles (100%), significantly increases the Cost Of Energy, whether in a hybrid PV/H
2GEN-Batt system or a hydrogen-only system. This shows the benefit for this country of using favorable duty cycles to make the use of hydrogen cost-effective [
22].
Figure 8.
Results of the technical and economic analyses of the systems (a) O&M, (b) COE, (c) NPC, (d) Consumption overview, (e) Price overview.
Figure 8.
Results of the technical and economic analyses of the systems (a) O&M, (b) COE, (c) NPC, (d) Consumption overview, (e) Price overview.
4.3. Environmental Aspect
The life cycle analysis [
39,
40] enabled the assessment of greenhouse gas emissions in CO
2 equivalents in PV/DG-BATT, PV/H
2GEN-BATT, and H
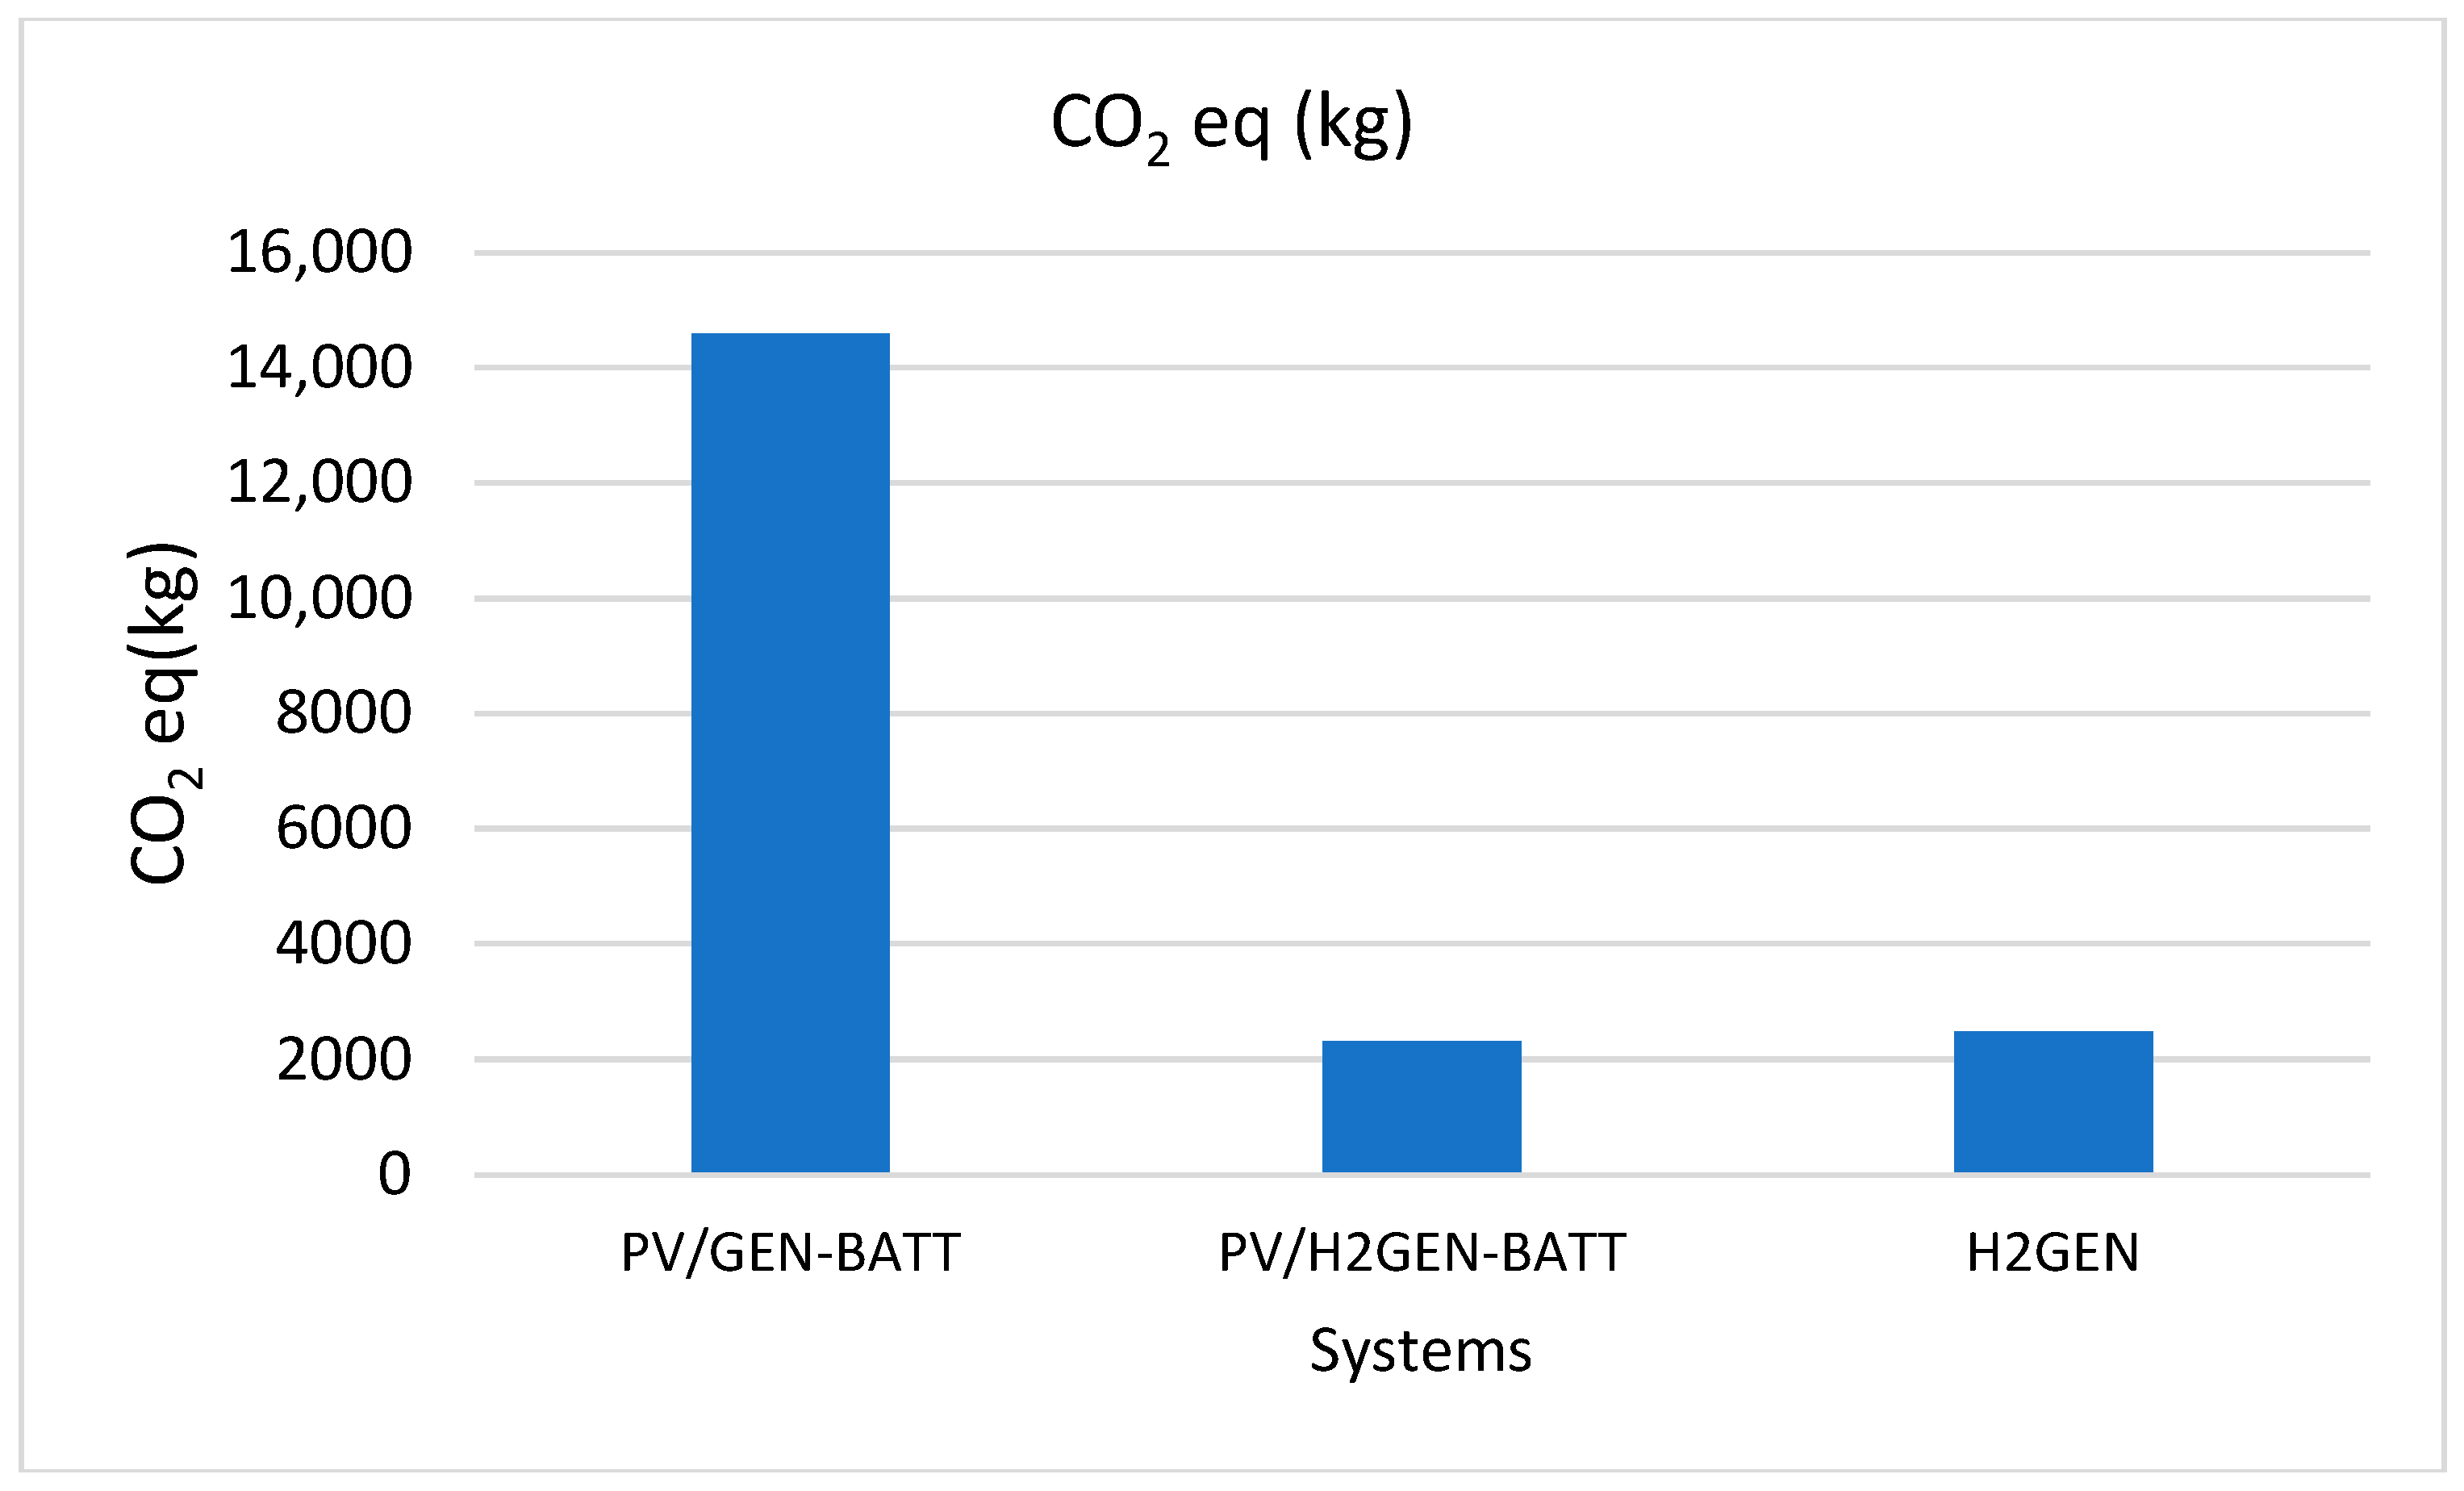
2GEN systems in the 10 regions. The results show that the PV/DG-BATT system (photovoltaic, conventional thermal generator, and batteries) emits a significantly high amount of CO
2 (14,585.3 kg), highlighting the dominant impact of the fossil fuel-powered thermal generator [
38]. In contrast, the PV/H
2GEN-BATT system (photovoltaic, hydrogen generator, and batteries) has a drastically reduced carbon footprint (2316.6 kg), demonstrating the environmental advantage of replacing a conventional generator with hydrogen technology, especially if the hydrogen is produced in a green manner [
38]. The H
2GEN system alone (hydrogen generator) has a slightly higher footprint than the PV/H
2GEN-BATT hybrid system (2492.1 kg), suggesting that integrating photovoltaics and battery storage can further optimize the overall carbon footprint, potentially by reducing the hydrogen generator’s dependence on hydrogen or by producing hydrogen more cleanly. In summary, conventional generators are the main contributors to CO
2 emissions, while the adoption of systems integrating photovoltaics and green hydrogen represents a major pathway for the significant decarbonization of energy production (
Figure 9 and
Table 14) [
38].
5. Conclusions
The aim of this paper was to determine the hybrid energy system best suited to addressing the energy problem in the study area, and then to make successive substitutions of different energy sources, starting with the most polluting, in order to assess the possibilities for transitioning the energy used in the area to green hydrogen. This study identified the PV/DG-BATTery hybrid system as the most suitable energy solution for the study area, with a Net Present Cost (NPC) of USD 19,267 and an average Cost Of Energy (COE) of USD 0.4. However, this initial configuration has a high proportion of CO2 emissions. The substitution analysis clearly demonstrated that replacing fossil fuel (diesel) generators with hydrogen (fuel cell) generators offers significant advantages. Not only does this contribute to better environmental protection, but it also generates a reduction in energy expenditure of around 2.1 times less than the annual cost of diesel and a reduction in fuel mass of around 2.7 times less than that of diesel. Despite the environmental and economic benefits, replacing PV and diesel generators is more advantageous than the P-Batt system when the hydrogen tax is low. The integration of H2GEN technology, especially at high customs duty rates, significantly increases the Cost Of Energy, whether in a hybrid PV/H2GEN system or a pure H2GEN system. It is therefore crucial that countries consider favorable customs duties in order to fully capitalize on the use of hydrogen and accelerate this essential energy transition for a more sustainable future.
Author Contributions
Conceptualization, P.N.N.; project administration, P.N.N.; supervision, T.C.V.M.M., A.M.P.N. and P.N.N.; writing—original draft, T.C.V.M.M., N.Y., J.L.M., A.M.P.N. and P.N.N.; writing—review and editing, T.C.V.M.M., N.Y., J.L.M., A.M.P.N. and P.N.N. All authors have read and agreed to the published version of the manuscript.
Funding
This research received no external funding.
Data Availability Statement
The original contributions presented in this study are included in the article. Further inquiries can be directed to the corresponding authors.
Acknowledgments
The authors would like to thank the editors, the three anonymous reviewers, Oboun Nyebe Paul William’s, Inspector General of Administrative Affairs, MINDUH, Yaounde, Cameroon; Ango Eyoman Rosine, Advanced Technician inS and Family Economics, MINDEF, Yaounde, Cameroon; Nongni Tsopmo Frankel; and Gounou Pokam Blaise Pascal, lecturer at the University of Ngaoundere. They also thank the late Nkoma Francois, Ngo Ngwem Beatrice, Nouck Jeannot, and Ngo Matip Julienne.
Conflicts of Interest
The authors declare no conflicts of interest.
References
- Drago, C.; Gatto, A. Policy, regulation effectiveness, and sustainability in the energy sector: A worldwide interval-based composite indicator. Energy Policy 2022, 167, 0301–4215. [Google Scholar] [CrossRef]
- Domra, K.J.; Djongyang, N.; Raïdandi, D.; Njandjock, N.P.; Dadjé, A. A review of geophysical methods for geothermal exploration. Renew. Sustain. Energy Rev. 2015, 44, 87–95. [Google Scholar] [CrossRef]
- Aretouyap, Z.; Njandjock, N.P.; Nouayou, R. A discussion of major geophysical methods used for geothermal exploration in Africa. Renew. Sustain. Energy Rev. 2016, 58, 775–781. [Google Scholar] [CrossRef]
- Finecomess, S.A.; Gebresenbet, G. Future Green Energy: A Global Analysis. Energies 2024, 17, 3039. [Google Scholar] [CrossRef]
- Fazelpour, F.; Soltani, N.; Rosen, M.A. Feasibility of satisfying electrical energy needs with hybrid systems for a medium size hotel on Kish Island, Iran. Energy 2014, 73, 856–865. [Google Scholar] [CrossRef]
- Lau, K.Y.; Yousof, M.F.M.; Anwari, M.L.; Yatimn, A.H.M. Performance analysis of hybrid photovoltaic/diesel energy system under Malaysian conditions. Energy 2010, 35, 3245–3255. [Google Scholar] [CrossRef]
- Adaramola, M.S.; Paul, S.S.; Oyewola, O.M. Assessment of decentralized hybrid PV solar-diesel power system for applications in Northern part of Nigeria. Energy Sustain. Dev. 2014, 19, 72–82. [Google Scholar] [CrossRef]
- Jenkins, P.; Sonar, A.C. Feasibility Analysis of an Islanded Microgrid in Tohatchi, New Mexico Using HOMER Pro. Energy Power Eng. 2020, 12, 357–374. [Google Scholar] [CrossRef]
- Vakili-Nezhaad, G.; Mishra, S.B.; Mousa, H.; Ziaiefar, H. Simulation and optimization of hybrid green energy systems for desalination purposes. Environ. Prog. Sustain. Energy 2021, 40, 13515. [Google Scholar] [CrossRef]
- Halabi, L.M.; Mekhilef, S.; Olatomiwa, L.; Hazelton, J. Performance analysis of hybrid PV/diesel/battery system using HOMER: A case study Sabah, Malaysia. Energy Convers. Manag. 2017, 144, 322–339. [Google Scholar] [CrossRef]
- Thirunavukkarasu, M.; Sawle, Y. A comparative study of the optimal sizing and management of off-grid solar/wind/diesel and battery energy systems for remote areas. Front. Energy Res. 2021, 9, 752043. [Google Scholar] [CrossRef]
- Ayan, O.; Turkay, B.E. Techno-Economic Comparative Analysis of Grid-Connected and Islanded Hybrid Renewable Energy Systems in 7 Climate Regions, Turkey. IEEE Access 2023, 11, 48797–48825. [Google Scholar] [CrossRef]
- Li, C.; Zhang, L.; Qiu, F.; Fu, R. Optimization and enviro-economic assessment of hybrid sustainable energy systems: The case study of a photovoltaic/biogas/diesel/battery system in Xuzhou, China. Energy Strategy Rev. 2022, 41, 100852. [Google Scholar] [CrossRef]
- Amoussou, I.; Paddy, E.Y.; Agajie, T.F.; Ibrahim, F.S.; Agajie, E.F.; Nsanyuy, W.B.; Bajaj, M.; Mohammadi, S.A.D. Enhancing residential energy access with optimized stand-alone hybrid solar-diesel-battery systems in Buea, Cameroon. Sci. Rep. 2024, 14, 15543. [Google Scholar] [CrossRef]
- Turkay, B.E.; Telli, A.Y. Economic analysis of standalone and grid connected hybrid energy systems. Renew. Energy 2011, 36, 1931–1943. [Google Scholar] [CrossRef]
- Moghaddas-Tafreshi, S.M.; Jafari, M.; Mohseni, S.; Kelly, S. Optimal operation of an energy hub considering the uncertainty associated with the power consumption of plug-in hybrid electric vehicles using information gap decision theory. Int. J. Electr. Power Energy Syst. 2019, 112, 92–108. [Google Scholar] [CrossRef]
- Mansour-Saatloo, A.; Agabalaye-Rahvar, M.; Mirzaei, M.A.; Mohammadi-Ivatloo, M.B.; Abapour, M.; Zare, K. Robust scheduling of hydrogen based smart micro energy hub with integrated demand response. J. Clean. Prod. 2020, 267, 122041. [Google Scholar] [CrossRef]
- Yan, C.; Zou, Y.; Wu, Z.; Maleki, A. Effect of various design configurations and operating conditions for optimization of a wind/solar/hydrogen/fuel cell hybrid microgrid system by a bio-inspired algorithm. Int. J. Hydrogen Energy 2024, 60, 378–391. [Google Scholar] [CrossRef]
- Lambert, H.; Roche, R.; Jemeï, S.; Ortega, P.; Hissel, D. Combined Cooling and Power Management Strategy for a Standalone House Using Hydrogen and Solar Energy. Hydrogen 2021, 2, 207–224. [Google Scholar] [CrossRef]
- Gharibi, R.; Khalili, R.; Vahidi, B.; Foroughi, A.N.; Dashti, R.; Marzband, M. Enhancing energy hub performance: A comprehensive model for efficient integration of hydrogen energy and renewable sources with advanced uncertainty management strategies. J. Energy Storage 2025, 107, 114948. [Google Scholar] [CrossRef]
- Ringel, M.; Stöckigt, G.; Shamon, H.; Vögele, S. Green hydrogen cooperation between Egypt and Europe: The perspective of locals in Suez and Port Said. Int. J. Hydrogen Energy 2024, 79, 1501–1510. [Google Scholar] [CrossRef]
- Bahou, S. Techno-economic assessment of a hydrogen refueling station powered by an on-grid photovoltaic solar system: A case study in Morocco. Int. J. Hydrogen Energy 2023, 48, 23363–23372. [Google Scholar] [CrossRef]
- Amrani, S.E.; Alami, M.A.; Touili, S.; Dekhissi, H. A multi-scenario site suitability analysis to assess the installation of large scale photovoltaic-hydrogen production units. Case study: Eastern Morocco. Energy Convers. Manag. 2023, 295, 117615. [Google Scholar] [CrossRef]
- Okundamiya, M.S. Size optimization of a hybrid photovoltaic/fuel cell grid connected power system including hydrogen storage. Int. J. Hydrogen Energy 2021, 46, 30539–30546. [Google Scholar] [CrossRef]
- El Manaa, B.; Okonkwo, P.C.; Farhani, S.; Belgacem, B.I.; Zghaibeh, M.; Mansir, I.B.; Faouzi, B. Techno-economic analysis of photovoltaic-hydrogen refueling station case study: A transport company Tunis-Tunisia. Int. J. Hydrogen Energy 2022, 47, 24523–24532. [Google Scholar]
- Gougui, A.; Djafour, A.; Danoune, M.B.; Khelfaoui, N. Field experience study and evaluation for hydrogen production through a photovoltaic system in Ouargla region, Algeria. Int. J. Hydrogen Energy 2020, 45, 2593–2606. [Google Scholar] [CrossRef]
- Results of the 5th Cameroon Household Survey (ECAM5): Press Release–National Institute of Statistics of Cameroon. Available online: https://ins-cameroun.cm/document/resultats-de-la-5eme-enquete-camerounaise-aupres-des-menages-ecam5-communique-de-presse/ (accessed on 10 June 2025).
- Djongyang, N.; Tchinda, R. An investigation into thermal comfort and residential thermal environment in an intertropical sub-Saharan Africa region: Field study report during the Harmattan season in Cameroon. Energy Convers. Manag. 2010, 51, 1391–1397. [Google Scholar] [CrossRef]
- Fazelpour, F.; Soltani, N.; Rosen, M.A. An assessment of wind energy potential as a power generation source for the city of Ardabil, Iran. In Proceedings of the Colloque Francophone sur l’Energie, Environnement, Economie et Thermodynamique, Paris, France, 23–25 April 2014. [Google Scholar]
- Hopuare, M.; Lucas-Svay, L.; Ortega, P.; Lucas, F.; Laurent, V. Assessing solar resource and photovoltaic production in tahiti from ground-based measurements. In Proceedings of the 2019 4th International Conference on Sustainable and Renewable Energy Engineering (ICSREE 2019), Seoul, Republic of Korea, 29–31 May 2019; Volume 107, p. 01003. [Google Scholar]
- Fazelpour, F.; Soltani, N.; Rosen, M.A. Economic analysis of standalone hybrid energy systems for application in Tehran, Iran. Int. J. Hydrogen Energy 2016, 4, 7732–7743. [Google Scholar] [CrossRef]
- Franco, A. Green Hydrogen and the Energy Transition: Hopes, Challenges, and Realistic Opportunities. Hydrogen 2025, 6, 28. [Google Scholar] [CrossRef]
- Sultana, D.; Hoover, S. Analysis of gasoline-related pollutant exposures and risks in California between 1996 and 2014. J. Expo. Sci. Environ. Epidemiol. 2024, 34, 518–528. [Google Scholar] [CrossRef]
- Giedraityte, A.; Rimkevicius, S.; Marciukaitis, M.; Radziukynas, V.; Bakas, R. Hybrid Renewable Energy Systems—A Review of Optimization Approaches and Future Challenges. Appl. Sci. 2025, 15, 1744. [Google Scholar] [CrossRef]
- Adeli, K.; Nachtane, M.; Faik, A.; Rachid, A.; Tarfaoui, M.; Saifaoui, D. A deep learning enhanced framework for sustainable hydrogen production from solar and wind energy in the Moroccan Sahara: Coastal regions focus. Energy Convers. Manag. 2024, 302, 118084. [Google Scholar] [CrossRef]
- Shin, H.K.; Ha, S.K. A Review on the Cost Analysis of Hydrogen Gas Storage Tanks for Fuel Cell Vehicles. Energies 2023, 16, 5233. [Google Scholar] [CrossRef]
- Wang, X.; Fan, L.W.; Zhang, H.; Zhou, P. Cost trajectory of hydrogen fuel cell technology in China. iScience 2025, 28, 112359. [Google Scholar] [CrossRef]
- Le Coût de L’hydrogène vert Produit en Afrique Pourrait Chuter Entre 1,8 et 2,6 $/kg dès 2030 (rapport). Available online: https://www.agenceecofin.com/energies/1901-104617-le-cout-de-l-hydrogene-vert-produit-en-afrique-pourrait-chuter-a-entre-1-8-et-2-6/kg-des-2030-rapport#:~:text=Le%20co%C3%BBt%20de%20l’hydrog%C3%A8ne,a%20better%20experience%20of%20Jumi (accessed on 13 August 2025).
- Green Hydrogen Prices Will Remain Stubbornly High for Decades. Available online: https://hydrogen-central.com/green-hydrogen-prices-will-remain-stubbornly-high-for-decades/#google_vignette (accessed on 13 August 2025).
- Lubecki, A.; Szczurowski, J.; Zarebska, K. A comparative environmental life cycle assessment study of hydrogen fuel, electricity and diesel fuel for public buses. Appl. Energy 2023, 350, 121766. [Google Scholar] [CrossRef]
Figure 2.
Illustrative organization chart of the method.
Figure 2.
Illustrative organization chart of the method.
Figure 3.
System configuration.
Figure 3.
System configuration.
Figure 4.
Cost summary of Net Present Cost by components (Homer Pro software).
Figure 4.
Cost summary of Net Present Cost by components (Homer Pro software).
Figure 5.
Cost summary of Net Present Cost by cost type (Homer Pro software).
Figure 5.
Cost summary of Net Present Cost by cost type (Homer Pro software).
Figure 6.
Electrical production via the PV and the DG (Homer Pro software).
Figure 6.
Electrical production via the PV and the DG (Homer Pro software).
Figure 9.
Results of environmental analyses of the systems.
Figure 9.
Results of environmental analyses of the systems.
Table 1.
Literature review on PV/DG-BATT-HRES.
Table 1.
Literature review on PV/DG-BATT-HRES.
| N° | Authors | Location | Grid Type |
|---|
| 1 | Lau et al., 2010 [6] | Malaysia | / |
| 2 | Adaramola et al., 2014 [7] | North of Nigeria | / |
| 3 | Jenkins et al., 2020 [8] | USA | / |
| 4 | Vakili-Nezhaad G et al., 2021 [9] | Desalination plant, Oman | Off Grid |
| 5 | Halabi, L. M. et al., (2017) [10] | Malaysia | / |
| 6 | Thirunavukkarasu and Sawle, 2021 [11] | India | / |
| 7 | Ayan and Turkay, 2023 [12] | Turkey | / |
| 8 | Li et al., 2022 [13] | China | Off Grid |
| 9 | Amoussou et al., 2024 [14] | Cameroon | / |
Table 2.
Literature review on HRESs with hydrogen.
Table 2.
Literature review on HRESs with hydrogen.
| N° | Authors | Location | Grid Type |
|---|
| 1 | Fazelpour et al., 2014a [5] | Teheran (Iran) | Off Grid |
| 2 | Turkay and Telli, (2011) [15] | Turkey | / |
| 3 | Moghaddas et al., 2019 [16] | Iran | / |
| 4 | Mansour et al., 2020 [17] | / | / |
| 5 | Yan et al., 2024 [18] | / | / |
| 6 | Lambert et al., 2021 [19] | Pakistan | On and Off Grid |
| 7 | Gharibi et al., 2025 [20] | / | / |
Table 3.
Literature review on HRESs using hydrogen in Africa.
Table 3.
Literature review on HRESs using hydrogen in Africa.
| N° | Authors | Location | Grid Type |
|---|
| 1 | Ringel et al., 2024 [21] | Egypt | / |
| 2 | Bahou, 2023 [22] | Moroco | |
| 3 | Amrani et al., 2023 [23] | Moroco | Off Grid |
| 4 | Okundamiya, 2021 [24] | Nigeria | |
| 5 | El Manaa et al., 2022 [25] | Tunisia | / |
| 6 | Gougui et al., 2020 [26] | Ghana | |
Table 4.
Power demand assessment of households in the study area.
Table 4.
Power demand assessment of households in the study area.
| Appliances | Number | Power (W) | Runtime | Energy Consumption (Wh) | Energy Consumption (kWh) |
|---|
| Freezer | 1 | 170.0 | 10.0 | 1700.0 | 1.7 |
| TV | 1 | 56.0 | 12.0 | 672.0 | 0.7 |
| Flat iron | 1 | 30.0 | 1.0 | 30.0 | 0.1 |
| Wi-Fi Box | 1 | 5.0 | 3.0 | 15.0 | 0.1 |
| Iron | 1 | 1000.0 | 1.0 | 1000.0 | 1.0 |
| 1 | 2200.0 | 1.0 | 2200.0 | 2.2 |
| Computer | 1 | 130.0 | 4.0 | 520.0 | 0.5 |
| 1 | 65.0 | 4.0 | 260.0 | 0.3 |
| Blender | 1 | 350.0 | 0.1 | 28.0 | 0.1 |
| 1 | 450.0 | 0.1 | 36.0 | 0.1 |
| LED Bulb | 10 × 15 | 150.0 | 5.0 | 750.0 | 0.8 |
| 7 × 7 | 49.0 | 5.0 | 245.0 | 0.2 |
| Telephone | 1 | 33.0 | 3.0 | 99.0 | 0.1 |
| 1 | 15.8 | 3.0 | 47.5 | 0.1 |
| 1 | 33.0 | 3.0 | 99.0 | 0.1 |
| 1 | 6.8 | 3.0 | 20.4 | 0.1 |
| | | | | Total | 7.7 |
Table 5.
Geographical location of the study areas.
Table 5.
Geographical location of the study areas.
| Location | Resources |
|---|
| | | Longitude E | Latitude N | Solar | Wind | Temperature |
| Greater South | Yaounde | 3°51.7’ | 11°31.2’ | 4.67 | 2.07 | 22.97 |
| Ebolowa | 2°55.6’ | 11°9.4’ | 4.64 | 1.76 | 22.83 |
| Douala | 4°3.1’ | 9°46.1’ | 4.29 | 2.71 | 24.93 |
| Greater West | Buea | 4°9.4’ | 9°15.8’ | 4.29 | 3.12 | 25.10 |
| Bamenda | 5°57.8’ | 10°9.5’ | 4.97 | 2.54 | 20.72 |
| Bafoussam | 5°28.9’ | 10°25.6’ | 4.97 | 2.45 | 21.69 |
| Greater East | Bertoua | 4°34.8’ | 13°40.6’ | 5.02 | 2.60 | 23.53 |
| Greater North | Ngaoundere | 7°20.3’ | 13°34.0’ | 5.56 | 3.82 | 22.14 |
| Maroua | 10°35.6’ | 14°19.3’ | 5.71 | 5.09 | 27.62 |
| Garoua | 9°19.4’ | 13°23.6’ | 5.75 | 3.85 | 27.71 |
Table 6.
Input data in Homer for the PV/DG-Batt HRES system.
Table 6.
Input data in Homer for the PV/DG-Batt HRES system.
| Components | Model/Size | Lifetime | Capital Cost (USD/kW) | Replacement (USD/kW) | O&M | Quantity |
|---|
| Diesel Generator | Auto size Genset | 15,000 h | 1000 | 900 | 0.02 USD/hr | 1 |
| PV Modules | 0, 1, 1.5, 2, 2.5, 3, 3.5, 4, 4.5, 5.5, 6, | 20 years | 3975 | 3378.7 | 0.00 USD/KW/year | - |
| 6.5, 7, 7.5, 8, 8.5, 9, 9.5, 10 |
| Battery | Generic 1 KWh Li-ion (6 V, 167 h) | 10 years | 300 | 300 | 10.0 USD/year | 0, 1, 2, 4, 6, 8, 10 |
| Converter | Generic large, free conv | 15 years | 700 | 550 | 100.0 USD/year | 0, 5, 10, 15, 20, 25 |
Table 7.
Results of PV-DG-Batt based HRES.
Table 7.
Results of PV-DG-Batt based HRES.
| Area | Town and System | Capital Cost (USD) | Replacement (USD) | O&M (USD) | Fuel (USD) | Salvage Cost (USD) | Total (USD) |
|---|
| Greater South | Yaounde
PV/DG-BATT-Based HRES | 10,500.0 | 2499.1 | 1877.9 | 5247.5 | 242.7 | 20,367.2 |
| | Douala
PV/DG-BATT-Based HRES | 11,750.0 | 2470.3 | 1898.4 | 4840.6 | 272.6 | 21,232.0 |
| | Ebolowa
PV/DG-BATT-Based HRES | 10,500.0 | 2508.1 | 1885.9 | 5334.7 | 232.2 | 20,461.0 |
| Greater West | Buea
PV/DG-BATT-Based HRES | 11,750.0 | 2471.9 | 1898.4 | 4845.5 | 270.5 | 21,236.4 |
| | Bafoussam
PV/DG-BATT-Based HRES | 10,500.0 | 2464.9 | 1817.7 | 4714.6 | 276.4 | 19,773.7 |
| | Bamenda
PV/DG-BATT-Based HRES | 10,500.0 | 2464.4 | 1820.1 | 4731.6 | 277.5 | 19,793.8 |
| Greater East | Bertoua
PV/DG-BATT-Based HRES | 12,262.5 | 5618.5 | 7978.6 | 9638.3 | 1531.9 | 37,029.9 |
| Greater North | Ngaoundere
PV/DG-BATT-Based HRES | 10,500.0 | 2508.1 | 1885.9 | 5334.7 | 232.2 | 20,461.0 |
| | Maroua
PV/DG-BATT-Based HRES | 10,500.0 | 2141.2 | 1655.1 | 3250.6 | 209.8 | 17,756.8 |
| | Garoua
PV/DG-BATT-Based HRES | 10,500.0 | 2499.1 | 1877.9 | 5427.5 | 242.7 | 20,547.2 |
Table 8.
Breakdown of NPC for PV-Diesel Bat.
Table 8.
Breakdown of NPC for PV-Diesel Bat.
| Area | Town and System | CAPITAL (USD) | Replacement (USD) | O&M (USD) | Fuel (USD) | Salvage Cost (USD) | Total (USD) |
|---|
| Greater South | Yaounde
PV/DG-BATT-Based HRES | 10,500.0 | 2499.1 | 1877.9 | 5247.5 | 106.1 | 20,230.5 |
| | Douala
PV/DG-BATT-Based HRES | 11,750.0 | 2470.3 | 1898.4 | 4840.6 | 272.6 | 21,232.1 |
| | Ebolowa
PV/DG-BATT-Based HRES | 10,500.0 | 2508.1 | 1885.9 | 5334.7 | 232.2 | 20,461.0 |
| Greater West | Buea
PV/DG-BATT-Based HRES | 11,750.0 | 2471.9 | 1898.4 | 4845.5 | 270.5 | 21,236.4 |
| | Bafoussam
PV/DG-BATT-Based HRES | 10,500.0 | 2464.9 | 1817.7 | 4714.6 | 276.4 | 19,773.7 |
| | Bamenda
PV/DG-BATT-Based HRES | 10,500.0 | 2464.4 | 1820.1 | 4731.6 | 277.5 | 19,793.8 |
| Greater East | Bertoua
PV/DG-BATT-Based HRES | 12,262.5 | 5618.5 | 7978.6 | 9638.3 | 1531.9 | 37,029.9 |
| Greater North | Ngaoundere
PV/DG-BATT-Based HRES | 10,500.0 | 2508.1 | 1885.9 | 5334.7 | 232.2 | 20,461.0 |
| | Maroua
PV/DG-BATT-Based HRES | 10,500.0 | 2141.2 | 1655.1 | 3250.6 | 209.8 | 17,756.8 |
| | Garoua
PV/DG-BATT-Based HRES | 10,500.0 | 2499.1 | 1877.9 | 5427.5 | 242.7 | 20,547.2 |
Table 9.
Environmental emissions.
Table 9.
Environmental emissions.
| Environmental Emissions |
|---|
| Area | Towns | CO2 (Kg/Year) | CO (Kg/Year) | UHC (Kg/Year) | PM (Kg/Year) | SO2 (Kg/Year) | NOX (Kg/Year) |
|---|
| Greater South | Yaounde | 1063.0 | 6.7 | 0.29 | 0.04 | 2.6 | 6.3 |
| Douala | 980.0 | 6.1 | 0.27 | 0.03 | 2.4 | 5.8 |
| Ebolowa | 1080.0 | 6.8 | 0.29 | 0.04 | 2.6 | 6.4 |
| Greater West | Buea | 845.0 | 5.3 | 0.23 | 0.03 | 2.1 | 5.0 |
| Bamenda | 958.0 | 6.0 | 0.26 | 0.03 | 2.3 | 5.7 |
| Baffoussam | 955.0 | 6.0 | 0.26 | 0.03 | 2.3 | 5.6 |
| Greater East | Bertoua | 1490.0 | 9.3 | 0.41 | 0.05 | 3.6 | 8.8 |
| Greater North | Ngaoundere | 1080.0 | 6.8 | 0.29 | 0.04 | 2.6 | 6.4 |
| Maroua | 658.0 | 4.1 | 0.18 | 0.02 | 1.6 | 3.9 |
| Garoua | 1063.0 | 6.7 | 0.29 | 0.04 | 2.6 | 6.3 |
Table 10.
Input data.
| Components | Model/Size | Lifetime | Capital Cost (USD) | Replacement | O&M (USD) | Quantity |
|---|
| H2 Generator | 2 kw | 25,000 h | 1500.0 USD/kw [36] | 1200.0 USD/kW | 0.02 | 1 |
| PV modules | 0, 1, 1.5, 2, 2.5, 3, 3.5, 4, 4.5, 5.5, 6, 6.5, 7, 7.5, 8, 8.5, 9, 9.5, 10 | 20 years | 3975.0 USD/kW | 3378.7 USD/kW | 0.00 | - |
| Battery | Generic 1 KWh Li-ion (6 V, 167 h) | 10 years | 300.0 USD/ | 300.0 USD/kW | 10.00 | 0, 1, 2, 4, 6, 8, 10 |
| Converter | Generic large, free conv | 15 years | 700.0 USD/ | 550.0 USD/kW | 100.00 | 0, 5, 10, 15, 20, 25 |
| Hydrogen tank | Generic 1, 2, 4, 6 kg | 25 years | 36.6 USD//kg (H2) | 18.3 USD/kg (H2) | 10.00 | - |
| Electrolyzer | 10, 15, 20 KW | 15 years | 2000.0 USD | 1700.0 USD/kW | 10.00 | - |
Table 11.
NPC in USD for customs duties of 0%, 50% and 100%.
Table 11.
NPC in USD for customs duties of 0%, 50% and 100%.
| | PV/H2GEN-BATT
0% | PV/H2GEN-BATT
50% | PV/H2GEN-BATT
100% | H2GEN
0% | H2GEN
50% | H2GEN
100% |
|---|
| Garoua | 12,683.4 | 17,037.6 | 21,391.8 | 14,661.2 | 21,991.9 | 29,322.5 |
| Maroua | 11,558.5 | 15,350.3 | 19,142.1 | 15,011.2 | 2.2516.8 | 30,022.4 |
| Ngaoundere | 12,735.4 | 17,115.6 | 21,495.8 | 14,657.9 | 21,985.4 | 29,313.8 |
| Yaounde | 12,683.4 | 17,037.6 | 21,391.8 | 14,661.2 | 21,991.9 | 29,322.5 |
| Douala | 12,457.5 | 16,698.7 | 20,940.0 | 15,304.6 | 22,956.9 | 30,609.3 |
| Ebolowa | 12,735.4 | 17,115.6 | 21,495.8 | 14,657.9 | 21,985.4 | 29,313.8 |
| Bertoua | 13,943.3 | 18,927.4 | 23,911.6 | 14,783.0 | 22,174.5 | 29,566.0 |
| Buea | 12,386.4 | 16,700.6 | 20,942.5 | 15,309.0 | 2.2963.5 | 30,618.0 |
| Baffoussam | 12,386.4 | 16,592.1 | 20,797.8 | 14,772.1 | 22,158.2 | 29,544.2 |
| Bamenda | 12,399.9 | 16,612.4 | 20,824.8 | 14,787.3 | 22,181.0 | 29,544.2 |
| Average | 12,596.9 | 16,918.8 | 21,233.4 | 14,860.5 | 22,178.1 | 29,717.7 |
| Minimum | 11,558.5 | 15,350.3 | 19,142.1 | 14,657.9 | 21,985.4 | 29,313.8 |
| Maximum | 13,943.3 | 18,927.4 | 23,911.6 | 15,309.0 | 22,956.9 | 30,618.0 |
Table 12.
COE in USD for customs duties of 0%, 50% and 100%.
Table 12.
COE in USD for customs duties of 0%, 50% and 100%.
| | PV/H2GEN-BATT
0% | PV/H2GEN-BATT
50% | PV/H2GEN-BATT
100% | H2GEN
0% | H2GEN
50% | H2GEN
100% |
|---|
| Garoua | 0.2 | 0.2 | 0.3 | 0.2 | 0.3 | 0.5 |
| Maroua | 0.1 | 0.2 | 0.2 | 0.2 | 0.3 | 0.4 |
| Ngaoundere | 0.2 | 0.2 | 0.3 | 0.2 | 0.3 | 0.5 |
| Yaounde | 0.2 | 0.2 | 0.3 | 0.2 | 0.3 | 0.4 |
| Douala | 0.1 | 0.2 | 0.3 | 0.2 | 0.3 | 0.4 |
| Ebolowa | 0.2 | 0.2 | 0.3 | 0.2 | 0.3 | 0.4 |
| Bertoua | 0.2 | 0.3 | 0.4 | 0.2 | 0.3 | 0.5 |
| Buéa | 0.1 | 0.2 | 0.3 | 0.2 | 0.3 | 0.4 |
| Baffoussam | 0.1 | 0.2 | 0.3 | 0.2 | 0.3 | 0.5 |
| Bamenda | 0.1 | 0.2 | 0.3 | 0.2 | 0.3 | 0.5 |
| Average | 0.2 | 0.2 | 0.3 | 0.2 | 0.3 | 0.5 |
| Minimum | 0.1 | 0.2 | 0.2 | 0.2 | 0.3 | 0.4 |
| Maximum | 0.2 | 0.3 | 0.4 | 0.2 | 0.3 | 0.5 |
Table 13.
Hydrogen (H2) consumption in kg/year for customs duties of 0%, 50% and 100%.
Table 13.
Hydrogen (H2) consumption in kg/year for customs duties of 0%, 50% and 100%.
| | PV/H2GEN-BATT
0% | PV/H2GEN-BATT
50% | PV/H2GEN-BATT
100% | H2GEN
0% | H2GEN
50% | H2GEN
100% |
|---|
| Garoua | 81.7 | 81.7 | 81.7 | 246.0 | 246.0 | 246.0 |
| Maroua | 50.6 | 50.6 | 50.6 | 255.6 | 255.6 | 255.6 |
| Ngaoundere | 83.1 | 83.1 | 83.1 | 245.8 | 245.8 | 245.8 |
| Yaounde | 81.7 | 81.6 | 81.7 | 246.0 | 246.0 | 246.0 |
| Douala | 75.4 | 75.4 | 75.4 | 263.7 | 263.7 | 263.7 |
| Ebolowa | 83.1 | 83.1 | 83.1 | 245.8 | 245.8 | 245.8 |
| Bertoua | 116.4 | 116.4 | 116.4 | 249.3 | 249.3 | 249.3 |
| Buéa | 75.4 | 75.4 | 75.4 | 263.8 | 263.8 | 263.8 |
| Baffoussam | 73.4 | 73.5 | 73.5 | 249.1 | 249.0 | 249.0 |
| Bamenda | 73.8 | 73.8 | 73.8 | 249.5 | 249.4 | 249.4 |
| Average | 79.4 | 79.4 | 79.5 | 251.5 | 251.5 | 251.5 |
| Minimum | 50.6 | 50.6 | 50.6 | 245.8 | 245.8 | 245.8 |
| Maximum | 116.4 | 116.4 | 116.4 | 263.8 | 263.8 | 263.8 |
Table 14.
CO2 equivalents of the systems.
Table 14.
CO2 equivalents of the systems.
| Systems | CO2 EQ (kg/Year) |
|---|
| PV/GEN-BATT | 14,585.4 |
| PV/H2GEN-BATT | 2316.6 |
| H2GEN | 2492.1 |
| Disclaimer/Publisher’s Note: The statements, opinions and data contained in all publications are solely those of the individual author(s) and contributor(s) and not of MDPI and/or the editor(s). MDPI and/or the editor(s) disclaim responsibility for any injury to people or property resulting from any ideas, methods, instructions or products referred to in the content. |
© 2025 by the authors. Licensee MDPI, Basel, Switzerland. This article is an open access article distributed under the terms and conditions of the Creative Commons Attribution (CC BY) license (https://creativecommons.org/licenses/by/4.0/).
