Abstract
Injection strategies play a crucial role in determining hydrogen engine performance. The diversity of these strategies and the limited number of comparative studies highlight the need for further investigation. This study focuses on the analysis, parameter selection, and comparison of single early and late direct injection, single injection with ignition occurring during injection (the so-called jet-guided operation), and dual injection in a hydrogen spark-ignition engine. The applicability and effectiveness of these injection strategies are assessed using contour maps, with ignition timing and start of injection as coordinates representing equal levels of key engine parameters. Based on this approach, injection and ignition settings are selected for a range of engine operating modes. Simulations of engine performance under different load conditions are carried out using the selected parameters for each strategy. The results indicate that the highest indicated thermal efficiencies are achieved with single late injection, while the lowest occur with dual injection. At the same time, both dual injection and jet-guided operation provide advantages in terms of knock suppression, peak pressure reduction, and reduced nitrogen oxide emissions.
1. Introduction
The use of hydrogen is one of the most effective approaches for achieving high performance in piston engines under the transition to carbon-neutral energy. Recent studies demonstrate the potential to attain brake thermal efficiency (BTE) of up to 45%, with nitrogen oxide (NOx) concentrations in the exhaust gases below 20 ppm, and virtually zero emissions of hydrocarbons and particulate matter [1,2,3,4,5,6].
The fuel properties of hydrogen allow for the implementation of a wide variety of engine operation strategies: operation with quantitative, qualitative, and mixed power control, ignition by compression, electric spark, glow plug ignition, pilot diesel fuel ignition, etc. [1,2,3,4,5,6]. Of particular interest are direct injection (DI) strategies, which strongly influence hydrogen mixture formation and combustion processes. This study examines early and late direct injection, jet-guided operation (where ignition occurs during injection), and dual injection (two injections of hydrogen during a single engine cycle).
In the early injection strategy, hydrogen is injected at pressures between 2.0 MPa and 8.0 MPa almost immediately after the intake valves close, during the first half of the compression stroke. By the time of ignition, the fuel–air mixture has sufficient time for homogenisation. In the late injection strategy, hydrogen is injected during the second half of the compression stroke. Since the cylinder pressure by the end of compression can reach 6 MPa or more, injection is carried out at high pressures (typically 15 MPa to 30 MPa) to ensure a supercritical flow regime. In this case, the fuel does not have enough time to mix uniformly with the air before ignition, resulting in zones of both rich and lean mixtures.
Combustion of a stratified mixture proceeds more intensively than that of a homogeneous mixture, which in many cases allows the late injection strategy to achieve higher engine efficiency compared to early injection [7,8,9,10,11]. Additionally, late injection reduces compression losses, thereby improving thermal efficiency. For example, Huang et al. [10] show that for air/fuel ratios (λ) between 1 and 2, retarding the start of injection (SOI) from −180° crank angle after top dead centre (°CA ATDC) to −80 °CA ATDC increases BTE of up to 2%.
Importantly, excessive delays in the start of injection can lead to the formation of rich and lean mixture zones, which may result in prolonged combustion, dissociation losses, and incomplete combustion. According to Gerke [11], retarding the SOI from −60 °CA ATDC to −20 °CA ATDC decreases BTE by approximately 2.5–3%. Similarly, Mohammadi et al. [12] report that changing the SOI from −80 °CA ATDC to −30 °CA ATDC reduces BTE by 1–1.3%.
Nitrogen oxide emissions tend to decrease with delayed start of injection when operating with λ values from 1 to 1.5 [8,10,11]. For instance, Gerke [11] shows that varying the SOI from −180 °CA ATDC to −20 °CA ATDC with λ values between 1 and 1.5 results in a 5–9-fold reduction in NOₓ emissions. When leaner mixtures (λ > 1.5) are used, NOx emissions either remain unchanged or slightly increase.
Combustion control becomes more challenging with late injection and significant mixture stratification. For example, Wallner et al. [13] show that when operating at λ = 1.33 with late injection, unstable engine operation and misfiring were observed. Mohammadi et al. [12] report that stable engine operation at λ = 3.33 is achieved only within an SOI range from −130 °CA ATDC to −93 °CA ATDC, whereas enriching the mixture to λ = 1.6–2.0 allowed for a broader SOI range from −130 °CA ATDC to −70 °CA ATDC.
The degree of mixture stratification is determined not only by injection timing, air motion, and in-cylinder conditions, but also by ignition timing. This is one of the most critical parameters affecting the indicated thermal efficiency (ITE) of the engine. According to [8,14,15], maximum ITE is attained when 50% of the fuel mass is burned at 8° CA crank angle (MFB50 = 8° CA).
Beyond its impact on thermal efficiency, ignition timing must also be carefully adjusted to mitigate the risk of abnormal combustion phenomena, such as knock and pre-ignition caused by hot surfaces. For example, Grabner et al. [16] demonstrate that knock-free operation of a hydrogen engine running on a stoichiometric mixture is possible at 2000 rpm and brake mean effective pressure (BMEP) up to 2.6 MPa with ignition timings later than 9 °CA ATDC, and at 5000 rpm and BMEP up to 2.35 MPa with ignition timings later than 1.5 °CA ATDC.
However, studies aimed at identifying the optimal correlation between the start of injection and ignition timing across a wide range of engine operating conditions are scarcely represented in the literature. In particular, the issues related to the selection of injection and ignition parameters under constraints such as mechanical and thermal stresses, abnormal combustion, and nitrogen oxide emissions remain largely unexplored.
Effective methods for reducing combustion harshness and peak cylinder pressures, suppressing abnormal combustion, and lowering nitrogen oxide emissions include dual injection and jet-guided operation [7,8,11,13,17,18].
In the case of dual injection, the first portion of fuel is injected after the intake valves close or during the second half of the compression stroke. The quantity of fuel in the first injection is selected to ensure the required mixture composition at the moment of ignition. Typically, λ after the first injection does not exceed 2.5–3. This ensures reliable ignition and combustion, a low probability of knock, and reduced nitrogen oxide emissions. The second portion of fuel is injected into the flame front and burns in a diffusion-like process, similar to diesel combustion. The quantity of fuel in the second injection is chosen to meet the required engine power. Under diffusion combustion, the probability of abnormal combustion is extremely low [8,13,19].
Wallner et al. [13] present extensive studies on dual injection. The engine operates at speeds of 1000 rpm, 1500 rpm, and 2000 rpm with a load of 0.6 MPa. The start of the first injection is fixed at −120 °CA ATDC, while the start of the second injection is optimised to ensure maximum indicated thermal efficiency. The ignition timing approximately coincides with the start of the second injection. Results show that the highest ITE values are achieved when the fuel share in the first injection is between 70% and 100%. When the share is reduced from 100% to 50%, nitrogen oxide emissions decrease by up to 85%.
Similar results are obtained by Gerke [11] for a hydrogen engine with dual injection operating at a speed of 2000 rpm, IMEP of 1.0 MPa, and λ equal to 1. The mass ratio of the first to the second injection is set to 30%/70%, 50%/50%, and 60%/40%, respectively. The start of the first injection (SOI1) is fixed at −120 °CA ATDC, and the start of the second injection (SOI2) varies within the range of approximately −38 °CA ATDC to 6 °CA ATDC. The ignition timing is kept constant at −13 °CA ATDC. Results show that increasing the delay of SOI2 leads to higher incomplete combustion losses and lower nitrogen oxide emissions. The influence of changing SOI2 on indicated efficiency is not straightforward and depends both on the ratio of the first to the second injection and on the SOI2 variation range.
Notably, the literature lacks sufficient information regarding the optimal ratio of the first to the second injection, the ignition timing, and the start of both injections, based on efficiency criteria and operating constraints.
In jet-guided operation, hydrogen is injected relatively late, and ignition is initiated by a spark during the injection process. After ignition, the portion of the fuel that has already mixed with air burns first in the flame front, followed by relatively slow diffusion combustion of the fuel delivered after the onset of ignition [8,17,19]. Combustion in this case is characterised by a high degree of mixture stratification and is primarily determined by the fuel injection conditions.
Beyer et al. [8,19] study the influence of ignition timing and hydrogen injection conditions (injection pressure, injector needle lift) on combustion and engine performance. Hydrogen is supplied at pressures of 8–19 MPa. The ignition timing either coincides with the start of injection, follows it by up to 8 °CA ATDC [19], or varies within the range from 20% to 100% [8] of the total injection duration. Results show that under jet-guided operation, the ITE is in most cases reduced by up to 5% compared to homogeneous mixture operation. At the same time, the combustion duration extends significantly (by up to 50° CA), the exhaust gas temperature is up to 100 °C higher than in homogeneous operation, and the coefficient of variation increases. The tendency for reduced engine efficiency, longer combustion duration, and higher exhaust gas temperatures becomes more pronounced as the ignition timing approaches the start of injection.
The influence of jet-guided operation on nitrogen oxide emissions and the completeness of fuel combustion is ambiguous. When operating on a stoichiometric mixture, nitrogen oxide emissions are reduced by a factor of 7.5–9, and the hydrogen content in the exhaust gases increases by a factor of 2.5–3 compared to operation with a homogeneous mixture [8]. When operating with a lean mixture with λ = 2.5, nitrogen oxide emissions rise from around 30 ppm–50 ppm to 450 ppm–1500 ppm, in contrast to homogeneous mixtures. The hydrogen content in the exhaust gases decreases by up to a factor of 2. It has been noted that when using jet-guided operation with a stoichiometric mixture, operation without abnormal combustion is possible at higher loads than when operating with a homogeneous mixture.
Jet-guided operation is the least studied among the injection strategies considered in this work. There are still open questions regarding the rationale for selecting injection and ignition timings, their interrelationship, and their effects on hydrogen combustion and engine performance.
A literature review has shown that the selection of hydrogen injection and ignition parameters is a complex multi-variable task, where changes in parameters can lead to improvements in some engine characteristics while simultaneously worsening others. At the same time, studies on the selection of the parameters using optimisation criteria and constraints across a wide range of engine operating modes are insufficiently represented in the literature. It should also be noted that there is a lack of publications dedicated to the investigation of dual injection and jet-guided operation, including the definition of the applicability range of these strategies (i.e., the engine operating conditions under which the use of these two strategies is reasonable).
Current studies on various injection strategies [20,21,22] tend to focus on examining individual strategies rather than providing a comparative analysis. These studies are usually conducted under only one or two operating modes. A comparative investigation of the strategies across a broader range of operating conditions would allow the results to be generalised more reliably.
A multivariable study of the influence of injection parameters on combustion and engine performance, the selection of injection parameters for a wide range of engine operating modes, and a comparative evaluation of different strategies can be implemented on the basis of mathematical modelling.
In our previous study [23], we consider the application of early and late injection as well as dual injection in a Ford 1.6 L EcoBoost engine. The mathematical model is based on our earlier hydrogen combustion model developed using Wiebe functions [24]. At that stage, the model does not account for the influence of injection timing on mixture stratification and combustion characteristics. The parameters of late injection and dual injection (the start of single injection and the ratio between injections) are treated as fixed, without optimisation. The jet-guided combustion strategy is not considered. The refinements and extensions introduced into the combustion model in [25] enable accounting for the effect of injection timing on mixture combustion, allow a more accurate description of dual injection, and provide a mathematical representation of jet-guided combustion. These developments form the basis of the present study.
The key idea of this paper, which constitutes its scientific novelty, is the consideration of the applicability and effectiveness of various injection strategies using contour maps with ignition timing and start of injection as coordinates representing equal levels of key engine parameters. This approach enables the optimisation of injection and ignition parameters for different injection strategies and the comparative analysis of their effectiveness.
The aim of this study is to numerically investigate the influence of injection and ignition parameters on the combustion process and the performance characteristics of a hydrogen engine, to determine injection settings based on specified efficiency criteria and constraints, and to provide a comparative assessment of the effectiveness and applicability of various injection strategies.
2. Research Methodology
2.1. Mathematical Model of the Engine Power Cycle
The research was conducted for the Ford 1.6 L EcoBoost engine. The engine parameters are given in Table 1. The base engine is a gasoline engine with direct injection and turbocharging. With minor modifications, it can be adapted for hydrogen use.

Table 1.
Main parameters of the Ford 1.6 L EcoBoost engine.
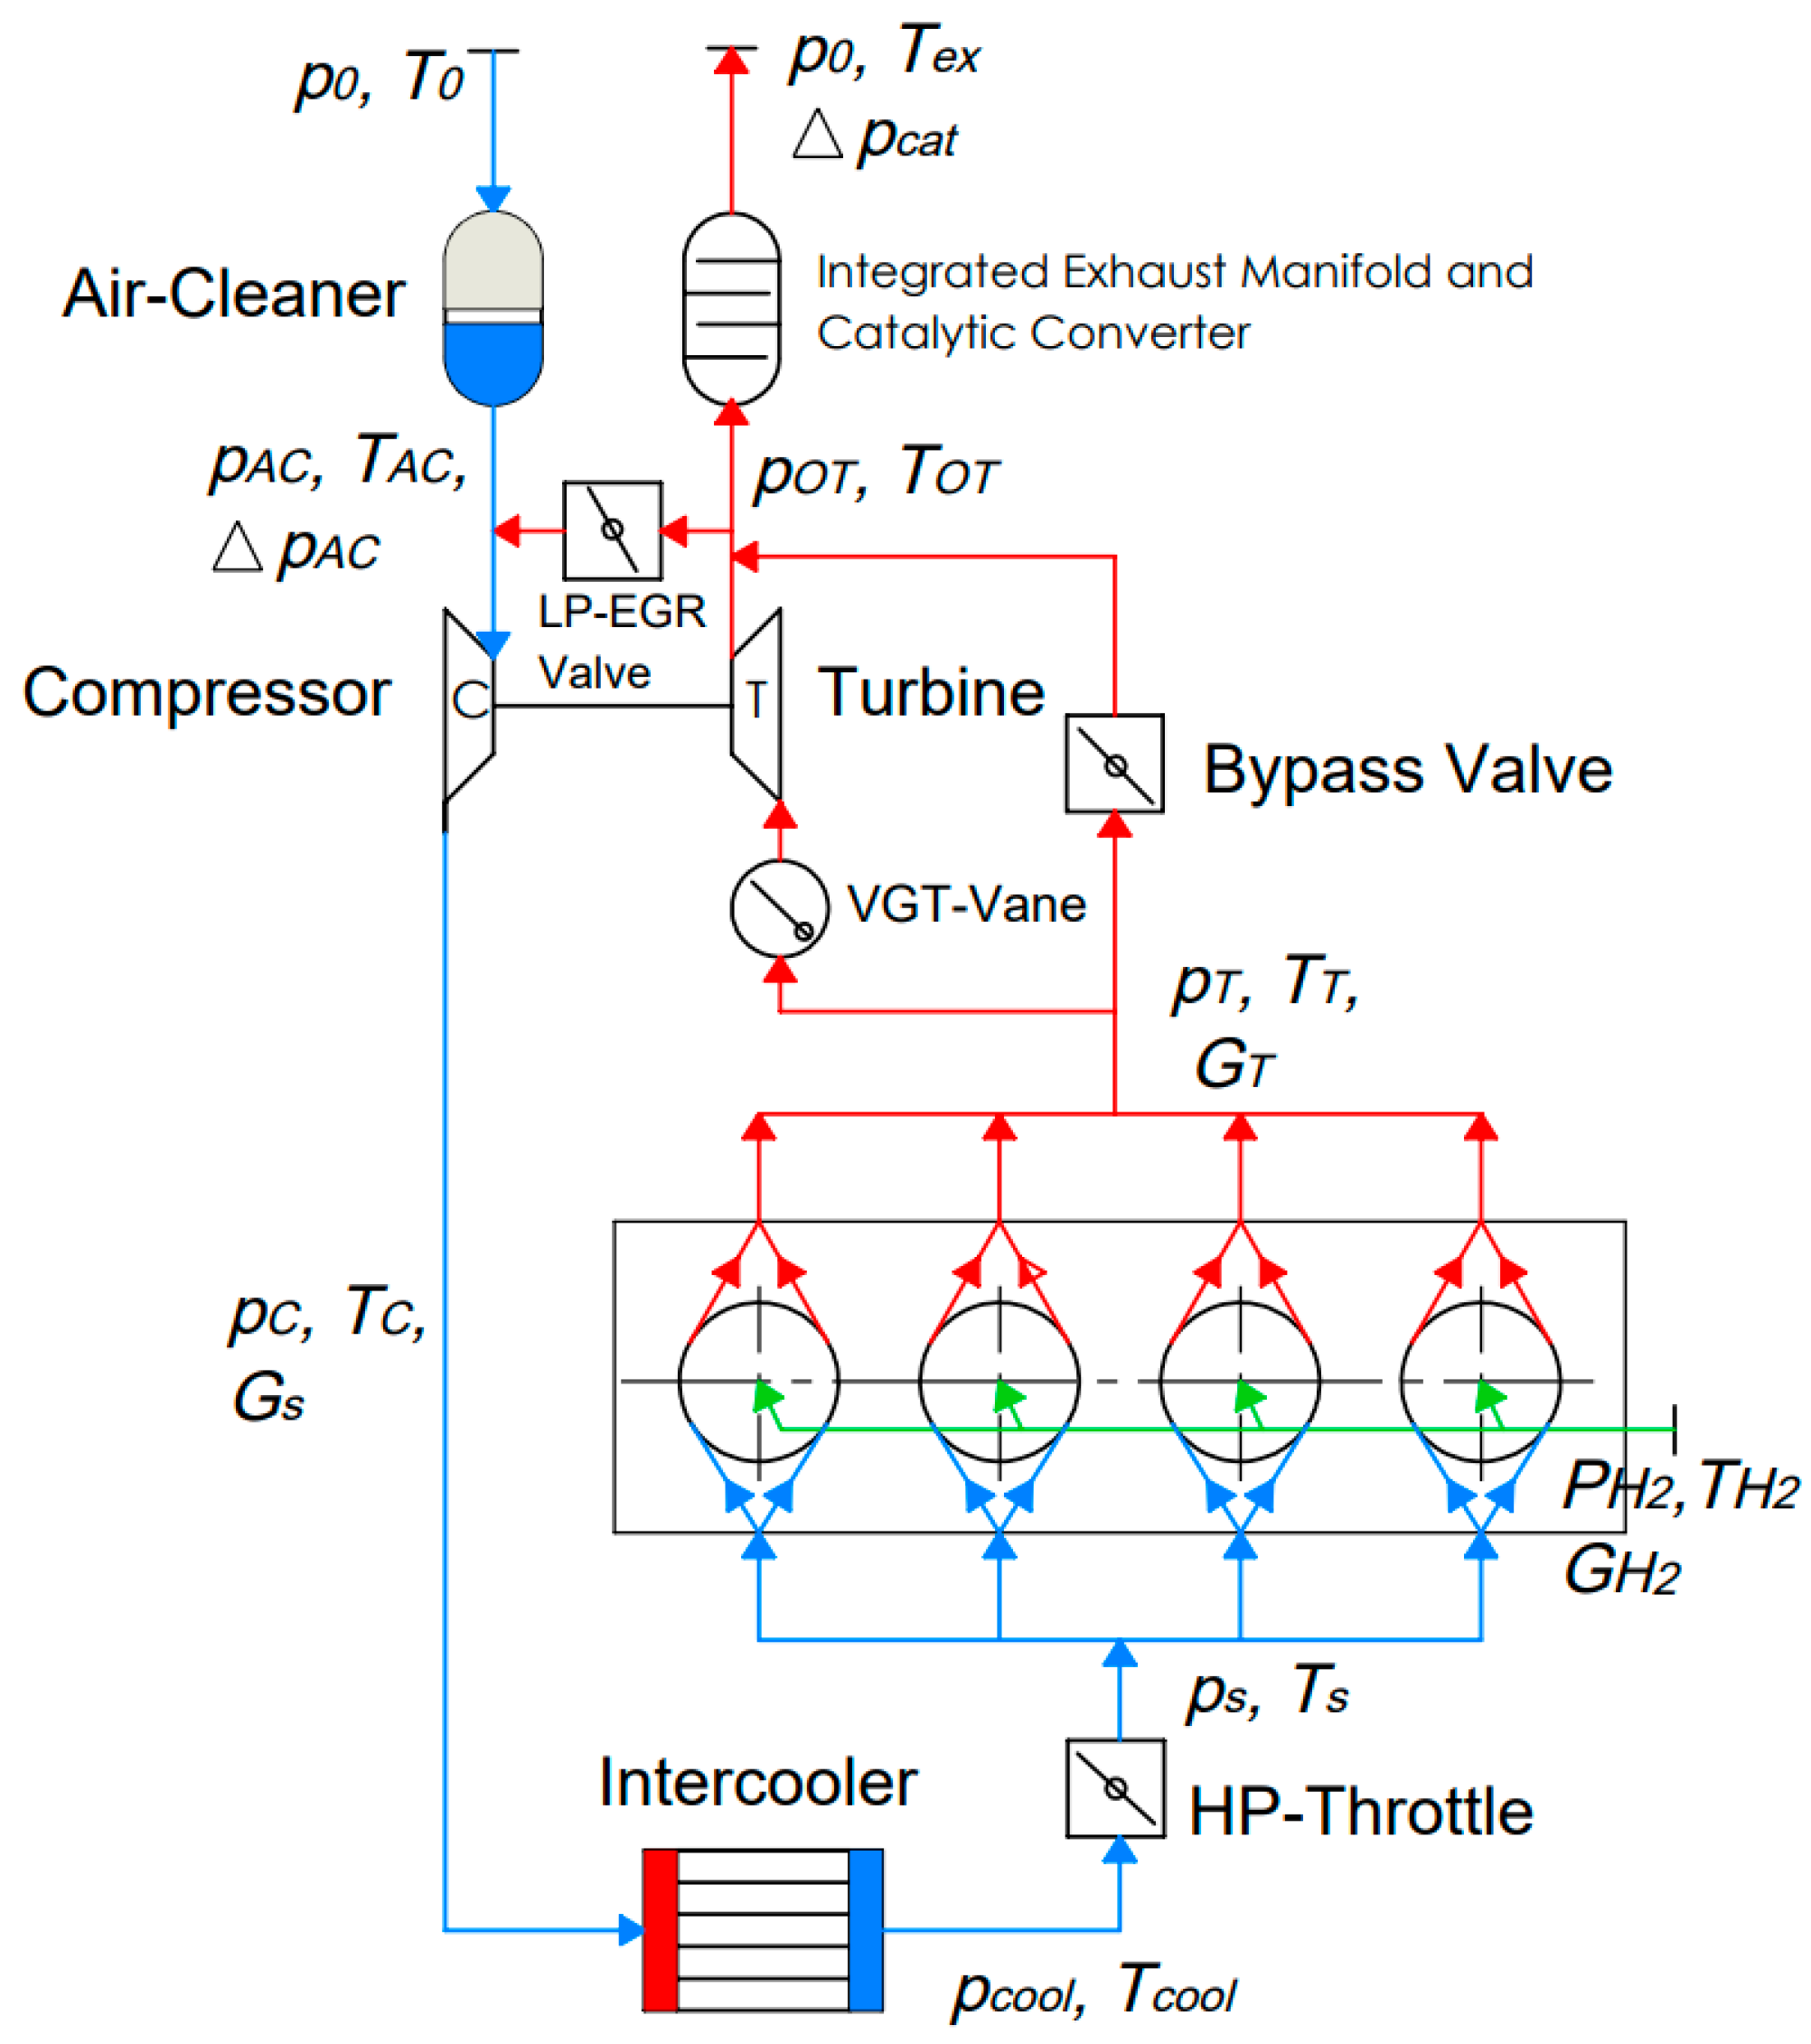
The computational scheme of the hydrogen variant of the engine [23] is shown in Figure 1. The mathematical model of the engine cycle was developed by the authors and implemented in MATLAB. This model is a quasi-steady thermodynamic model. The computational elements of the system include the cylinders, the intake manifold, and the exhaust manifold. It is assumed that the processes in all engine cylinders are identical.
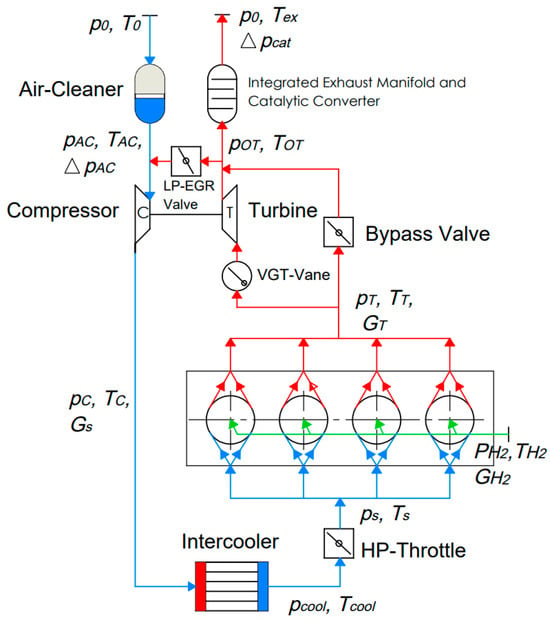
Figure 1.
Schematic diagram of the Ford 1.6 L EcoBoost engine [23].
The gas parameters at the turbine inlet and the compressor outlet are determined by interpolation based on maps entered into the calculation software in tabular form. The programme allows turbine power to be regulated either by bypassing part of the exhaust gases or/and adjusting the turbine nozzle flow area. Pressure losses in the air filter, intercooler, and catalytic converter, as well as the cooling efficiency in the intercooler, are defined using empirical correlations.
At the beginning of the calculation, the gas parameters in the manifolds are assumed to be constant throughout the cycle, while the cylinder parameters at the start of the exhaust stroke are estimated based on the thermal balance. This estimation takes into account the specified engine power and several accepted simplifications and assumptions regarding indicated efficiency, air/fuel ratio, volumetric efficiency, the residual exhaust gas fraction, and so on. The boundary conditions at the main sections are then refined based on the results of the cylinder and manifold process calculations, until the required convergence is achieved. If the difference between the specified and calculated engine power exceeds a predefined threshold, the throttle valve position and/or the turbine bypass valve parameters are adjusted using a PID controller equation, and the calculation is repeated until the specified engine power is reached.
The mathematical model of the cycle includes submodels for combustion, knock, heat transfer to the walls, turbocharging, nitrogen oxide formation, mechanical losses, and others.
The combustion model is described in detail in our previous works [24,25]. According to this model, the burn rate in the cylinder is calculated as follows:
where is the burn rate of the premixed combustion, is the burn rate of the diffusion combustion, and is the burn rate in the lean mixture zones. The parameters rI1 and rI2 represent the mass shares of the fuel supplied during the first and second injections (or the shares of fuel burned in premixed and diffusion combustion phases under jet-guided operation), while rI and rII are the shares of the fuel burned in rich and lean mixture zones, respectively.
Each term in Equation (1) is calculated using the Wiebe function, in which the combustion duration, the combustion characteristic exponent (which defines the shape of the burn rate curve), and other model coefficients are defined depending on the fuel injection parameters, air/fuel ratio, engine speed, and a number of other parameters. These are determined using empirical formulas or selected from proposed ranges. This model has been adapted for simulating combustion in various engines with single early or late injection, dual injection, as well as jet-guided operation, as described in [24,25].
Heat transfer from gas to the cylinder walls is determined using Newton’s equation, with the heat transfer coefficient calculated according to Woschni’s correlation. The cylinder wall temperature is obtained by solving the heat conduction equation for a multilayer wall structure following the method described by Kuleshov [26].
Nitrogen oxide formation is calculated based on the Zeldovich thermal mechanism using the methodology proposed by Zvonov [27]. As part of this methodology, the equilibrium gas composition in the cylinder is determined for 13 chemical species according to the method of Zeldovich and Polyarniy [28]. In the NOx calculations, the mean temperature in the combustion products zone is taken into account. This temperature is determined from the enthalpy balance for the total gas in the cylinder, the combustion products zone, and the unburned mixture zone.
Notably, neglecting the local distribution of λ across the cylinder zones and the local temperatures in the calculation of highly stratified lean mixtures leads to increased uncertainty in NOx prediction (see Section 2.2). At the same time, the model indirectly accounts for mixture stratification through its effect on the combustion kinetics. Comparisons with experimental data show that the model is generally capable of capturing the influence of most injection and ignition parameters on NOx formation.
The probability of knock occurrence in the cylinder is evaluated using the method proposed by Douaud and Eyzat [29] and is validated for hydrogen engines in [30,31,32]. It is assumed that knock occurs when the value of the knock criterion reaches one:
where τ is the induction time at the instantaneous temperature and pressure of the mixture, and t is the elapsed time from the beginning of the end-gas compression (t = 0) to the autoignition time ti.
The parameter τ in the knock model is determined based on the calculated cylinder pressure, end-gas temperature, and the octane number determined by the research method (RON). In this study, the RON value for hydrogen is assumed to be 120.
Mechanical losses in the engine consist of pumping losses during gas exchange and friction losses. The former are determined based on the calculated cylinder pressure during the intake and exhaust strokes, while the latter are defined using an empirical function of engine speed and BMEP.
In our previous work [23], the cycle model for the Ford EcoBoost 1.6 L gasoline engine is validated across the full range of operating conditions using experimental data from sources [33,34]. The simulation results for the hydrogen version of this engine are compared with experimental data for the Ford EcoBoost 1.3 L engine from the works of Sterlepper et al. [14] and Geiler et al. [35], which is similar in design and parameters to the investigated engine. Results show that the simulation results agree well with the experimental data, both in terms of the relative values of the calculated parameters and the shape of the resulting characteristics.
2.2. Assessment of Model Sensitivity and Uncertainty
The influence of model parameters on engine performance is evaluated by means of the normalised sensitivity coefficient, defined as
where ∂F is the variation in the engine parameter corresponding to the variation in the model parameter ∂x, F is the engine parameter obtained at the baseline value of the model parameter x, and p denotes the model parameter.
The results of the normalised sensitivity analysis of the ITE, the maximum in-cylinder pressure (pmax), the NOx concentration in the exhaust gas (rNOx), the turbine inlet temperature (TT), and the knock criterion (kd) with respect to several model parameters are presented in Table 2. The analysis is carried out for the engine operating at 2000 rpm and a BMEP of 0.7 MPa. The research octane number of the fuel in the model affects only the knock criterion, and therefore sensitivity is assessed solely for this parameter. Notably, both the magnitude and the direction of the variations in engine performance resulting from changes in model parameters are in satisfactory overall agreement with established concepts of internal combustion engine theory. The weak sensitivity of the model to changes in injector area and injection pressure can be explained by the significant excess air and the relatively short injection duration (15° CA) under these operating conditions.

Table 2.
Normalised sensitivity coefficient (Sp) of engine parameters with respect to model parameter variations.
In direct injection, mixture stratification occurs, which is manifested as a non-uniform distribution of the air/fuel ratio across the cylinder zones. This introduces a degree of uncertainty into the results produced by the mathematical model employed in this study.
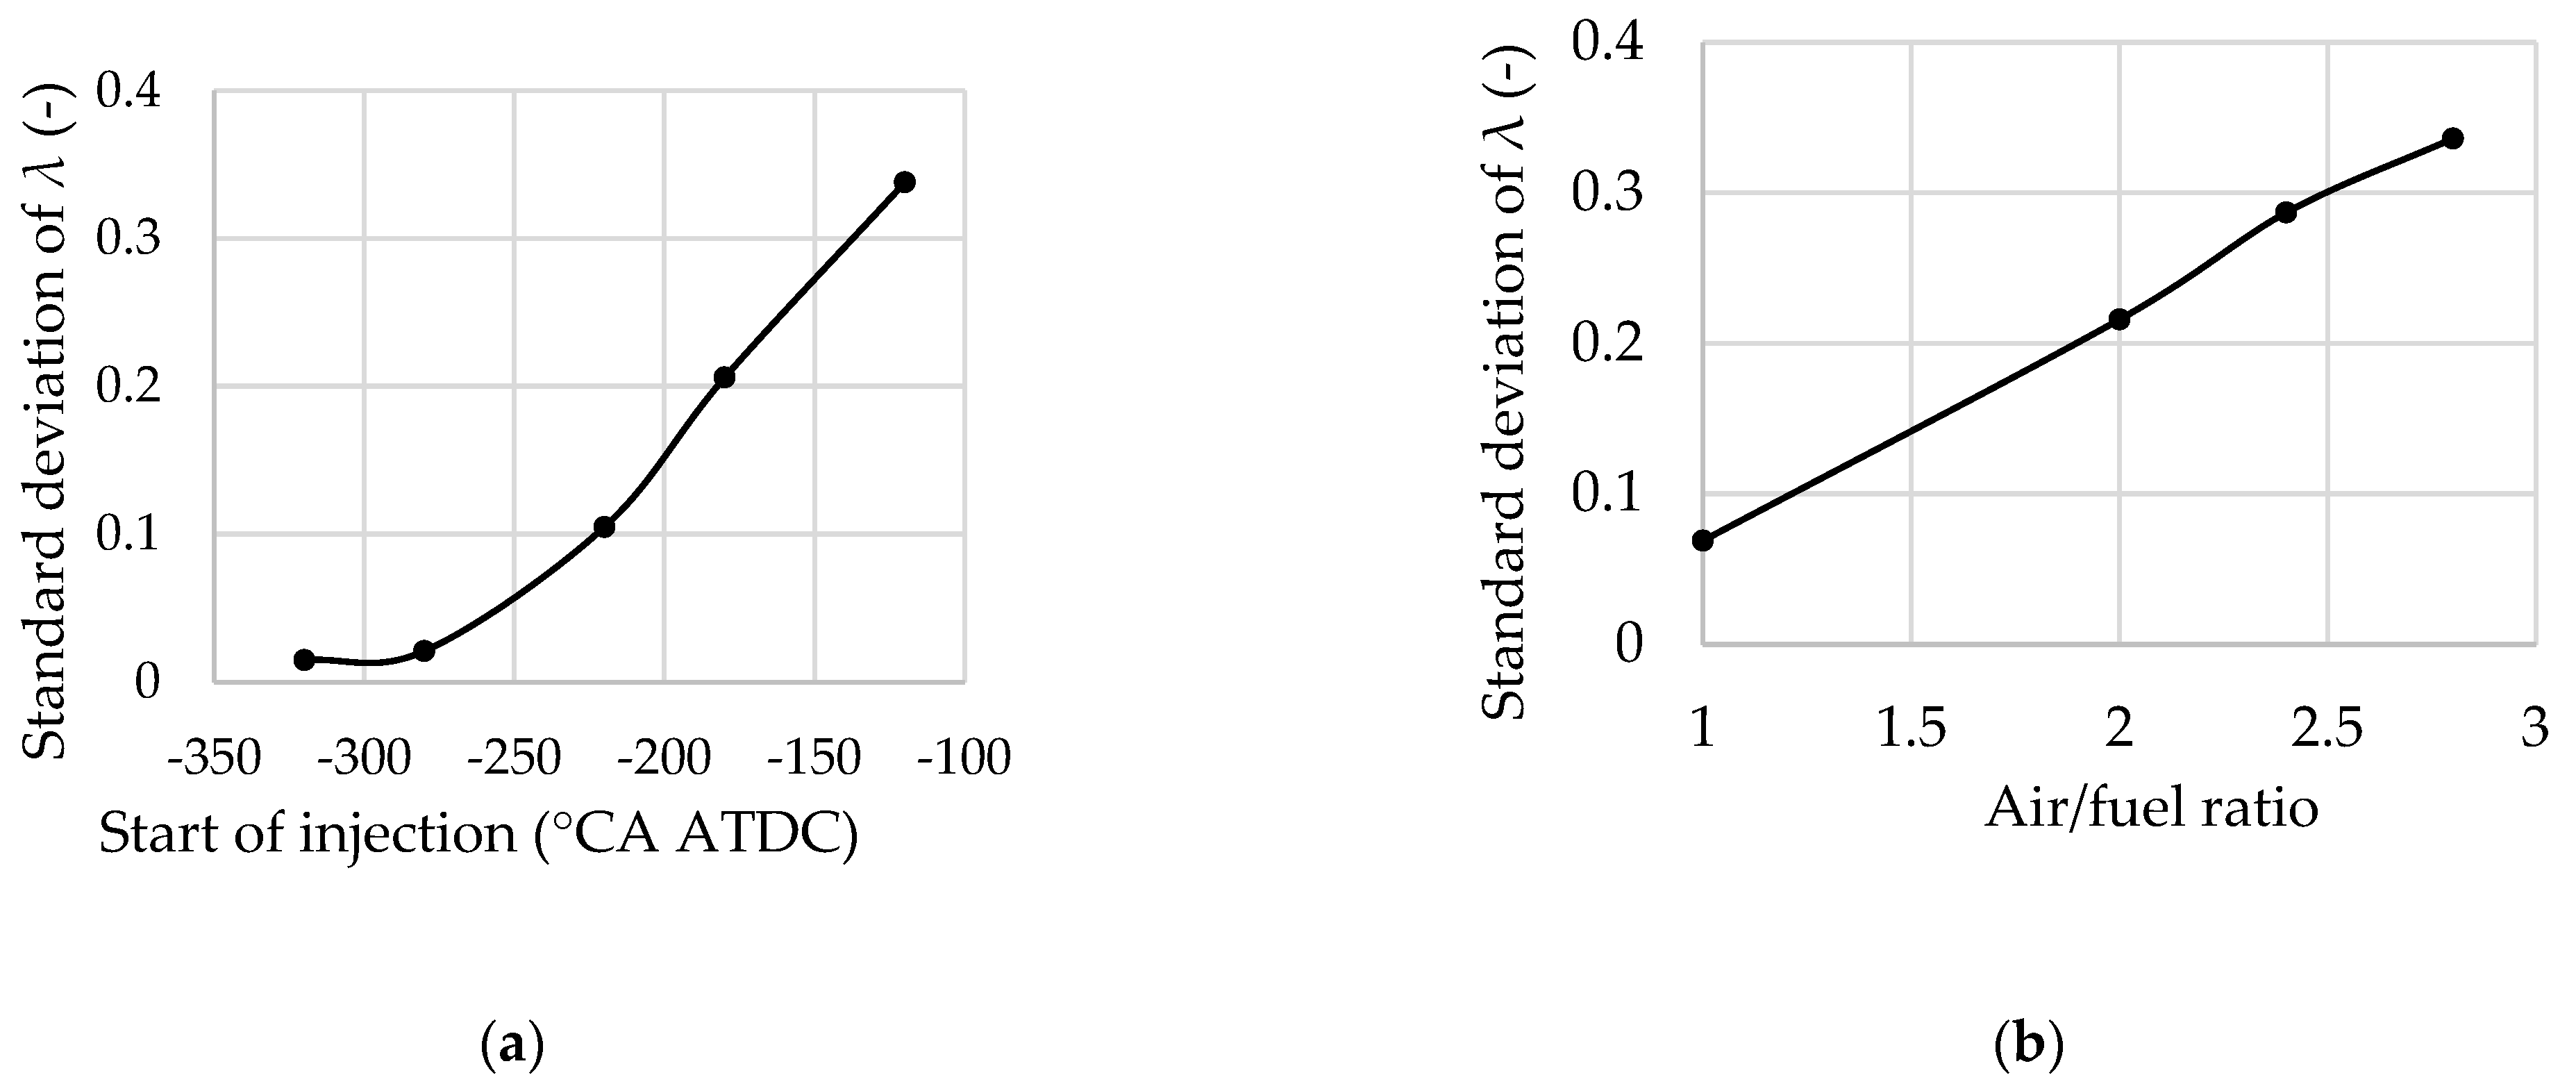
The non-uniformity of the mixture distribution across the cylinder zones can be evaluated by means of the standard deviation of the air/fuel ratio σλ obtained from CFD simulations. Schmelcher et al. [15] present computational data for a single-cylinder hydrogen direct-injection engine operating at an injection pressure pinj of 22 MPa, an IMEP of 0.7 MPa, and n = 2000 rpm (Figure 2). The results indicate that the standard deviation of the air/fuel ratio at the ignition timing (−4 °CA ATDC) increases significantly both with a delay in the start of injection and with an increase in the average in-cylinder air/fuel ratio. It is also observed that the influence of load on σλ is relatively small.
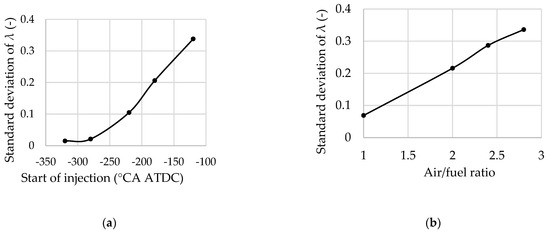
Figure 2.
Influence of the start of injection (a) and the average in-cylinder air/fuel ratio (b) on the standard deviation of the in-cylinder air/fuel ratio in a hydrogen engine, based on CFD simulations from [15]: (a) λ = 2; (b) SOI = –200 °CA ATDC; IMEP = 0.7 MPa; n = 2000 rpm; pinj = 22 MPa.
To calculate the uncertainty of the mathematical model used in this study, it is assumed that the dependence of the standard deviation of λ on the start of injection and the average in-cylinder air/fuel ratio for the investigated engine is the same as that reported in [15] for the corresponding operating condition (IMEP = 0.7 MPa, n = 2000 rpm). Notably, in the investigated engine the SOI is set after the intake valves close, and therefore the SOI variation range is selected to be somewhat narrower than in [15].
The relative uncertainty in the calculation of engine parameters for stratified combustion cases is evaluated as
where Sp is the normalised sensitivity coefficient of an engine parameter with respect to the average in-cylinder air/fuel ratio (or to SOI), σλ is the standard deviation of the air/fuel ratio, and λ is the average in-cylinder air/fuel ratio.
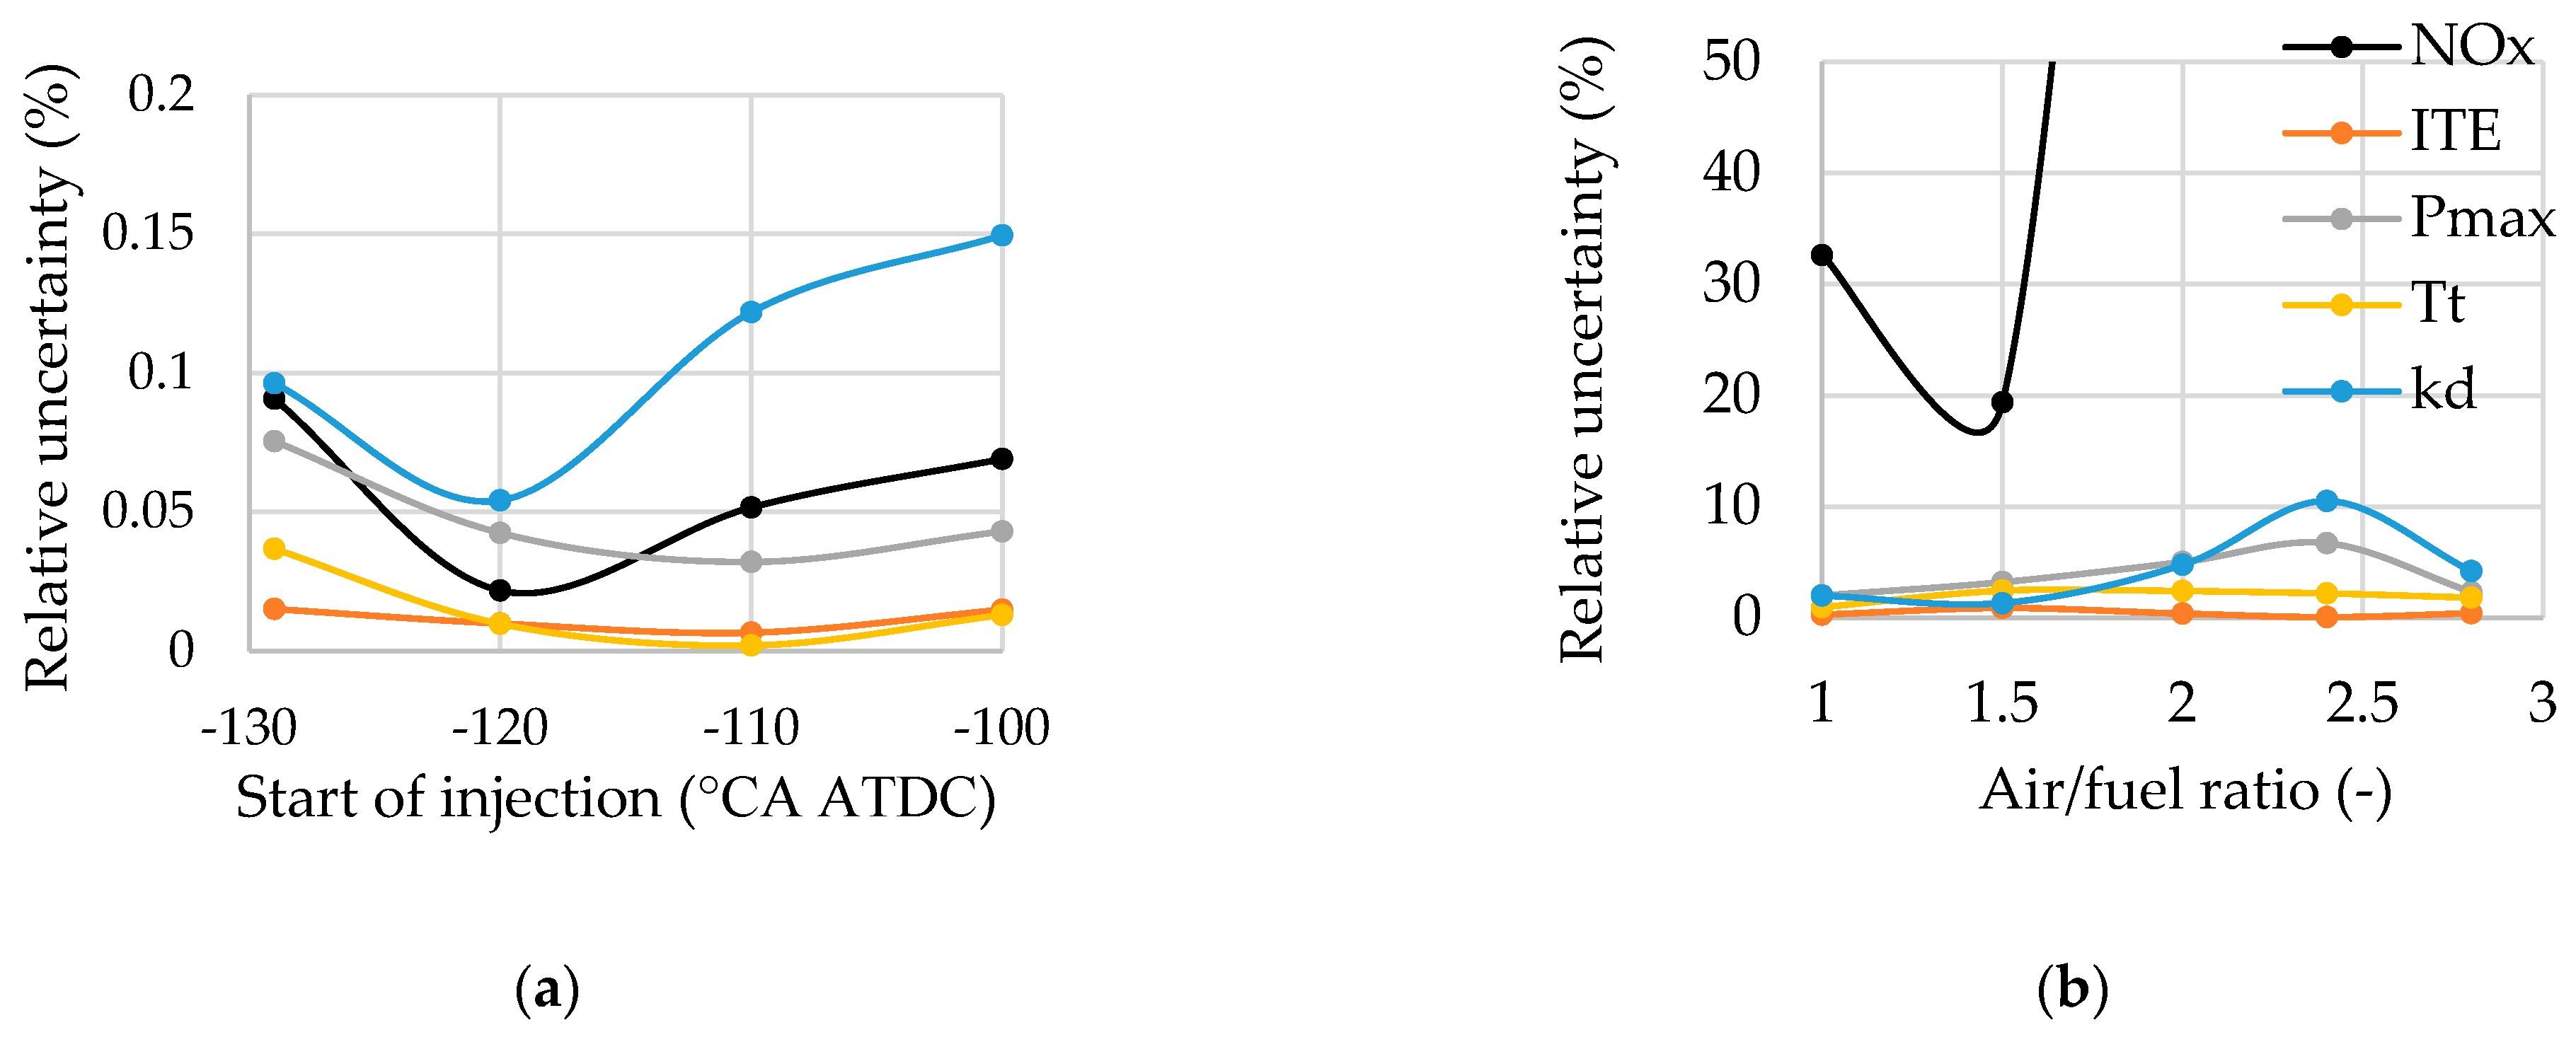
The dependence of the relative uncertainty of engine parameter calculations on the air/fuel ratio and SOI is presented in Figure 3. It is evident that the relative uncertainty in the calculation of engine parameters due to SOI variations does not exceed 0.15%. This indicates that SOI has only a minor effect on the accuracy of the model predictions under the considered operating conditions.
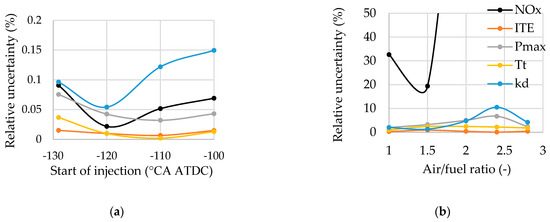
Figure 3.
Influence of the start of injection (a) and the average in-cylinder air/fuel ratio (b) on the relative uncertainty of engine parameter calculations: (a) λ = 2; (b) SOI = –226 °CA ATDC; 1 − IMEP = 0.7 MPa, n = 2000 rpm, pinj = 20 MPa.
When the in-cylinder air–fuel ratio varies, most engine performance parameters remain relatively robust, with a maximum relative uncertainty below 10%. However, it is evident that NOx emissions are highly sensitive to λ. The uncertainty of the NOx formation model ranges from 19% to over 50% at λ = 1.7, which is explained by the high sensitivity of the model to variations in λ.
Notably, the actual uncertainty in the calculation of NOx (as well as other engine parameters) is considerably lower when the real standard deviation of λ is taken into account rather than the value adopted from [15]. In [15], the injector orifice area is, in our estimation, approximately 2.2 times smaller than the value of 1 mm2 used in this study. Consequently, the injection intensity is significantly lower, leading to a larger standard deviation of λ.
Based on this assessment, when comparing different strategies, the uncertainty of the NOx formation model is considered acceptable up to 33%, which corresponds to an average in-cylinder air/fuel ratio between 1 and 1.6. At higher λ values, in the case of stratified mixtures, the model does not provide reliable results.
2.3. Operating Modes, Injection and Ignition Parameters
This study was conducted in three stages. In the first stage, the influence of injection parameters on combustion characteristics and cylinder pressure is analysed, allowing explanation of changes in engine parameters when using different injection strategies. In the second stage, the effect of injection parameters on engine performance is assessed, enabling the selection of parameter combinations for each injection strategy based on specified efficiency criteria and constraints. In the third stage, taking into account the selected injection parameters, engine performance is evaluated under load operating modes.
The study of various injection strategies is carried out at load modes with BMEP ranging from 0 MPa to 1.95 MPa at an engine speed of 2000 rpm. The specified engine speed is chosen because the hydrogen combustion model is most thoroughly validated for speeds close to this engine speed.
The injection pressure and injector flow area for the Ford EcoBoost 1.6 L engine are chosen to ensure the specified cycle fuel supply, injection duration, and supercritical fuel flow. An injector nozzle area of 1.0 mm2 and an injection pressure of 20 MPa satisfy these requirements across different injection strategies. These parameters are kept constant during the study.
Intake and exhaust valve timing are varied depending on engine load and are taken to be the same as those for the base gasoline engine under the corresponding operating modes.
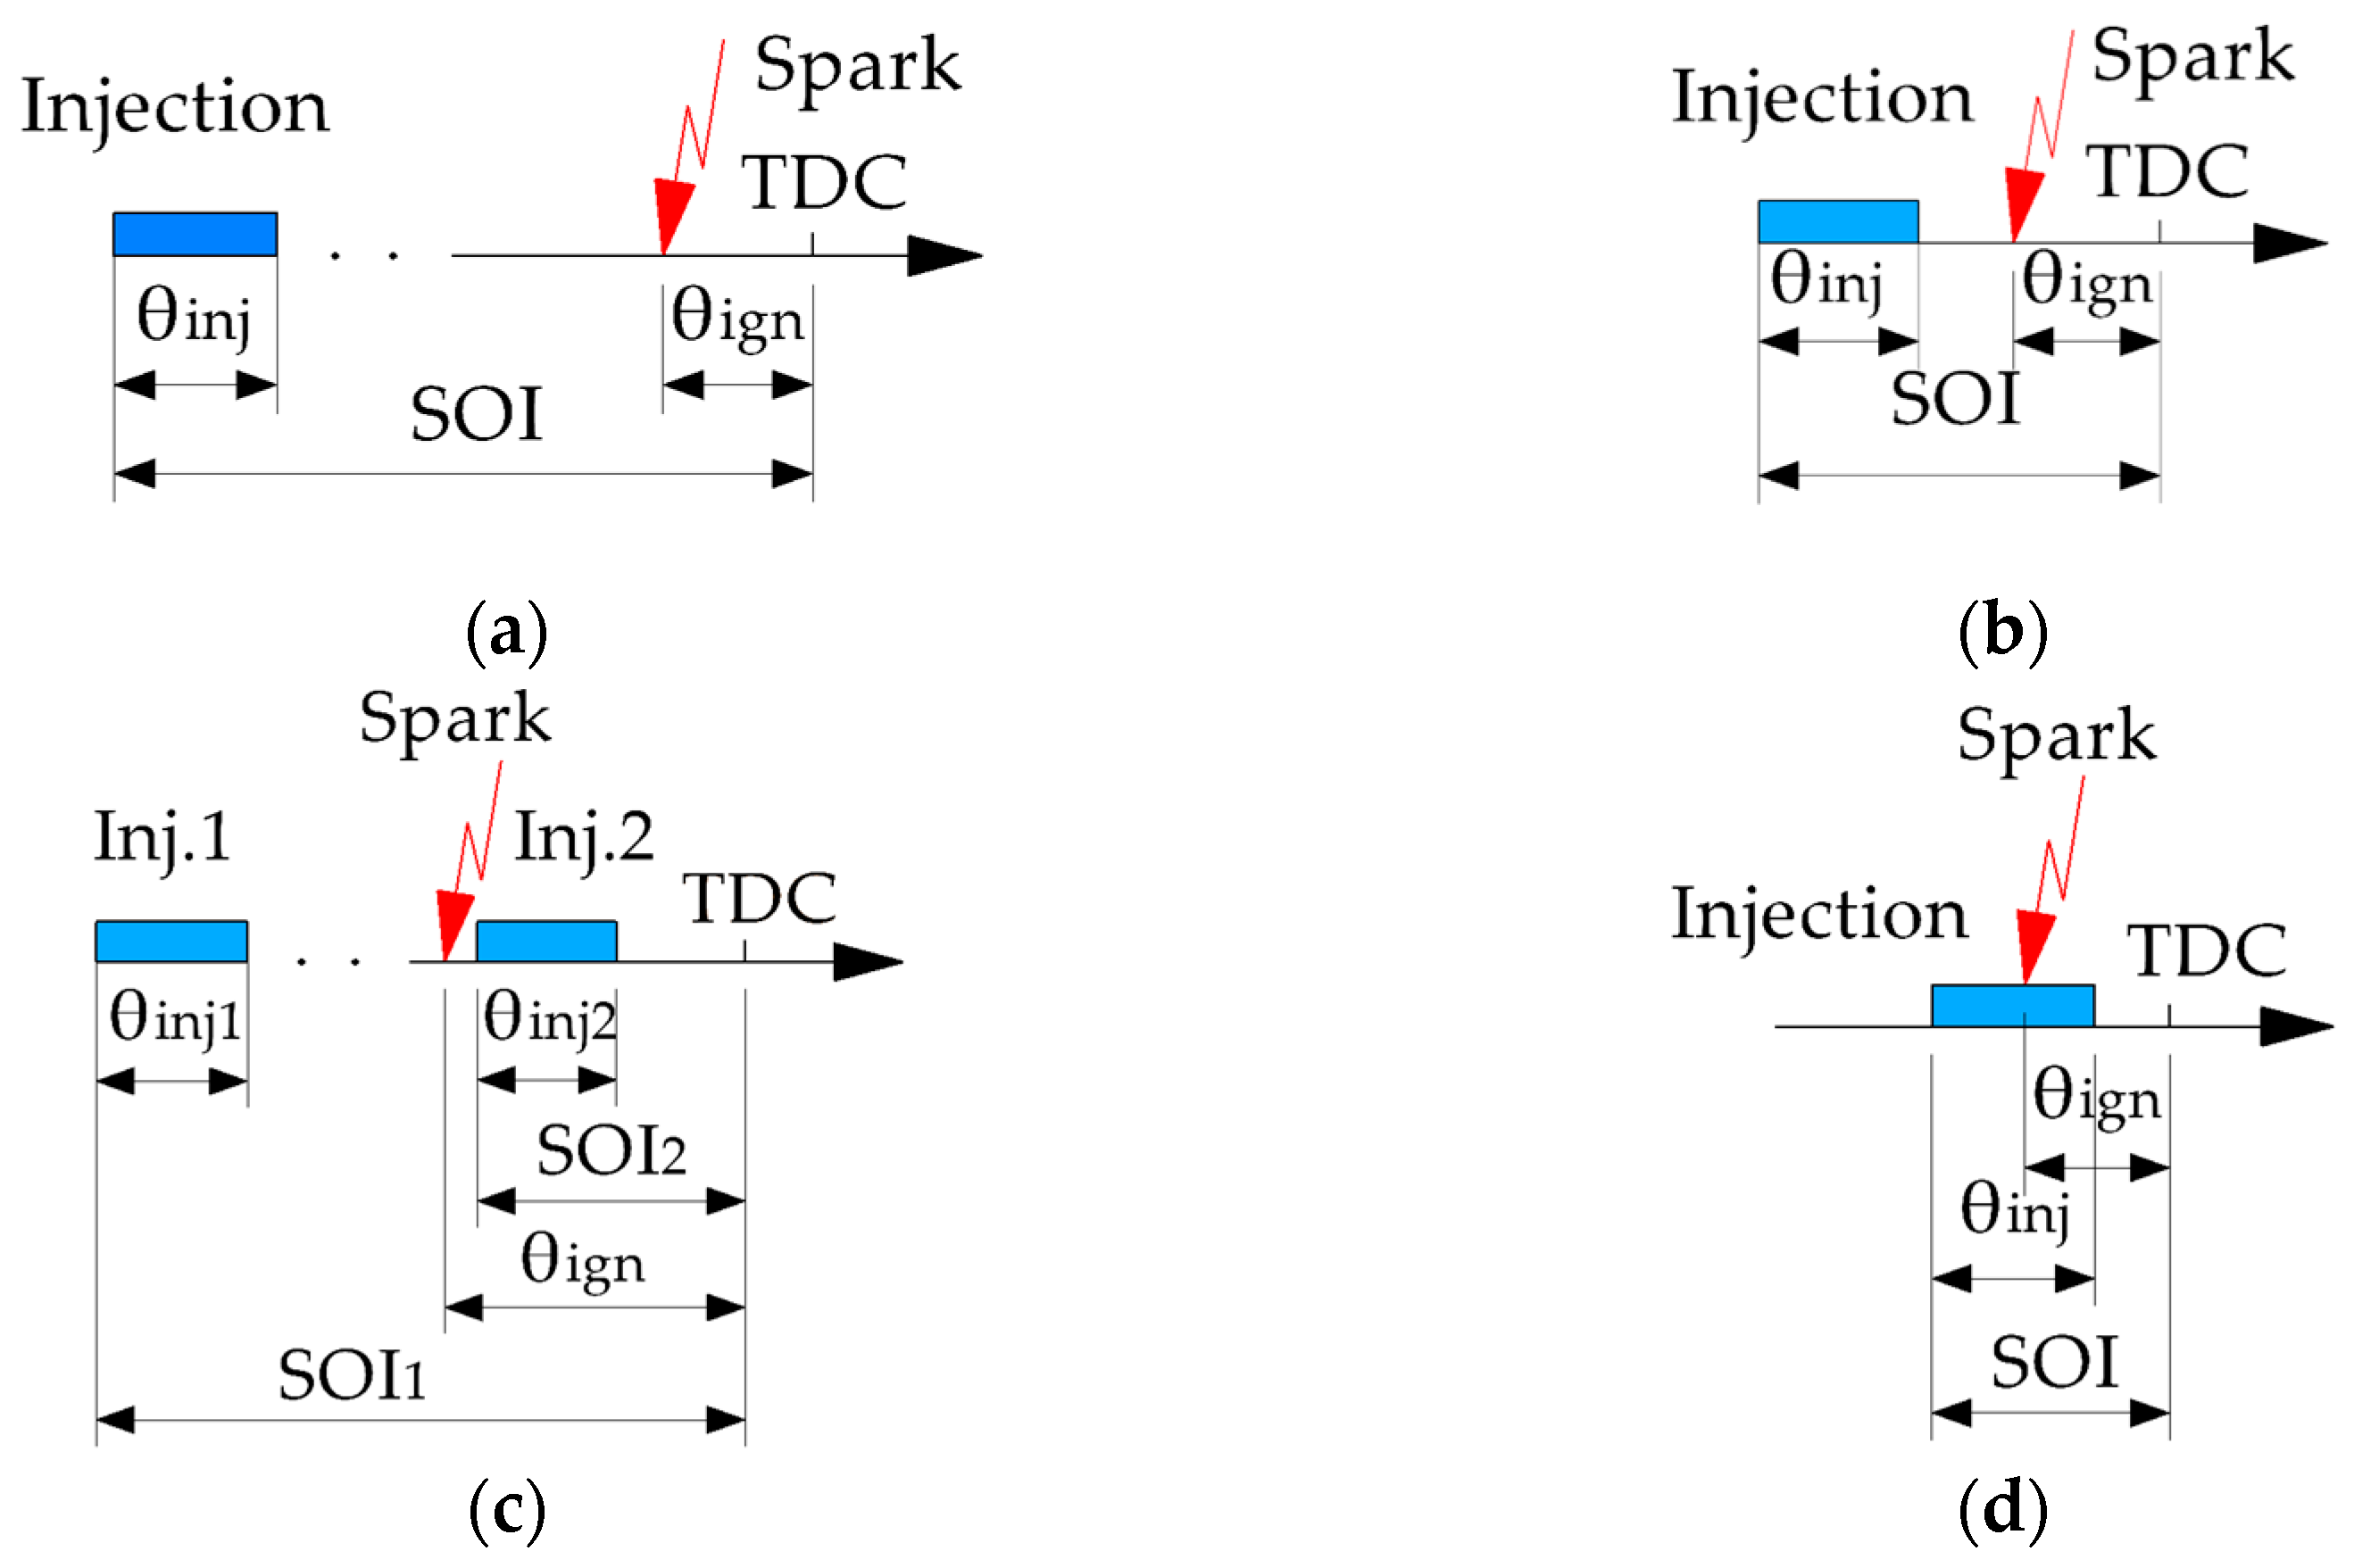
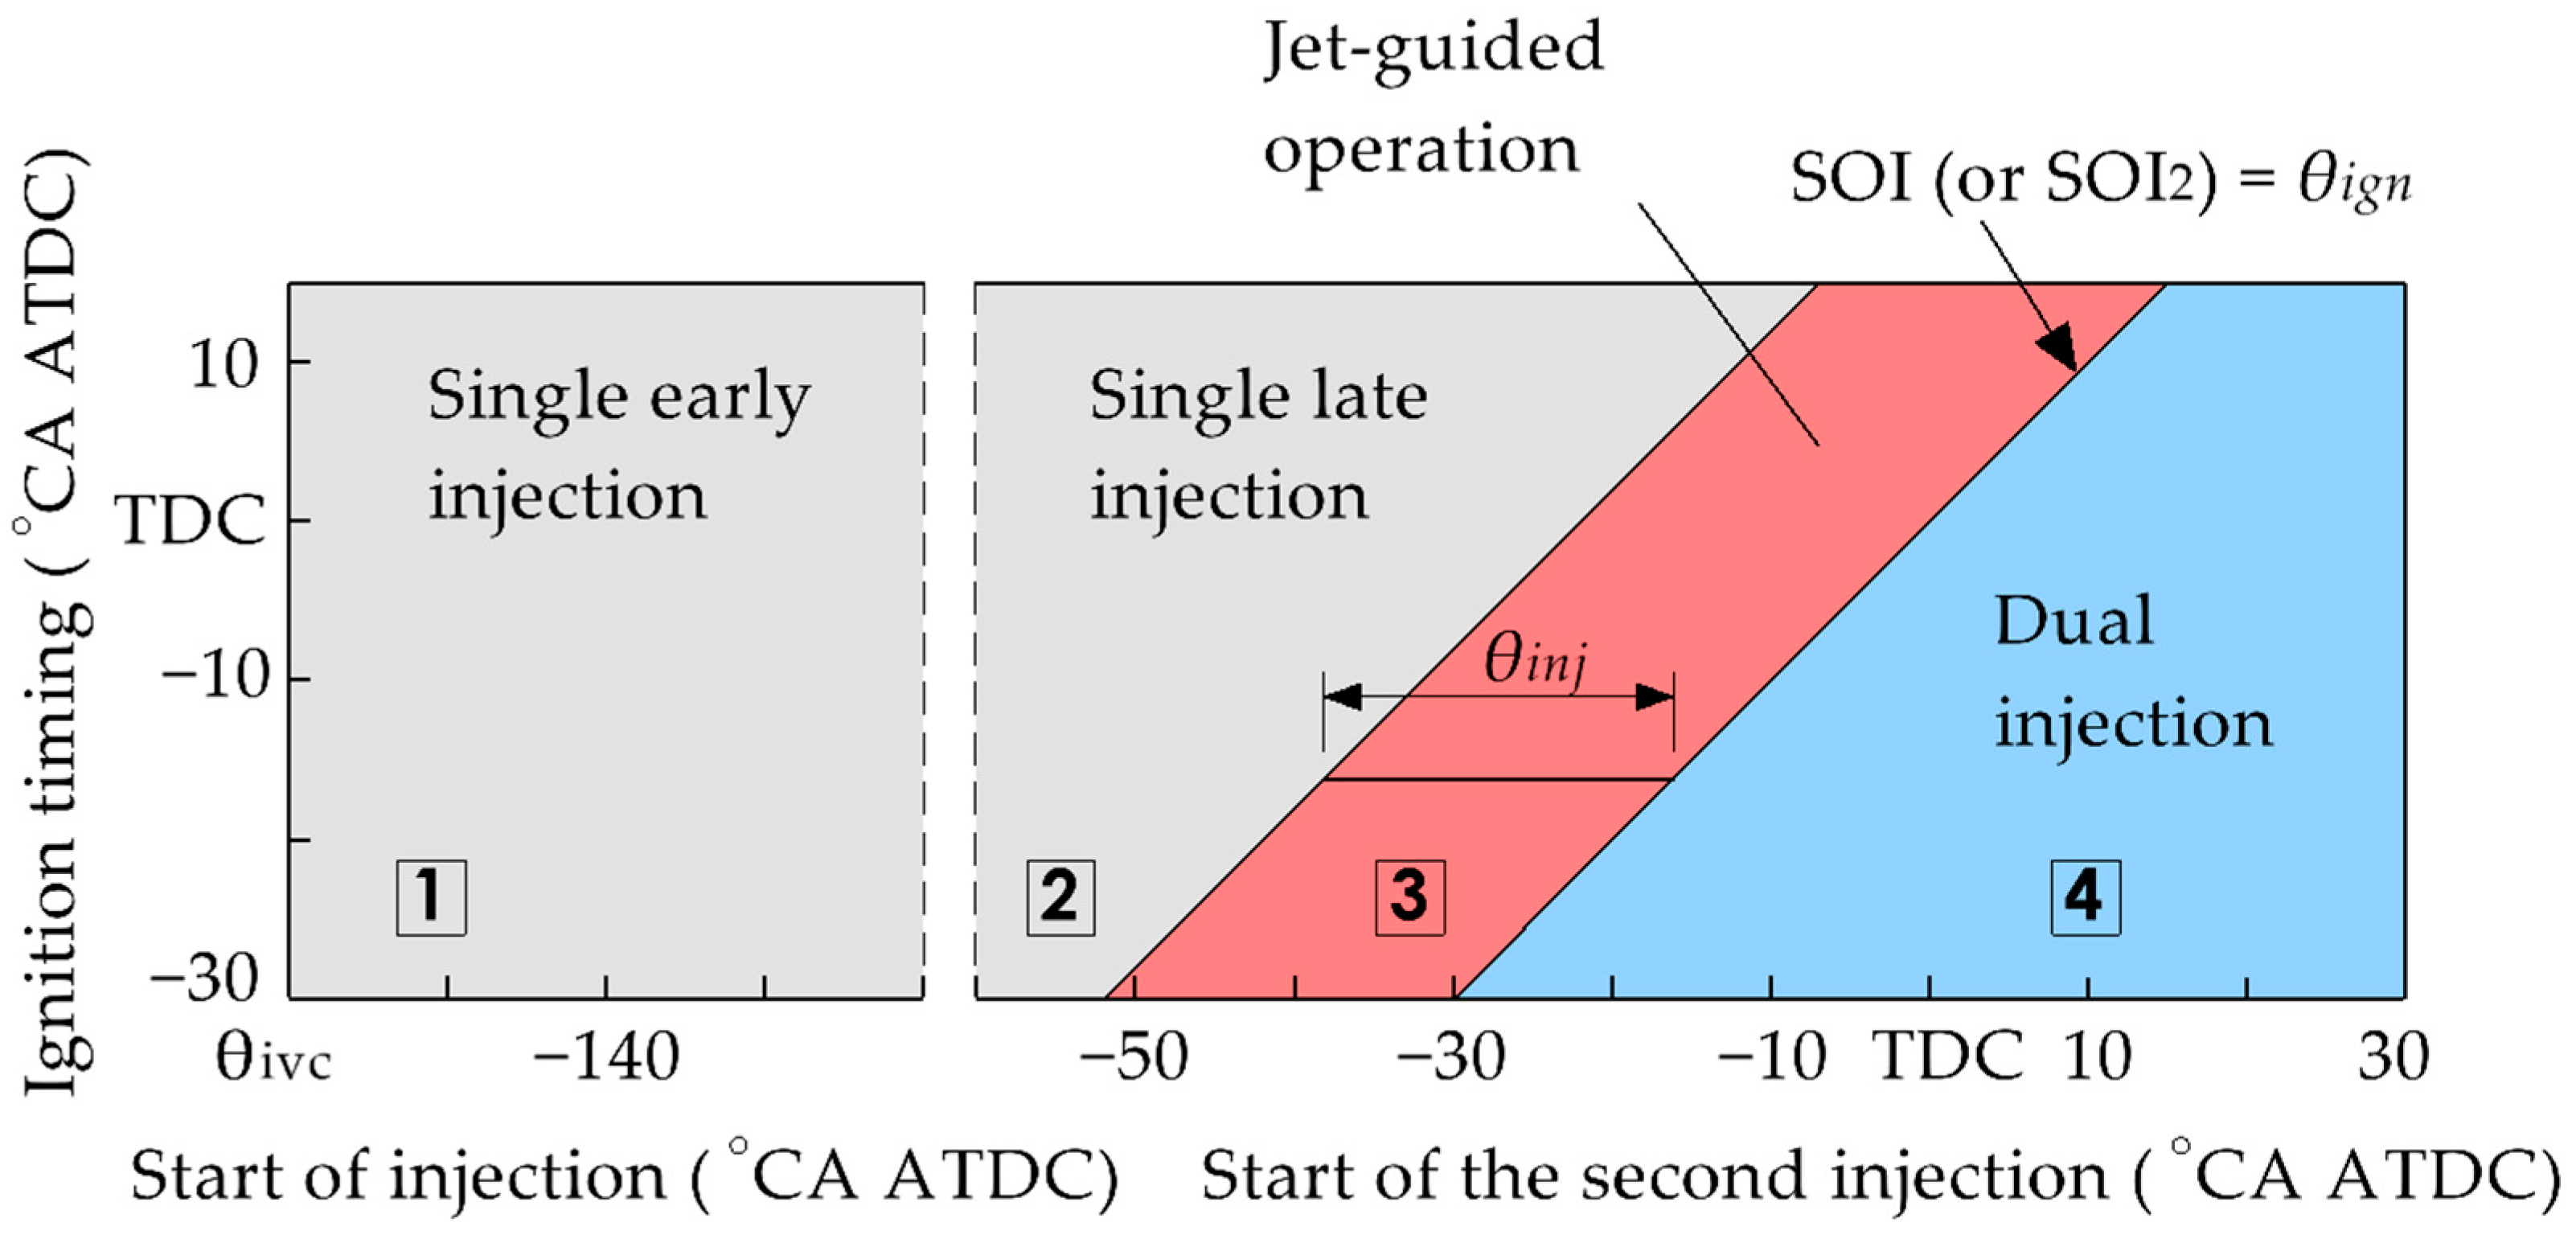
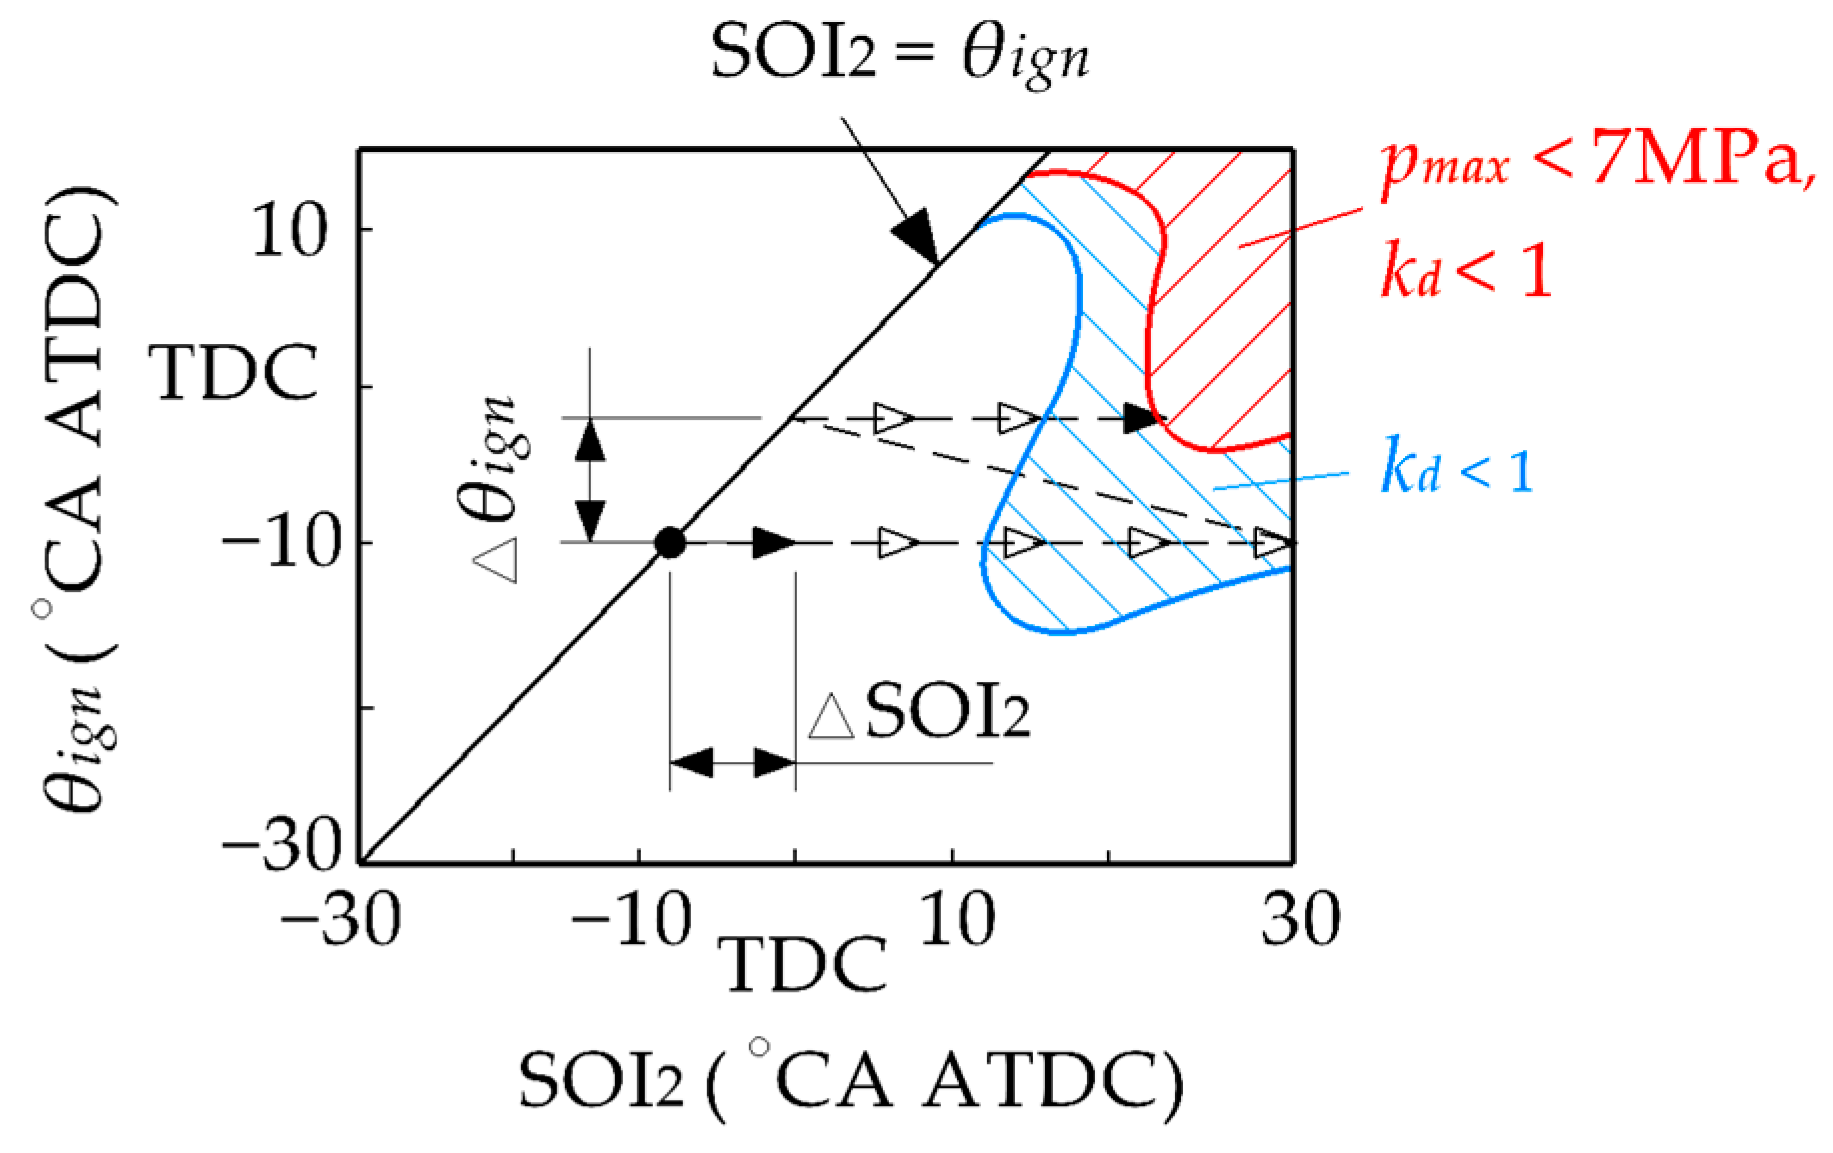
The injection and ignition parameters varied in the research are presented in Table 3. As shown, in all studied strategies, the start of injection and ignition timing are set. The scheme for determining the start(s) of injection and ignition timing for different injection strategies is shown in Figure 4. The combined effect of these two parameters can be evaluated by plotting contour lines of equal engine parameter values in the SOI (or SOI2 for dual injection) versus θign map. Applicability zones for different injection strategies in such a map are shown in Figure 5. The engine parameters investigated include BTE, ITE, maximum cylinder pressure pmax, knock criterion kd, and gas temperature before the turbine inlet TT.

Table 3.
Hydrogen Injection and Ignition Parameters.
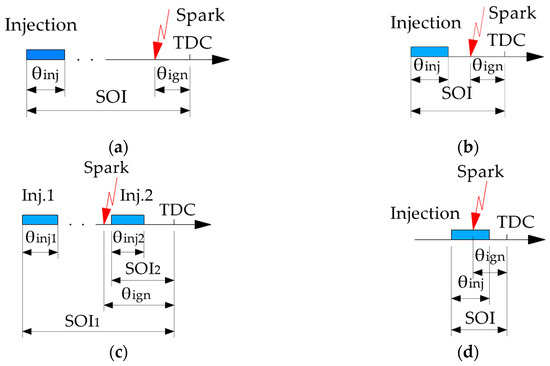
Figure 4.
Diagram for determining the start(s) of injection and ignition timing: (a) early single injection; (b) late single injection; (c) dual injection; (d) jet-guided operation.
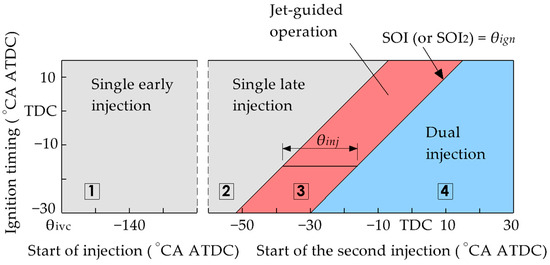
Figure 5.
Applicability zones of injection strategies: 1—Single early injection. 2—Single late injection. 3—Jet-guided operation. 4—Dual injection.
In the studies of injection strategies, the ignition timing is varied from −30 °CA ATDC to 15 °CA ATDC in 5° CA increments. The start of injection is varied from the intake valve closing timing (θivc) to 15 °CA ATDC, also in 5° CA increments.
In the case of dual injection, the start of the second injection depends on the ignition timing. Typically, the second injection either coincides with the ignition (along the line SOI2 = θign) or occurs with some delay [7,11,13]. Therefore, in this study, it is assumed that the second injection takes place in the region to the right of the SOI2 = θign curve (see Figure 5).
In dual injection, the mass share of the second injection is significantly less than that of the total fuel supply, which allows the maximum delay of SOI2 to be extended up to 30 °CA ATDC. During the investigation of dual injection, the start of the first injection is varied from the intake valve closing timing to −40 °CA ATDC, and the ratio of the first to the second injection ranges from 100%/0% to 40%/60%.
Jet-guided operation involves ignition occurring during the fuel injection. At high injection pressures and for the selected injector flow area of the studied engine, the injection duration θinj is relatively short. For example, under conditions of λ = 1 and BMEP = 1.73 MPa, the injection duration is approximately 29° CA. Therefore, the region on the SOI(SOI2) versus θign diagram (see Figure 5) where this strategy is feasible represents a relatively narrow band, bounded on one side by the line SOI = θign and on the other by SOI = θign − θinj.
The study of combustion characteristics, indicator diagrams, and engine parameters within the SOI (SOI2) versus θign map under various engine operating conditions made it possible to identify optimal injection parameters for different strategies.
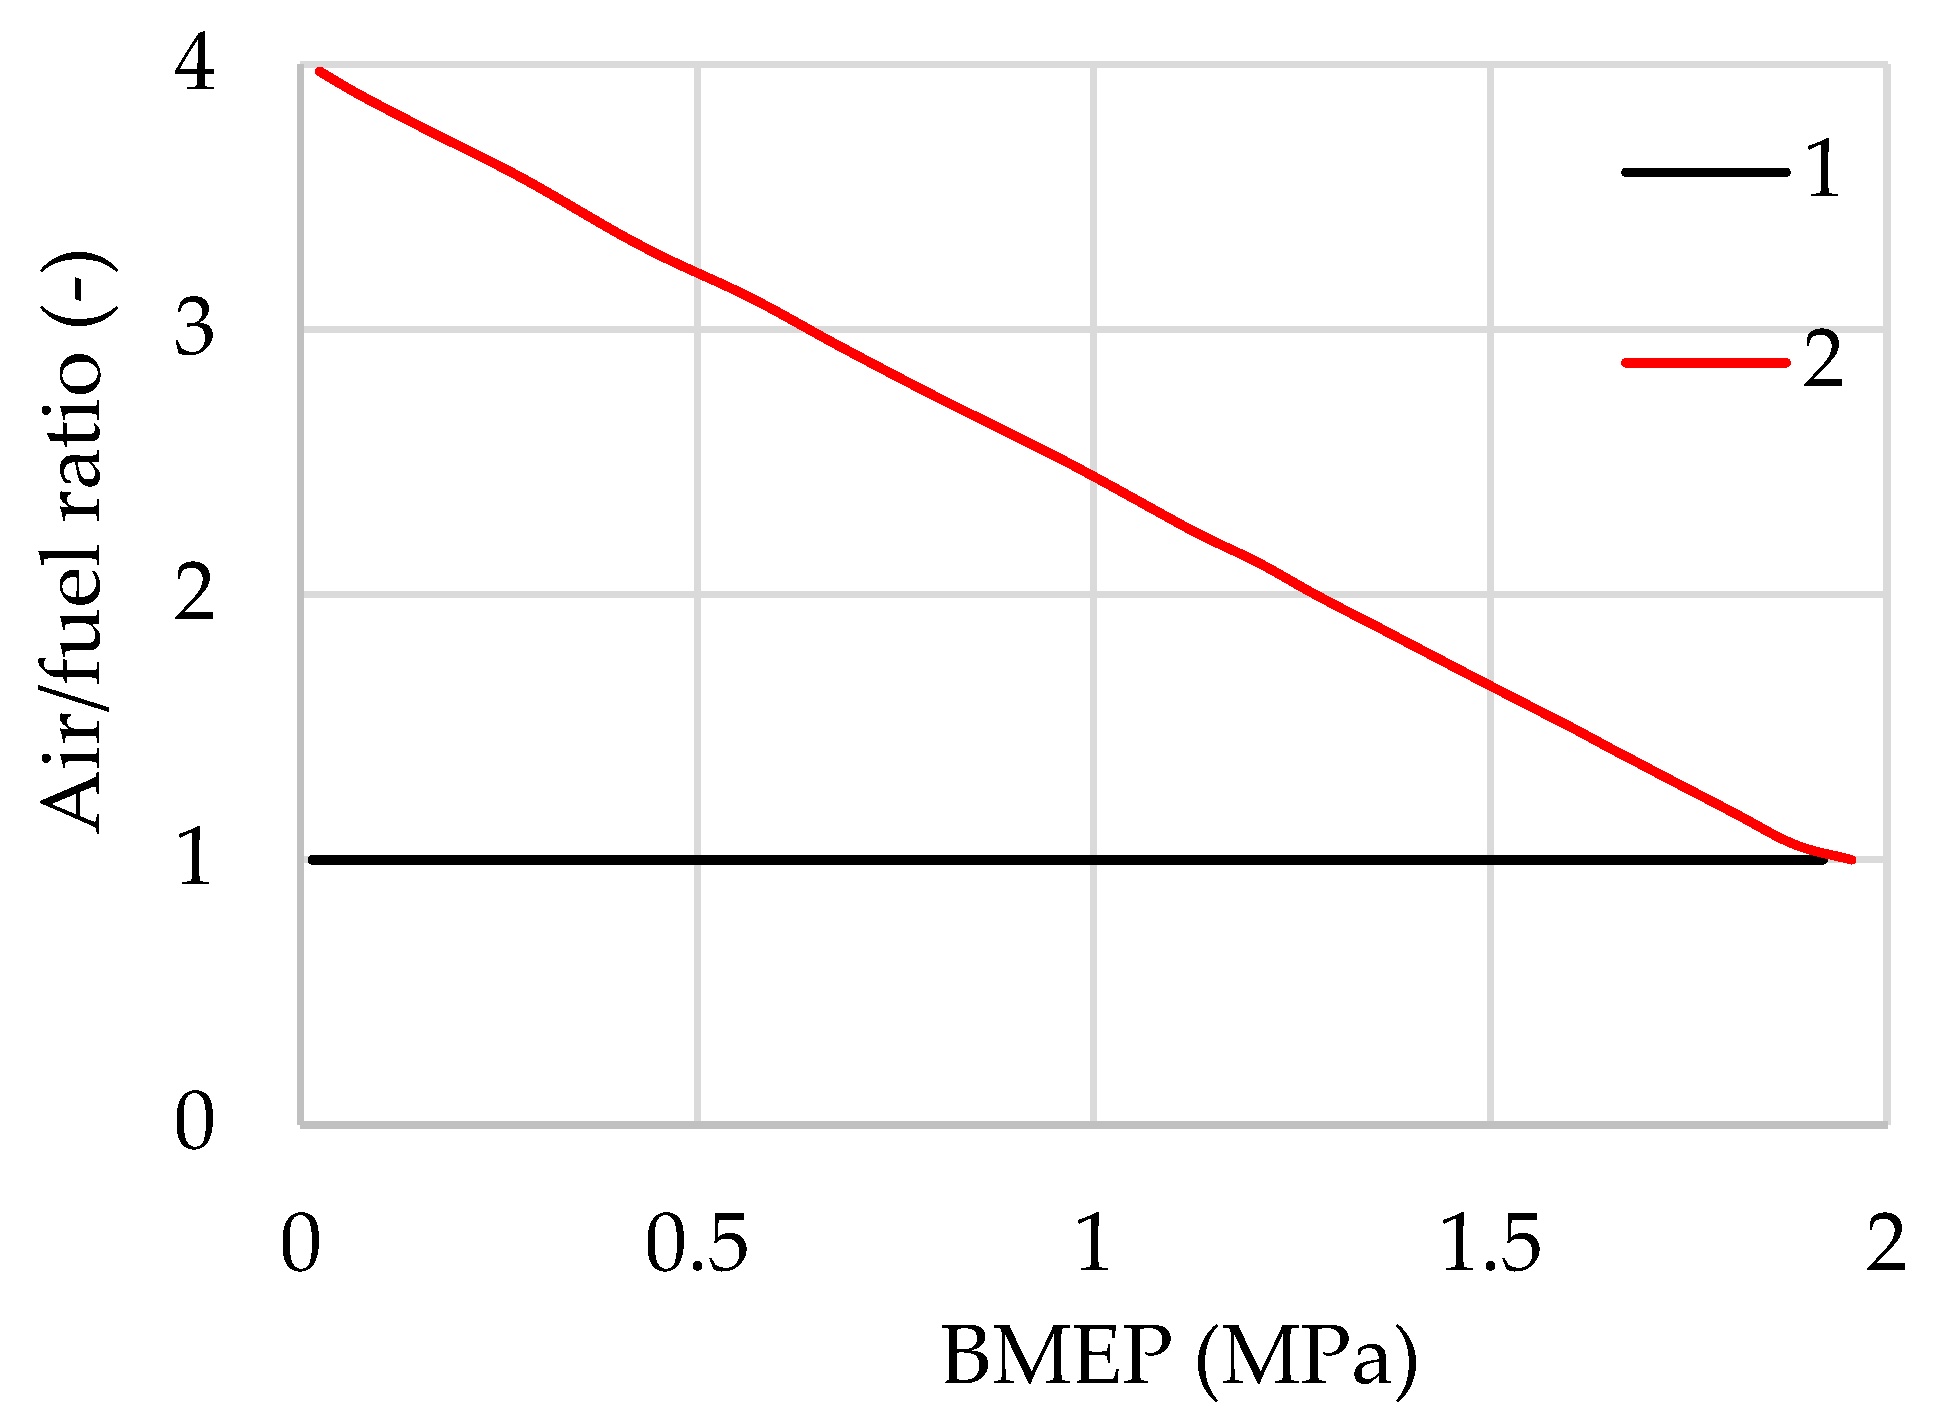
Based on the selected combinations of ignition timing and start of injection (start of the second injection), the engine performance is determined across the operating modes at a constant speed of 2000 rpm and load from zero to 1.95 MPa. This investigation is carried out in conjunction with two of the most common strategies for mixture formation: maintaining a constant stoichiometric air/fuel ratio across all operating modes (Figure 6, curve 1), and using a variable air/fuel ratio (Figure 6, curve 2). In the first strategy, at low and medium loads, the mixture composition is controlled quantitatively using the throttle valve. At high loads, the mixture composition is regulated by controlling airflow via the compressor through exhaust gas bypass around the turbine. In the second strategy, at low and medium loads, the throttle valve is mostly open, and is only partially closed at very low loads to avoid exceeding a λ value of 4. In this case, the upper limit of λ variation was restricted to 4, since further increases lead to a significant rise in combustion duration and incomplete combustion losses [4,11,14].
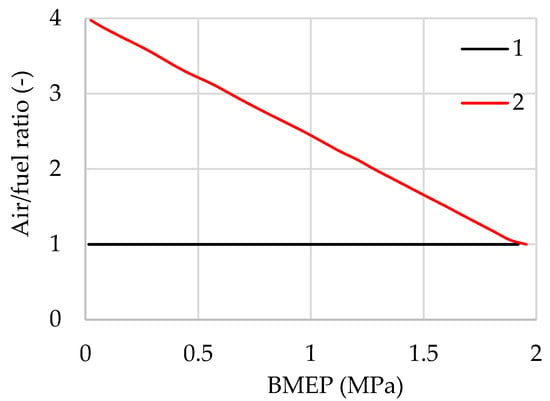
Figure 6.
Mixture composition under strategies with λ = 1 (curve 1) and λ = var (curve 2) at an engine speed of n = 2000 rpm.
When applying the mixture composition strategy with λ = 1, it is possible to use all selected ratios of the first to the second injection within the range from 100%/0% to 40%/60%, respectively. However, some limitations must be noted when using dual injection under the λ = var strategy. These limitations are related to the inefficiency of combustion of excessively lean mixtures. Thus, the mixture composition in the cylinder at the end of the first injection is given by
where λ is the mean air/fuel ratio in the cylinder after the end of the second injection, and rI1 is the mass share of the first injection in the total fuel supplied per cycle. The boundary value of λ1 used in this work is defined as 4 (λ1b = 4). In this case, reliable engine operation under the λ = var strategy is ensured when the following condition is met:
For example, in the case of an 80%/20% ratio of the first to the second injection, dual injection is applicable at operating points with λ < 3.2; for a 60%/40% ratio—at λ < 2.4; and for a 40%/60% ratio—at λ < 1.6.
3. Results and Discussion
3.1. Influence of Injection and Ignition Parameters on Combustion
3.1.1. Single Early and Late Injection
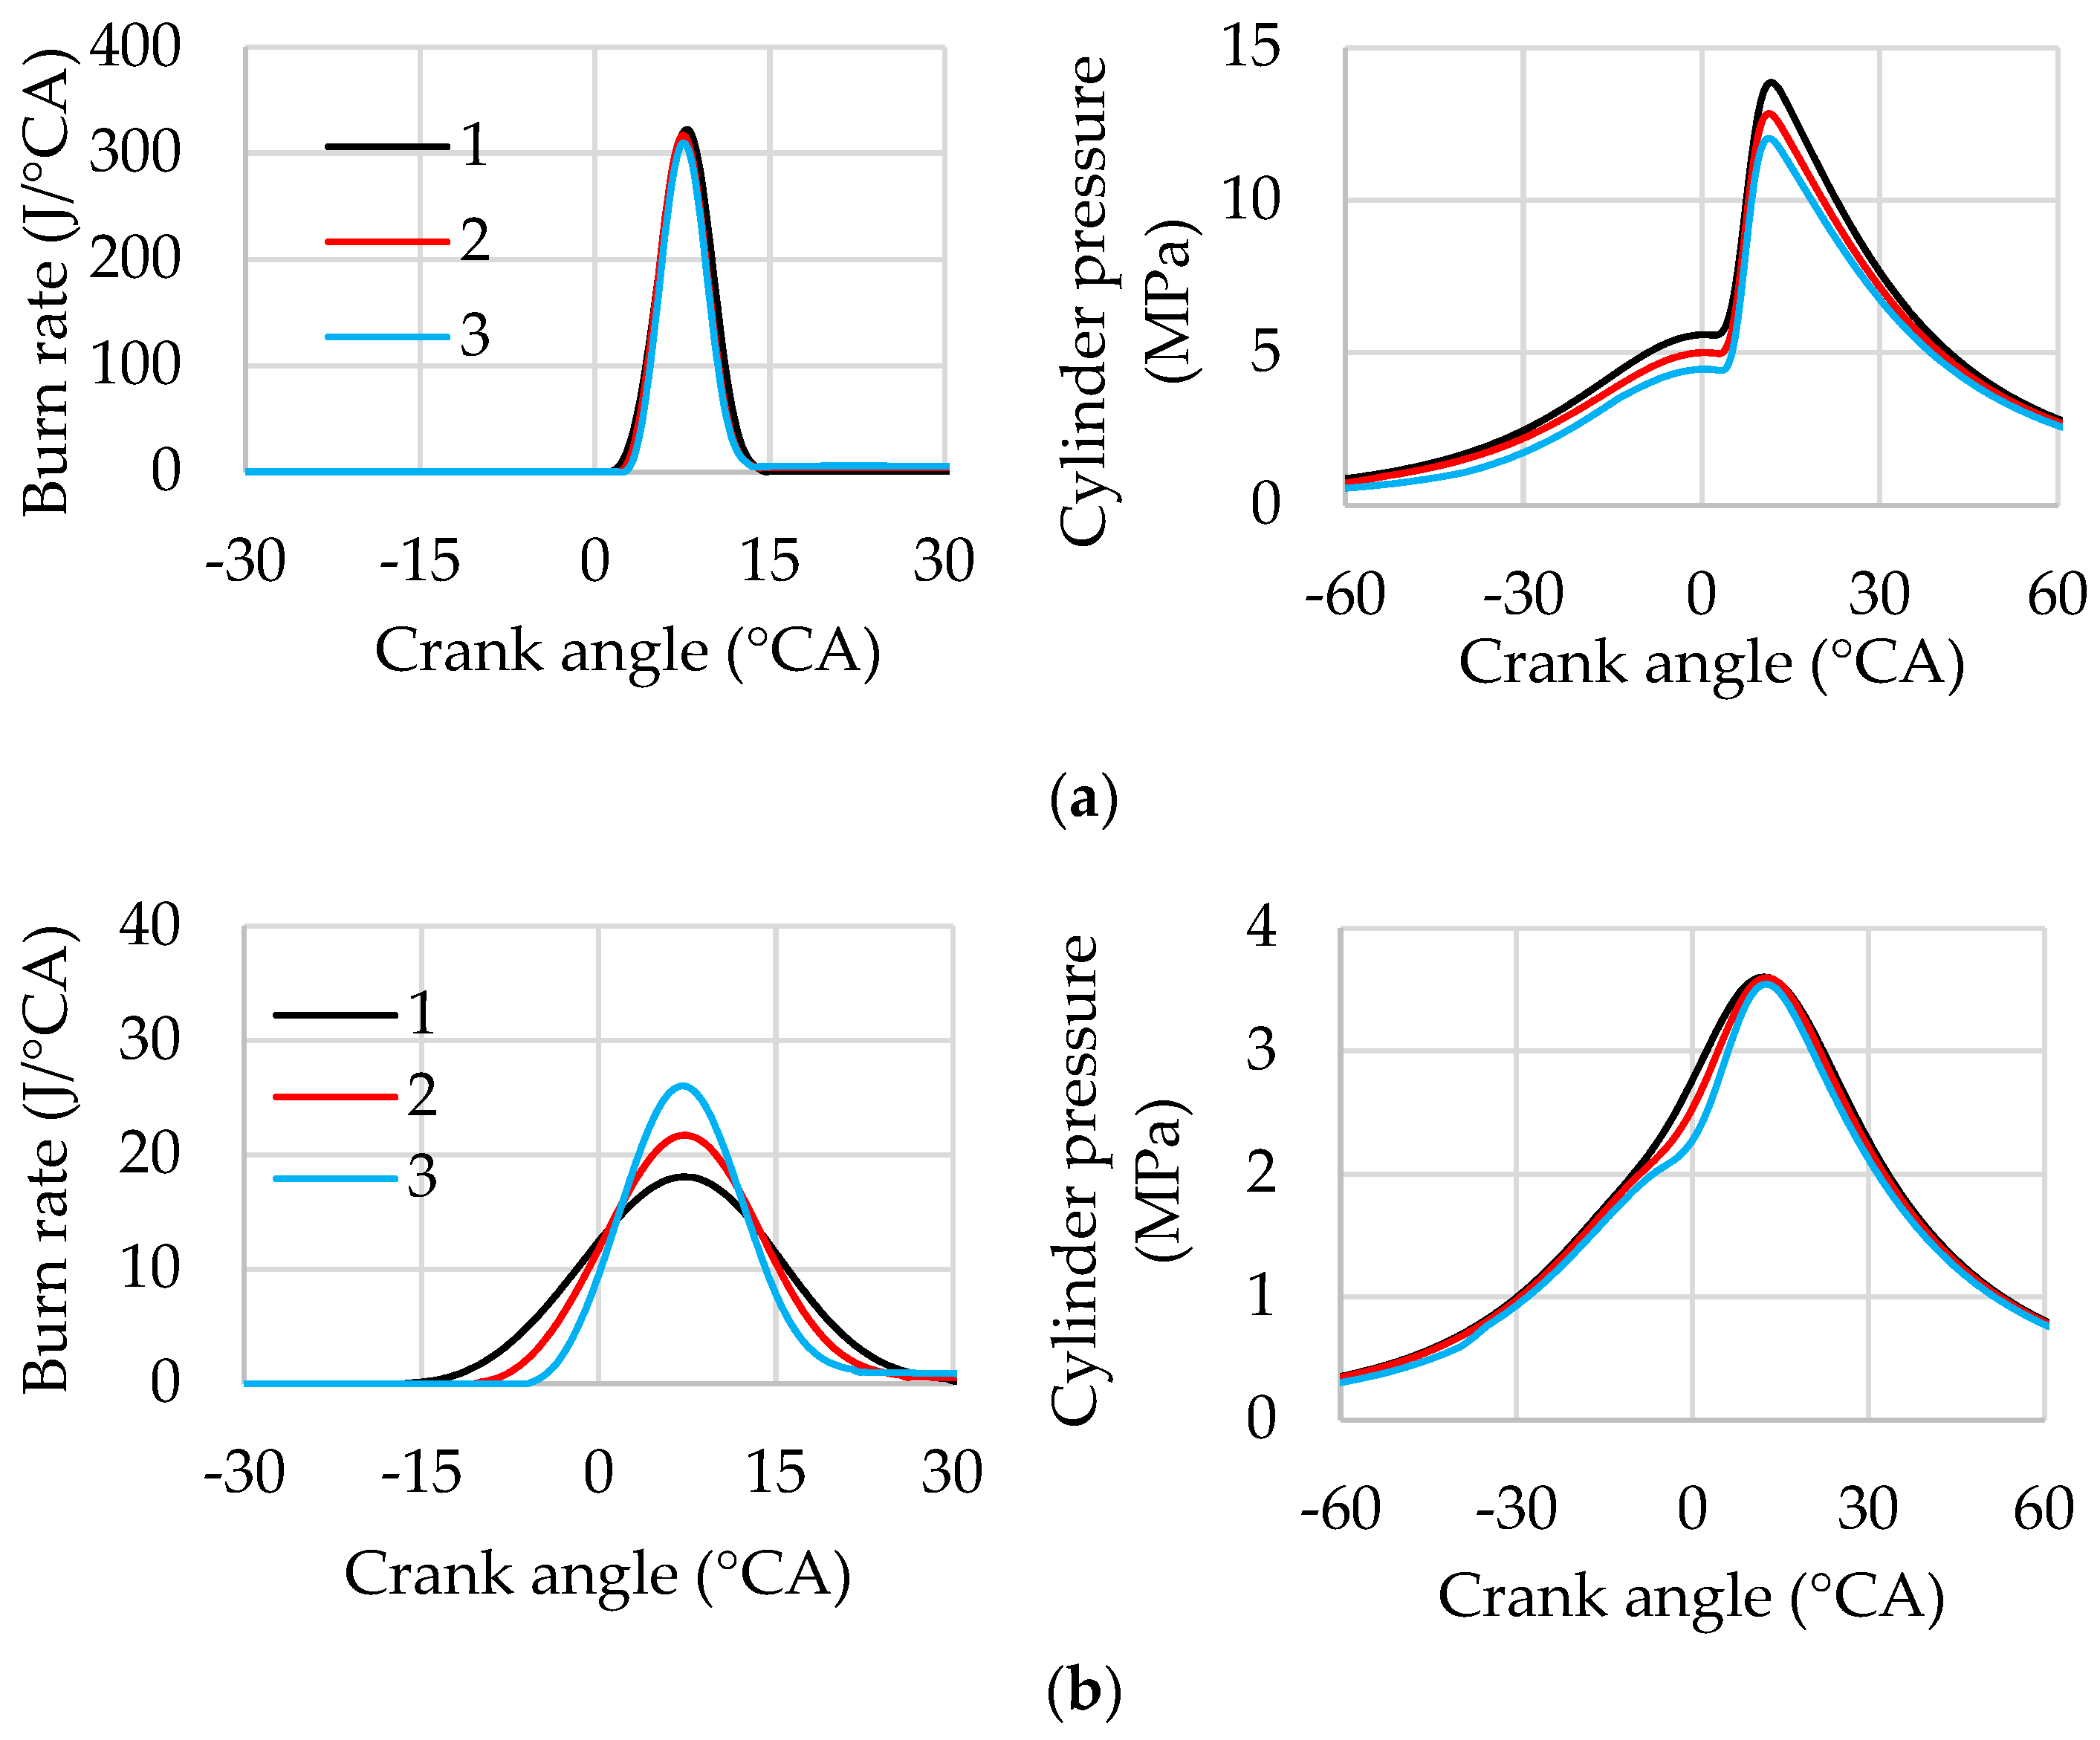
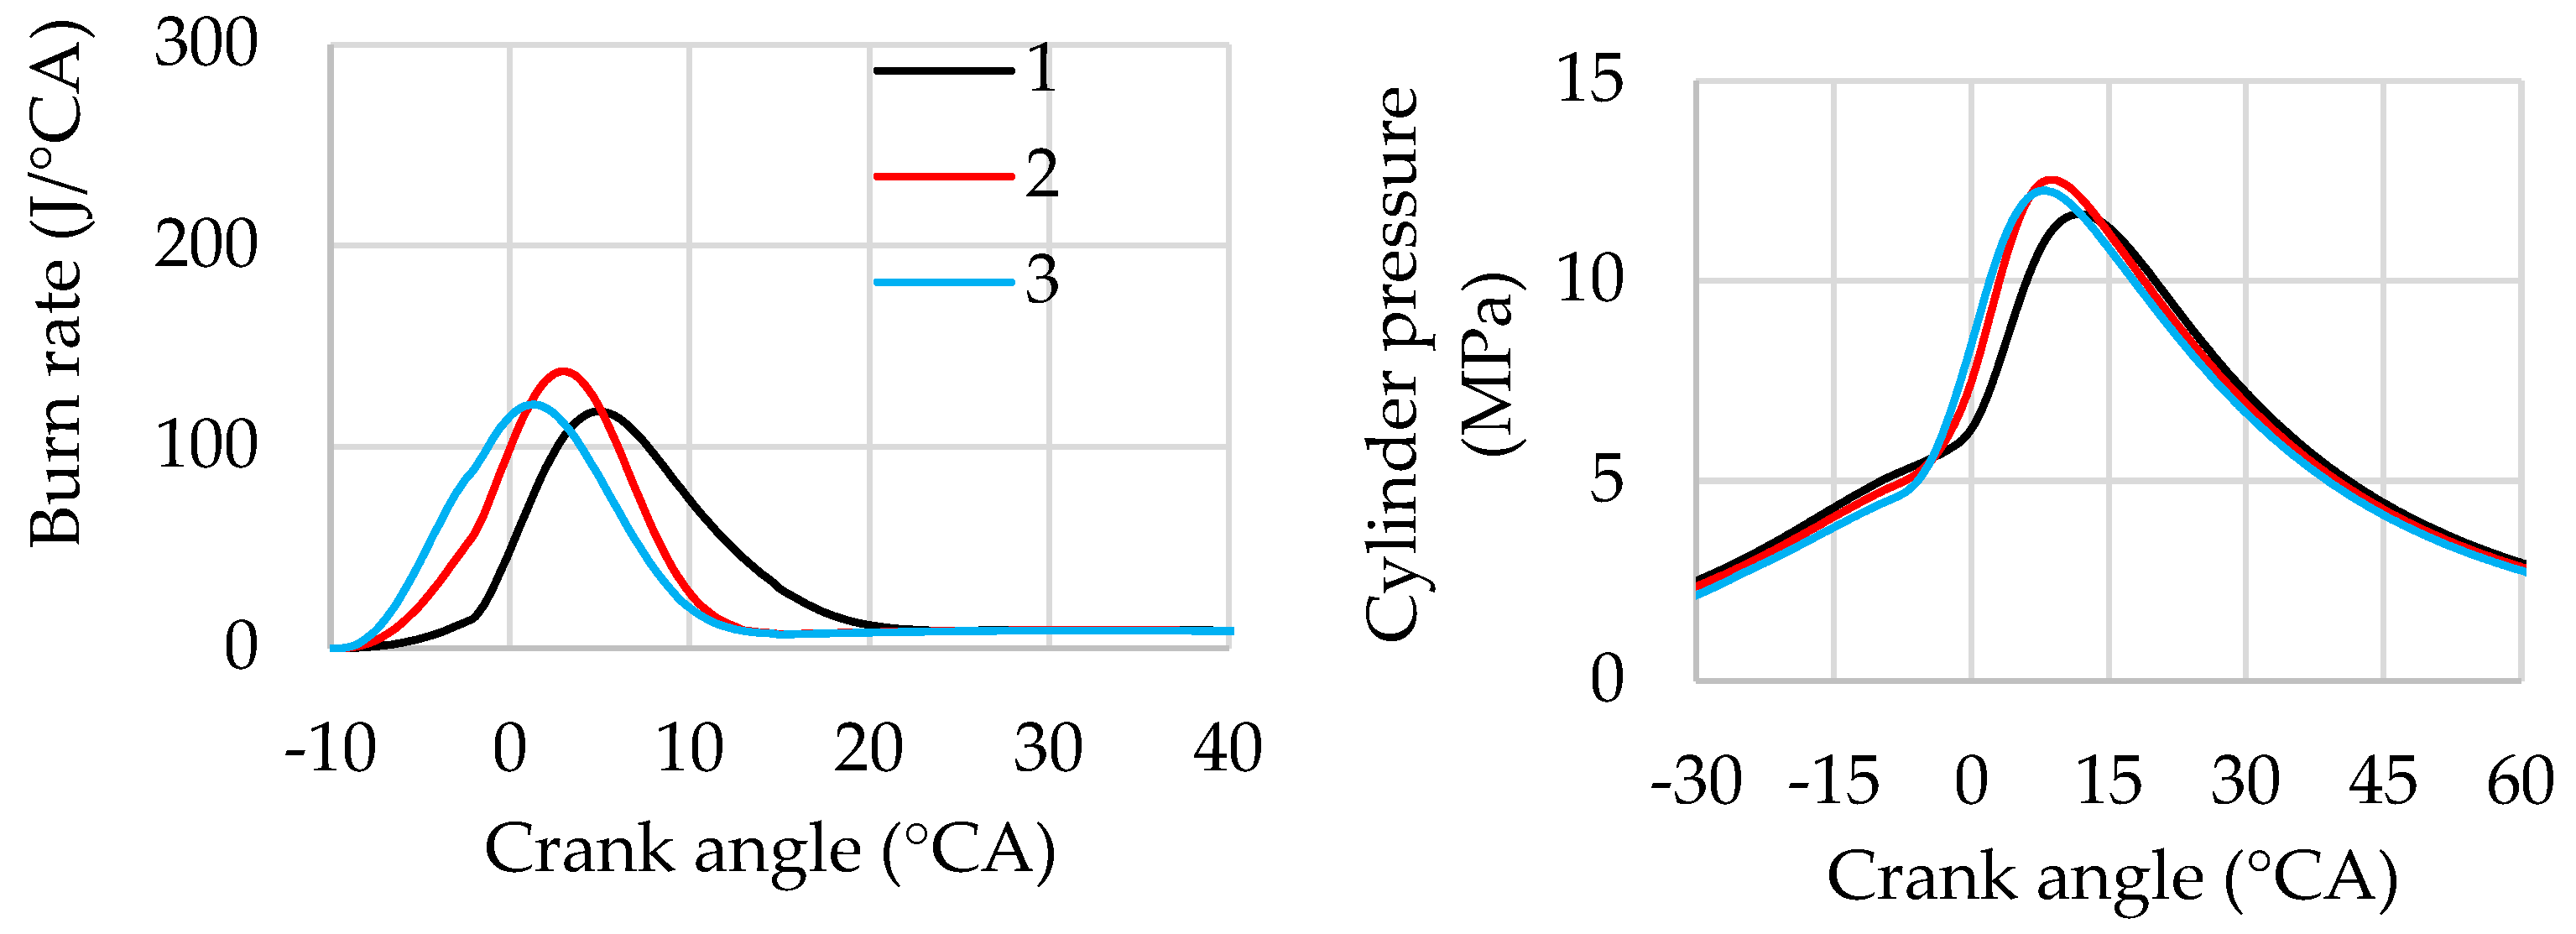
Figure 7 presents burn rate characteristics and indicator diagrams for operation with a homogeneous mixture (curve 1) and stratified mixtures (curves 2 and 3) under both high- and low-load conditions. The ignition timing is selected to ensure an MFB50 of 8 °CA ATDC.
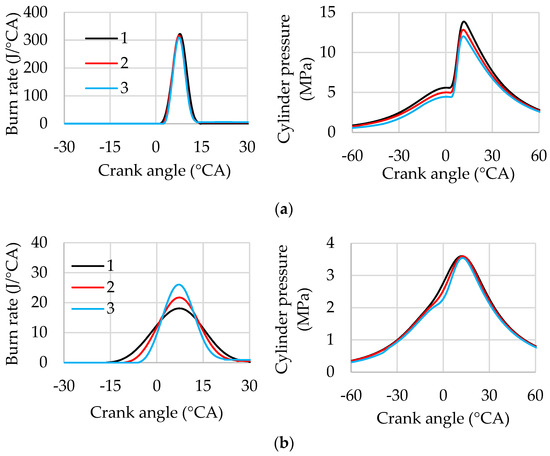
Figure 7.
Influence of injection timing on burn rate and cylinder pressure: (a) λ = 1, BMEP = 1.73 MPa; (b) λ = 3.52, BMEP = 0.31 MPa. 1—SOI = −162 °CA ATDC, 2—SOI = −80 °CA ATDC, 3—SOI = −40 °CA ATDC. n = 2000 rpm.
Under high-load conditions with λ = 1, the stratification of the mixture results in a relatively small reduction in combustion duration of approximately 1.5–2.5° CA (Figure 7a). At the same time, the proportion of fuel burned in lean mixture regions increases slightly. A similar trend is observed under high-load conditions with the λ = var strategy, as well as under low-load conditions with the λ = 1 strategy.
When applying the λ = var strategy and reducing the engine load, the air/fuel ratio increases, which leads to a more significant difference in combustion duration between homogeneous and stratified mixtures. Figure 7b shows that the combustion duration decreases from 46° CA for the homogeneous mixture to 36° CA–27° CA for the stratified mixtures.
When operating the engine under the same load, late injection results in lower cylinder pressures during the compression and expansion strokes compared to early injection. With late injection, a smaller gas volume is compressed in the cylinder over most of the piston stroke, leading to lower compression pressures and reduced compression losses. As a result, the pressure during the expansion stroke is reduced to provide the same BMEP.
3.1.2. Dual Injection
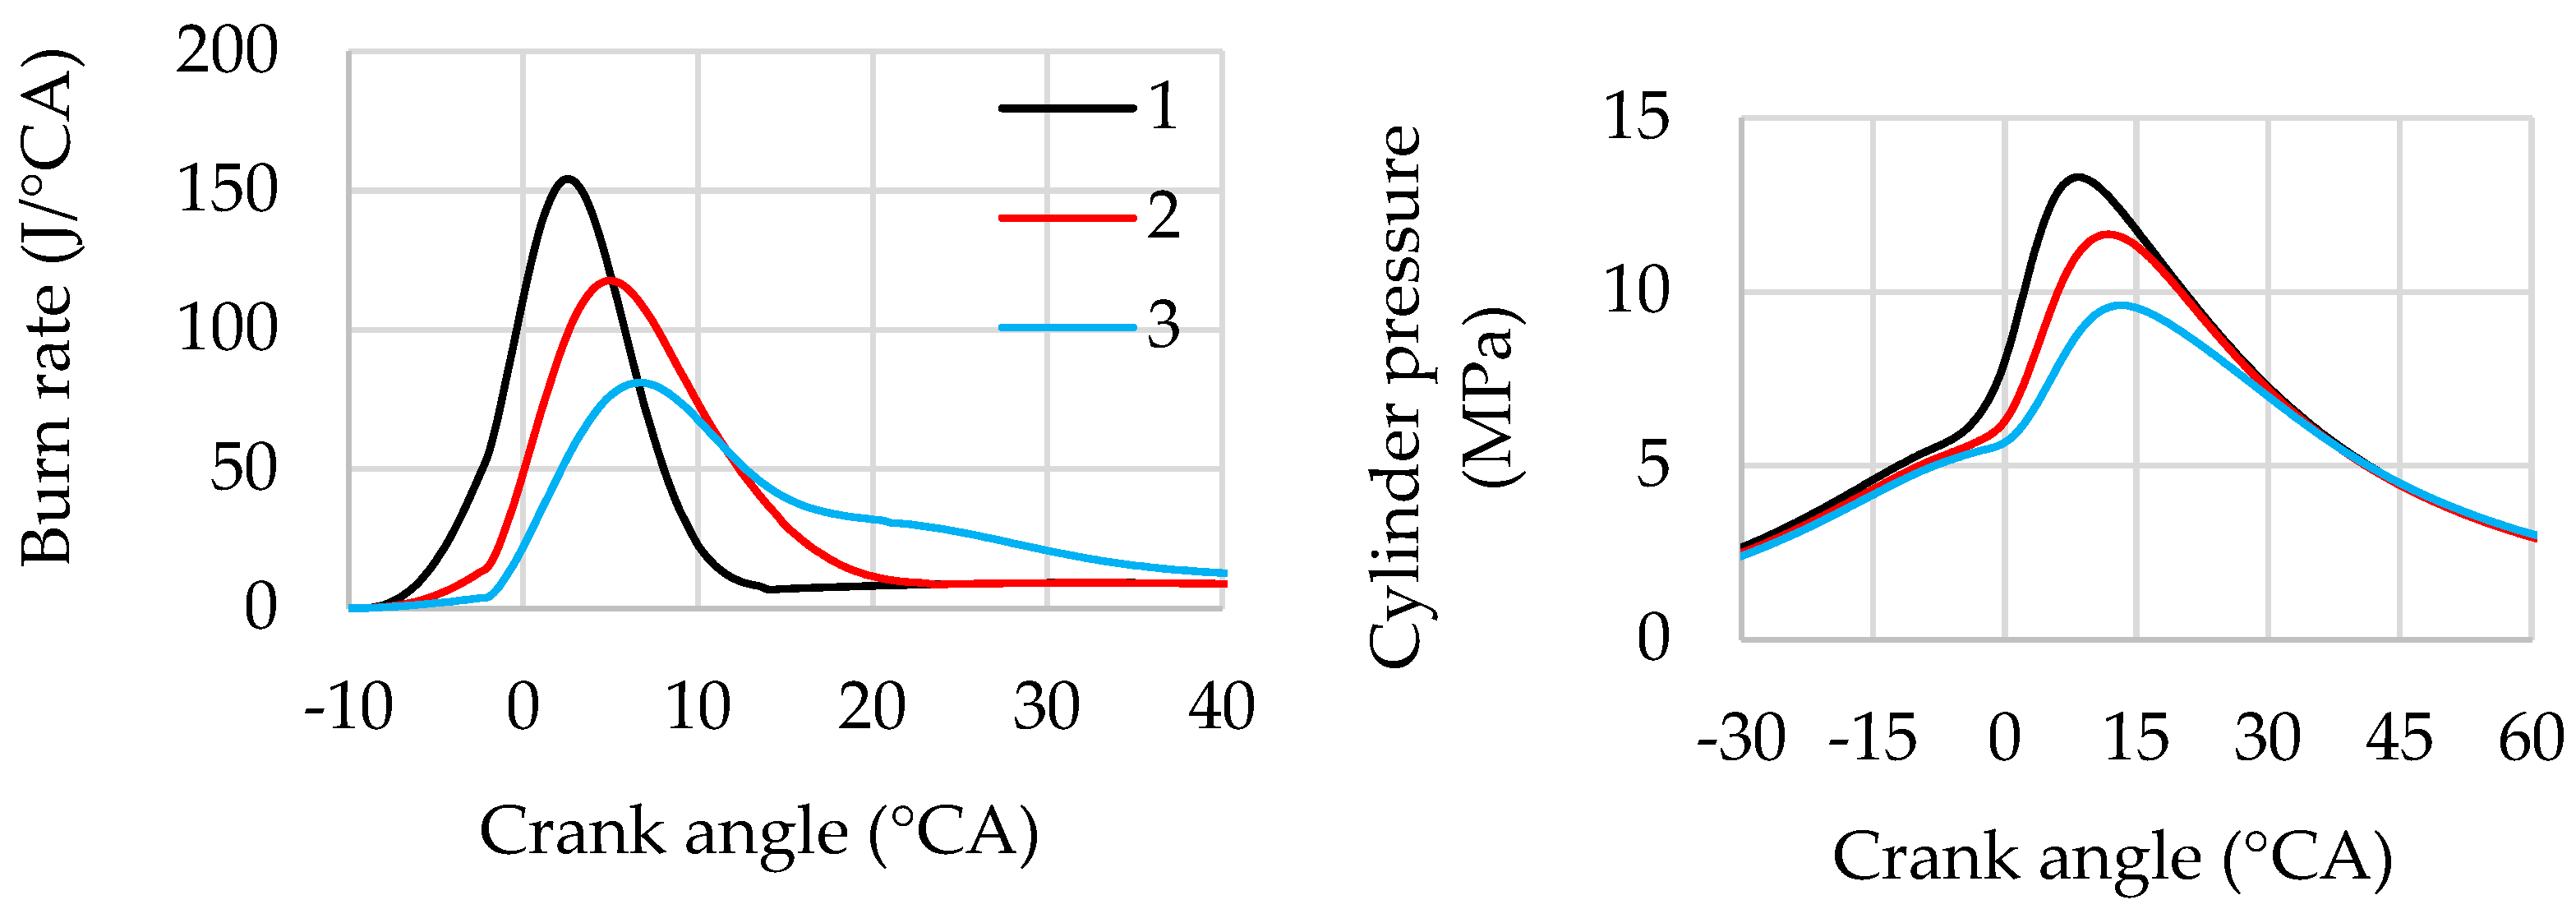
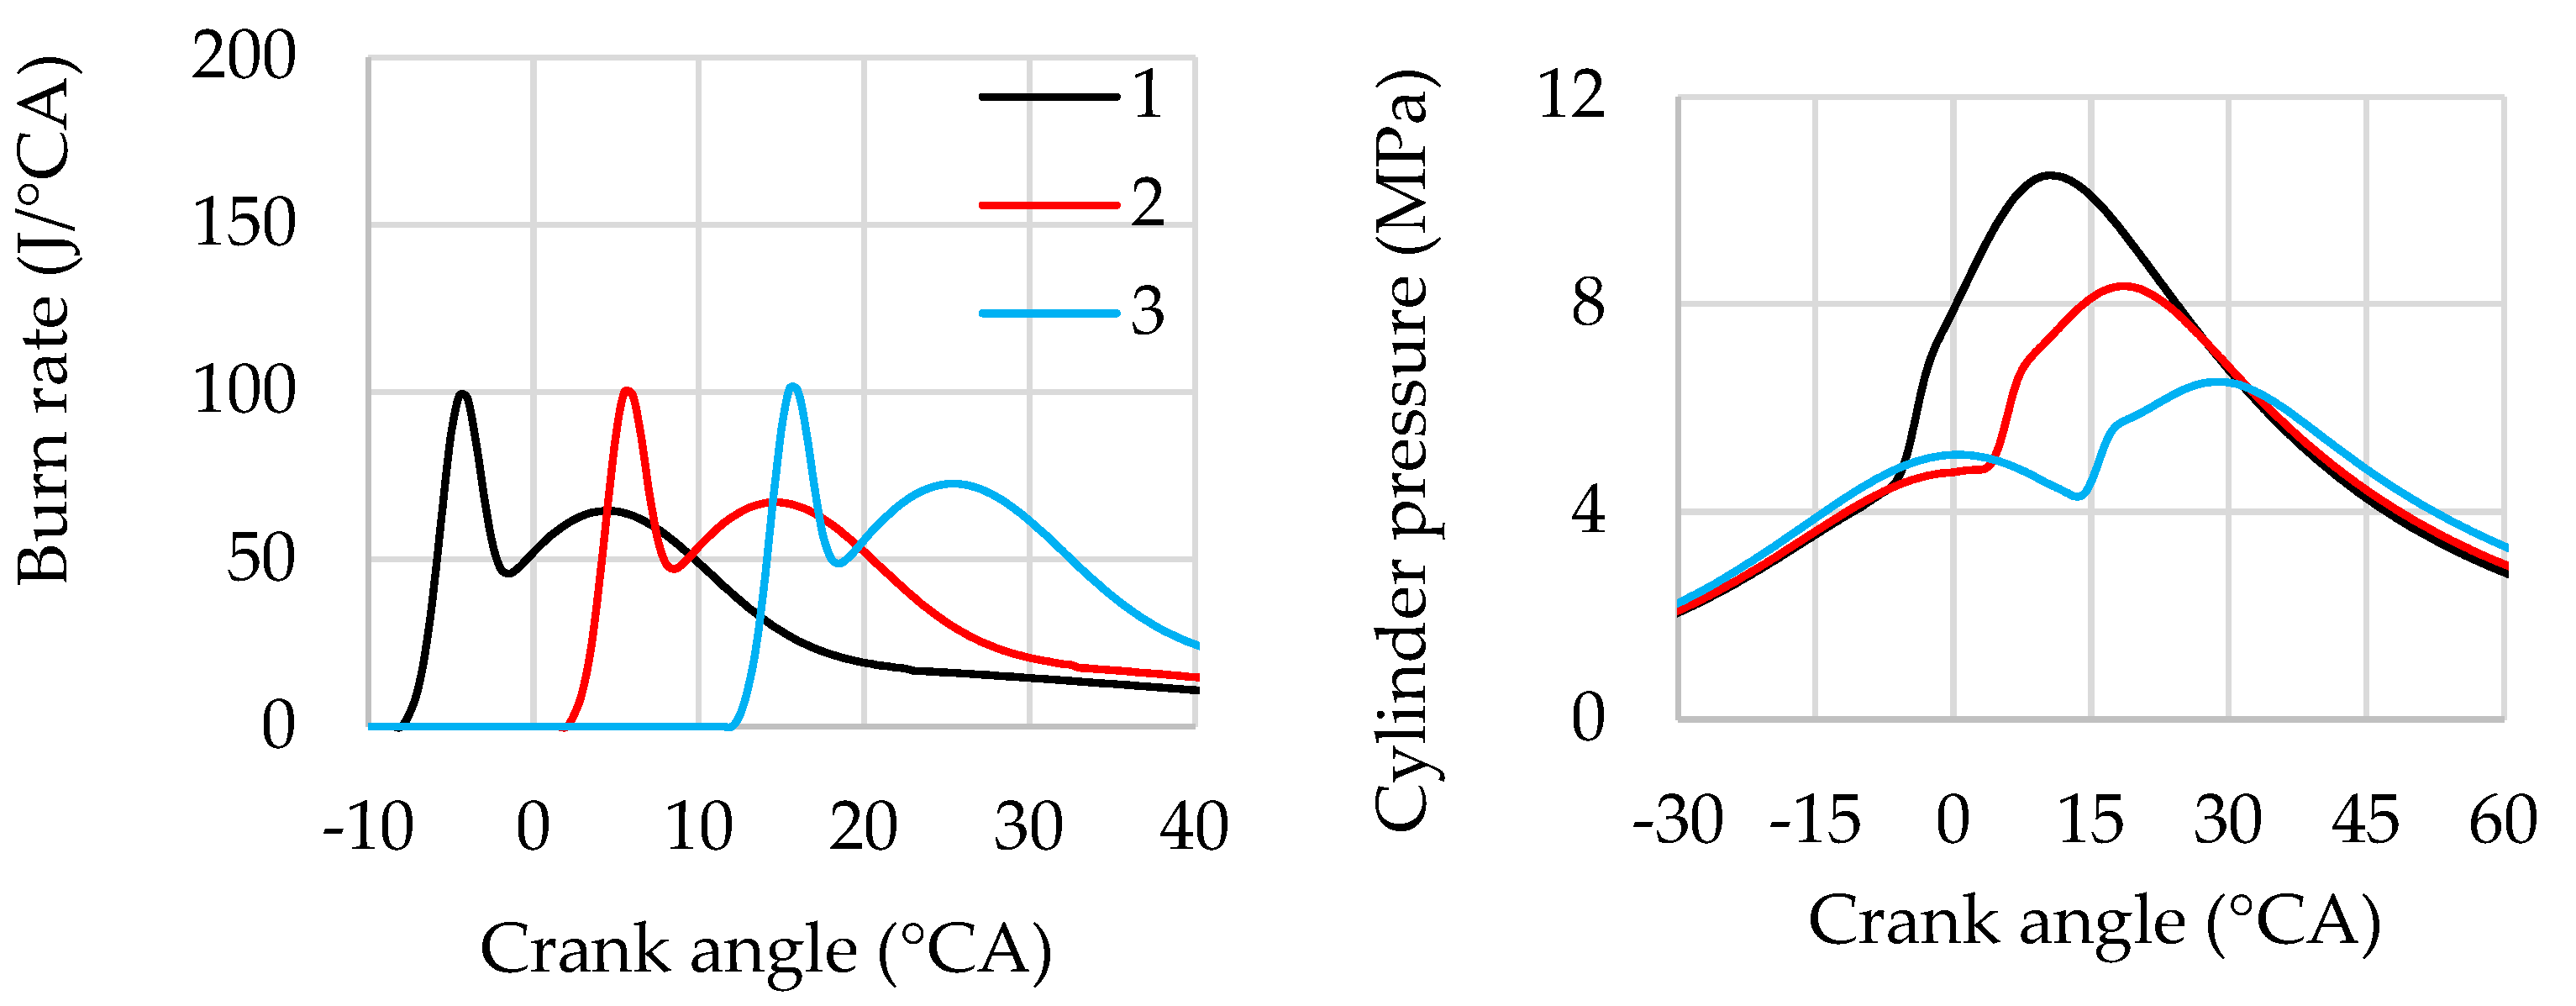
The influence of the ratio of the first to the second injection on the heat release characteristics and cylinder pressure at a high-load mode is shown in Figure 8. In this case, the first injection is set to occur relatively early, at −162 °CA ATDC, and the second injection is delayed by 8° CA after the ignition timing of −10 °CA ATDC.
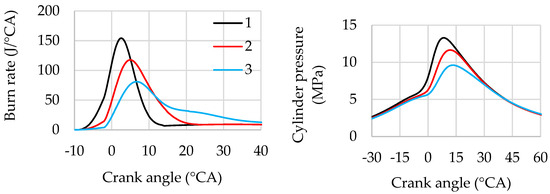
Figure 8.
Influence of the ratio of the first injection to the second injection on burn rate and cylinder pressure: 1—rI1/rI2 = 80%/20%, 2—rI1/rI2= 60%/40%, 3—rI1/rI2 = 40%/60%, λ = 1, BMEP = 1.73 MPa, θign = −10 °CA ATDC, SOI1 = −162 °CA ATDC, SOI2 = −2 °CA ATDC, n = 2000 rpm.
It can be observed that reducing the share of fuel in the first injection from 80% to 40% leads to a 50% reduction in the peak burn rate and an increase in the proportion of fuel burning at a relatively low rate. This is due both to significant mixture leaning by the end of the first injection and to a prolonged diffusion combustion phase. The reduced share of the first injection results in lower cylinder pressure during the compression process. As a result, the peak cylinder pressure decreases by approximately 40%.
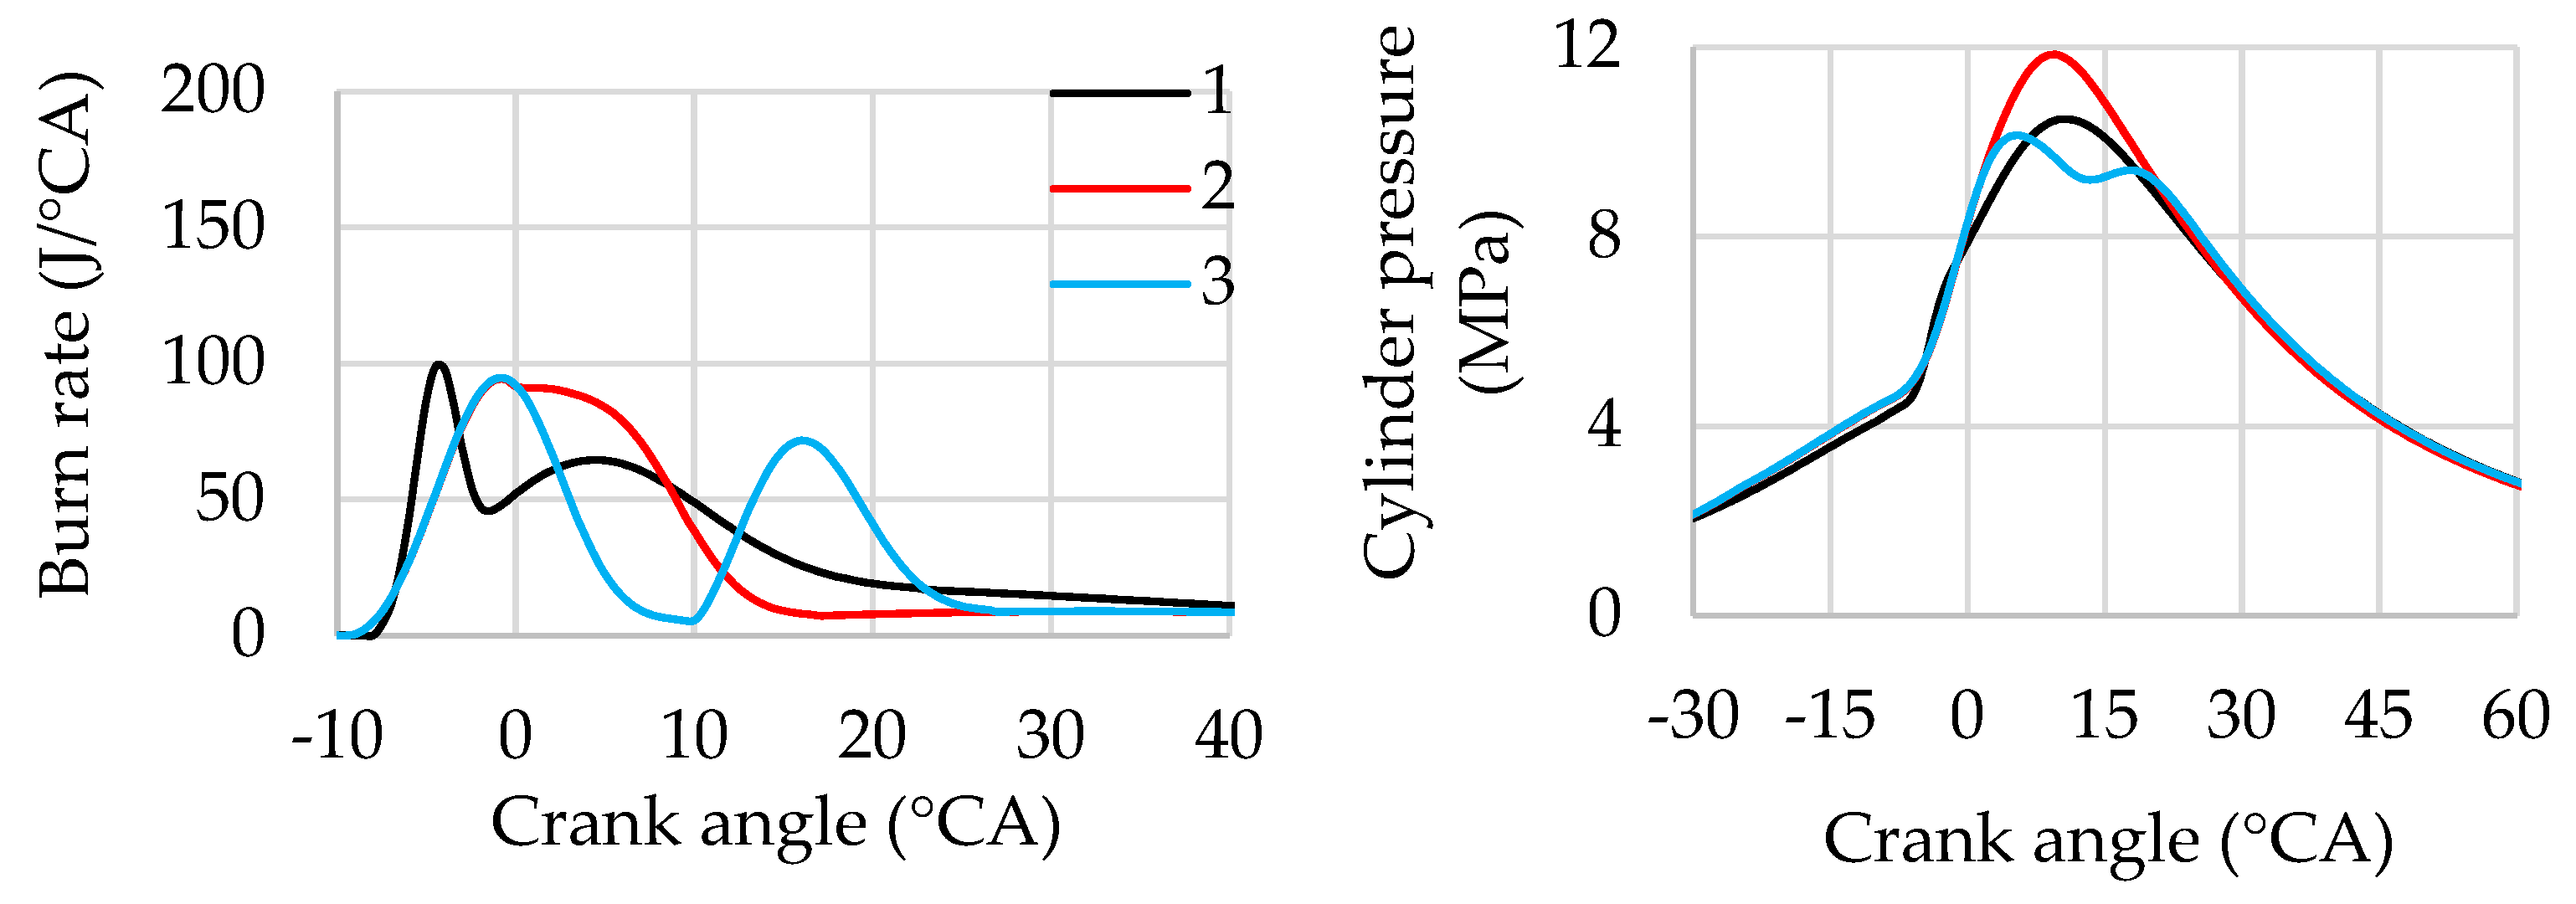
The influence of changing the start of the first injection on combustion at a high-load mode is shown in Figure 9. In this case, the ratio of the first to the second injection is chosen as 60%/40%, the ignition timing is set to −10 °CA ATDC, and the start of the second injection is fixed at −2 °CA ATDC for all three variations of the start of the first injection.
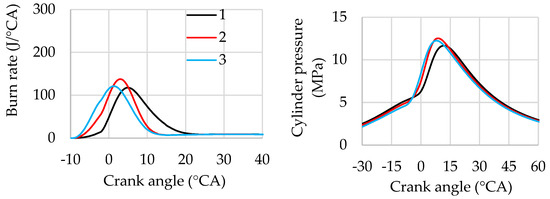
Figure 9.
Influence of the start of the first injection on burn rate and cylinder pressure: 1—SOI1 = −162 °CA ATDC, 2—SOI1 = −80 °CA ATDC, 3—SOI1 = −40 °CA ATDC. SOI2 = −2 °CA ATDC. rI1/rI2 = 60%/40%, θign = −10 °CA ATDC, λ = 1, ВМЕР = 1.73 MPa, n = 2000 rpm.
Figure 9 shows that shifting the start of the first injection closer to top dead centre results in a more intensive burn rate during flame-front combustion and a reduction in overall combustion duration compared to early first injection. In addition, cylinder pressure is reduced, leading to lower compression losses, which positively affects engine performance despite a slight increase in the amount of fuel entering lean mixture zones and burning at a relatively low rate. Notably, the influence of the start of the first injection on the shape of the indicator diagram is not as significant as the effect of other injection parameters considered in this study.
As shown earlier, the start of the second injection and ignition timing in dual injection operation are interrelated. In this study, it is assumed that the start of the second injection occurs at or after the ignition timing. Therefore, when analysing the influence of ignition timing on engine performance, it is necessary to simultaneously adjust the start of the second injection.
Let us consider the influence of ignition timing on the burn rate and cylinder pressure under the condition that SOI2 = θign (Figure 10). In this case, a stoichiometric mixture is used, the ratio of the first to the second injection is chosen as 60%/40%, respectively, and the start of the first injection is set to SOI1 = –162 °CA ATDC.
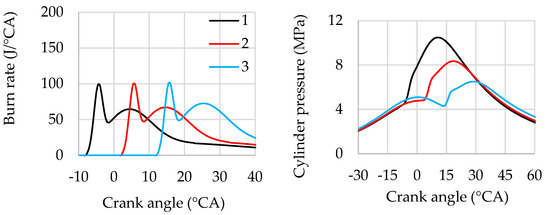
Figure 10.
Influence of ignition timing and the start of the second injection on burn rate and cylinder pressure: 1—SOI2 = θign = −10 °CA ATDC, 2—SOI2 = θign = 0 °CA ATDC, 3—SOI2 = θign = 10 °CA ATDC. rI1/rI2 = 60%/40%, SOI1 = −40 °CA ATDC, λ = 1, BMEP = 1.73 MPa, n = 2000 rpm.
Figure 10 shows that when SOI2 and θign are varied simultaneously, the shape of the burn rate curve does not change but is merely shifted relative to top dead centre. Retarding both injection and ignition leads to a significant reduction in peak cylinder pressure and shifts the combustion further into the expansion stroke. This effect is similar to the influence of ignition timing variation on burn rate during single injection operation.
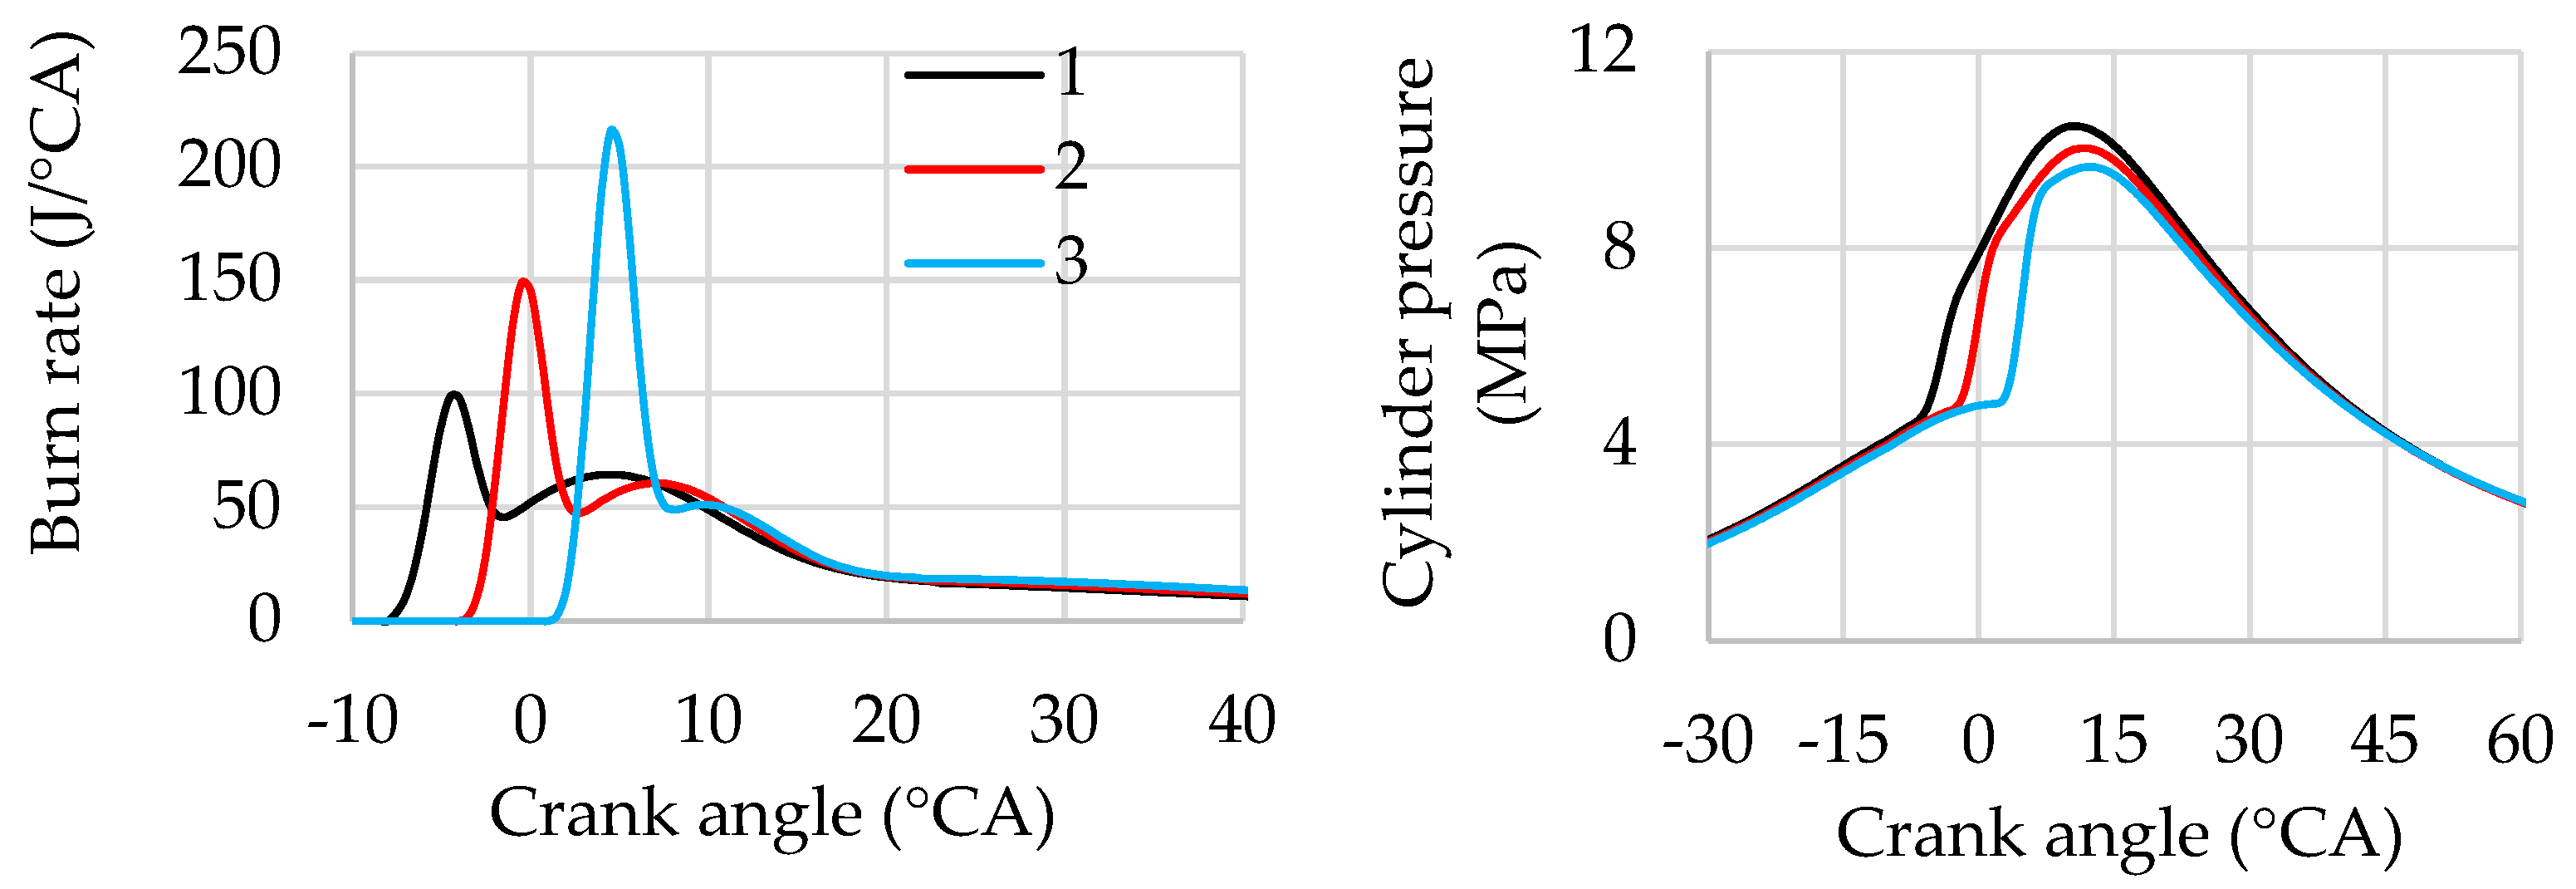
When ignition timing is fixed at −10 °CA ATDC and the start of the second injection is retarded (Figure 11), the burn rate curve changes significantly. As shown, with SOI2 = −10 °CA ATDC, the peak rate of diffusion combustion occurs earlier than the peak of premixed combustion. At SOI2 = 0 °CA ATDC, the peaks of these two combustion phases are close to each other. At SOI2 = 10 °CA ATDC, the diffusion combustion peak occurs later than the premixed combustion peak. As a result, the total burn rate in the cylinder depends on the relative positions of the peak rates of diffusion and premixed combustion. Accordingly, the dependence of peak cylinder pressure on the start of the second injection is more complex than in the case where the start of the second injection and ignition timing are varied simultaneously under the condition SOI2 = θign.
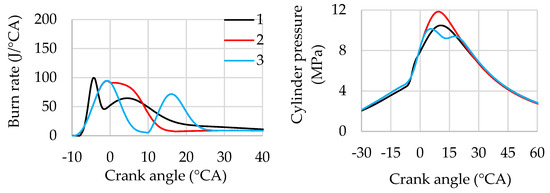
Figure 11.
Influence of the start of the second injection on combustion rate and cylinder pressure: 1—SOI2 = −10 °CA ATDC, 2—SOI2 = 0 °CA ATDC, 3—SOI2 = 10 °CA ATDC. rI1/rI2 = 60%/40%, θign = −10 °CA ATDC, SOI1 = −40 °CA ATDC. λ = 1, BMEP = 1.73 MPa, n = 2000 rpm.
3.1.3. Jet-Guided Operation
Figure 12 shows the influence of ignition timing at a fixed start of injection on the burn rate and cylinder pressure under high-load conditions. In this case, a stoichiometric mixture is used, and the injection timing is fixed at −10 °CA ATDC. It can be observed that increasing the interval between the start of injection and ignition timing leads to an increased burn rate, which, in turn, results in steeper cylinder pressure gradients and higher peak gas temperatures.
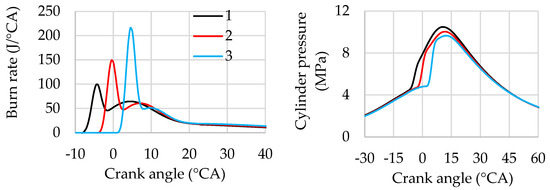
Figure 12.
Influence of ignition timing on burn rate and cylinder pressure under jet-guided operation: 1—θign = −10 °CA ATDC, 2—θign = −7 °CA ATDC, 3—θign = −3 °CA ATDC. SOI = −10 °CA ATDC, λ = 1, BMEP = 1.73 MPa, n = 2000 rpm.
The increase in burn rate is explained by the greater amount of fuel that has had time to partially or fully mix with air and is therefore involved in the flame front after the spark. At the same time, the proportion of diffusion combustion—which proceeds at a relatively slower rate—decreases, resulting in a shorter overall combustion duration.
This injection strategy is characterised by maximum mixture stratification within the cylinder. An increase in the air/fuel ratio during jet-guided operation results in a significantly smaller increase in combustion duration compared to early single injection, which positively affects engine performance when operating on lean mixtures. Adjusting the interval between the start of injection and ignition timing allows for flexible control of peak cylinder pressure and the likelihood of knock.
The analysis conducted revealed the complex and interdependent influence of injection and ignition parameters on the individual stages of the combustion process. This influence can only be fully accounted for through an optimisation study based on efficiency criteria and constraints.
3.2. Influence of Injection and Ignition Parameters on Engine Performance
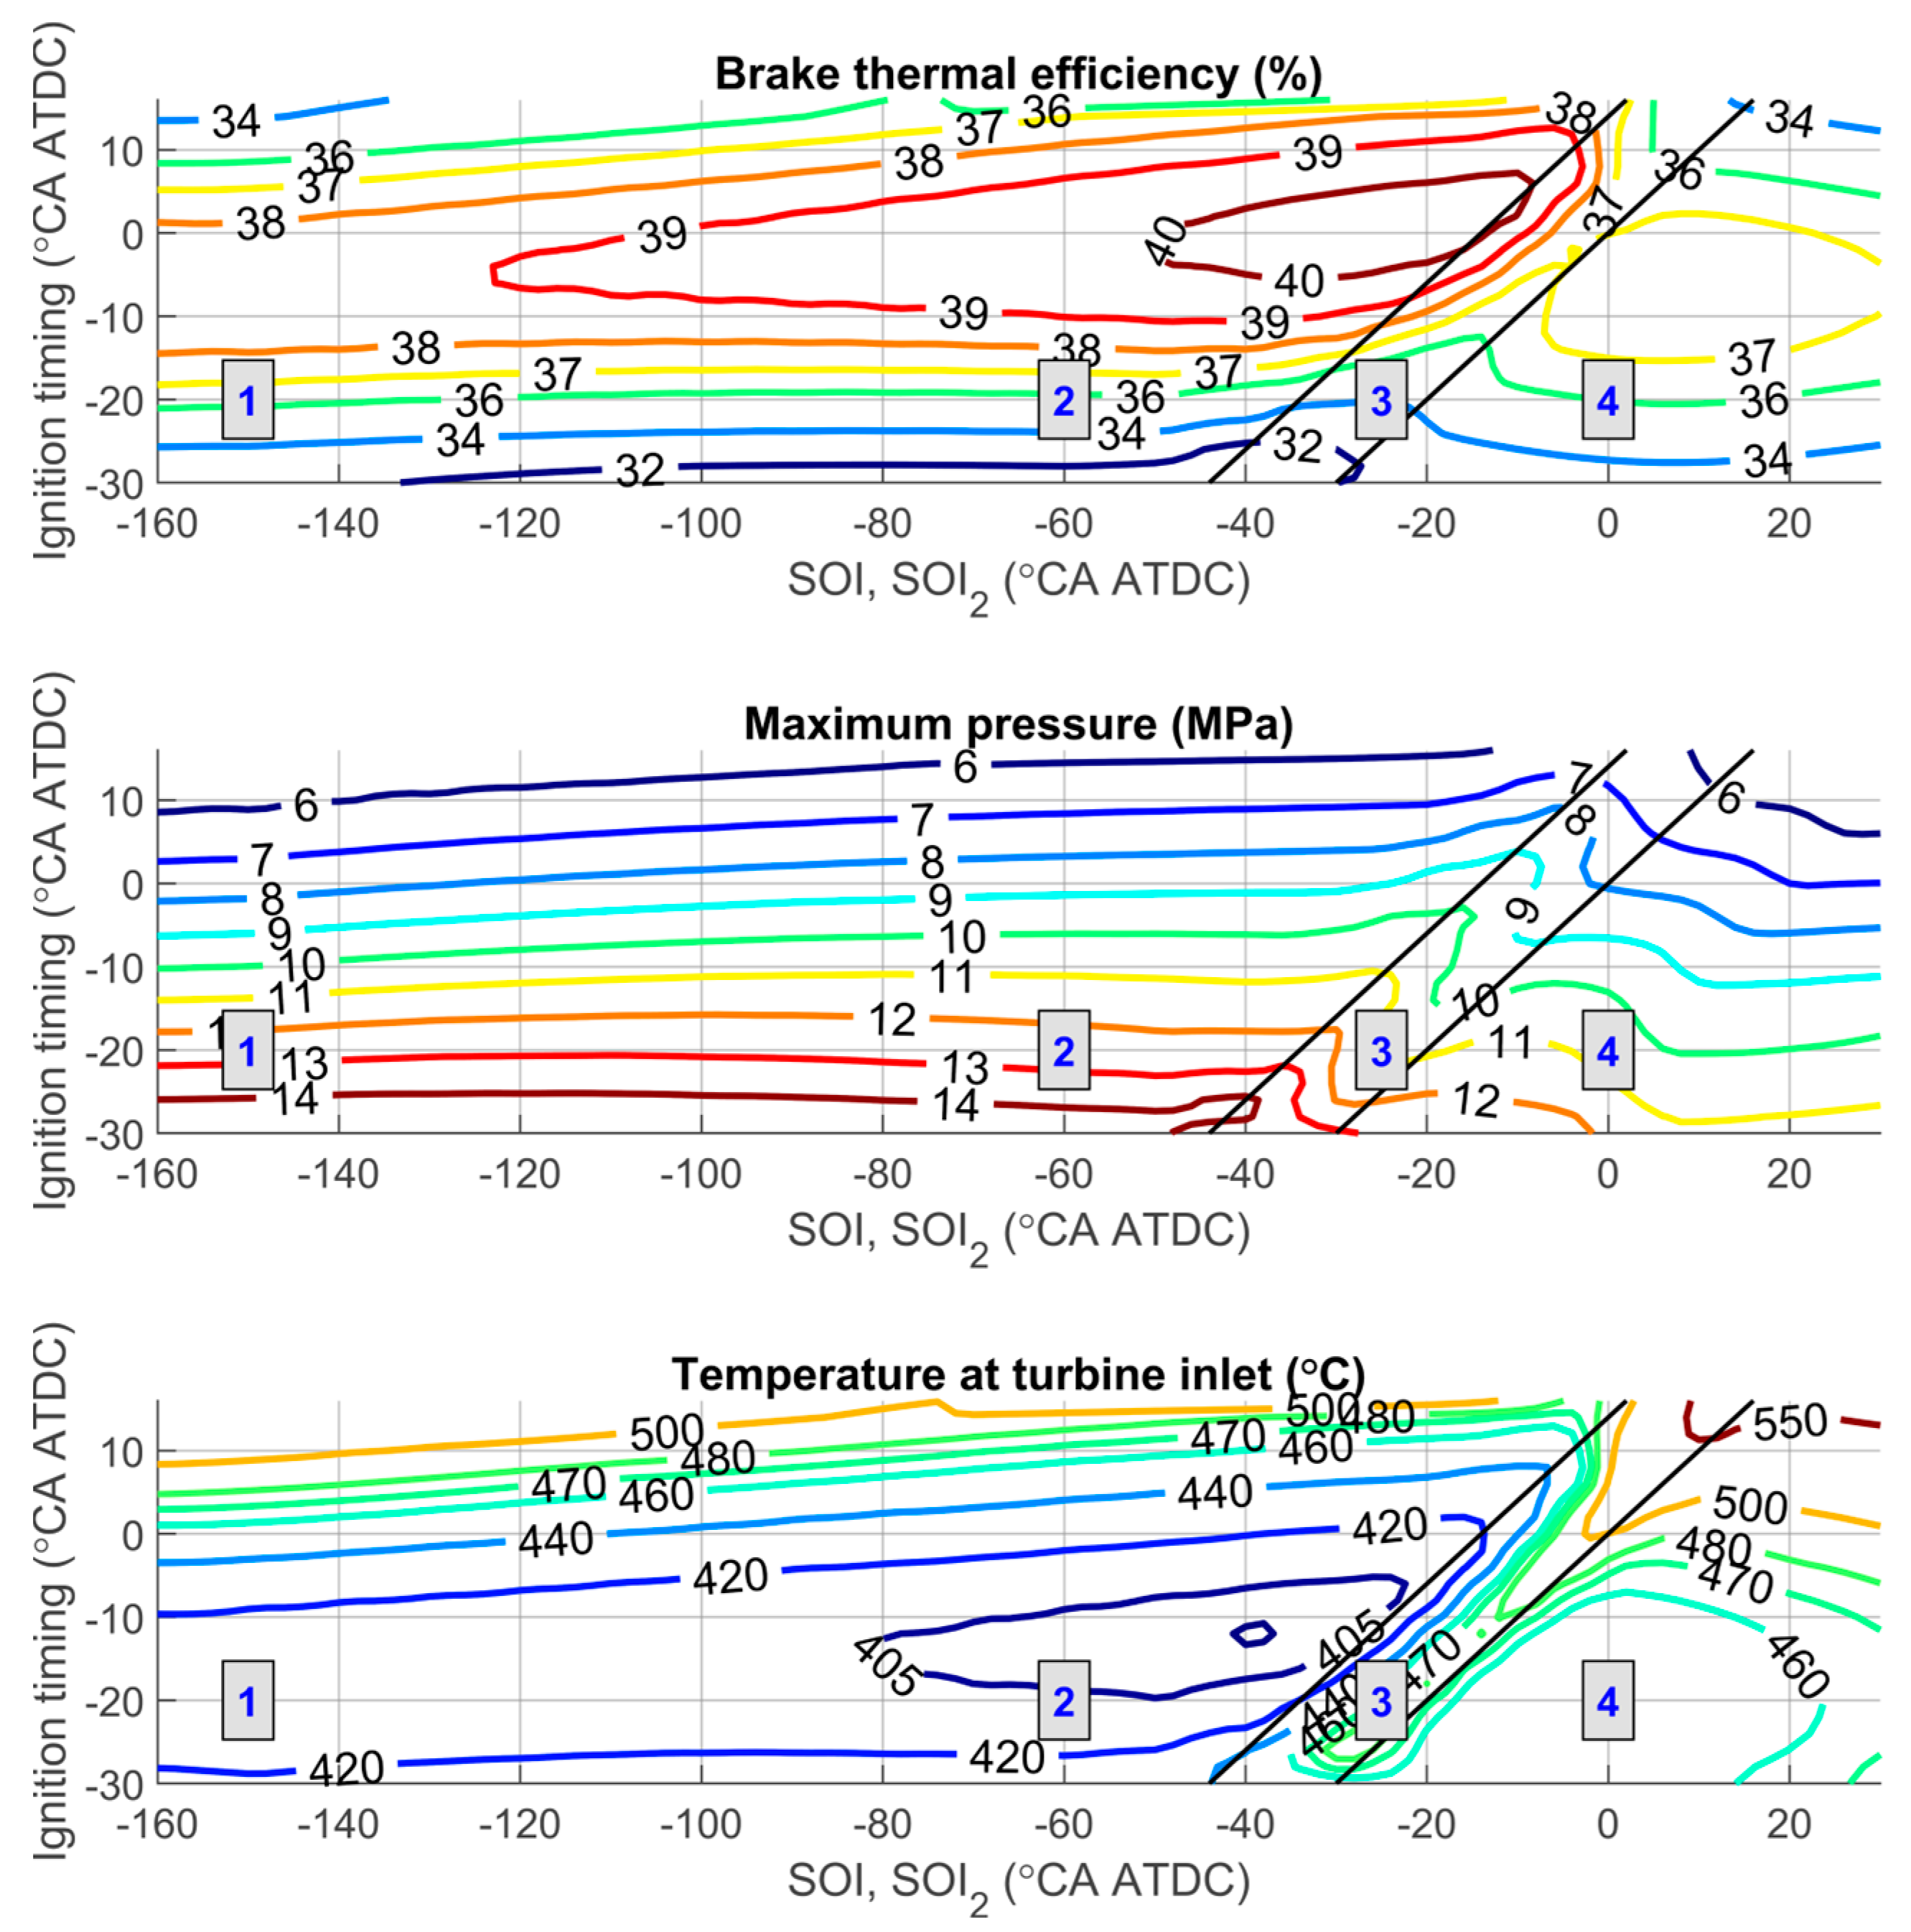
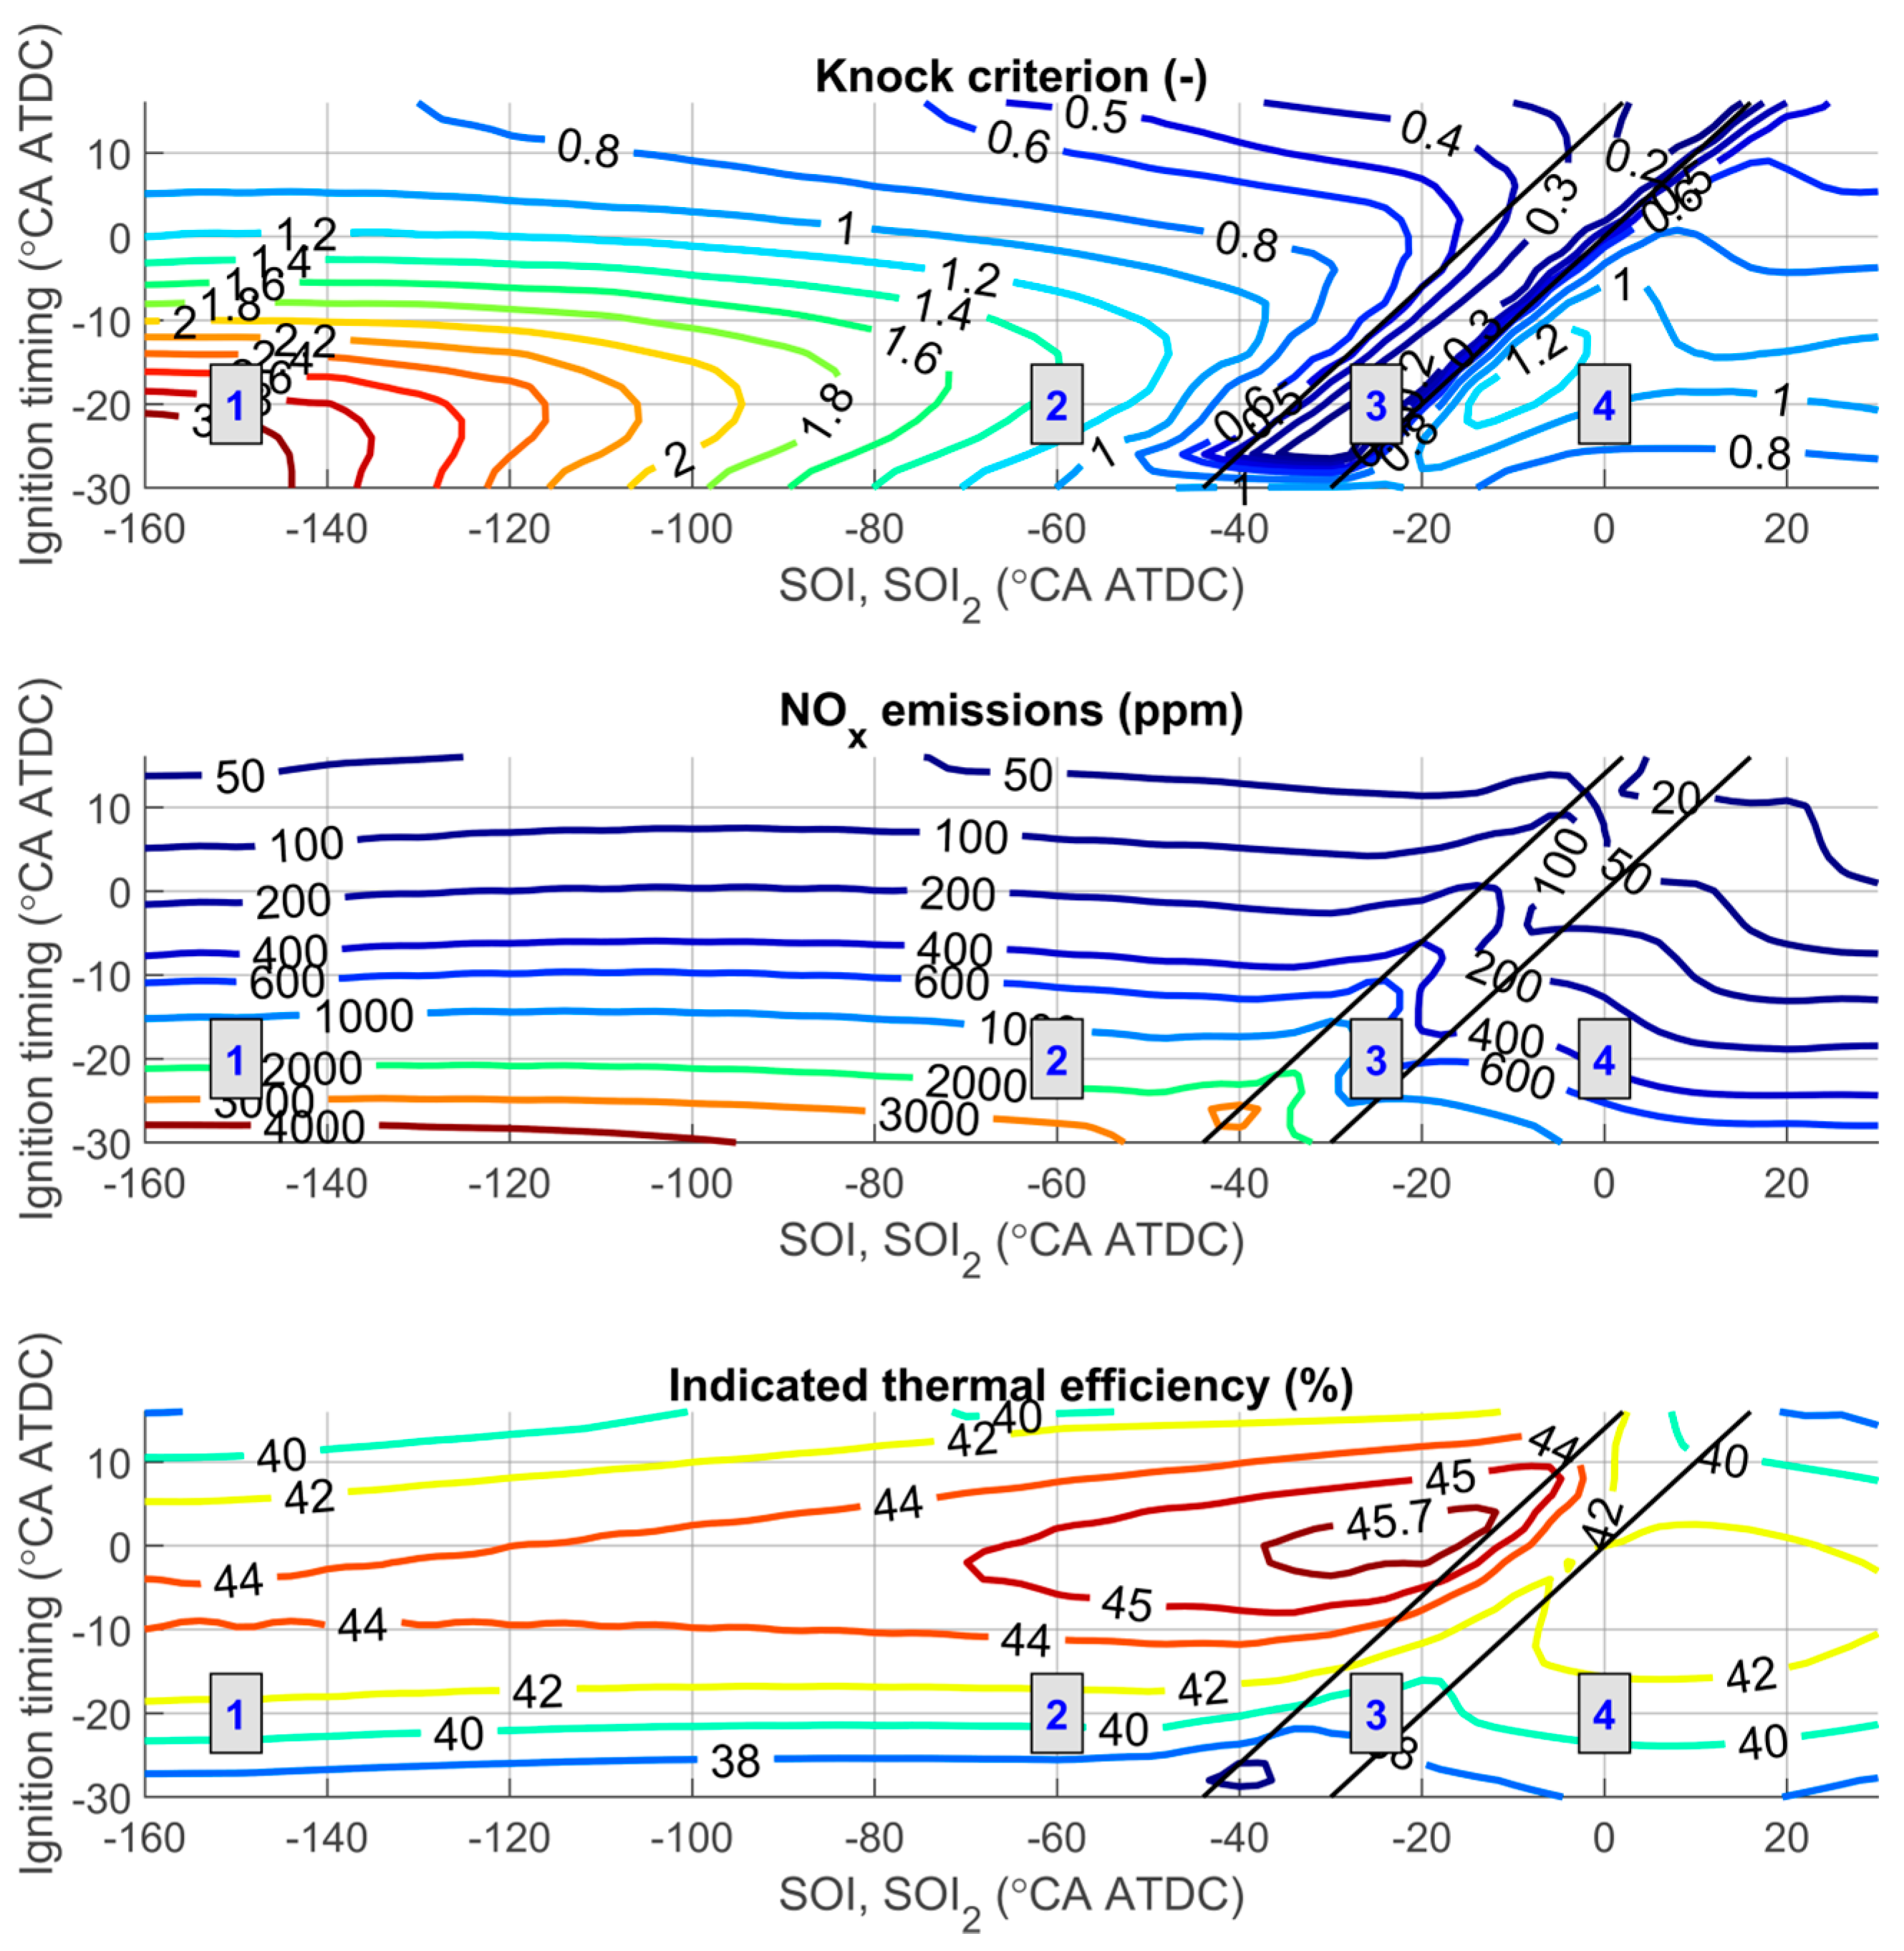
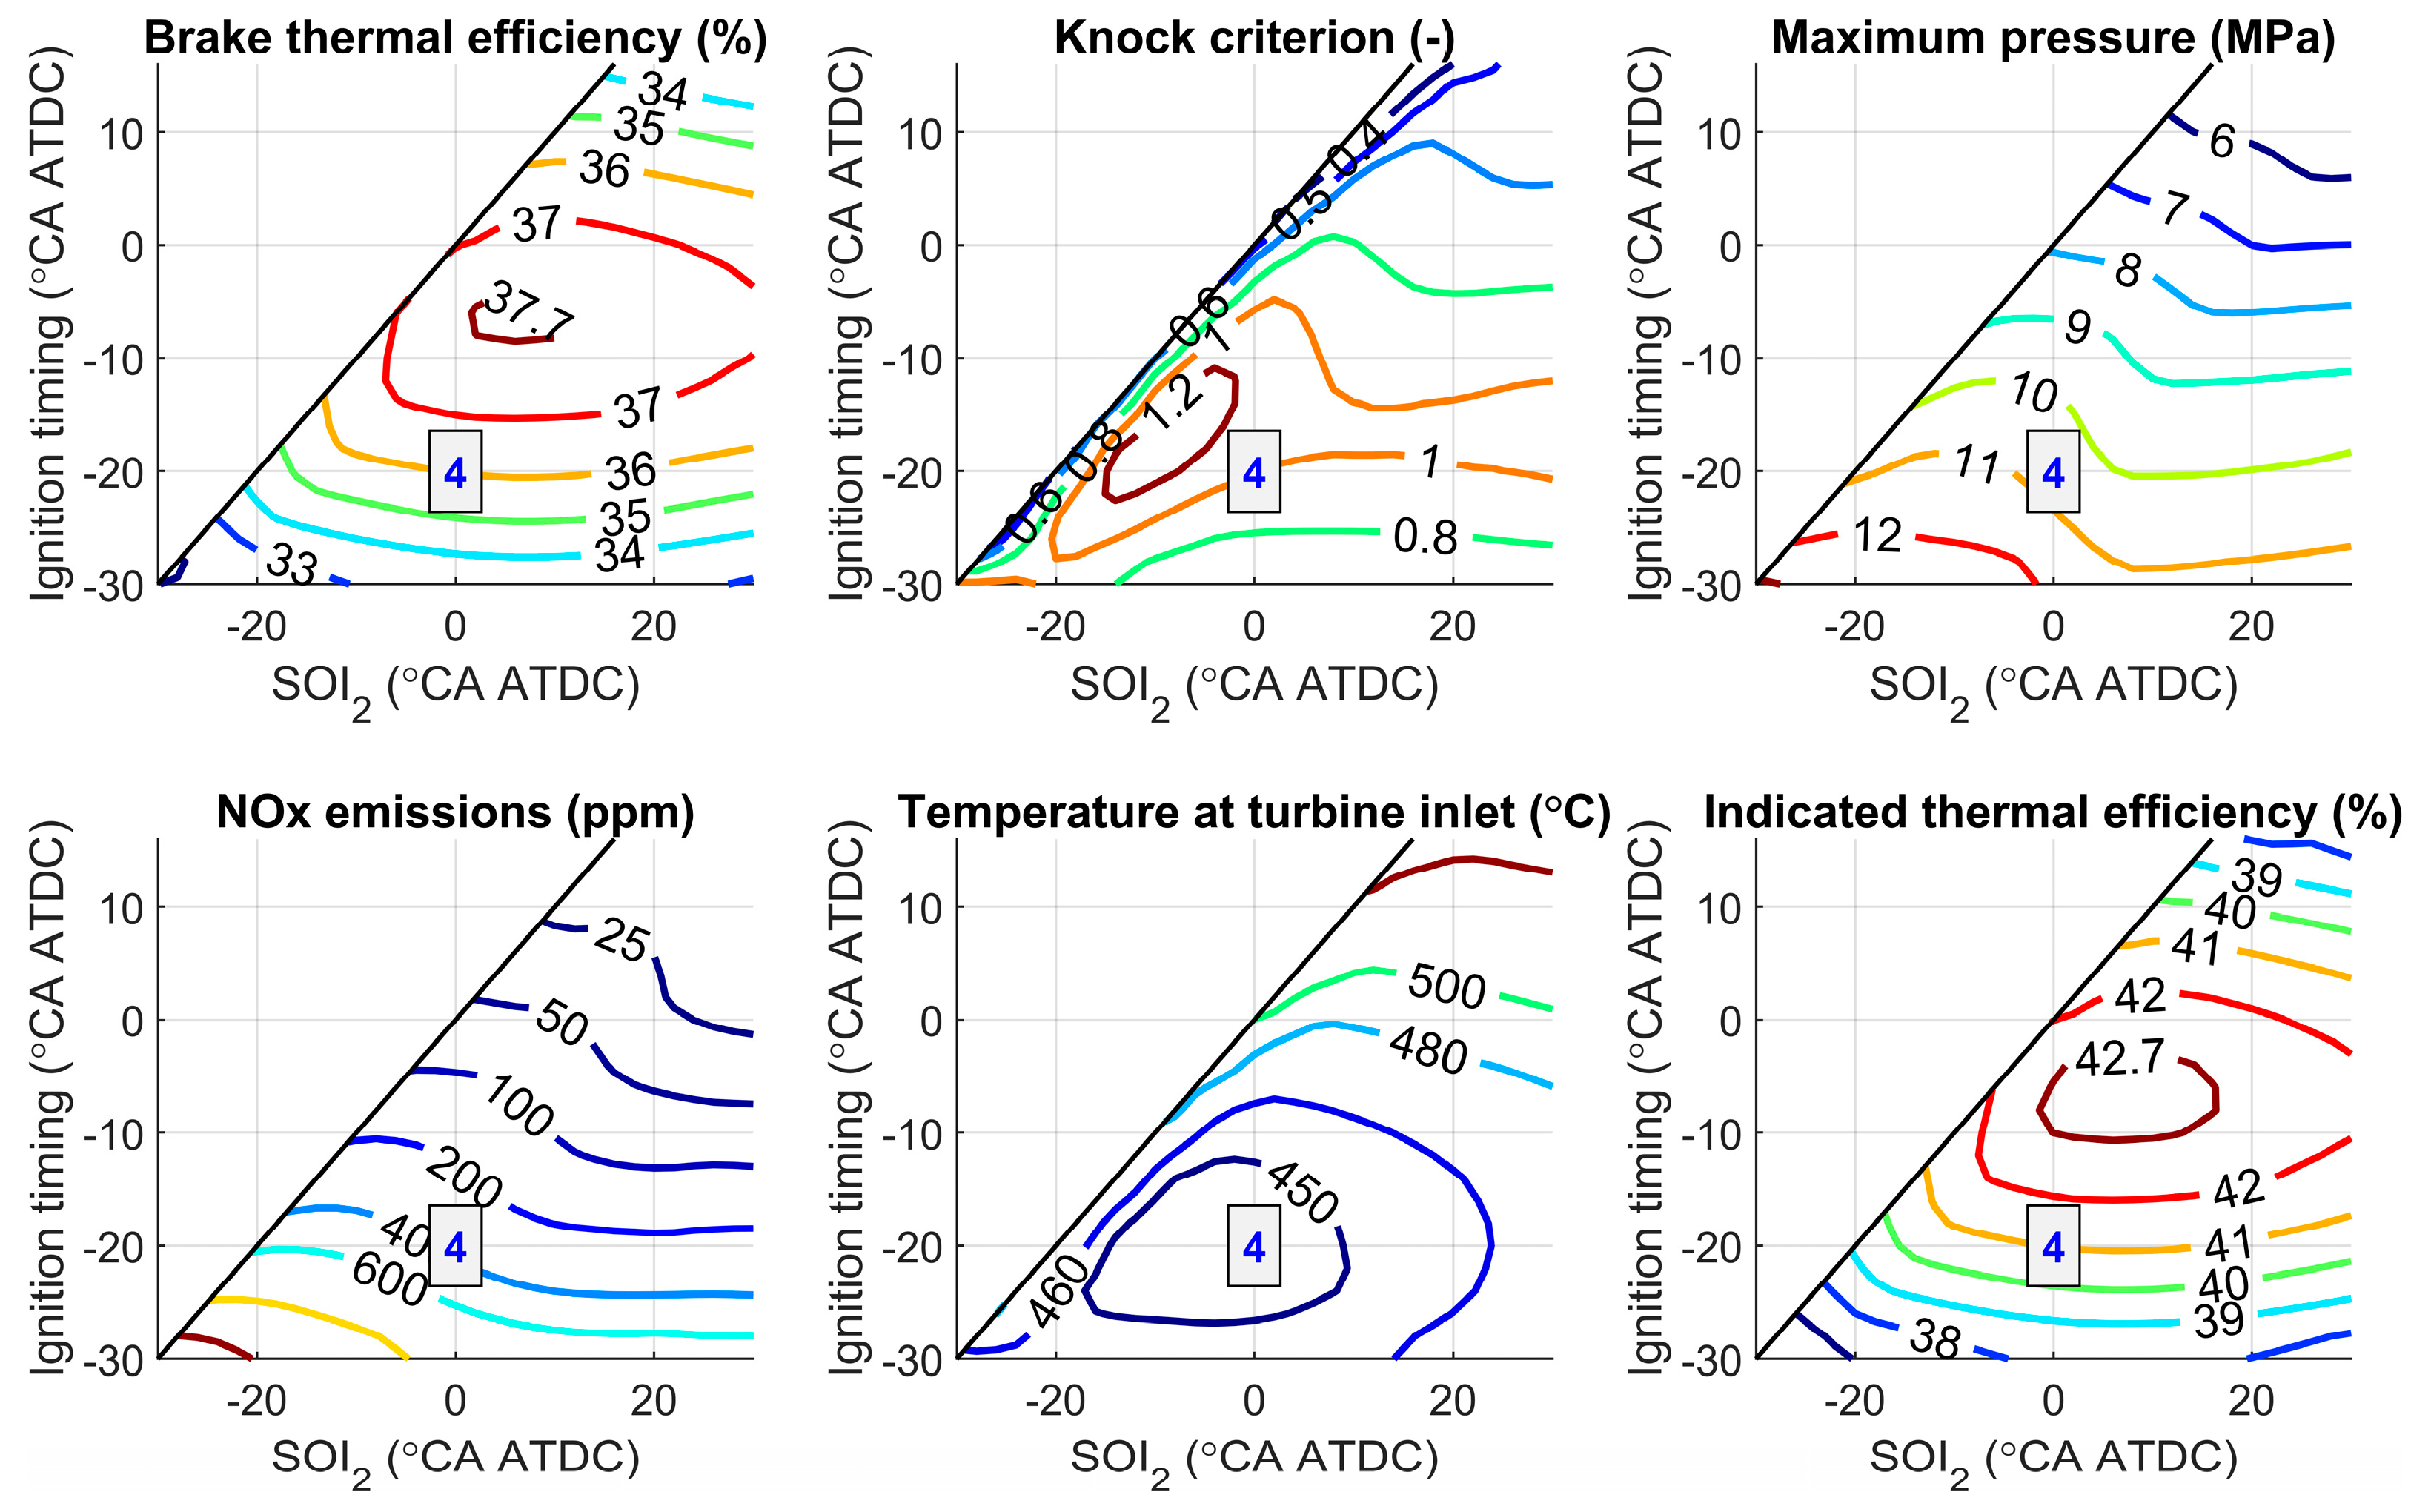
Figure 13 and Figure 14 show the combined influence of ignition timing and the start of injection (for dual injection—the start of the second injection) on engine performance when using various injection strategies at BMEP = 1.25 MPa and an air–fuel equivalence ratio of λ = 2. The arrangement of the zones where different injection strategies are applied is chosen to be the same as in Figure 5. As shown earlier (see Figure 9), the start of the first injection (SOI1) in dual injection has less influence on hydrogen combustion compared to other parameters. Therefore, in order to minimise compression losses, this parameter is kept constant at −60 °CA ATDC during the simulations. The ratio of the first injection to the second injection in the dual injection strategy is set to 80%/20% (Figure 13) and 60%/40% (Figure 14), respectively.
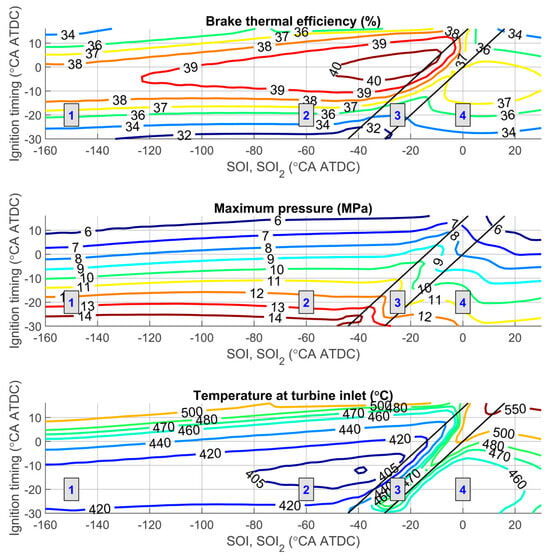
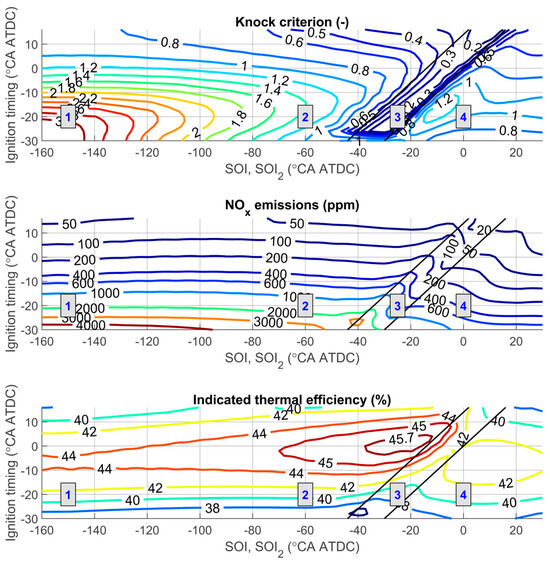
Figure 13.
Influence of ignition timing and start of injection (for dual injection—start of the second injection) on engine performance: 1—zone of single early injection, 2—zone of single late injection, 3—zone of jet-guided operation, 4—zone of dual injection. λ = 2, BMEP = 1.25 MPa, n = 2000 rpm. For dual injection: rI1/rI2 = 80%/20%, SOI1 = −60 °CA ATDC.
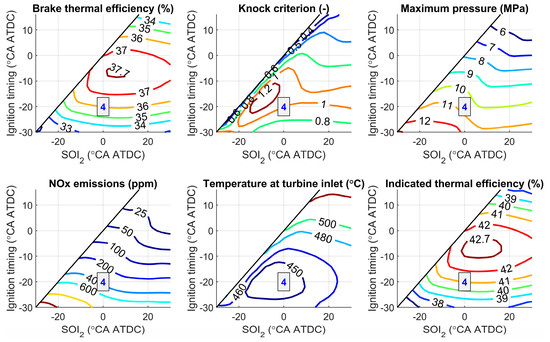
Figure 14.
Influence of ignition timing and start of the second injection on engine performance: λ = 2.0, BMEP = 1.25 MPa, n = 2000 rpm, rI1/rI2 = 60%/40%, SOI1 = −60 °CA ATDC. Engine performance characteristics in zones 1–3 are the same as in Figure 13.
From Figure 13, it can be seen that under these operating conditions, using a single late injection (zone 2) increases the maximum values of BTE and ITE by up to 1.9% compared to early single injection (zone 1), reaching 40.4% and 45.9%, respectively. It should also be noted that in the region of maximum efficiency, nitrogen oxide emissions are reduced by approximately 50%, and the knock criterion falls below critical values. Exhaust gas temperatures before the turbine inlet and peak cylinder pressures in the areas of maximum efficiency are nearly the same for both early and late single injection. The highest engine efficiencies in this mode are achieved at an ignition timing of −7 °CA ATDC for early injection and around 1 °CA ATDC for late injection. The later ignition timing in the case of late injection is due to a shorter combustion duration compared to early injection.
The increase in engine efficiency when using late injection can be explained by a reduction in compression losses, an increase in combustion speed, and changes in the local air/fuel ratio in the combustion zone. However, it should be noted that with single injection, the maximum cylinder pressure in the high-efficiency zone reaches 8.5–9 MPa, which exceeds the allowable limit for gasoline engines (approximately 7–7.5 MPa [12,36]). By applying later ignition timing, the maximum pressure in this operating mode can be reduced to 7 MPa, but this results in a decrease in engine efficiency of up to 2.0% and an increase in exhaust gas temperature before the turbine by up to 35 °C.
When using jet-guided operation (zone 3 in Figure 13), the highest engine efficiencies are achieved when ignition occurs at the end of injection (around 4 °CA ATDC for this mode). Efficiency drops by up to 3.6% if ignition occurs at the beginning of injection. In the high-efficiency zone, the peak cylinder pressure is reduced by up to 1.7 MPa, NOx emissions are reduced by a factor of three, and turbine inlet temperatures increase by approximately 90 °C. The knock criterion remains below 0.4, indicating a low likelihood of knocking with this strategy. These parameter changes can be explained by an increased proportion of diffusion combustion, which proceeds at a relatively low rate and leads to reduced peak pressures and temperatures in the cycle.
From Figure 13 and Figure 14, it is evident that when using dual injection with ratios of the first to the second injection of 80%/20% and 60%/40%, the maximum BTE and ITE decrease by 2.7% and 3.0%, respectively, compared to single late injection. For the 80%/20% dual injection strategy, the maximum BTE and ITE are achieved with an ignition timing of –6 °CA ATDC and a start of the second injection at approximately –6 °CA ATDC. When the share of the first injection is reduced, the increased duration of premixed combustion causes the high-efficiency zone to shift toward earlier ignition and earlier start of the second injection (Figure 14). In this zone, maximum cylinder pressure remains nearly unchanged, turbine inlet gas temperatures rise by 20–30 °C, and NOx emissions are reduced by approximately 1.3 times compared to single late injection. The knock criterion approaches one in the high-efficiency zone. It can also be observed that decreasing the share of the first injection slightly increases the area with lower maximum cylinder pressures and reduced knock criterion values.
The observed reduction in maximum engine efficiency, the increase in turbine inlet gas temperature, and the decrease in peak cylinder pressure when reducing the share of the first injection are attributed to an increased proportion of diffusion combustion. This reduces the combustion rate in the cylinder and increases the combustion duration. Such an influence is similar to the effects observed during jet-guided operation with ignition occurring close to the start of injection.
Based on this comparative study of various injection strategies under relatively high load conditions, it can be concluded that the most effective method is single late injection. This strategy provides the highest engine efficiency while simultaneously reducing the likelihood of knocking. However, peak cylinder pressures in the high-efficiency zone exceed the permissible limits for the base engine. To mitigate this, alternative approaches are needed. Possible solutions include jet-guided operation and dual injection.
The use of SOI (SOI2) versus θign maps enables the selection of injection parameters over a wide range of engine operating conditions, taking into account both the goal of maximising efficiency and the limitations on peak cylinder pressure and knock tendency.
3.3. Selection of Injection and Ignition Parameters
In this study, the selection of injection and ignition parameters described in Table 3 was carried out using two approaches. In the first approach, parameter selection was based on achieving the maximum indicated thermal efficiency without applying any constraints. This approach allows for evaluating the potential of specific injection strategies. In the second approach, the parameter selection took into account limitations on the maximum allowable cylinder pressure and knock criterion, which were set to 7 MPa and 1.0, respectively. Engine operation was modelled at BMEP levels ranging from zero to 1.95 MPa at 2000 rpm using two mixture control strategies: λ = 1 and λ = var.
3.3.1. Parameter Selection Without Constraints
Let us first consider the approach based on unconstrained parameter selection. In this case, the start of injection (for dual injection—the start of the second injection) and ignition timing are selected based on the analysis of ITE contour maps for a range of load conditions, similar to those presented in Figure 13 and Figure 14.
For single early injection, the start of injection was set to coincide with the intake valve closing timing. For dual injection, the start of the first injection is fixed at −60° CA for all ratios between the first and second injections in order to reduce compression losses.
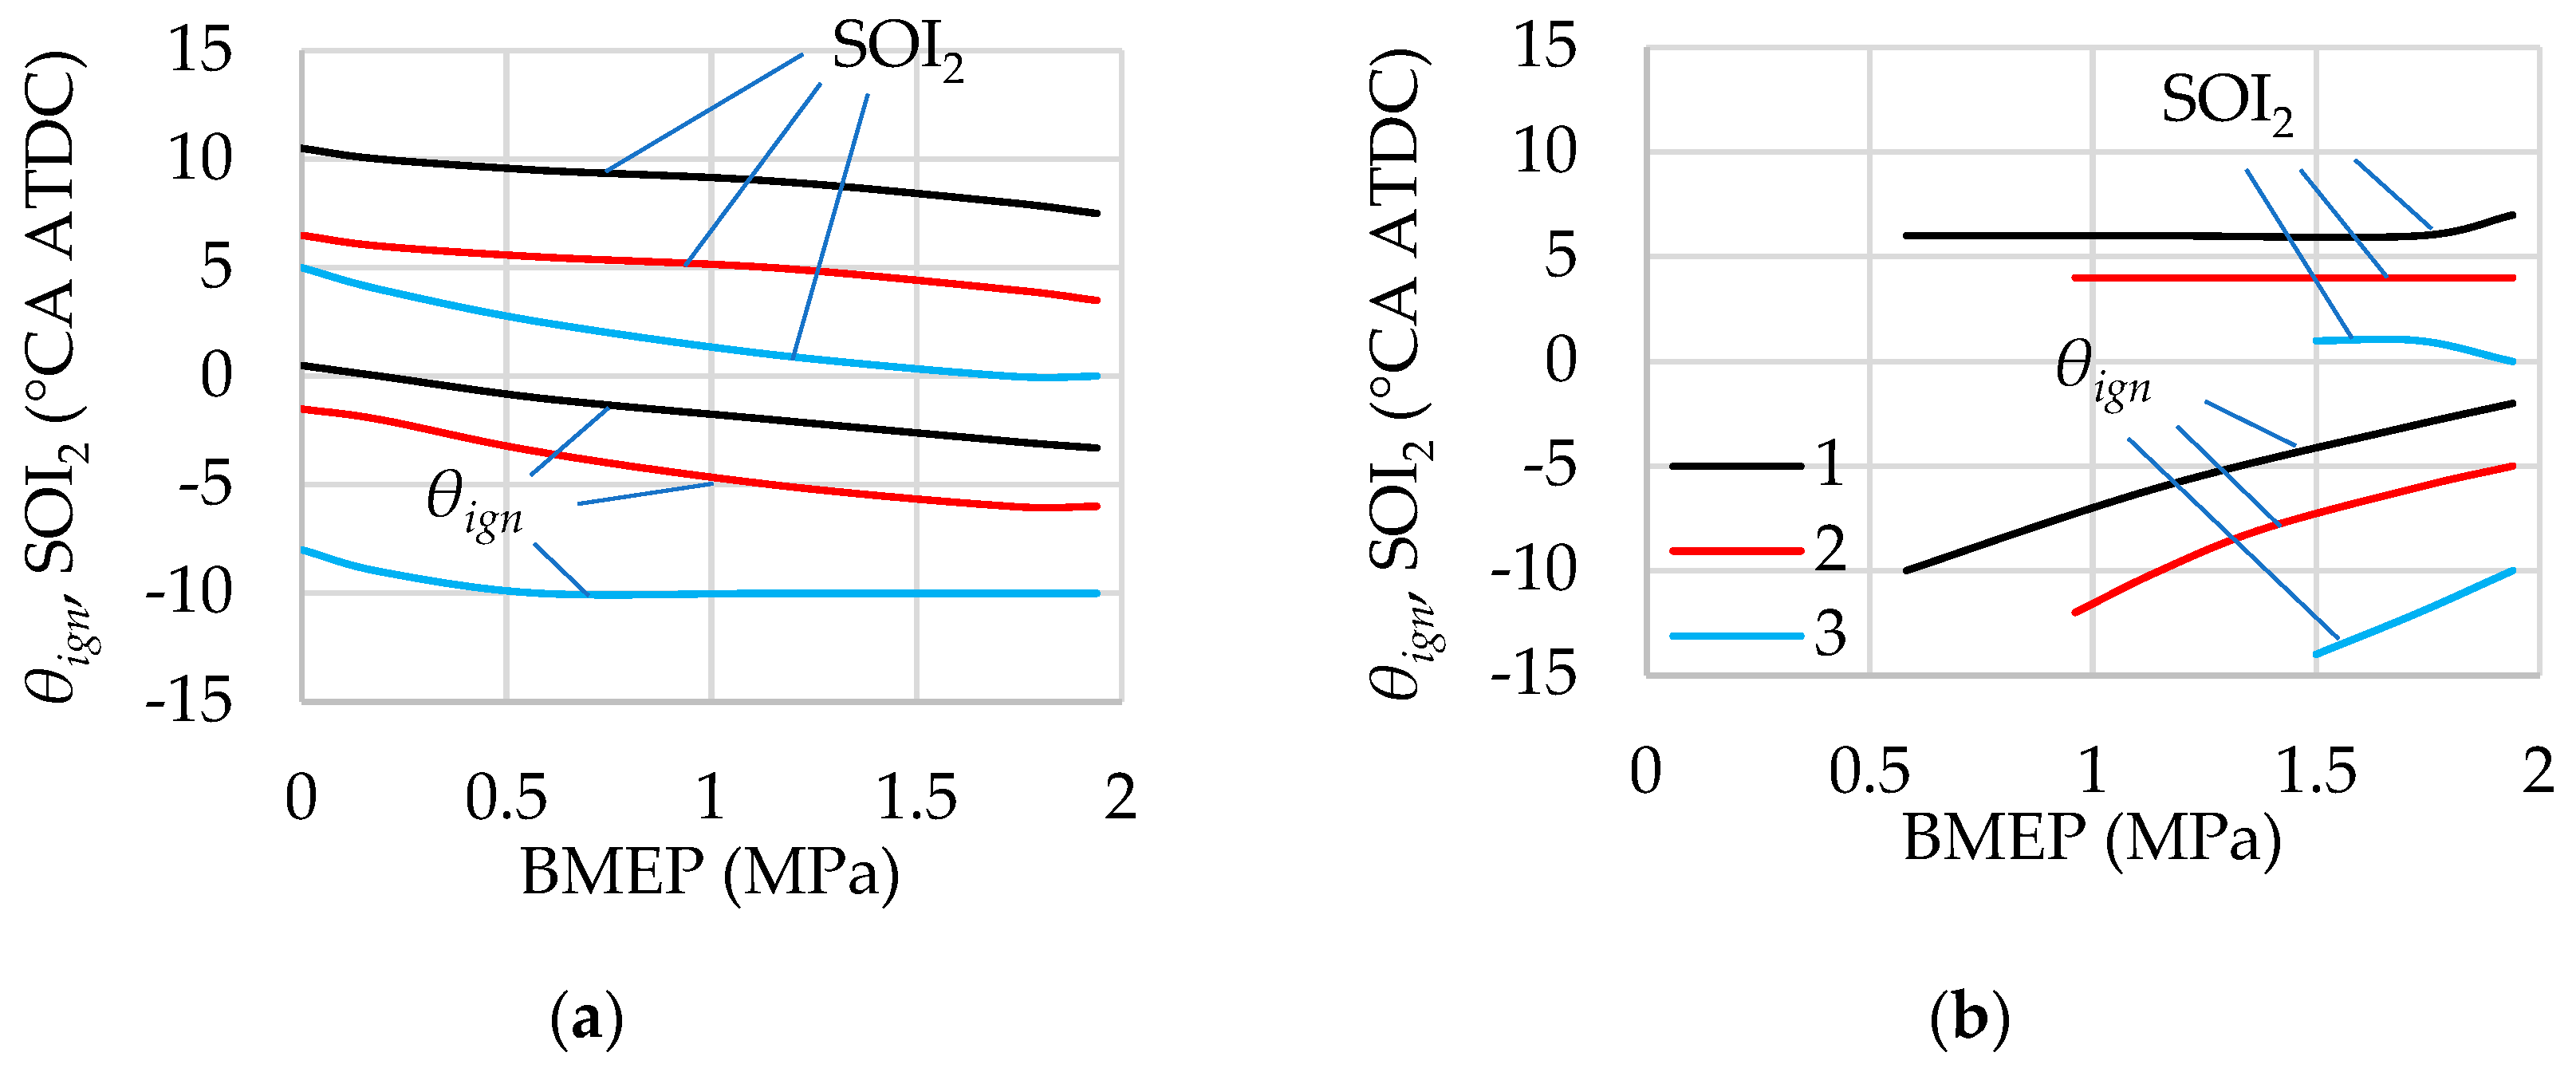
The results of the parameter selection for various load modes using single injection and jet-guided strategies are shown in Figure 15, while the results for dual injection are presented in Figure 16.
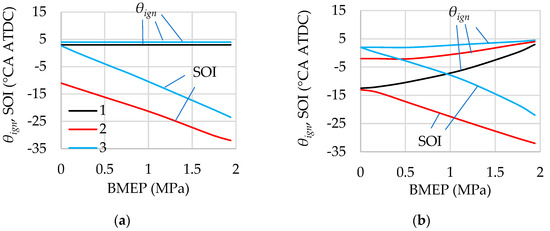
Figure 15.
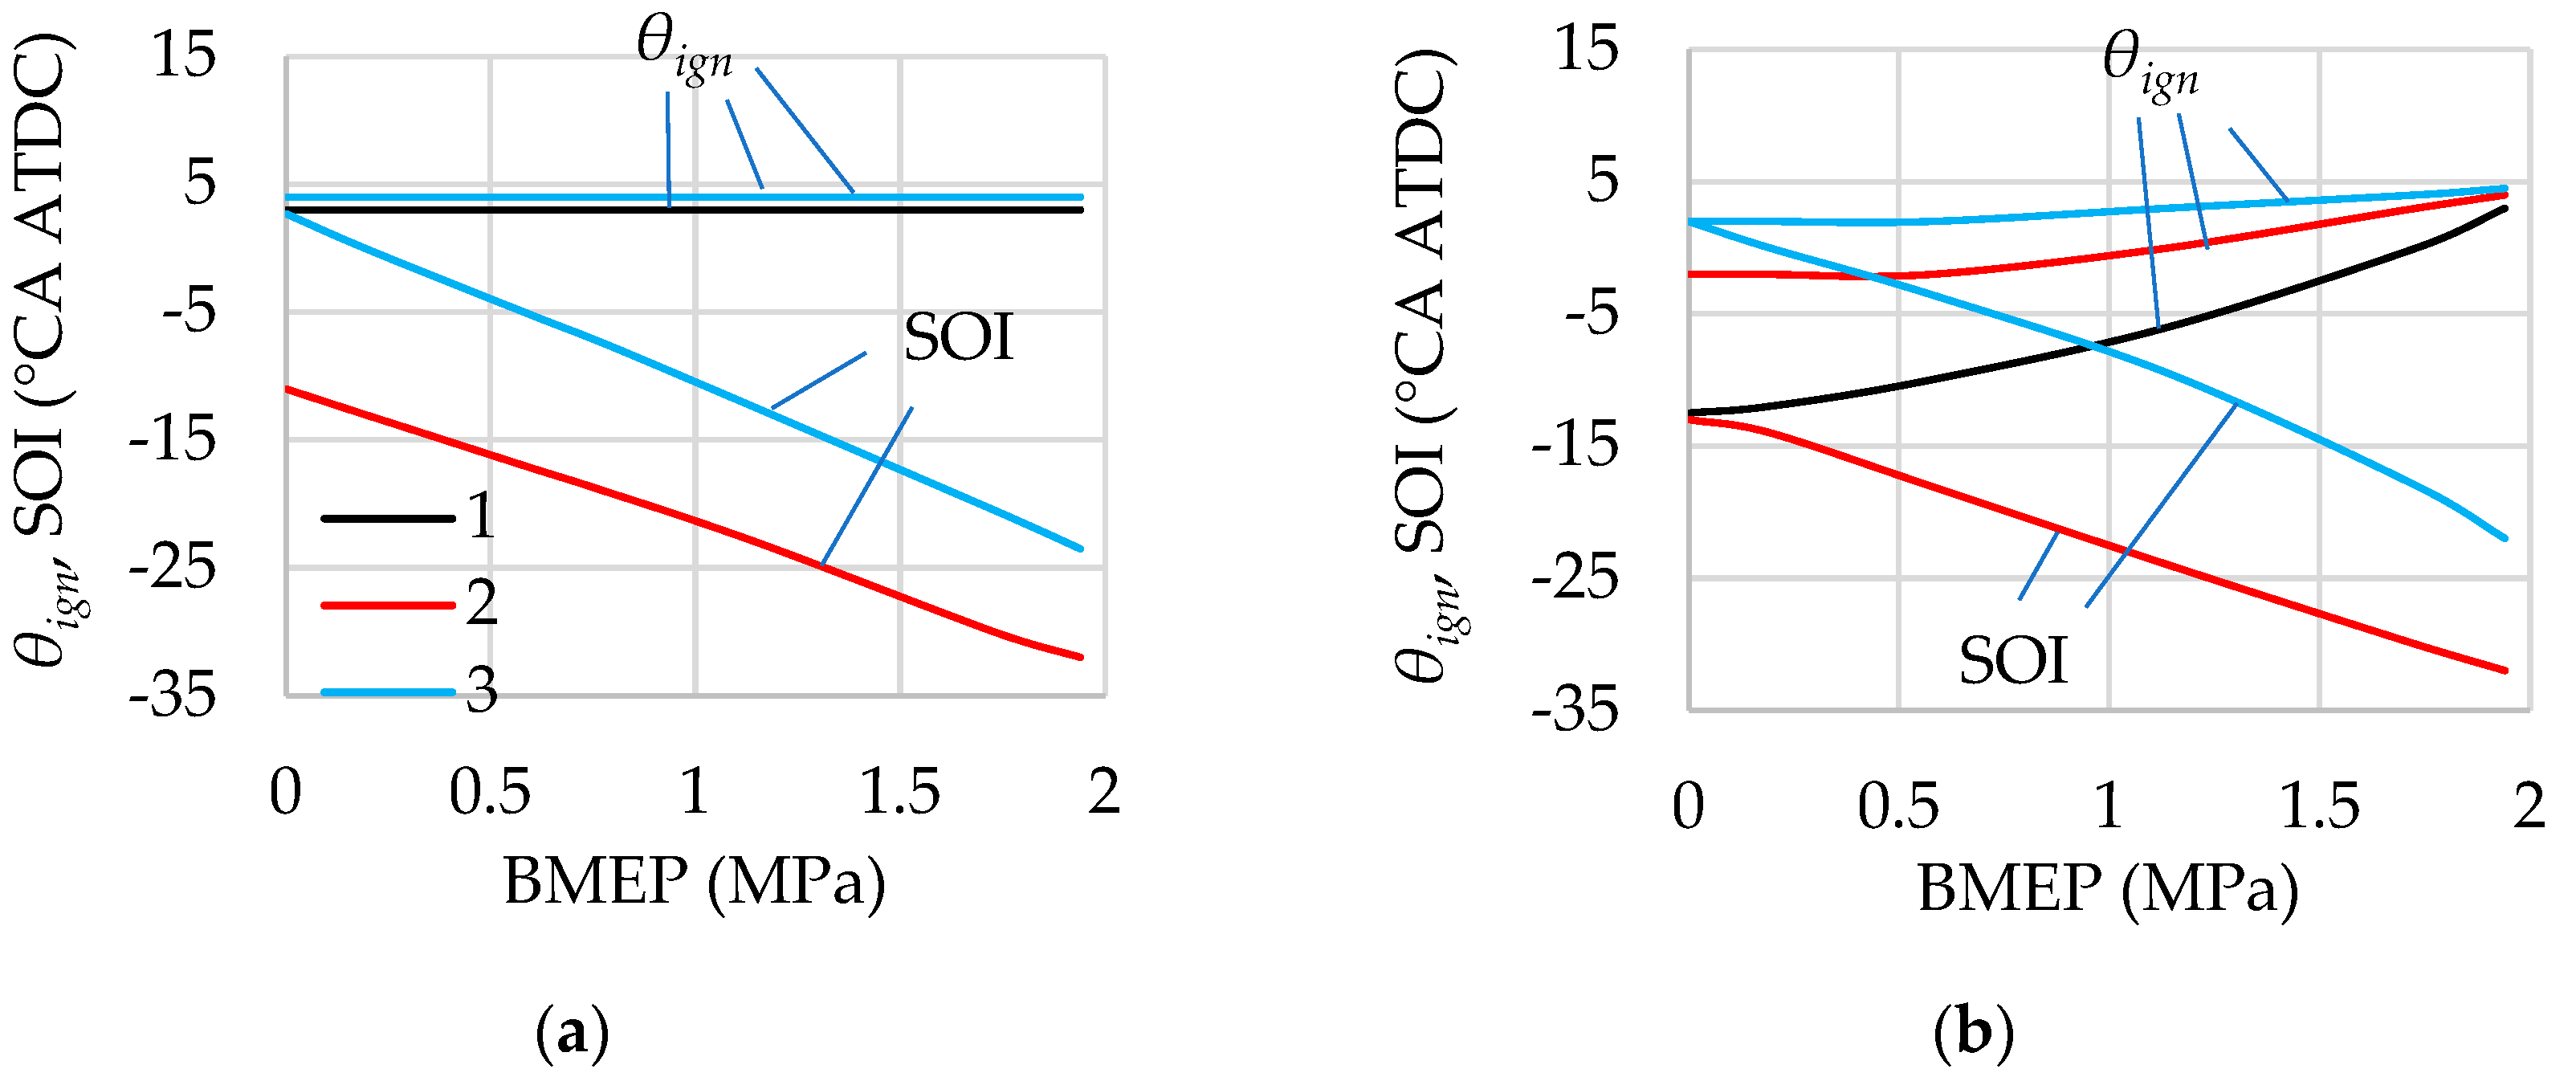
Selected ignition timing and start of injection for single injection and jet-guided operation in load modes with λ = 1 (a) and λ = var (b) at n = 2000 rpm. 1—Single early injection, SOI coincides with the intake valve closing timing; 2—Single late injection; 3—Jet-guided operation. The optimisation criterion is ITE, and no constraints are applied.
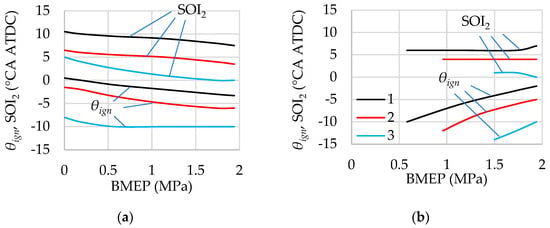
Figure 16.
Selected ignition timing and start of second injection at dual injection in load modes with λ = 1 (a) and λ = var (b) at n = 2000 rpm. 1—rI1/rI2 = 80%/20%, 2—rI1/rI2 = 60%/40%, 3—rI1/rI2 = 40%/60%. The optimisation criterion is ITE, and no constraints are applied.
Analysis of the simulation results shows that, when applying different injection strategies with λ = 1, the optimal ignition timings are located near top dead centre—typically between 3 °CA ATDC and 4 °CA ATDC—with only slight variations as the load increases. This is due to relatively small changes in combustion duration for stoichiometric mixtures under these operating conditions.
When operating with λ = var, the optimal ignition timing varies over a broader range. For example, with early single injection and BMEP changing from 0 MPa to 1.95 MPa, the optimal ignition timing varies from –13 °CA ATDC to 5 °CA ATDC. In the case of late single injection, due to significant mixture stratification, the influence of λ variation on combustion duration is less substantial than with early injection. The optimal ignition timing in this case varies from 0 to 4 °CA ATDC.
The influence of mixture composition on combustion duration is even less significant during jet-guided operation. In this method, the highest engine efficiency is achieved when ignition occurs at the end of injection, the so-called “tail ignition” [17]. A reduced combustion duration in the flame front requires slightly later ignition timing compared to late single injection. It is worth noting that in jet-guided operation, diffusion combustion practically does not occur in the base engine under the selected injection parameters. This process can rather be classified as late single injection with strong mixture stratification.
The ignition timing values determined from SOI (SOI2) versus θign maps at different operating modes correlate well with those derived from ensuring MFB50 = 8 °CA ATDC, assuming all other parameters remain constant. This significantly simplifies the algorithm for determining the optimal ignition timing.
In the case of single late injection, the start of injection is selected between −11 °CA ATDC and 32 °CA ATDC depending on the engine load. This ensures sufficient time for fuel delivery into the cylinder and partial mixing with air. In jet-guided operation, the start of injection is determined by the ignition timing and the injection duration.
The start of the second injection in dual injection and operation with λ = 1 primarily depends on the ratio of the first to the second injection. When the share of the first injection is reduced, the air/fuel ratio in the cylinder increases by the end of the first injection, as well as the combustion duration in the flame front. This necessitates an earlier first injection. During operation with λ = var, in addition to the share of the first injection, engine load and in-cylinder mixture composition also strongly influence the choice of the start of the second injection and ignition timing.
3.3.2. Selection of Parameters Considering Maximum Cylinder Pressure and Knock Constraints
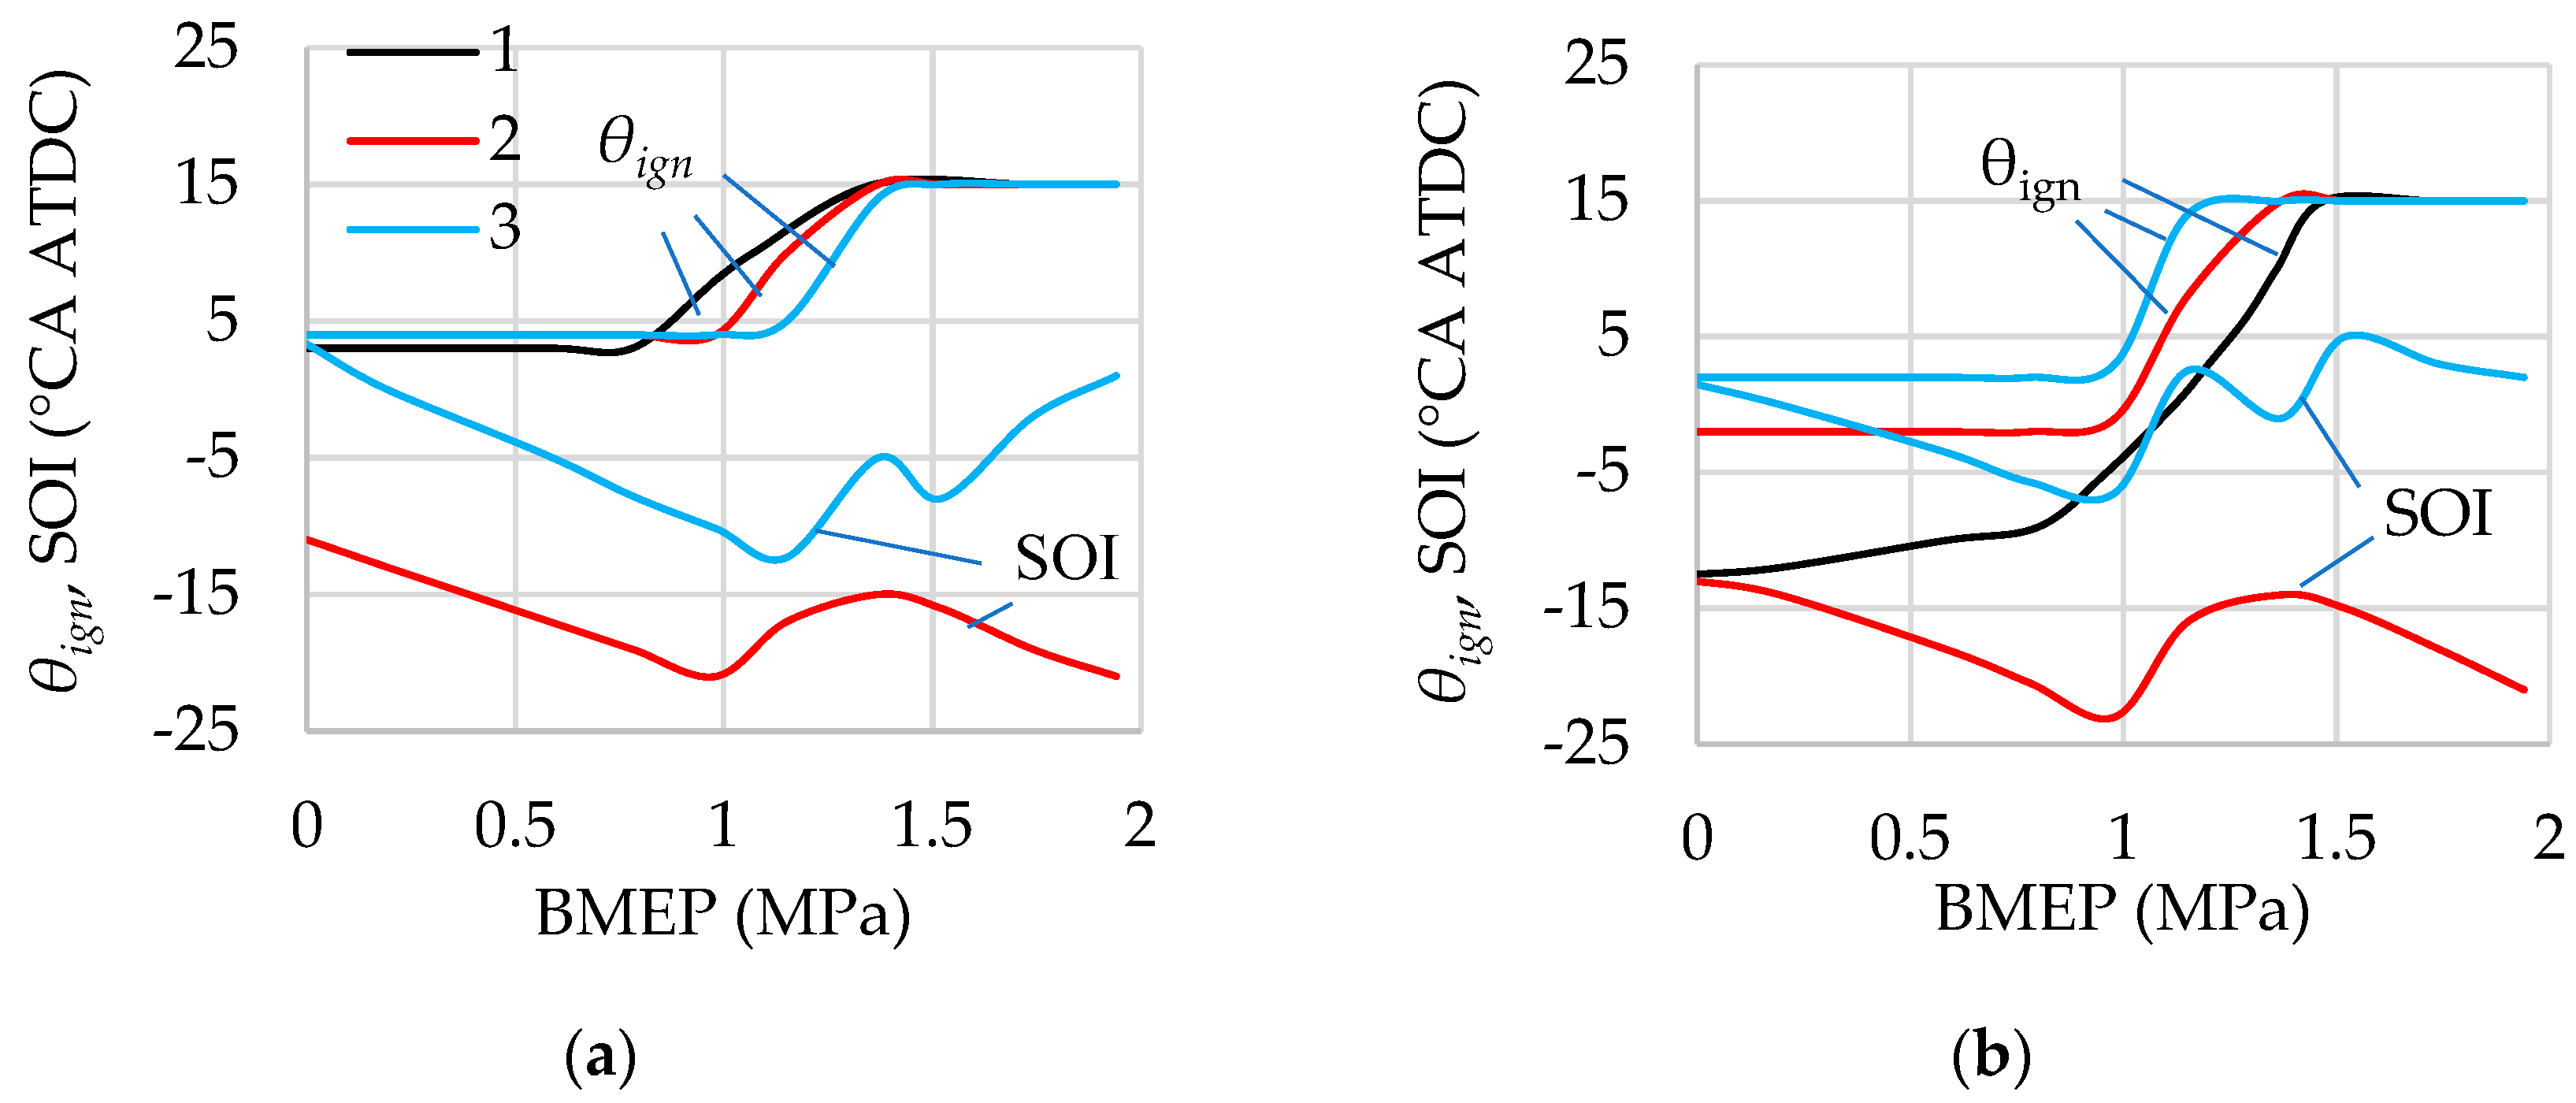
The injection and ignition parameters selected using the second approach, considering constraints on maximum cylinder pressure and knock criterion, are shown in Figure 17 for single injection and jet-guided operation strategies, and in Figure 18 for the dual injection strategy.
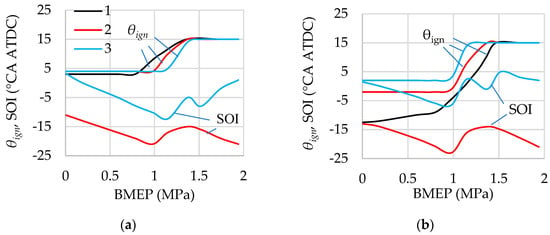
Figure 17.
Selected ignition timing and start of injection for single injection and jet-guided operation in load modes with λ = 1 (a) and λ = var (b) at n = 2000 rpm. 1—Single early injection, SOI coincides with intake valve close timing; 2—Single late injection; 3—Jet-guided operation. Optimisation criterion—ITE; constraints: maximum cylinder pressure and knock criterion.
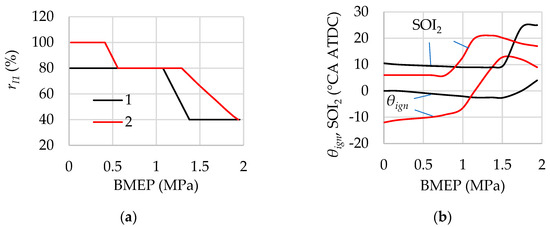
Figure 18.
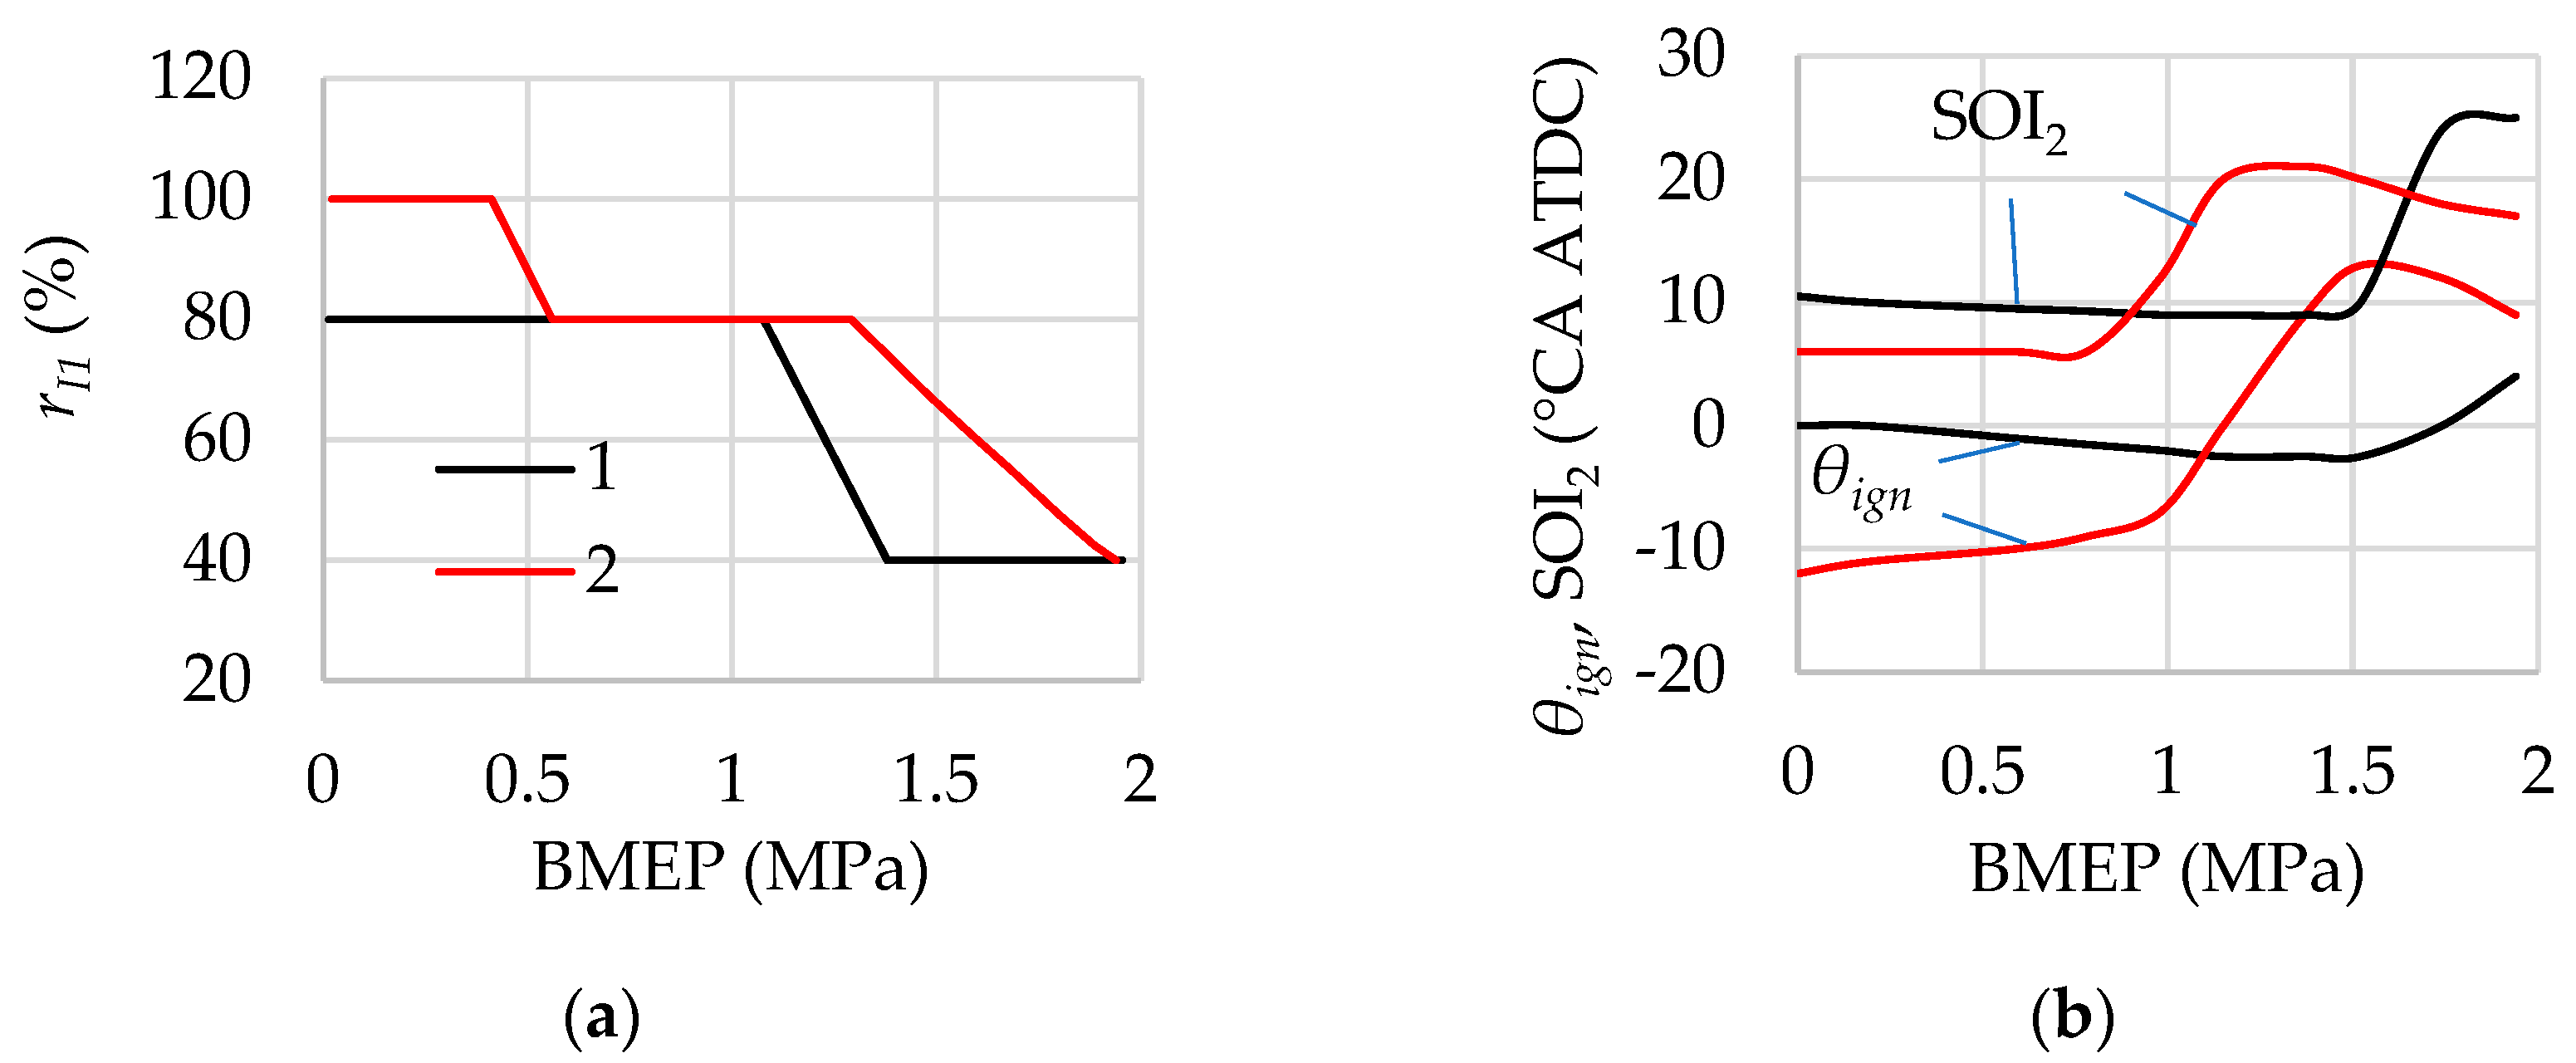
Selected share of first injection (a), ignition timing, and start of the second injection (b) at dual injection in load modes at n = 2000 rpm: 1—λ = 1, 2—λ = var. SOI1 = −60 °CA ATDC. Optimisation criterion—BTI; constraints: maximum cylinder pressure and knock criterion.
In this method, when using single injection and exceeding the permissible values of maximum cylinder pressure and/or knock criterion, ignition timing is retarded until the specified threshold criteria are met. The maximum allowable retardation of ignition timing for this and other injection strategies is limited to 15 °CA ATDC. Analysis of previous studies [7,12,16] shows that the maximum ignition retardation is approximately at the same level.
When using jet-guided operation and the limiting criteria are exceeded, the start of injection is shifted toward the ignition timing, while also applying a delayed ignition timing. This strategy results in an increased share of diffusion combustion, which slows down and extends hydrogen combustion over time.
For dual injection, in operating conditions where the maximum cylinder pressure and/or knock criterion exceed the acceptable limits for the base engine, the following approach is applied: The share of the first injection is adjusted to ensure λ1 = 2.5 in the cylinder at the end of the first injection. This mixture composition is still easily ignitable and burns at a relatively low rate. The second injection share is calculated to provide the required engine power. When using the λ = 1 strategy and assuming a fixed λ1 = 2.5, the first injection share calculated according to formula (1) is 40% (Figure 18a, curve 1). In the λ = var strategy, this ratio varies depending on the air/fuel ratio in the cylinder, starting from load conditions where the total air/fuel ratio and first injection share are less than 2.5 and 80%, respectively (Figure 18a, curve 2).
The start of the first injection is kept constant at –60 °CA ATDC. The ignition timing and the start of the second injection are determined as follows (Figure 19). First, the ignition timing is set to the optimal value based on the maximum ITE. As a first approximation, the start of the second injection is assumed to be equal to the ignition timing: SOI2 = θign. If the knock criterion and/or maximum cylinder pressure exceed the set limits, the second injection timing is retarded by ∆SOI2, and pmax and kd are evaluated. The ignition timing θign remains unchanged during this step. If the boundary levels of pmax and kd are still exceeded, SOI2 is further delayed. This procedure is repeated up to a predefined maximum value (SOI2)max. If even with the delayed SOI2 the target limits for pmax and kd are not met, the ignition timing is retarded by ∆θign, the start of the second injection is again assumed equal to the ignition timing, and the above process is repeated. The delays of SOI2 and θign continue until pmax and kd are reduced below the specified limits.
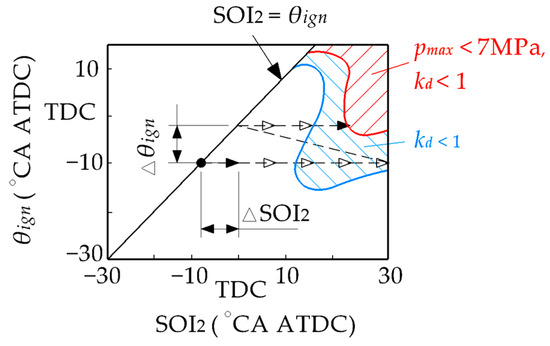
Figure 19.
Diagram for selecting ignition timing and the start of the second injection in the dual injection strategy under constraints on maximum cylinder pressure and/or knock criterion.
The ignition timing and the start of the second injection determined using this method for dual injection are shown in Figure 18b. As shown, when applying the λ = 1 strategy (curve 1), compliance with the specified constraint levels is achieved primarily by retarding SOI2, while the ignition timing is only slightly delayed at BMEP values above 1.5 MPa. When using the λ = var strategy, in order to meet the target pmax levels, both the ignition timing and the start of the second injection must be significantly delayed, beginning already at loads of 0.8 MPa. This behaviour is explained by the increased airflow and cylinder pressure at the end of the compression stroke, and consequently by higher cylinder pressure during expansion when this strategy is applied.
3.4. Comparative Analysis of Injection Strategies at Different Load Modes
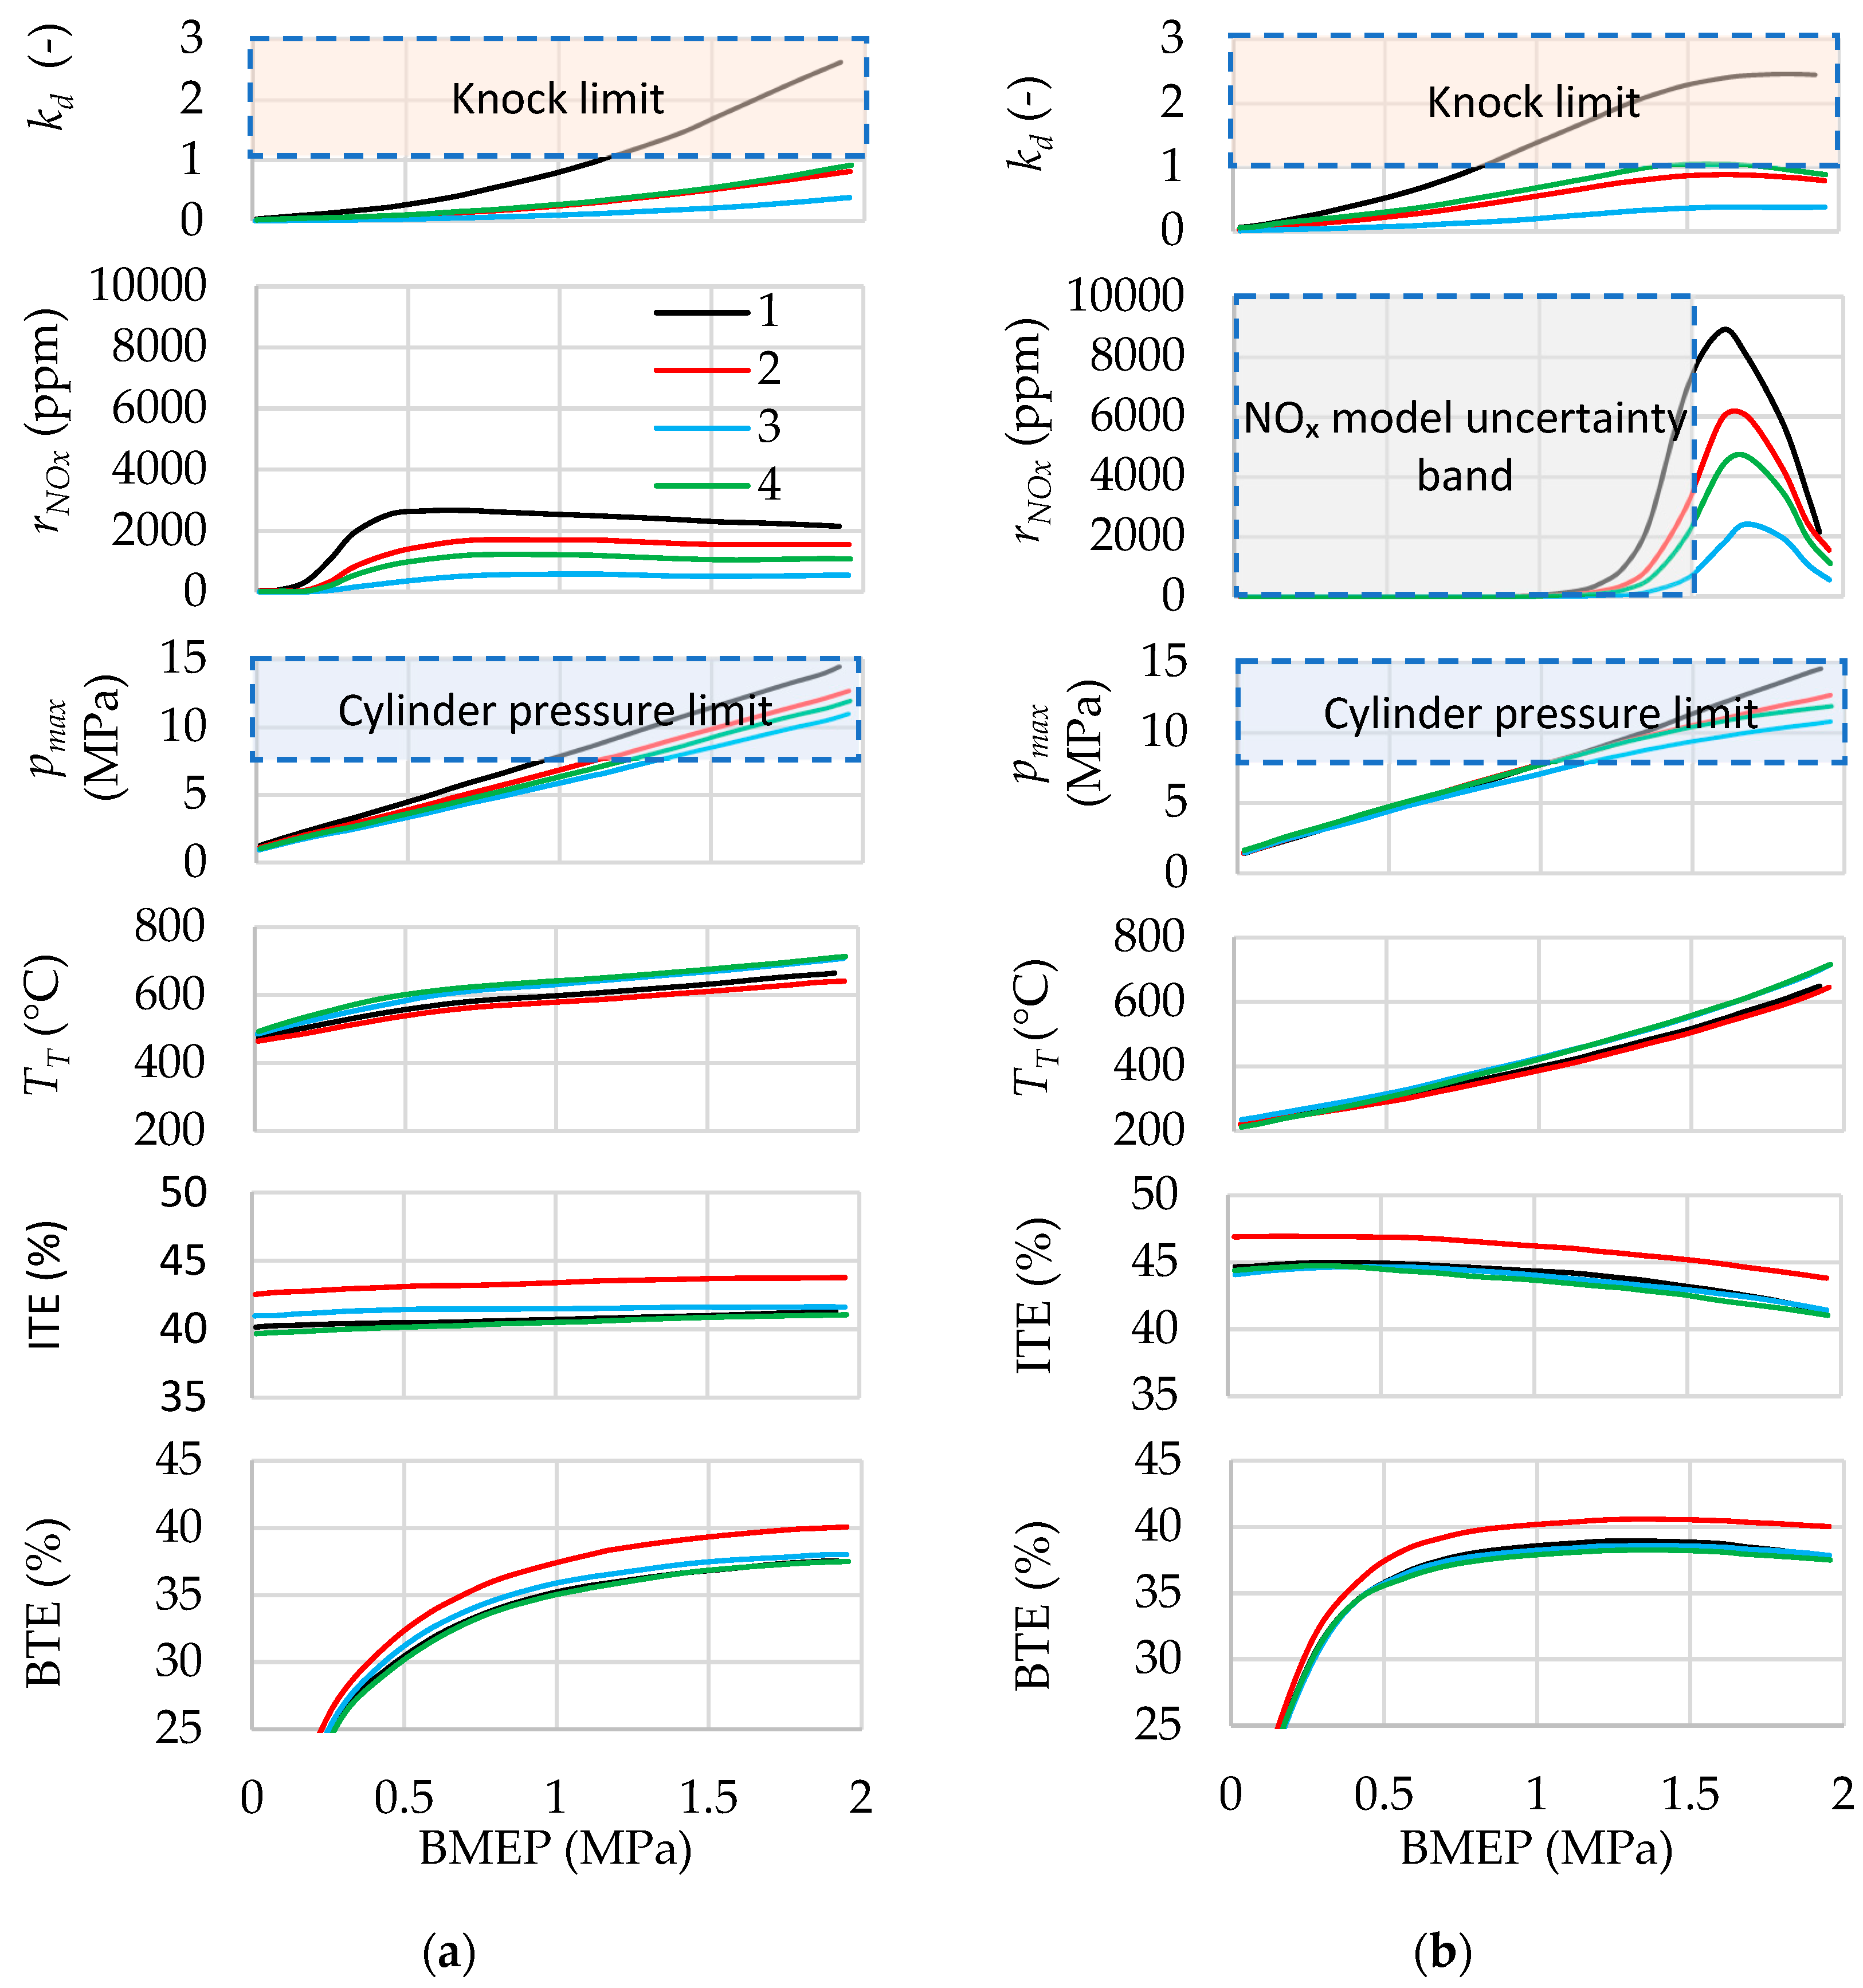
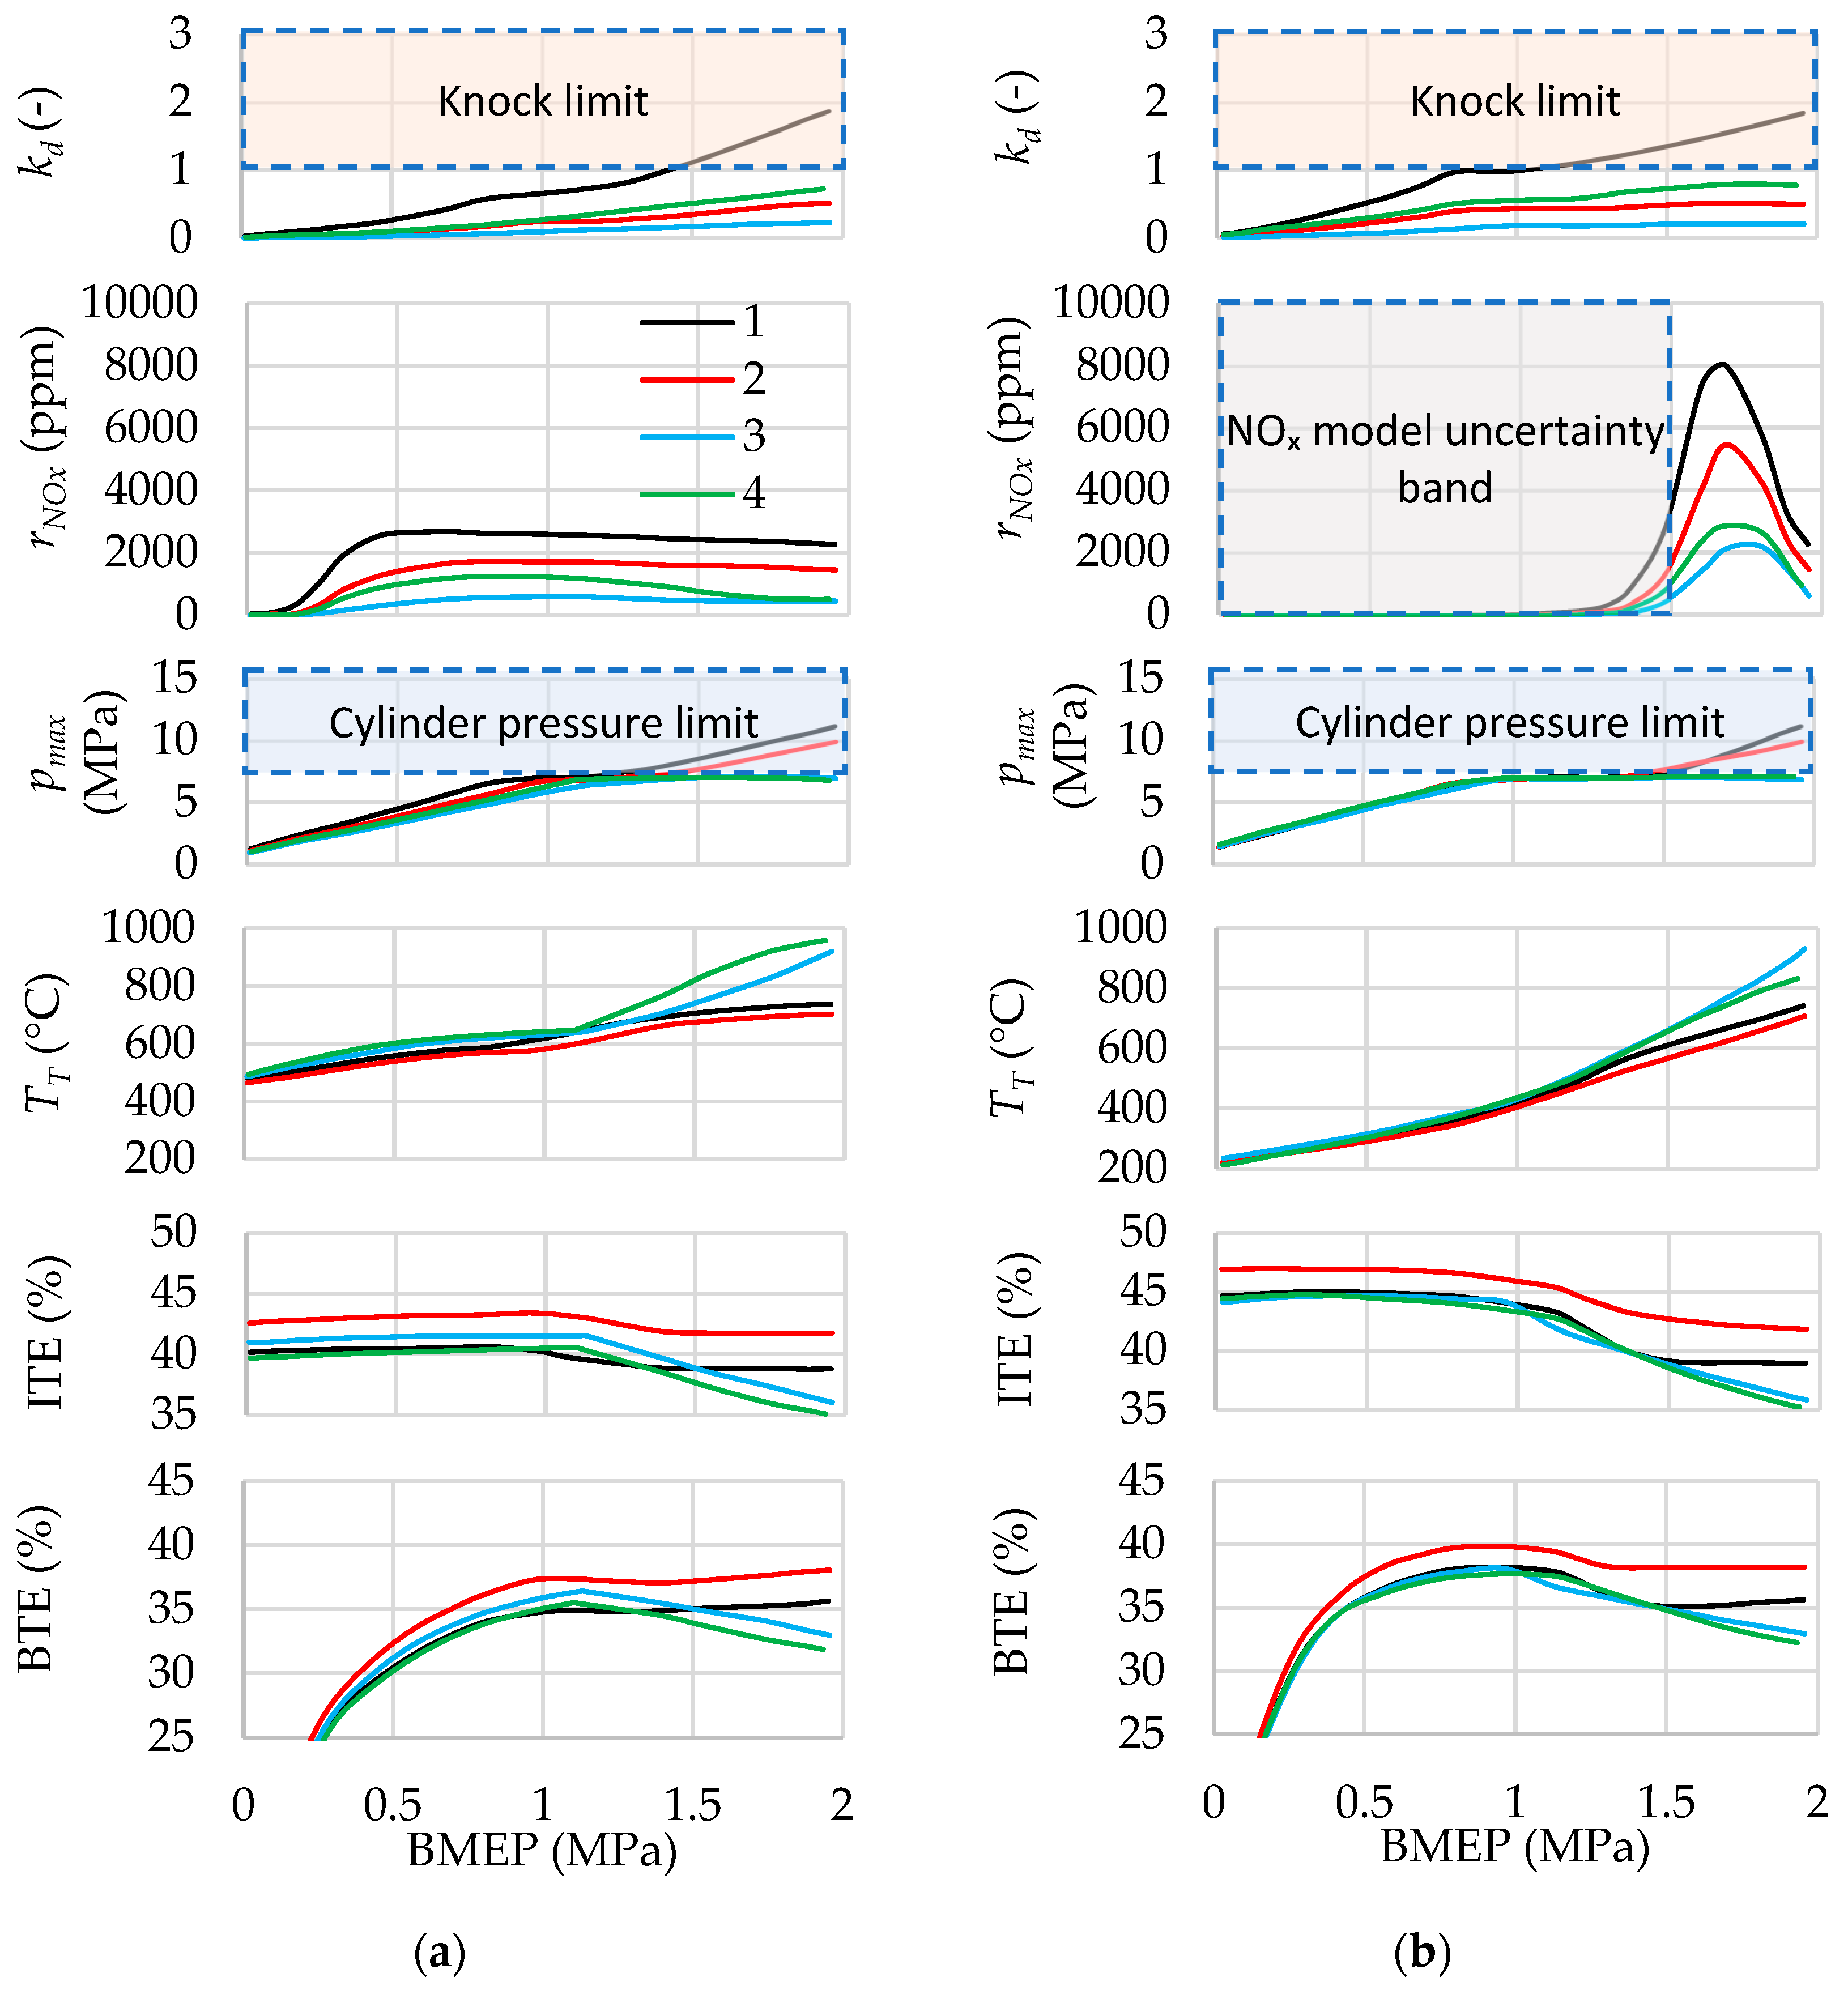
Using the selected injection and ignition parameters for various strategies, engine performance parameters are calculated at load modes from 0 MPa to 1.95 MPa with λ = 1 and λ = var. Figure 20 shows the influence of load on the engine parameters when the injection parameters are optimised for maximum ITE without constraints, and Figure 21 shows the influence of load on the engine parameters when constraints on maximum cylinder pressure and knock are taken into account.
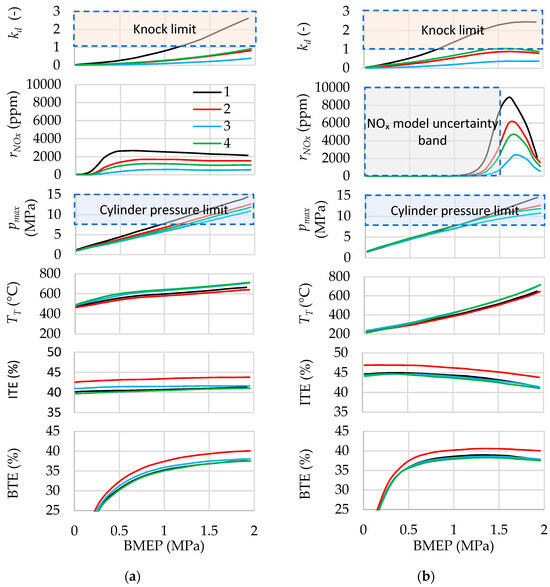
Figure 20.
Influence of load on engine parameters for different injection strategies: (a) λ = 1, (b) λ = var, n = 2000 rpm. 1—Single early injection. 2—Single late injection. 3—Jet-guided operation. 4—Dual injection with rI1/rI2 = 80%/20%. Injection parameters are selected without considering constraints on maximum cylinder pressure and knock criterion.
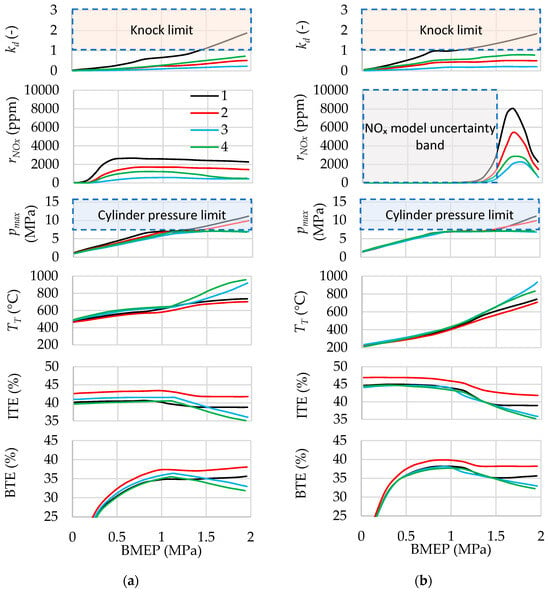
Figure 21.
Influence of load on engine parameters for different injection strategies: (a) λ = 1, (b) λ = var, n = 2000 rpm. 1—Single early injection. 2—Single late injection. 3—Jet-guided operation. 4—Dual injection with rI1/rI2 = 80%/20%. Injection parameters are selected considering constraints on maximum cylinder pressure and knock criterion.
As shown earlier, in dual injection, reducing the share of the first injection leads to a decrease in engine efficiency. Therefore, in the calculations based on the first method, the ratio of the first to the second injection is assumed to be 80%/20%, maintaining a relatively high share of the first injection. It was also shown above that at this ratio, dual injection is difficult to apply under low-load conditions with λ > 3.2. Therefore, in these operating conditions, a single late injection is used with a start of injection at −60 °CA ATDC and ignition timing selected to ensure an MFB50 of 8 °CA ATDC.
Figure 20 shows that when operating with λ = var, for most operating points and across all considered injection strategies, BTE and ITE increase by up to 4% compared with λ = 1 operation. The mixture leaning in this case causes the turbine inlet temperature to decrease by up to 270 °C. NOx emissions under λ = var reach their highest values (approximately three times greater than at λ = 1), which can be explained by the fact that maximum NOx formation occurs when the mixture is leaned to around λ = 1.1–1.25 [4,37,38]. However, under low-load conditions with λ > 2.5, NOx emissions with homogeneous mixtures are close to zero. Notably, the uncertainty of the NOx formation model at λ > 1.6 is high, which does not allow for a reliable comparative assessment of NOx emissions during stratified mixture combustion. The slight increase in the knock criterion at low and medium loads with λ = var is attributed to increased cylinder pressure and temperature at the end of the compression stroke due to higher airflow through the engine.
A comparative analysis of the application of different injection strategies shows that the most effective strategy is single late injection. This strategy, with mixture stratification, increases BTE and ITE by up to 2.5% and reduces peak NOₓ emissions by up to 1.4 times compared to single early injection. The turbine inlet gas temperature and peak cylinder pressure are reduced by up to 20 °C and 2.5 MPa, respectively. The knock criterion remains within acceptable limits.
The engine efficiencies of single early injection and jet-guided operation (with ignition occurring at the end of injection) are comparable, differing by no more than 1% in absolute terms. The advantage of jet-guided operation lies in its significantly lower knock tendency, 3.6–4.4 times lower peak NOx emissions, and up to 3.5 MPa lower peak cylinder pressures.
Using dual injection with an 80%/20% ratio of the first to the second injection slightly reduces BTE and ITE by up to 1%, increases turbine inlet temperature by up to 70 °C, decreases peak cylinder pressure by up to 1.8 MPa, reduces peak NOₓ emissions by approximately 1.8 times, and lowers the knock criterion by up to 2.6 times compared to single early injection.
Notably, when injection and ignition parameters are selected to maximise ITE, peak nitrogen oxide emissions remain high across all considered injection and mixture formation strategies, necessitating the use of an exhaust gas aftertreatment system or other NOx reduction methods (e.g., selective catalytic reduction, exhaust gas recirculation, water injection, etc.).
According to Figure 20, when the injection parameters are optimised for maximum ITE, the maximum cylinder pressure in all four strategies exceeds the allowable limit for the base engine, starting from BMEP levels of 0.8 MPa–1.1 MPa. Consequently, under medium and high load conditions, correction of injection and ignition parameters is necessary.
Figure 21 shows that for single injection, retarding the ignition timing up to 15 °CA ATDC makes it possible to maintain the maximum cylinder pressure within the allowable level only up to BMEP values of 1.25–1.4 MPa. However, under early injection, the knock criterion exceeds the permissible value.
The use of jet-guided operation and dual injection allows for a reduction in the maximum cylinder pressure to the specified limit and eliminates knocking. At the same time, the exhaust gas temperature increases to approximately 830–960 °C at maximum load, which corresponds to the typical levels observed in gasoline engine operation under similar conditions. This increases turbine power and compressor performance. However, it should be noted that under high-load conditions, this is accompanied by a significant reduction (up to 4.0%) in the engine’s BTE and ITE compared to single early injection.
Analysis of various injection strategies demonstrates that the highest efficiency values can be achieved by using late injection strategies combined with variable mixture composition. Assuming the engine is based on a diesel design and thus capable of withstanding relatively higher cylinder pressures, efficient operation of the hydrogen engine can be achieved across almost the entire load range.
When operation is constrained by the maximum cylinder pressure, it is recommended to set the ignition timing as late as possible within the limits of stable combustion. With further increases in load, applying dual injection or jet-guided operation is appropriate, with injection and ignition parameters determined according to the previously described method.
4. Conclusions
The study analyses the application of early and late injection, dual injection, and jet-guided operation in an automotive hydrogen spark-ignition (SI) engine. The key findings are as follows:
- Results show that, when using a variable air/fuel ratio strategy, achieving the desired ratio of the first injection to the second injection in dual injection is only possible within a certain range of air/fuel ratios.
- The effect of the start of injection in single and dual injection strategies, ignition timing, and the relationship between ignition and injection timing in jet-guided operation on the magnitude, timing, and duration of both the premixed and diffusion combustion is identified.
- Contour maps of engine performance parameters are created with ignition timing and start of injection (for dual injection—the timing of the second injection) as axes. This makes it possible to identify trends and peak values in engine performance across different injection strategies. Consequently, optimal combinations of ignition and injection parameters can be selected for each injection strategy and engine operating mode.
- Injection and ignition parameters are selected for different injection strategies under load modes ranging from BMEP 0 MPa to 1.95 MPa and at an engine speed of 2000 rpm. Two approaches are used for parameter selection:
- -
- In the first approach, ignition timing and start of injection (for dual injection—start of the second injection) are selected to maximise ITE based on contour maps.
- -
- In the second approach, constraints on peak cylinder pressure and knock criterion are additionally considered. When these values exceed allowable limits, later ignition timing is applied for all injection strategies. In the jet-guided strategy, the start of injection is additionally shifted toward the ignition timing. In the dual injection strategy, according to the authors’ methodology, the start of the second injection is retarded and the share of the first injection is reduced.
- Engine performance is simulated using selected injection parameters for various injection strategies under load modes from BMEP 0 MPa to 1.95 MPa at λ = 1 and λ = var and 2000 rpm. The results show that:
- -
- Operating with a variable mixture composition leads to higher engine efficiencies and lower turbine inlet temperatures at low and medium loads for all injection strategies, compared to stoichiometric operation. However, NOₓ emissions more than double.
- -
- The highest efficiencies are achieved with single late injection, while the lowest are observed with dual injection. Single early injection and jet-guided operation, with ignition occurring at the end of injection, result in intermediate efficiency levels. Single late injection, jet-guided operation, and dual injection reduce both the knock tendency and NOx emissions compared to early single injection. The highest increase in turbine inlet temperature occurs with dual injection and jet-guided operation.
- -
- When using injection and ignition parameters selected for maximum ITE, the cylinder pressure exceeds the permissible limit for the baseline engine across all injection strategies, starting from BMEP levels of 0.8–1.0 MPa. For early and late single injection, delaying ignition by up to 15 °CA ATDC is insufficient to keep the peak cylinder pressure below the acceptable limit at BMEP levels above 1.25–1.4 MPa. With jet-guided operation and dual injection, peak cylinder pressure can be maintained within acceptable limits across the entire load range.
- -
- Jet-guided operation and dual injection under knock/pressure-constrained conditions lead to higher turbine inlet temperatures, comparable to those of a gasoline engine. This enables increased maximum turbine power and compressor performance.
The study demonstrates that mitigating peak combustion pressure constraints enables the full realisation of the advantages of direct injection throughout the engine’s entire operating range. Future work will focus on improving the effectiveness of injection strategies for a hydrogen engine based on a diesel engine concept.
Author Contributions
Conceptualization, O.O. and R.H.; methodology, O.O.; software, O.O.; validation, O.O.; formal analysis, O.O. and R.H.; investigation, O.O.; resources, O.O.; data curation, O.O. and R.H.; writing—original draft preparation, O.O. and R.H.; writing—review and editing, O.O. and R.H.; visualisation, O.O.; supervision, R.H.; project administration, R.H. All authors have read and agreed to the published version of the manuscript.
Funding
The APC was funded by the Philipp Schwartz Initiative of the Alexander von Humboldt Foundation.
Data Availability Statement
The original contributions presented in the study are included in the article; further inquiries can be directed to the corresponding author.
Acknowledgments
The authors express their gratitude to the leadership of the University of Applied Sciences Cologne and the Faculty of Automotive Systems and Production for providing access to the MATLAB R2023a software license and facilitating the research and computational aspects of this study.
Conflicts of Interest
The authors declare no potential conflicts of interest with respect to the research, authorship, and/or publication of this article.
Abbreviations
The following abbreviations are used in this manuscript:
| ATDC | After Top Dead Centre |
| BMEP | Brake Mean Effective Pressure |
| BTE | Brake Thermal Efficiency |
| CA | Crank Angle |
| DI | Direct Injection |
| IMEP | Indicated Mean Effective Pressure |
| ITE | Indicated Thermal Efficiency |
| MFB50 | 50% Mass Fraction Burned |
| NOx | Nitrogen Oxides |
| PID | Proportional–Integral–Derivative |
| RON | Research Octane Number |
| SOI | Start of Injection |
References
- Stepien, Z.A. Comprehensive Overview of Hydrogen-Fueled Internal Combustion Engines: Achievements and Future Challenges. Energies 2021, 14, 6504. [Google Scholar] [CrossRef]
- Sun, Z.; Hong, J.; Zhang, T.; Sun, B.; Yang, B.; Lu, L.; Li, L.; Wu, K. Hydrogen engine operation strategies: Recent progress, industrialization challenges, and perspectives. Int. J. Hydrogen Energy 2023, 48, 366–392. [Google Scholar] [CrossRef]
- Gao, W.; Fu, Z.; Li, Y.; Li, Y.; Zou, J. Progress of Performance, Emission, and Technical Measures of Hydrogen Fuel Internal-Combustion Engines. Energies 2022, 15, 7401. [Google Scholar] [CrossRef]
- Verhelst, S. Recent progress in the use of hydrogen as a fuel for internal combustion engines. Int. J. Hydrogen Energy 2014, 39, 1071–1085. [Google Scholar] [CrossRef]
- Schrank, M.; Langer, V.; Jacobsen, B.; von Unwerth, T. Wasserstoffverbrennungsmotor als alternativer Antrieb—Metastudie; NOW GmbH—Nationale Organisation Wasserstoff- und Brennstoffzellentechnologie: Berlin, Germany, 2021. [Google Scholar]
- Eichlseder, H.; Wallner, T.; Freymann, R.; Ringler, J. The Potential of Hydrogen Internal Combustion Engines in a Future Mobility Scenario; SAE Technical Paper 2003, 2003-01-2267; SAE International: Warrendale, PA, USA, 2023. [Google Scholar]
- Tanno, S.; Ito, Y.; Michikawauchi, R.; Nakamura, M.; Tomita, H. High-efficiency and low-NOx hydrogen combustion by high pressure direct injection. SAE Int. J. Engines 2010, 3, 259–268. [Google Scholar] [CrossRef]
- Beyer, A.; Balmelli, M.; Merotto, L.; Wright, Y.M.; Soltic, P.; Kulzer, A. DIH2jet (DI Hydrogen Combustion Process). In 2024 Stuttgart International Symposium on Automotive and Engine Technology; Kulzer, A.C., Reuss, H.C., Eds.; Springer Vieweg: Wiesbaden, Germany, 2024; pp. 53–67. [Google Scholar]
- Körfer, T.; Durand, T.; Adomeit, P.; Blomberg, M.; Michelet, F.; Combemale, L.; Meyer, S. Design and development of a high-performance H2 ICE for upcoming Dakar Rally championships—A promotor of carbon-free individual mobility. In Proceedings of the International Conference on Powertrain Systems for a Sustainable Future, London, UK, 29–30 November 2023. [Google Scholar]
- Huang, Z.; Wang, L.; Pan, H.; Li, J.; Wang, T.; Wang, L. Experimental study on the impact of hydrogen injection strategy on combustion performance in internal combustion engines. ACS Omega 2023, 8, 39427–39436. [Google Scholar] [CrossRef] [PubMed]
- Gerke, U. Numerical Analysis of Mixture Formation and Combustion in a Hydrogen Direct-Injection Internal Combustion Engine. Ph.D. Thesis, Swiss Federal Institute of Technology, Zürich, Switzerland, 2007. [Google Scholar]
- Mohammadi, A.; Shioji, M.; Nakai, Y.; Ishikura, W.; Tabo, E. Performance and Combustion Characteristics of a Direct Injection SI Hydrogen Engine. Int. J. Hydrogen Energy 2007, 32, 296–304. [Google Scholar] [CrossRef]
- Wallner, T.; Scarcelli, R.; Nande, A.; Naber, J. Assessment of multiple injection strategies in a direct injection hydrogen research engine. SAE Int. J. Engines 2009, 2, 1701–1709. [Google Scholar] [CrossRef]
- Sterlepper, S.; Fischer, M.; Claßen, J.; Huth, V.; Pischinger, S. Concepts for hydrogen internal combustion engines and their implications on the exhaust gas aftertreatment system. Energies 2021, 14, 8166. [Google Scholar] [CrossRef]
- Schmelcher, R.; Kulzer, A.; Gal, T.; Vacca, A.; Chiodi, M. Numerical Investigation of Injection and Mixture Formation in Hydrogen Combustion Engines by Means of Different 3D-CFD Simulation Approaches; SAE Technical Paper 2024-01-3007; SAE International: Warrendale, PA, USA, 2024. [Google Scholar]
- Grabner, P.; Eichlseder, H.; Gerbig, F.; Gerke, U. Optimisation of a hydrogen internal combustion engine with inner mixture formation. In Proceedings of the 1st International Symposium on Hydrogen Internal Combustion Engines, Graz, Austria, 28–29 September 2006. [Google Scholar]
- Roy, M.K.; Kawahara, N.; Tomita, E.; Fujitani, T. Jet-guided combustion characteristics and local fuel concentration measurements in a hydrogen direct-injection spark-ignition engine. Proc. Combust. Inst. 2013, 34, 2977–2984. [Google Scholar] [CrossRef]
- Spuller, C. Dieselbrennverfahren mit Wasserstoff für PKW-Anwendung. Ph.D. Thesis, Technische Universität Graz, Graz, Austria, 2011. [Google Scholar]
- Beyer, A.; Berner, H.J.; Casal Kulzer, A. A Non-premixed Hydrogen Combustion Process Using a Spark-Ignited Hydrogen Jet. In Proceedings of the 2023 Conference on Powertrains with Renewable Energy Carriers, Stuttgart, Germany, 28–29 November 2023. [Google Scholar]
- Qiang, Y.; Cai, X.; Xu, S.; Wang, F.; Zhang, L.; Wang, S.; Ji, C. Effect of injection strategy on the hydrogen mixture distribution and combustion of the hydrogen-fueled engine with passive pre-chamber ignition under lean burn condition. Fuel 2024, 375, 132610. [Google Scholar] [CrossRef]
- Zhu, J.; Zhang, J.; Qian, Y.; Lu, X. Computational assessment of hydrogen multiple injection strategy in an active pre-chamber jet ignition ammonia-hydrogen engine. Fuel 2025, 405, 136651. [Google Scholar] [CrossRef]
- Liang, Z.; Xie, F.; Lai, K.; Chen, H.; Du, J.; Li, X. Study of single and split injection strategies on combustion and emissions of hydrogen DISI engine. Int. J. Hydrogen Energy 2024, 49, 1087–1099. [Google Scholar] [CrossRef]
- Osetrov, O.; Haas, R. Hydrogen operation strategies in a turbocharged SI engine: Challenges and solutions. SAE Int. J. Engines 2025, 18. [Google Scholar] [CrossRef]
- Osetrov, O.; Haas, R. Simulation of Hydrogen Combustion in Spark ignition Engines Using a Modified Wiebe Model; SAE Technical Paper 2024, 2024-01-3016; SAE International: Warrendale, PA, USA, 2024. [Google Scholar]
- Osetrov, O.; Haas, R. Modeling homogeneous, stratified, and diffusion combustion in hydrogen SI engines using the Wiebe approach. Energies 2025, 18, 3004. [Google Scholar] [CrossRef]
- Kuleshov, A.S. Diesel-RK Engine Calculation and Optimisation Program: Description of Mathematical Models and Solution of Optimisation Problems: Textbook; Bauman Moscow State Technical University: Moscow, Russia, 2004. (In Russian) [Google Scholar]
- Zvonov, V.A. Toxicity of Internal Combustion Engines; Mashinostroenie: Moscow, Russia, 1973. (In Russian) [Google Scholar]
- Zeldovich, Y.B.; Polyarny, A.I. Calculations of Thermal Processes at High Temperatures; BNT: Moscow, Russia, 1947. (In Russian) [Google Scholar]
- Douaud, A.; Eyzat, P. Four-Octane-Number Method for Predicting the Anti-Knock Behavior of Fuels and Engines; SAE Technical Paper 1978, 780080; SAE International: Warrendale, PA, USA, 1978. [Google Scholar]
- Millo, F.; Piano, A.; Rolando, L.; Accurso, F.; Gullino, F.; Roggio, S.; Bianco, A.; Pesce, F.; Vassallo, A.; Rossi, R. Synergetic Application of Zero-, One-, and Three-Dimensional Computational Fluid Dynamics Approaches for Hydrogen-Fuelled Spark Ignition Engine Simulation. SAE Int. J. Engines 2022, 15, 561–580. [Google Scholar] [CrossRef]
- Boretti, A.; Watson, H.C. Enhanced combustion by jet ignition in a turbocharged cryogenic port fuel injected hydrogen engine. Int. J. Hydrogen Energy 2009, 34, 2511–2516. [Google Scholar] [CrossRef]
- Al-Baghdadi, M.A.R. Development of a pre-ignition submodel for hydrogen engines. Proc. Inst. Mech. Eng. Part D J. Automob. Eng. 2005, 219, 1203–1212. [Google Scholar]
- U.S. EPA. 2013 Ford 1.6L EcoBoost Engine Tier 2 Fuel—Test Data Package. Version 2018-10. Ann Arbor, MI: National Vehicle and Fuel Emissions Laboratory, National Center for Advanced Technology. Available online: https://www.epa.gov/vehicle-and-fuel-emissions-testing/combining-data-complete-engine-alpha-maps (accessed on 10 July 2025).
- Stuhldreher, M.; Schenk, C.; Brakora, J.; Hawkins, D.; Moskalik, A.; DeKraker, P. Downsized Boosted Engine Benchmarking and Results; SAE Technical Paper 2015, 2015-01-1266; SAE International: Warrendale, PA, USA, 2015. [Google Scholar]
- Geiler, J.N.; Springer, K.M.; Lorenz, T.; Blomberg, M.; Achenbach, J.; Bloch, P. H2 Engine Hybrid Powertrain for Future Light Commercial Vehicles. In Internationaler Motorenkongress 2023; Heintzel, A., Ed.; Springer Vieweg: Wiesbaden, Germany, 2024; pp. 53–67. [Google Scholar]
- Fischer, M.; Sterlepper, S.; Pischinger, S.; Seibel, J.; Kramer, U.; Lorenz, T. Operation principles for hydrogen spark ignited direct injection engines for passenger car applications. Int. J. Hydrogen Energy 2022, 47, 5638–5649. [Google Scholar] [CrossRef]
- Luo, Q.; Lee, C. Controlling Strategy for the Performance and NOx Emissions of the Hydrogen Internal Combustion Engines with a Turbocharger; SAE Technical Paper, 2020-01-0256; SAE International: Warrendale, PA, USA, 2020. [Google Scholar] [CrossRef]
- Tang, X.; Kabat, D.M.; Natkin, R.J.; Stockhausen, W.F. Ford P2000 Hydrogen Engine Dynamometer Development; SAE Technical Paper 2002-01-0242; SAE International: Warrendale, PA, USA, 2002. [Google Scholar]
Disclaimer/Publisher’s Note: The statements, opinions and data contained in all publications are solely those of the individual author(s) and contributor(s) and not of MDPI and/or the editor(s). MDPI and/or the editor(s) disclaim responsibility for any injury to people or property resulting from any ideas, methods, instructions or products referred to in the content. |
© 2025 by the authors. Licensee MDPI, Basel, Switzerland. This article is an open access article distributed under the terms and conditions of the Creative Commons Attribution (CC BY) license (https://creativecommons.org/licenses/by/4.0/).

