Article

Predicting the Structure of Hydrogenase in Microalgae: The Case of Nannochloropsis salina

by
Simone Botticelli
1,2,
Cecilia Faraloni
3 and
Giovanni La Penna
2,4,*
1
Department of Physics, University of Roma Tor Vergata, Via della Ricerca Scientifica 1, 00133 Roma, Italy
2
Section of Roma Tor Vergata, National Institute for Nuclear Physics, Via della Ricerca Scientifica 1, 00133 Roma, Italy
3
Institute of BioEconomy, National Research Council, Via Madonna del Piano 10, 50019 Sesto Fiorentino, Italy
4
Institute of Chemistry of Organometallic Compounds, National Research Council, Via Madonna del Piano 10, 50019 Sesto Fiorentino, Italy
*
Author to whom correspondence should be addressed.
Hydrogen 2025, 6(4), 77; https://doi.org/10.3390/hydrogen6040077
Submission received: 29 August 2025 / Revised: 23 September 2025 / Accepted: 29 September 2025 / Published: 2 October 2025

Abstract

The production of green hydrogen by microalgae is a promising strategy to convert energy of sun light into a carbon-free fuel. Many problems must be solved before large-scale industrial applications. One solution is to find a microalgal species that is easy to grow, easy to manipulate, and that can produce hydrogen open-air, thus in the presence of oxygen, for periods of time as long as possible. In this work we investigate by means of predictive computational models, the [FeFe] hydrogenase enzyme of Nannochloropsis salina, a promising microcalga already used to produce high-value products in salt water. Catalysis of water reduction to hydrogen by [FeFe] hydrogenase occurs in a peculiar iron-sulfur cluster (H-cluster) contained into a conserved H-domain, well represented by the known structure of the single-domain enzyme in Chlamydomonas reinhardtii (457 residues). By combining advanced deep-learning and molecular simulation methods we propose for N. salina a two-domain enzyme architecture hosting five iron-sulfur clusters. The enzyme organization is allowed by the protein size of 708 residues and by its sequence rich in cysteine and histidine residues mostly binding Fe atoms. The structure of an extended F-domain, containing four auxiliary iron-sulfur clusters and interacting with both the reductant ferredoxin and the H-domain, is thus predicted for the first time for microalgal [FeFe] hydrogenase. The structural study is the first step towards further studies of the microalga as a microorganism producing pure hydrogen gas.

1. Introduction

In the perspective of hydrogen as a wide-used energy vector, the direct photobiological production of it provides a production/usage cycle basically “from water to water”, thanks to the primary energy source, the sun light, and the abundance of water. This type of hydrogen fuel is also known as “green hydrogen” [1,2]. The understanding, at molecular level, of the peculiar catalysts allowing this cycle is then of utmost importance [3].
Microalgae (MA, hereafter) are photosynthetic eukaryotic organisms that, in particular conditions, produce hydrogen as a pure gas [4,5,6,7]. At the oxygen evolving center (OEC) of photo-system II (PSII) water is converted into dioxygen after the charge separation events induced by light absorbance in chlorophyll and other pigments:
2 H 2 O + light O 2 + 4 H + + 4 e .
The electrons are transported to the iron-sulfur (FeS) protein ferredoxin (Fd) via a series of molecules embedded in the chloroplast membranes (thylakoid) and by means of photosystem I (PSI). In normal light conditions electrons are driven to the Calvin cycle to convert CO2 into carbohydrates. The formation of H2 becomes possible when accumulation of electrons in the photosynthetic apparatus occurs, leading to the activation of quenching of the excessive reducing power driving electrons to protons in the stromal water environement. In microalgae this reaction is catalyzed by the enzyme [FeFe] hydrogenase (Hyd) that is expressed in all microalgae and demolished in the presence of increasing dioxygen. Catalysis is due to the presence in Hyd of peculiar iron-sulfur (FeS) clusters. Under the particular conditions occurring when Hyd is expressed and stable, ferredoxin forms a complex with it and through a series of FeS clusters electrons are transferred to protons:
2 e + 2 H + H 2 .
In practice this reaction is made of one-electron proton-coupled transfers. Lowering the energy barrier for the separation of dihydrogen into protons and electrons (Reaction (2)) is at the core of all classes of hydrogenases [8,9]. Direction of the reaction is driven by modifications of metal clusters and protein matrix. [NiFe] hydrogenases, expressed mainly by cyanobacteria, favour the uptake of dihydrogen (backward reaction), while [FeFe] hydrogenases (bacteria and MA) catalyze the proton reduction into dihydrogen (foreward reaction). According to recent studies of the mechanism of [FeFe] hydrogenase [10] the first step is the formation of reduced and protonated form of Hyd, indicated as H hyd since it is a Fe-bound hydride species:
2 e + H + + Hyd H Hyd .
The following steps are the combination of the hydride species with the second proton and the release of H2. The occurrence of all of these steps is possible because of the presence of a correctly folded Hyd enzyme, where FeS clusters are placed, together with that of ferredoxin, in a highly concerted assembly resembling a conducting wire [11]. Both the ferredoxin and hydrogenase protein matrices assist this peculiar FeS cluster assembling. Essential chacteristics of the FeS clusters’ assembly are:
  • FeS clusters are close one to each other to allow electron transfer among them;
  • the terminal (active) FeS cluster (H-cluster) must interact with water molecules to transfer electrons to a polarized H-O bond; this step must be hindered to all except H-cluster;
  • FeS clusters must resist, in the assembly, as much as possible to oxidation by reactive oxygen species formed by O2, to sustain hydrogen production as long as possible in the presence of a small amount of O2 formed at the OEC and diffusing in the chloroplast.
The process described above is the direct biophotolysis (DBP) of water to produce hydrogen. A detailed comparison of DBP to, for instance, photovoltaic electrolysis (PVE) of water, the most mature technology for green hydrogen, has been made [12]. Though the cost of 1 kg of hydrogen by PVE is about one half of that produced by DBP, all possible ways to produce green hydrogen must be pursued, because of unpredictable changes in prices and availability of the materials required by electronic devices, electrodes and membranes in PVE. At laboratory scale, the measurements of hydrogen production by DBP in MA cell cultures is relatively easy for MA studied since long time (see Ref. [13] and references therein).
Nannochloropsis salina (Ns) is a unicellular microalga with a great potential impact in biotechnology [14]. Compared to other MA species that are studied since long time for hydrogen production (Chlamydomonas reinhardtii, Chlorella vulgaris, Cr and Cvu, respectively), this species can produce hydrogen in salt water, thus allowing cultures not diverting fresh water from other purposes (irrigation, human consumption). The possibility, yet remote, to grow unicellular algae almost open air, in sea water basins and under sun light is very attractive in future large scale hydrogen production plants. Ns is particularly efficient in lipid production, thus allowing the integration among different processes and productions by optimizing the life conditions and environment of the microalga [15,16]. This process design involves the primary understanding of the hydrogen production conditions and the optimization, even by genetic engineering, of the microalgae.
The structure of Ns Hyd is not known, while that of bacteria Clostridium pasteurianum (isoform I, CpI) [10] and Desulfovibrio desulfuricans (Dd) [17] were determined by x-ray crystallography. Because of the chain length (larger than 700 residues), the [FeFe] hydrogenase of Ns can host an amount of FeS clusters comparable to that in [FeFe] hydrogenase of bacteria, that are multi-domain enzymes. As for MA only the single-domain C. reinhardtii structure was determined experimentally for HydA1 form [18,19], displaying a high strutural similarity with the H-domain (the protein domain containing the active FeS cluster, the H-cluster) of bacterial Hyd. The number of residues in CpI, Ns, Cvu, and Cr is, respectively, 574, 708, 549, and 457. The structure of CpI is represented in Figure 1 to introduce the architecture of the two-domains’ [FeFe] hydrogenase.
In this work we present structural information about N. salina Hyd by means of computational methods, starting from AlphaFold predictions [21] and applying atomistic computational methods [22,23,24] to explore the stability of the predictions. The structure of Hyd in Chlorella vulgaris was predicted by using the same methods [24] and it is still awaiting for an experimental confirmation. As for Cvu the methods predicted the presence of an auxiliary FeS cluster wrapped into an auxiliary domain (F-domain, with F indicating that it is the domain binding ferredoxin) and at a correct working distance from the active FeS cluster (H-cluster) embedded into the H-domain. The folding of the auxiliary F-domain was found crucial to provide a possible active enzyme that was previously unknown. The above Cvu prediction was, therefore, the first structure of a two-domains [FeFe] hydrogenase in microalgae. In the case of Ns the first structural predictions presented in this work contain four auxiliary FeS clusters all embedded in a folded auxiliary F-domain. Beside the draft structure of the protein including active and auxiliary FeS clusters, the remarkable result we found is that in representative low free energy configurations the distances between the FeS clusters allow the electron transport from the most solvent accessible FeS cluster to the H-cluster, as required by a working [FeFe] hydrogenase.

2. Materials and Methods

In the following for brevity the acronyms listed at the end of the text are used.

2.1. Structure Predictions from Sequence

The sequence of [FeFe] hydrogenase in N. salina has been recently published [25] and can be found in GenBank database with the ID TFJ80951.1. The sequence above, of 708 aminoacids, was used as query to AlphaFold2 (AF) [21]. The jackhmmer method [26] was used for multiple sequence alignment (genetic search). After the genetic search step, the structural search was performed through the steps described in details in the Supplementary information of Ref. [21] (Section 1.2.3). Our aim was to use AF to obtain slightly different structural proposals. As a compromise between requested computational time and number of proposals, we used the 5-models assessment described in Section 1.9 of Supplementary information [21]. The 5 highest rank structures were collected, where the rank was measured by the predicted per-residue (C α ) local distance difference test (plDDT) [27]. No energy relaxation was performed, while a more elaborate method to equilibrate the structural models with highest confidence was used as described in the following subsections.
The use of more advanced ranking techniques is also possible. For instance AlphaFold Data-base Foldseek [28] is a method ranking structures not only by confidence, but also by structural similarity to all available entries in the AlphaFold data-base. However, the aim of our work is to take profit of a number of reasonable models generated by deep learning algorithms, rather than a single structure with high rank.
The input script to AF we used is provided as Supplementary Materials to allow reproduction of initial structures preparation. By using the AlphaFold2 web-server the prediction of 5 structures with high statistical weight took about 4 h.

2.2. Structure Refinement

After the initial structure predictions (see previous sub-section), in all models we bonded all the clusters inside the protein matrix as in the H-ox state: the Fe4S4 cluster in H-cluster (cluster 1) has the charge 2+, corresponding to the formal Fe2(II)Fe2(III) oxidation state of iron ions; the di-iron part of the H-cluster has the charge −1, corresponding to the formal Fe(I)Fe(II) oxidation states of the two iron atoms; the auxiliary Fe4S4 clusters in F-domain (clusters 2–4) have the same parameters of Fe4S4 in H-cluster (cluster 1); the auxiliary Fe2S2 F-domain cluster (cluster 5) corresponds to the formal Fe(III)Fe(III) oxidation state of the two iron ions. This enzyme oxidation state mimics the state of the enzyme before its reduction by reduced ferredoxin: the auxiliary clusters closer to the outer surface of the protein are oxidized, thus ready to attract electrons from an external reductant species; the H-cluster, buried into the protein matrix, is in the resting state ready to attract electrons from the auxiliary clusters and to react with water molecules confined in the inner part of the enzyme.
In order to insert the clusters and run MD simulation we used the available force-field parameters of FeS clusters [29] that we adapted to the Charmm36 force-field for proteins [30]. This set-up was adopted to model the Hyd of Cvu [24]. The FeS clusters are explicitly bonded to the protein matrix, with the bonds between Cys residues and Fe atoms described by the chosen force-field. We inserted the protein (10,646 atoms) with 58 atoms in bound metal cofactors in a simulation cell, adopting periodic boundary conditions, with water and ions atoms to neutralize the system ([NaCl] = 0.15 M). The whole systems are made by number of total atoms in the range 209,280 ÷ 209,963, depending on the simulated replica (100, see below). After an initial energy minimization and equilibration in NVE statistical ensemble (20 ps), the systems were equilibrated for 100 ps in the NVT ensemble first at a temperature of T = 150 and than at T = 300 K. The equilibration was continued for another 2 ns in the NPT ensemble, at a constant T = 300 K with a bath relaxation time of 0.1 ps. The pressure was kept at 1 bar with a barostat relaxation time of 2 ps and compressibility of bulk water at room conditions.
Coulomb and Lennard-Jones interactions were described by means of a buffered Verlet pair list with a short-range cutoff equal to 1 nm [31]. Long-range electrostatic interactions were treated with the particle mesh Ewald method [32] with a grid spacing of 0.16 nm. The LINCS [33] and SETTLE [34] algorithms were employed to constrain, respectively, all protein bonds involving H atoms and internal degrees of freedom of water molecules, allowing to integrate the equations of motion with a 2 fs time-step.
Finally, starting from the equilibrated systems, we performed two sets of simulations. In the first set a multiple walkers metadynamics was performed combining the 100 replica using a unique external bias function of a chosen collective variable (CV). The converged metadynamics was used to measure the free energy as a function of the CV. The methods applied are described in the next sub-section.
In the second set the 100 walkers were entirely separated and NPT simulations were collected for 1 μ s for each walker. The last 2 ns of each walker, sampled with a period of 10 ps (a total of 100 × 200 configurations) were used for analysis.
All MD simulations were performed with the GROMACS 2022.3-2024.2 version [35,36]. The TopoGromacs Tool [37] was used to convert Charmm topology and parameters into Gromacs input data-sets.

2.3. Free Energy

Free energy as a function of a collective variable was computed using the methods described in Ref. [23]. The basis is the altruistic multiple-walkers metadynamics [38] with the parameters already applied to Cvu Hyd structure [24]. The enhanced statistics (metadynamics, MtD hereafter) is obtained from a swarm of trajectories (called walkers) used to build up an external bias function of a chosen collective variable (CV). The final obtained bias is then kept fixed, collecting configurations in the final step of the NPT simulation, desribing the metastatistics. The time evolution of each of the walkers starts from an initial configurations built on the basis of AlphaFold predictions. We collected 20 walkers starting from each of the 5 AF models. Each of the 20 walkers differ in the orientation in the simulation cell, thus containing a different amount of water molecules and NaCl salt. Therefore, the initial configurations of each walker differ mainly because of the different initial configuration and of the different interactions of each configuration with the macromolecular environment. The initial differences are then amplified by the different construction of the external bias so that a variety of configurations among the many possible ones labelled by the values of the collective variable d (see below) are sampled.
In order to sample both active and inactive structures for Ns, we choose as CV the distance d between the center of mass of the two Fe4S4 clusters, one in the H-domain (cluster 1) and the other the closest one in the F-domain (cluster 2).
Each of the 5 AF proposals was randomly rotated 19 times and then inserted into an orthorhombic simulation cell, for a total of 20 initial configurations per model. We thus obtained 5 × 20 configurations, each used as starting configuration of a walker. The bias construction, providing the free energy as a function of the chosen collective variable d, lasted 18 ns after equilibration of 10 ns with no external bias of each walker. Gaussian functions were added to the bias every 10 ps. The bias exchange among the 100 walkers was performed every 2 ns. The free energy that will be analyzed in Results is the opposite of the converged bias. Simulations then continued at constant bias for 40 ns, with the last 10 ns for each walker stored for later analysis. Configurations were sampled every 10 ps, for a total of 100 × 1000 configurations representing the metastatistics. Averages are not reweighted to cancel the bias because at this stage we want to describe the behaviour of configurations sampled at different d values.
The maximal constrained entropy (MEC) method was then used to measure an alternative euristic free energy [22,23]. The salt water environment of each protein configuration was, for this purpose, replaced with a mean-field model of the water solution. The intra-molecular terms of the potential energy are exactly the same used for the MtD simulations.
The MtD simulations were performed with the same GROMACS package used for MD simulations and with the additional external forces as implemented in PLUMED 2.8–2.9 [39,40,41].

2.4. Analysis

Structural quantities of interest are described below. Root-mean square deviation (RMSD) measures the average distance between structure at time t 2 with respect to a reference structure at time t 1 . The definition of RMSD is:
RMSD ( t 2 , t 1 ) = 1 M i = 1 N a t o m s m i | r i ( t 1 ) r i ( t 2 ) | 2 ,
where M is the total mass of the molecule, m i and r i are the mass and position of atom i. The structure at time t 2 is standardly translated and rotated with respect to the reference one so as to minimize the RMSD. RMSD is useful to compare two structures and to study the differences emerging along the simulation.
Root-mean square fluctuation (RMSF) measures the average distance between atoms belonging to the same residue i, averaged over time. In our analysis we computed such quantity as emerging from a sub-set of eigenvectors of the covariance matrix, as it is routinely made in principal component analysis (PCA). To simplify the analysis we used the first 3 eigenvectors (descending order of eigenvalues) of the covariance matrix. Also, we used the C α atoms only to compute the covariance matrix, to focus the study on changes of the protein backbone.
In order to characterize the accessibility of the solvent to protein surface and clusters atoms we calculated the radial distribution function ( g ( r ) ) of water molecules, respectively. This calculation was performed using the thermal MD simulations and not the metastatistics. The function g ( r ) is defined as:
g ( r ) = 1 ρ b l o c a l 1 N a i a N a j b N b δ ( r i j r ) 4 π r 2 ,
where δ is the Dirac function and ρ b l o c a l the density of atoms of type b averaged over all spheres of radius r around atoms of type a.
Analysis was performed with the same GROMACS and PLUMED packages used in MD and MtD, and VMD 1.9.3 [20] graphical software.

3. Results

3.1. Structure Predictions from Sequence

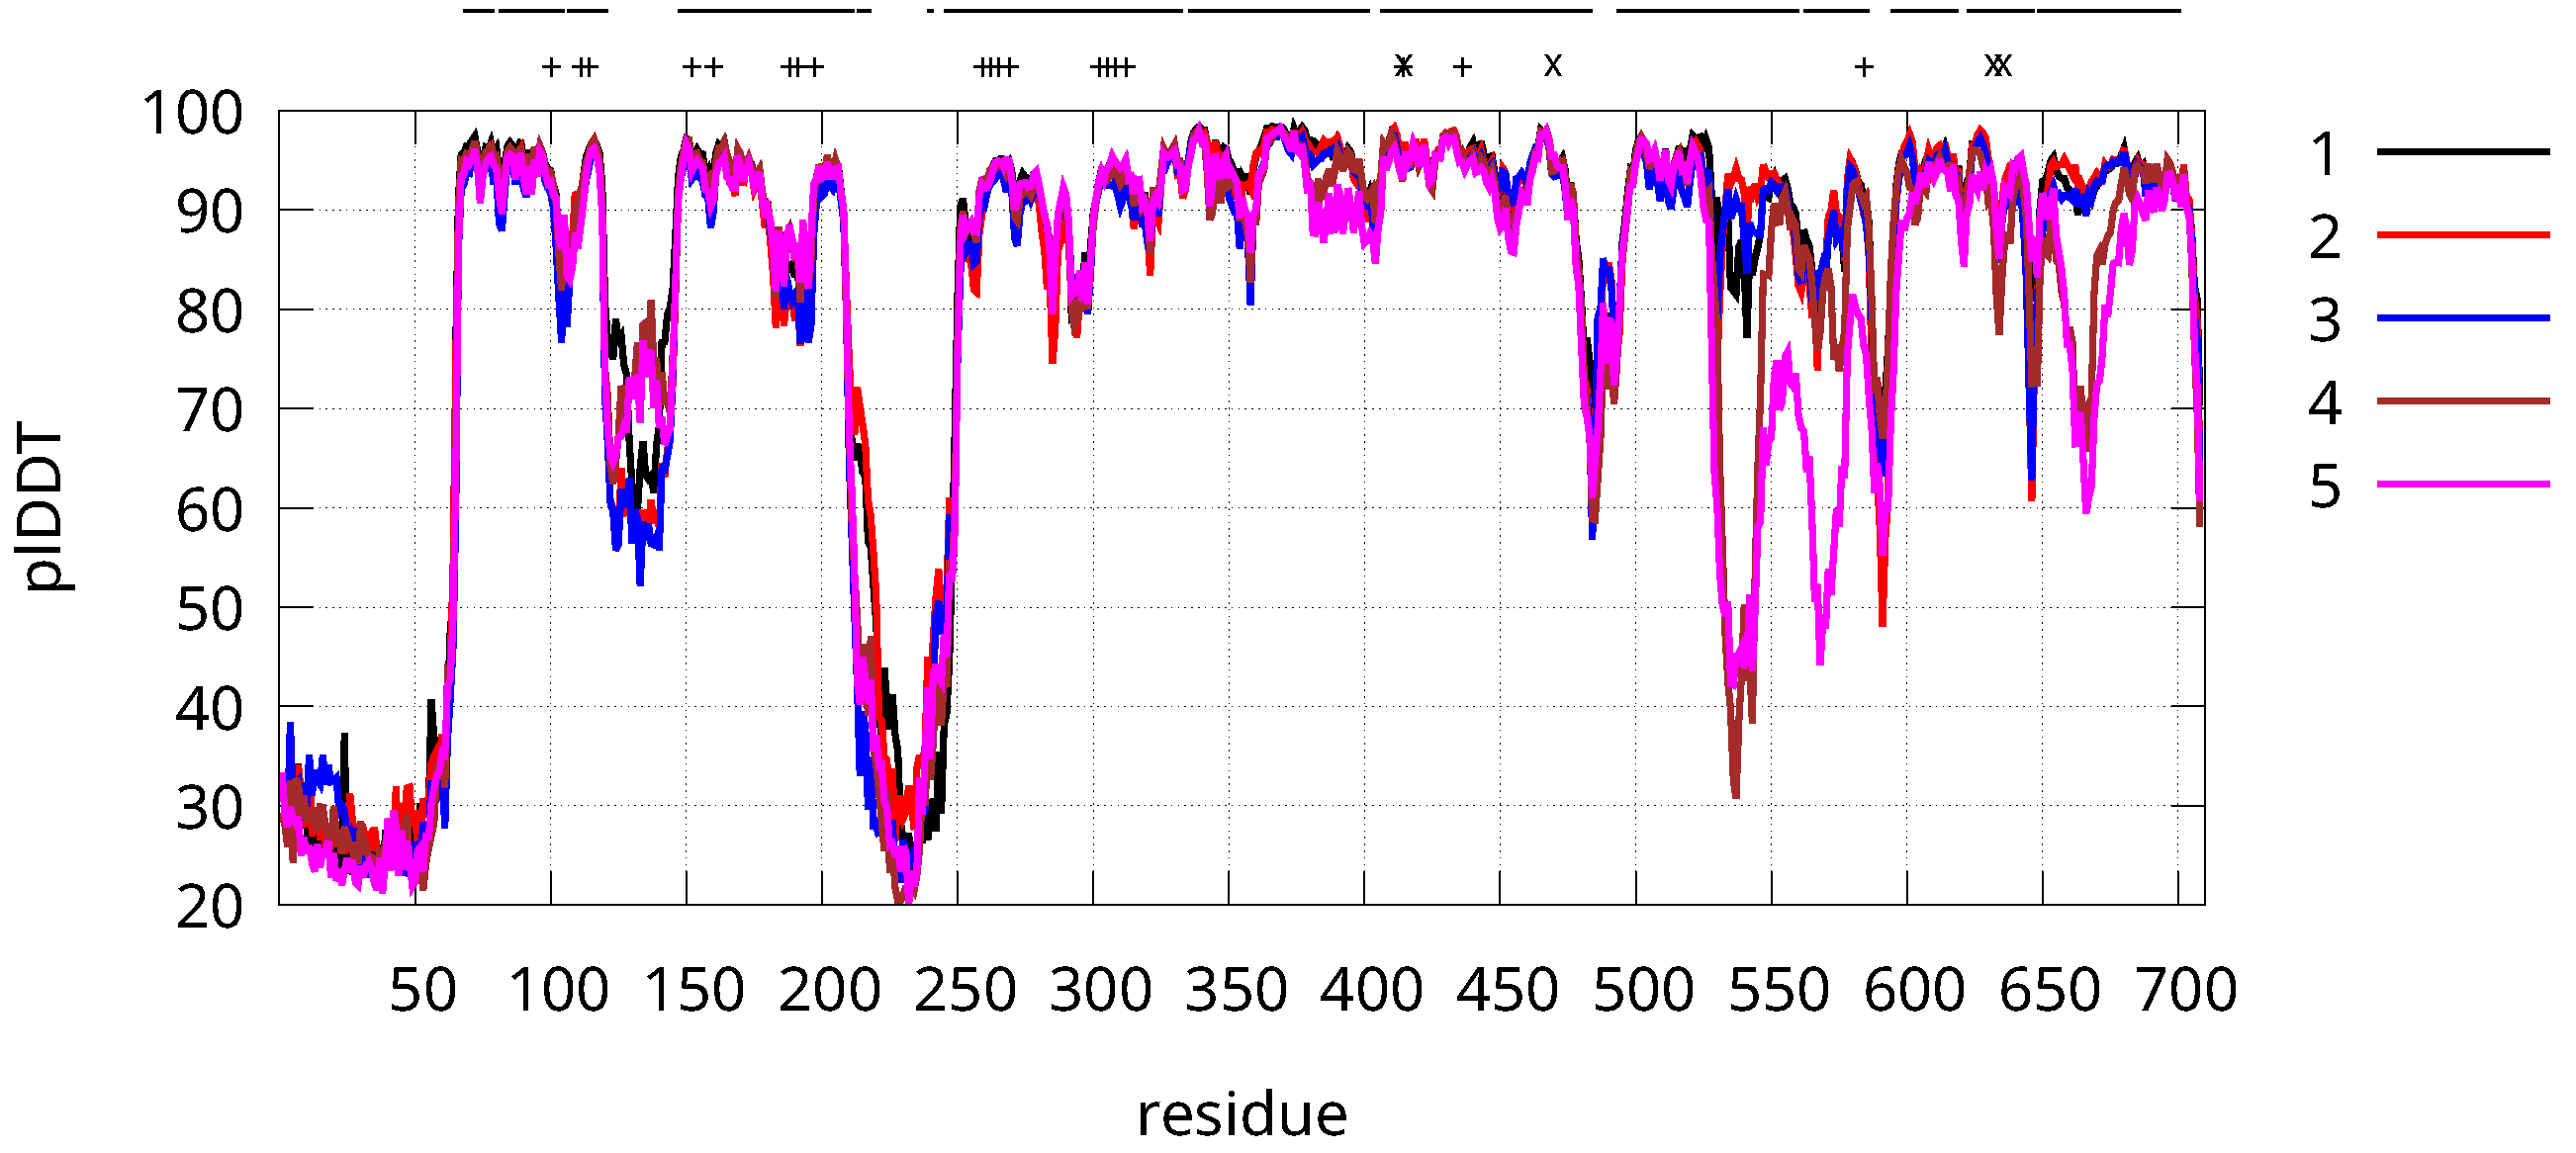
AlphaFold2 structural predictions are based on experimental data related to the proteins that display high similarity with the input sequence. Critical steps are therefore the multiple sequence alignment (MSA) and the concept of “similarity” as elaborated by deep learning. MSA provides a list of proposals that are ranked. Then the structural prediction resulting from the MSA addressed sequences gives 8 structures, among the first 10 with highest rank, very similar to CpI and Cr HydA1. Among this selection, five models are then stochastically built to provide structures with a high statistical weight. The following plDDT analysis (see Methods) extracts 5 highest rank structures. The limit of 4 structures with average plDDT lower than the maximum (the first chosen structure) was our choice (see in Supplementary Materials, the input file of AF, variable num_models). The more models are requested to the method, and the more is the information in the structure proposal coming from proteins with different function and/or of organisms different than MA and bacteria. For instance, the structure number 10 in the structural search is one component of the respiratory complex of a genetically modified yeast, Yarrowia lipolytica. The specific component is the ubiquinone oxidoreductase in the complex (PDB 6RFQ, chain A). Therefore, the choice of 5 models is to limit the effect of such off-path information obtained by deep-learning. In Figure 2 the 5 chosen plDDT values are displayed.
The plDDT values are larger than 80 (in the 100 scale) in most of the CpI aligned regions, but with significant deviations for 1–2 models in region 493–560. Among Cys residues, only Cys 584 belongs to a region that is not aligned to CpI (562–586 in Ns numbering). No Cys sidechains are in the low plDDT region contained in segment 493–560.
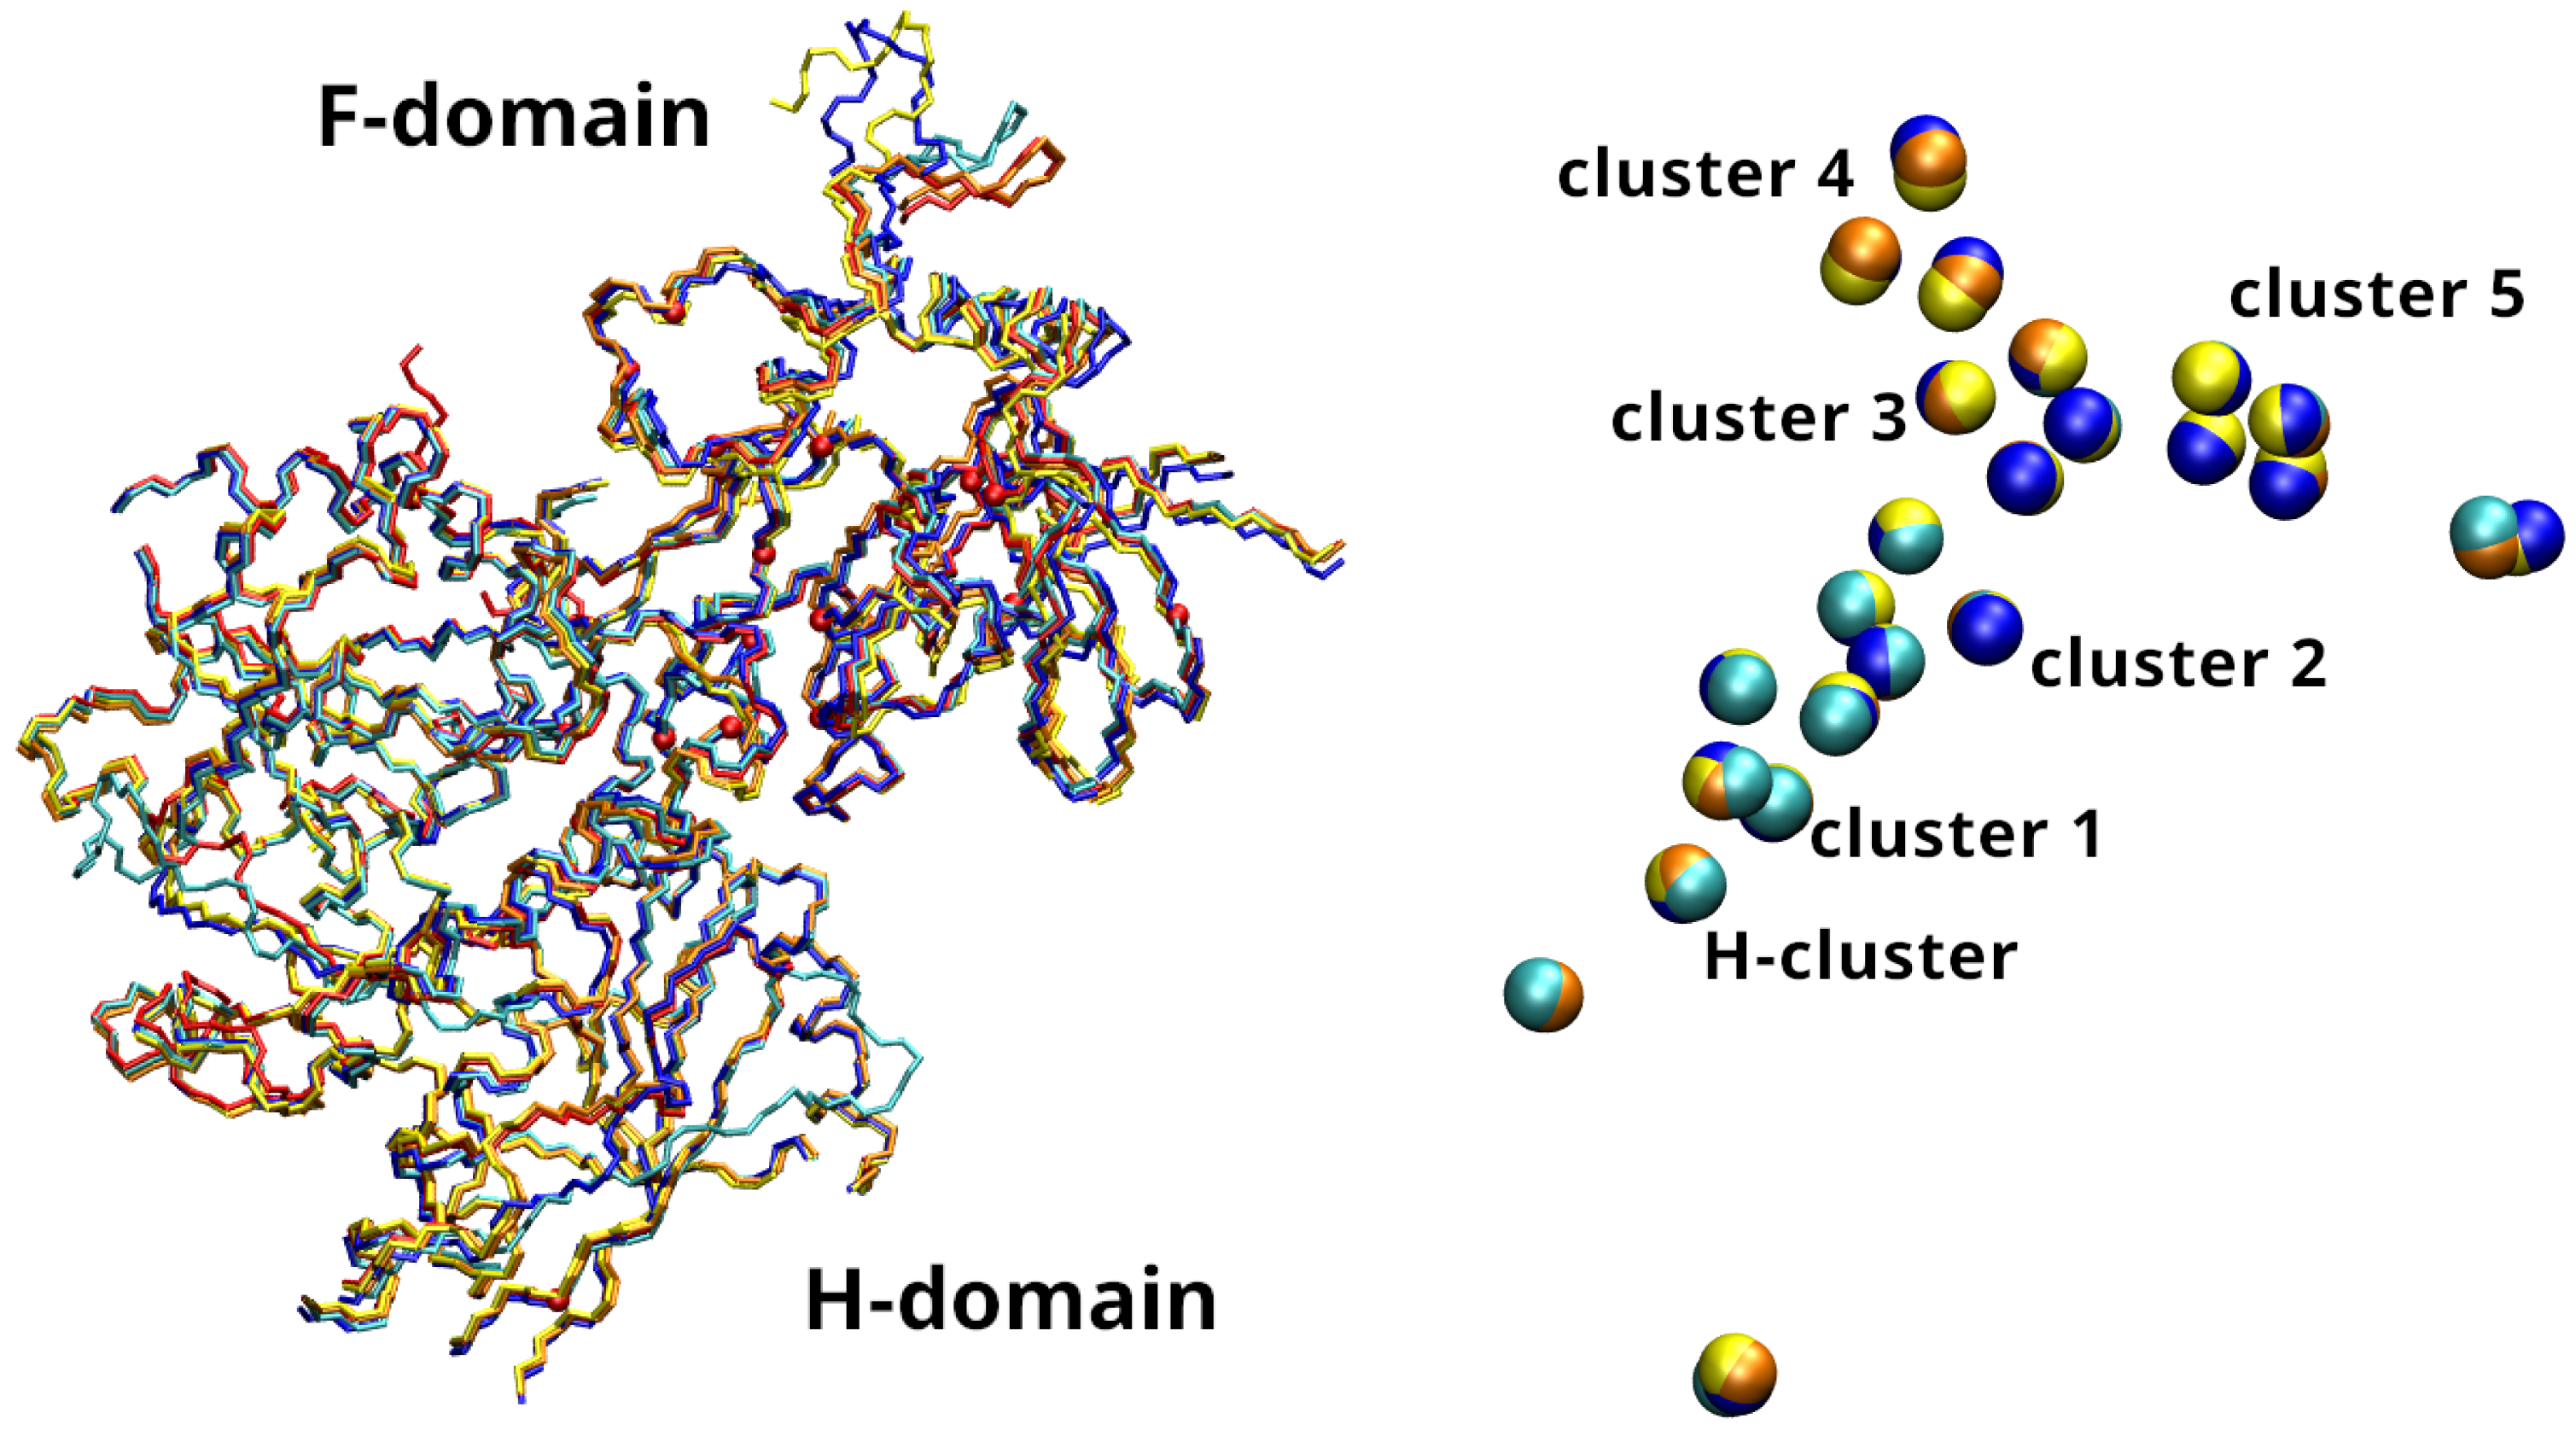
According to the final AF choice, the global architecture of Cys and His residues, the potential Fe ligands, is very similar among the chosen structures, even if the RMSD of Cys/His backbone atoms is always in the range 3 ÷ 7 Å. In the Ns candidate Hyd sequence there are 23 Cys residues, compared to 22 in CpI. Only 3 Cys residues in Ns have no correspondence in the aligned CpI sequence: Cys 60, 436 and 584 have Met, Ala and Glu, respectively, at corresponding position in CpI. Ns has 18 His residues compared to 10 His in CpI, but only 4 Ns His have correspondence in the aligned sequence of CpI: 184, 671, 693, 697. The RMSD of the 5 highest rank plDDT choices of AF is, with respect to aligned heavy backbone atoms (N, C α , C, and O) in CpI (PDB 6N59, chain A), in the range 2.6 ÷ 3.8 Å (Figure 3, left panel). The major advantage of AF is the construction of the loops connecting the aligned regions. It is interesting to notice that structural deviation in aligned regions is apparently larger in the H-domain than in the F-domain (Figure 3, left panel). In the F-domain there are more Cys residues and the presence of bonds between Cys and iron (indirectly learned by AF when structures are searched) is reflected to backbone fluctuations within models. Therefore, the protein backbone of the 5 models proposed by AF is similar to that of CpI in the structure with PDB ID 6N59, chain A, but with significant deviations. The extent of structural disorder of the loops was characterized by the following MD simulations starting from the 5 AF proposals.
This result shows that MSA followed by browsing the structural databases is able to extract significantly different potential metal binding sites, but all characterized by similar global architecture in the aligned sequences and different arrangements of the loops connecting them. Interestingly, the residue identity between Ns and CpI is only 37% and only slightly higher between Ns and Cr (48%), that is closer in phylogenetic tree. These data, taken together, show that the placement of metal binding sites is likely more important than sequence homology in defining the enzyme architecture and function. In our application, the major result of AF is the preparation of a bunch of structures containing structural information about the known [FeFe] hydrogenase with the largest number of residues, CpI. The arrangement in space of FeS cluster ligands is, therefore, adapted to CpI.

3.2. Constraints on FeS Clusters Positions

The FeS clusters have been introduced in atomistic models adapting their chemical composition to that of CpI, as suggested by Cys-Cys distances in the proposed AF models (Figure 3, right panel). The list of binding residues of each FeS cluster is in Table 1.
Table 1. Cys and His residues where S γ and N ϵ 2 atoms bind Fe. Each cluster is indicated with the same number used in Figure 3. The Cys residue that forms a bridge between Fe4S4 and the octahedral di-iron active site in the H-cluster is number 636. The azadithiolate S(CH2)NH(CH2)S ligand observed in CpI is abbreviated as adt.
ClusterBinding Residues
Fe2(adt)(CO)4(CN)2 (H-cluster)C636
Fe4S4 1 (H-cluster)C415, C470, C632, C636
Fe4S4 2C269, C302, C305, C308
Fe4S4 3C259, C262, C265, C312
Fe4S4 4H184, C188, C191, C197
Fe2S2 5C100, C111, C114, C152
The linkage between protein (Cys and His sidechains) and FeS clusters are made of explicit bonds as described in Methods. The charge distribution on atoms of FeS clusters and their ligand protein sidechains was performed as described in Methods and in Ref. [29].
The linkages between FeS clusters and the protein matrix are the same of those in bacterial CpI, but they were never observed before in MA [FeFe] hydrogenases. The Cr [FeFe] hydrogenase (where NMR and crystal structures have been determined) has no F-domain, because ferredoxin FeS cluster presumably interacts with the Fe4S4 component of Hyd H-cluster [42] and the N-terminus of Hyd (about 64 residues in HydA1) is disordered. The 4 additional FeS clusters observed in CpI are called auxiliary because they are not essential to catalysis of Reaction (2). In CpI the auxiliary FeS clusters are bound to the protein in a folded F-domain. The linkages that we impose according to the AF prediction are potentially embedded into a folded F-domain, but to check the degree of folding an explicit atomistic force field is required. This was the goal of our molecular dynamics simulations and free energy profiles based on them.

3.3. Free Energy Profiles

As explained in Methods, we monitored the stability of the initial models by changing the distance between Fe4S4 cluster in H-cluster (cluster 1) and the most proximal auxiliary FeS cluster (cluster 2). Therefore, as usual in simulated free energy profiles, we defined a collective variable d as the distance between the centers of mass of the two Fe4S4 compounds, respectively in H-cluster (cluster 1) and cluster 2.
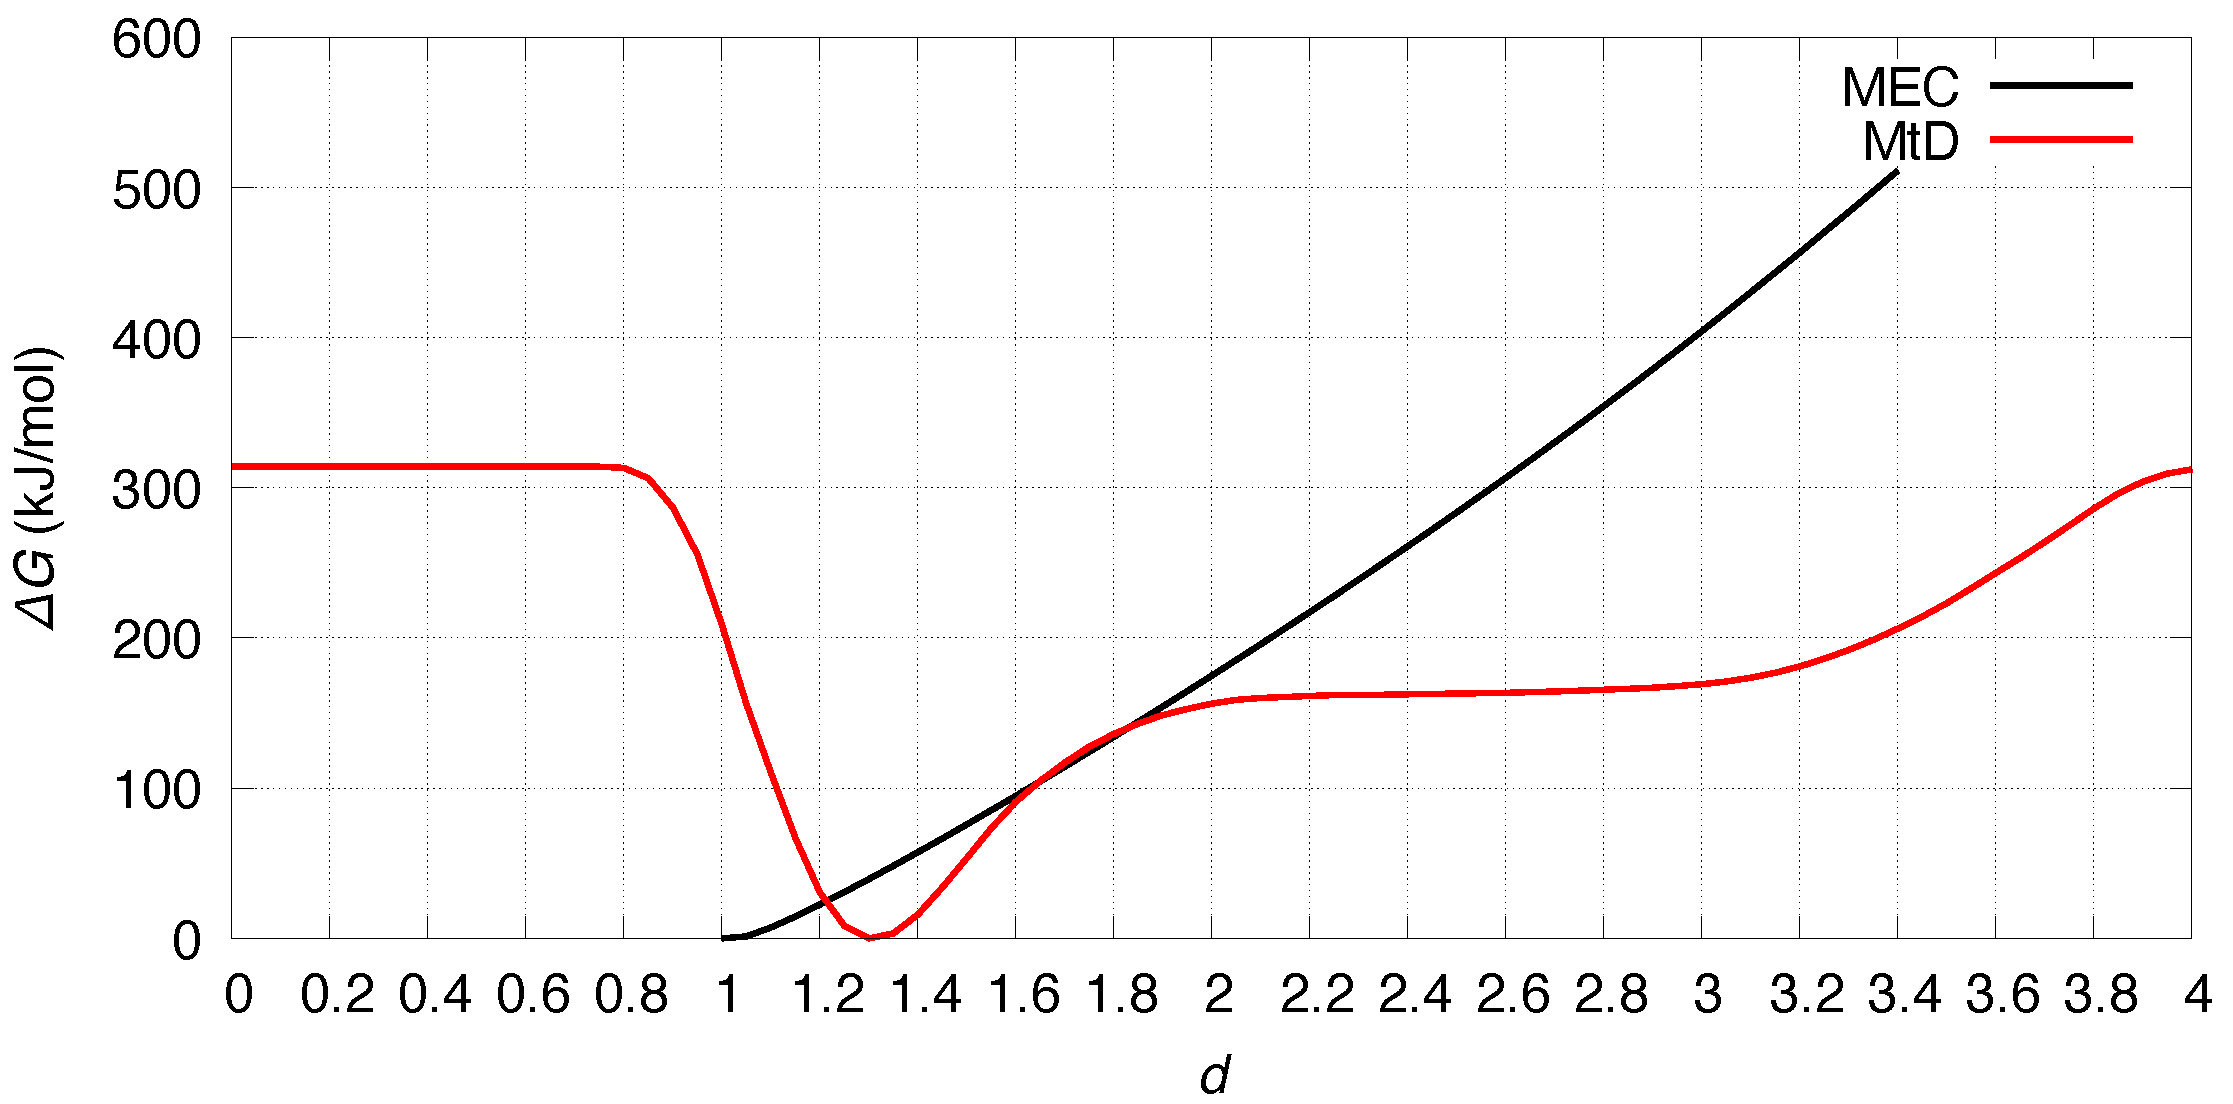
By oberving Figure 4, we notice that the values of d sampled by MtD are in the range 0.9 ÷ 3.0 nm, that is wide enough to probe the free energy change from compact to well expanded enzyme. In particular large d values describe proteins where H- and F-domain are taken apart, breaking the FeS wire at the junction between clusters 1 and 2. Conversely, small d values, in the range of 1.1 nm, are consistent with a conducting wire, at least according to recent observations [42]. To measure the probability at room conditions ( T = 300 K and P = 1 bar, in water solution of NaCl 0.15 M) of the distance between clusters 1 and 2, we used two methods, that we applied to similar proteins, to calculate free energy as a function of d. This profile provides also the values of the other inter-cluster distances consistent with the values of 1–2 distance, as it will be explained below. Both MtD and MEC methods predict a significant decrease of free energy upon the approaching of proximal FeS cluster (cluster 2) to the active one (cluster 1). Given the free energy profiles, among the 100,000 configurations analyzed, only those with d 1.4 nm significantly contribute to represent thermal conditions of Ns Hyd.
To further simplify the description and visualize the most relevant structures, we select 3 configurations among the 100,000 simulated ones, according to the rules in Table 2.
The RMSD of backbone heavy atoms between sample 2 and 1 is 1.6 Å, thus showing that the selection criteria 1 and 2 extract the same information. On the other hand, the RMSD between 3 and 1 is 10.4 Å, showing that the protein scaffold can move significantly around similarly assembled FeS clusters. In Figure 5 the selected structures 1 and 3 are displayed and compared to an initial configuration where the H- and F-domains are well separated by a large d value.
The secondary structure content in both the H- and F- domains is similar among the selected configurations. Conversely the mutual orientation of the secondary motifs changes considerably upon the packing of the F-domain over the H-domain and the consequent closing of the interface between the two domains. The decrease of free energy when d assumes small values is mainly due to interactions between the two domains, similarly to what has been found for the complex between Fd and the single-domain HydA1 in Cr [42]. It is known that the interactions between Fd and its partners are largely electrostatic in nature [43]. Since Fd is folded around its unique Fe2S2 cluster, we can infer that in our models the H-domain acts as a template to fold its F-domain partner, containing FeS clusters, to let the latter approach one the each other and to form an electron conducting assemply in a process that can be similar to the general formation of complexes between Fd and its partners.
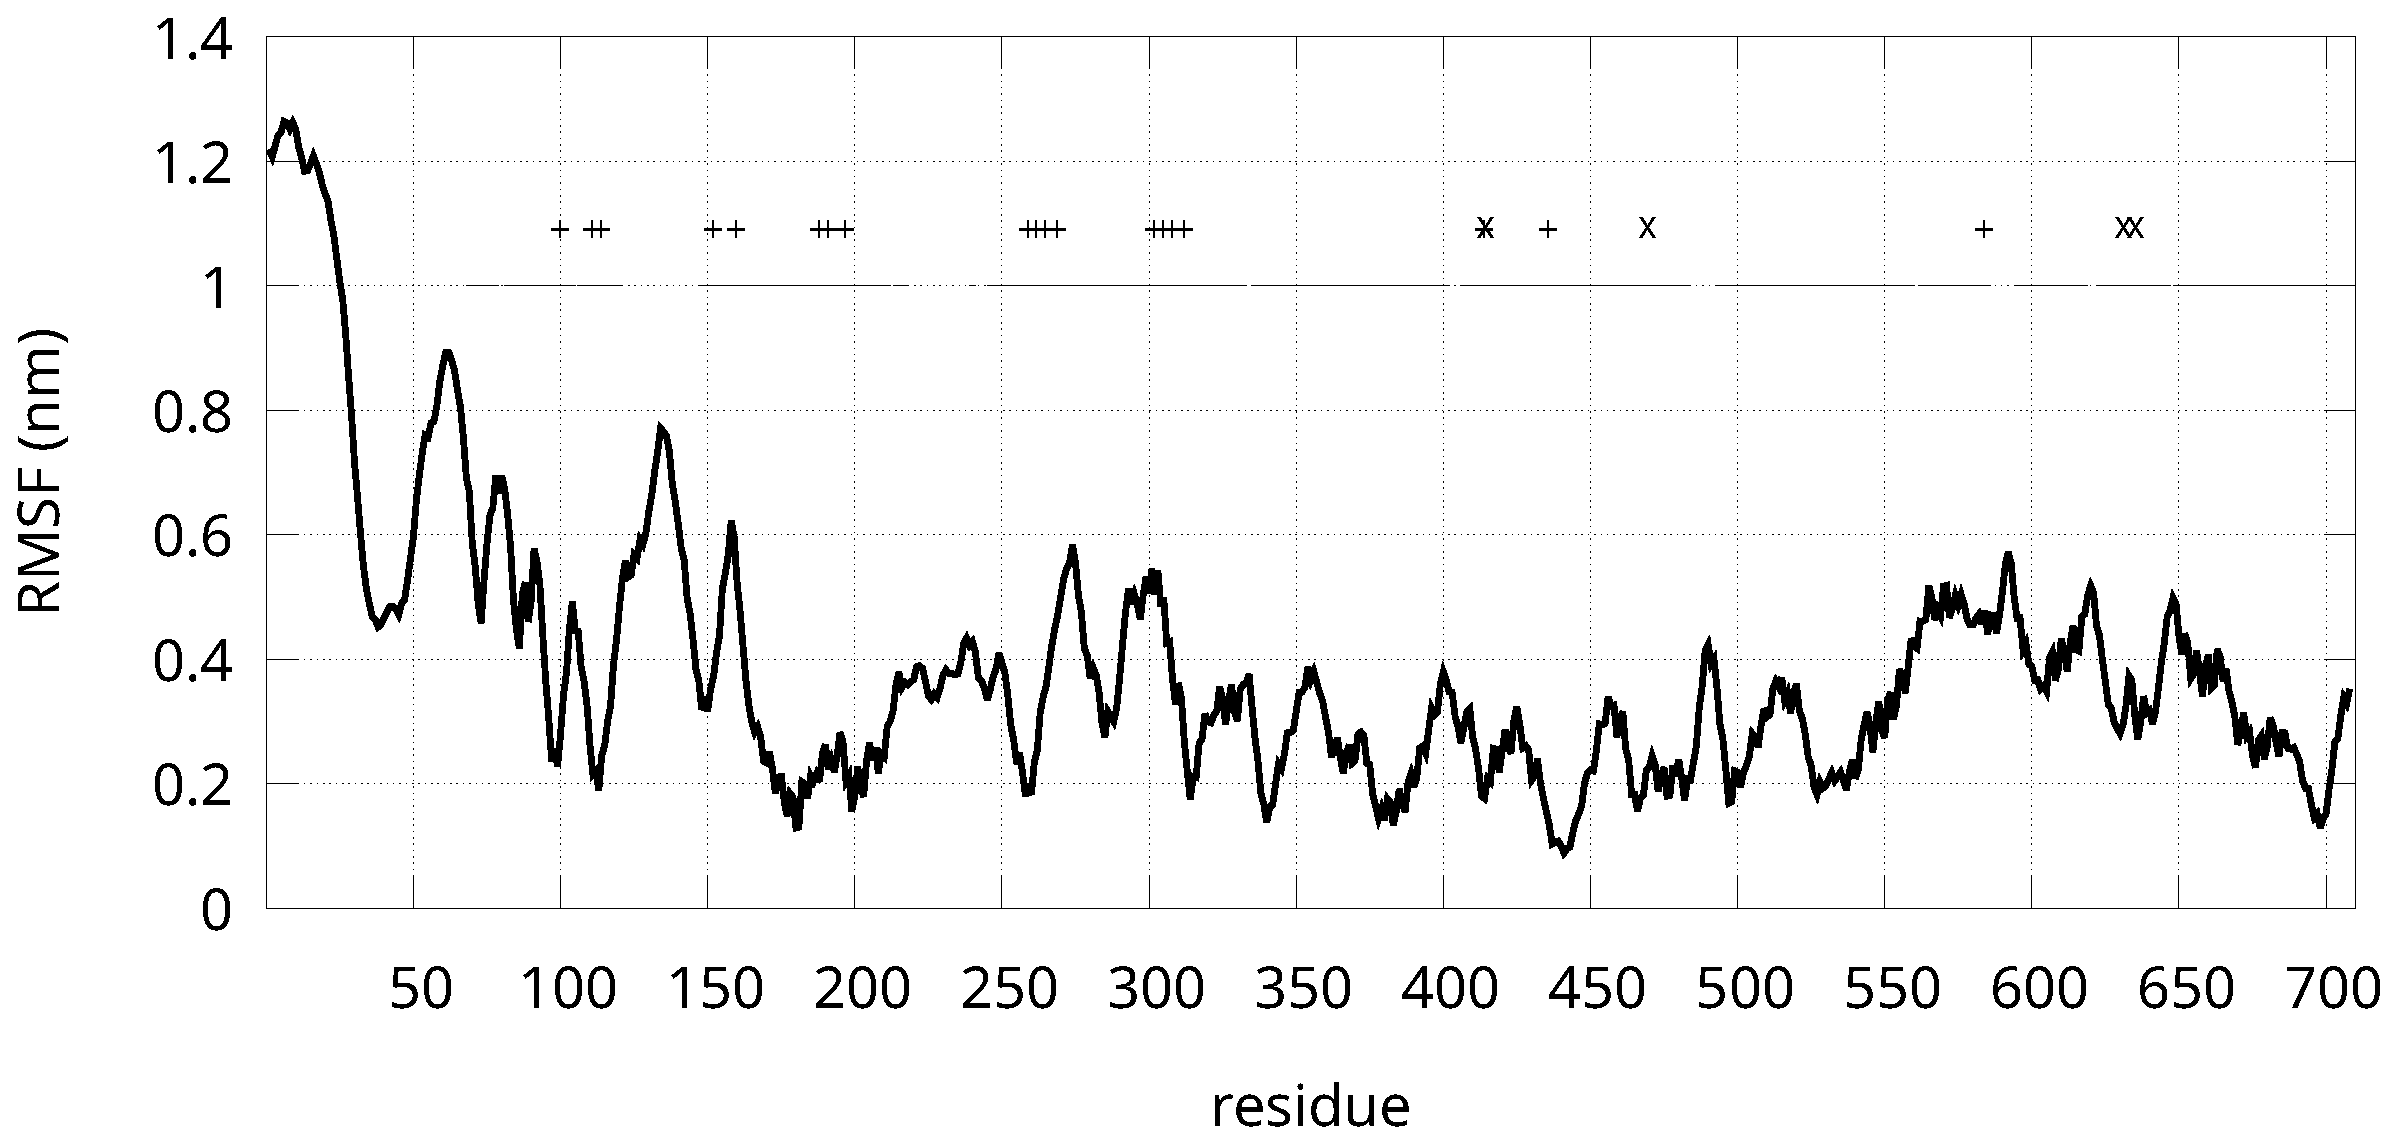
The root-mean square fluctuation (RMSF) of C α atoms was projected on the first three eigenvectors of the covariance matrix and then averaged over the same three eigenvectors (Figure 6). The collection of 100,000 configurations obtained by MtD were used to calculate the covariance matrix. This fluctuation reflects the contribution of slow motions induced by the external force function of d to the RMSF for each of the 708 residues in Ns sequence.
The RMSF values show that there is a widely fluctuating N-terminus (first 180 residues), followed by a less fluctuating segment containing high density of Cys (region 250–320). This region coincides with the hypothetical F-domain. Structural fluctuations are here reduced because of the 4 auxiliary FeS clusters mainly bound to Cys. The H-domain is visible by the rigidity of region 320–550, containing one side of the H-cluster (Cys 415 and 470). The C-terminus, containing the other side of the H-cluster (Cys 632 and 636), is characterized by larger fluctuations. The RMSF values are consistent with a rigid H-domain, but the F-domain folding is assisted by the C-terminus. Indeed, the C-terminus strongly interacts with the protein loop around residue 300 that is close to cluster 2 (Cys 302).
In Table 3 the distances between the centers of mass of the FeS clusters (see Figure 3, right panel and Table 1) are compared for the two selected samples 1 and 3 to the CpI crystal structure. The comparison of distances shows that in both samples 1 and 3, that in terms of protein matrix differ more than 1 nm in backbone RMSD, FeS clusters are arranged as in CpI, where the clusters form a working electron wire. Cluster 3 is at similar distance to clusters 4 and 5, while 4 and 5 are far in space (see Figure 3, right panel). Therefore, the FeS cluster arrangement of Table 3 is consistent with electron transfer from either 5 to 3 and 4 to 3, as two alternative pathways. Cluster 5, the single Fe2S2 cluster, is the most exposed to the solvent (see next sub-section) and it can form a Fe4S4 cluster condensing the reduced Fe2S2 cluster of ferredoxin. Cluster 4 can interact with Fe4S4 and Fe2S2 clusters of external reductant. Indeed, Fd of C. pasteurianum has 2 Fe4S4 and one Fe2S2 clusters, while Cr has only one Fe2S2 cluster. In any case, the approach between FeS clusters trigger two alternative circuit closures between Fd and Hyd.

3.4. Solvent Access to Fe Atoms

In Figure 7 radial distribution functions of pairs involving different Fe atoms and different water atoms are displayed.
Cluster 3 (Figure 7, left, blue curve) is well buried into the protein matrix with a few water molecules approaching Fe-Ow distance lower than 4 Å. Clusters 1, 2 and 4 are more water accessible, but water molecules rarely reach distances lower than 3 Å, that is a contact distance. Only the Fe2S2 cluster 5 (purple line, left panel) is in contact with water molecules. The distal Fe atoms of H-cluster (Fe d , Figure 7, right panel) is closer to O of water molecules than clusters 1–4 (left panel). Interestingly, the H atoms of water molecules are closer to Fe d than O (thin lines compared to thick lines), showing the polarization of Fe-bound water molecules that is a requirement for H reduction. This Fe-bound water arrangement was observed also in simulations of Cvu and it is due to a hydrogen-bond between Fe-bound water O-H…N, with N in the dta ligand in H-cluster. This hydrogen-bond is allowed by the N-H bond in dta pointing opposite to Fe-bound water molecule. It is interesting to notice that when the distance d between cluster 1 and 2 is small ( d < 1.1 nm, low d statistics, black curves) the water-Fe d interaction is stronger than when the same distance is large ( d 1.1 nm, high d statistics, red curves). This effect is due to the opening of water accessible clefts around Fe d exerted by the interactions between F- and H-domain: the closing of the two domains protein organization opens H-cluster to water access.

3.5. Distal Iron Protection

The distal iron atom (Fe d ) in the di-iron complex present in the H-cluster is of particular importance for H2 production, as Fe d is the most probable site for both water and oxygen reduction. In the crystal structure of CpI the ligand crowding around the di-iron complex is high, because Fe atoms are stabilized in a high valence reduced state. Reactivity is left open by one valence of Fe d occupied by a water molecule, as it was already observed in the previous lower resolution crystal structure (PDB 3C8Y [44]). Our observation that in both Cvu [24] and Ns (see previous sub-section) a water molecule is found with significant probability at Fe d binding distance is therefore consistent with electrostatic interactions favouring a non-bonding (in our model) approach between water molecules and the free Fe d valence.
The second-shell of Fe d has been recently the object of research, mainly because of the observation that in Clostridium beijerinckii (Cb, hereafter) bacteria the resistance to oxidation by dioxygen is particularly high [45]. The strong interactions between Fe d and a Cys residue in the second-coordination sphere of the active state was found able to provide an oxygen-protected though inactive state, indicated as H inact . The same observation was obtained earlier for Dd [46]. The crystal structure of Cb H inact state was determined (PDB 6TTL [45]) and recently refined (PDB 8ZQD [47]). In this state the Cys S γ atom, that in the crystal structure of active state is found at about 6 Å from Fe d , moves to a Fe-binding distance, thus eventually displacing the labile water molecule with a stronger thiolate ligand protecting Fe d by the access of dioxygen (see Section 4). The Fe-bound Cys of Cb corresponds to Cys 299 in the CpI sequence.
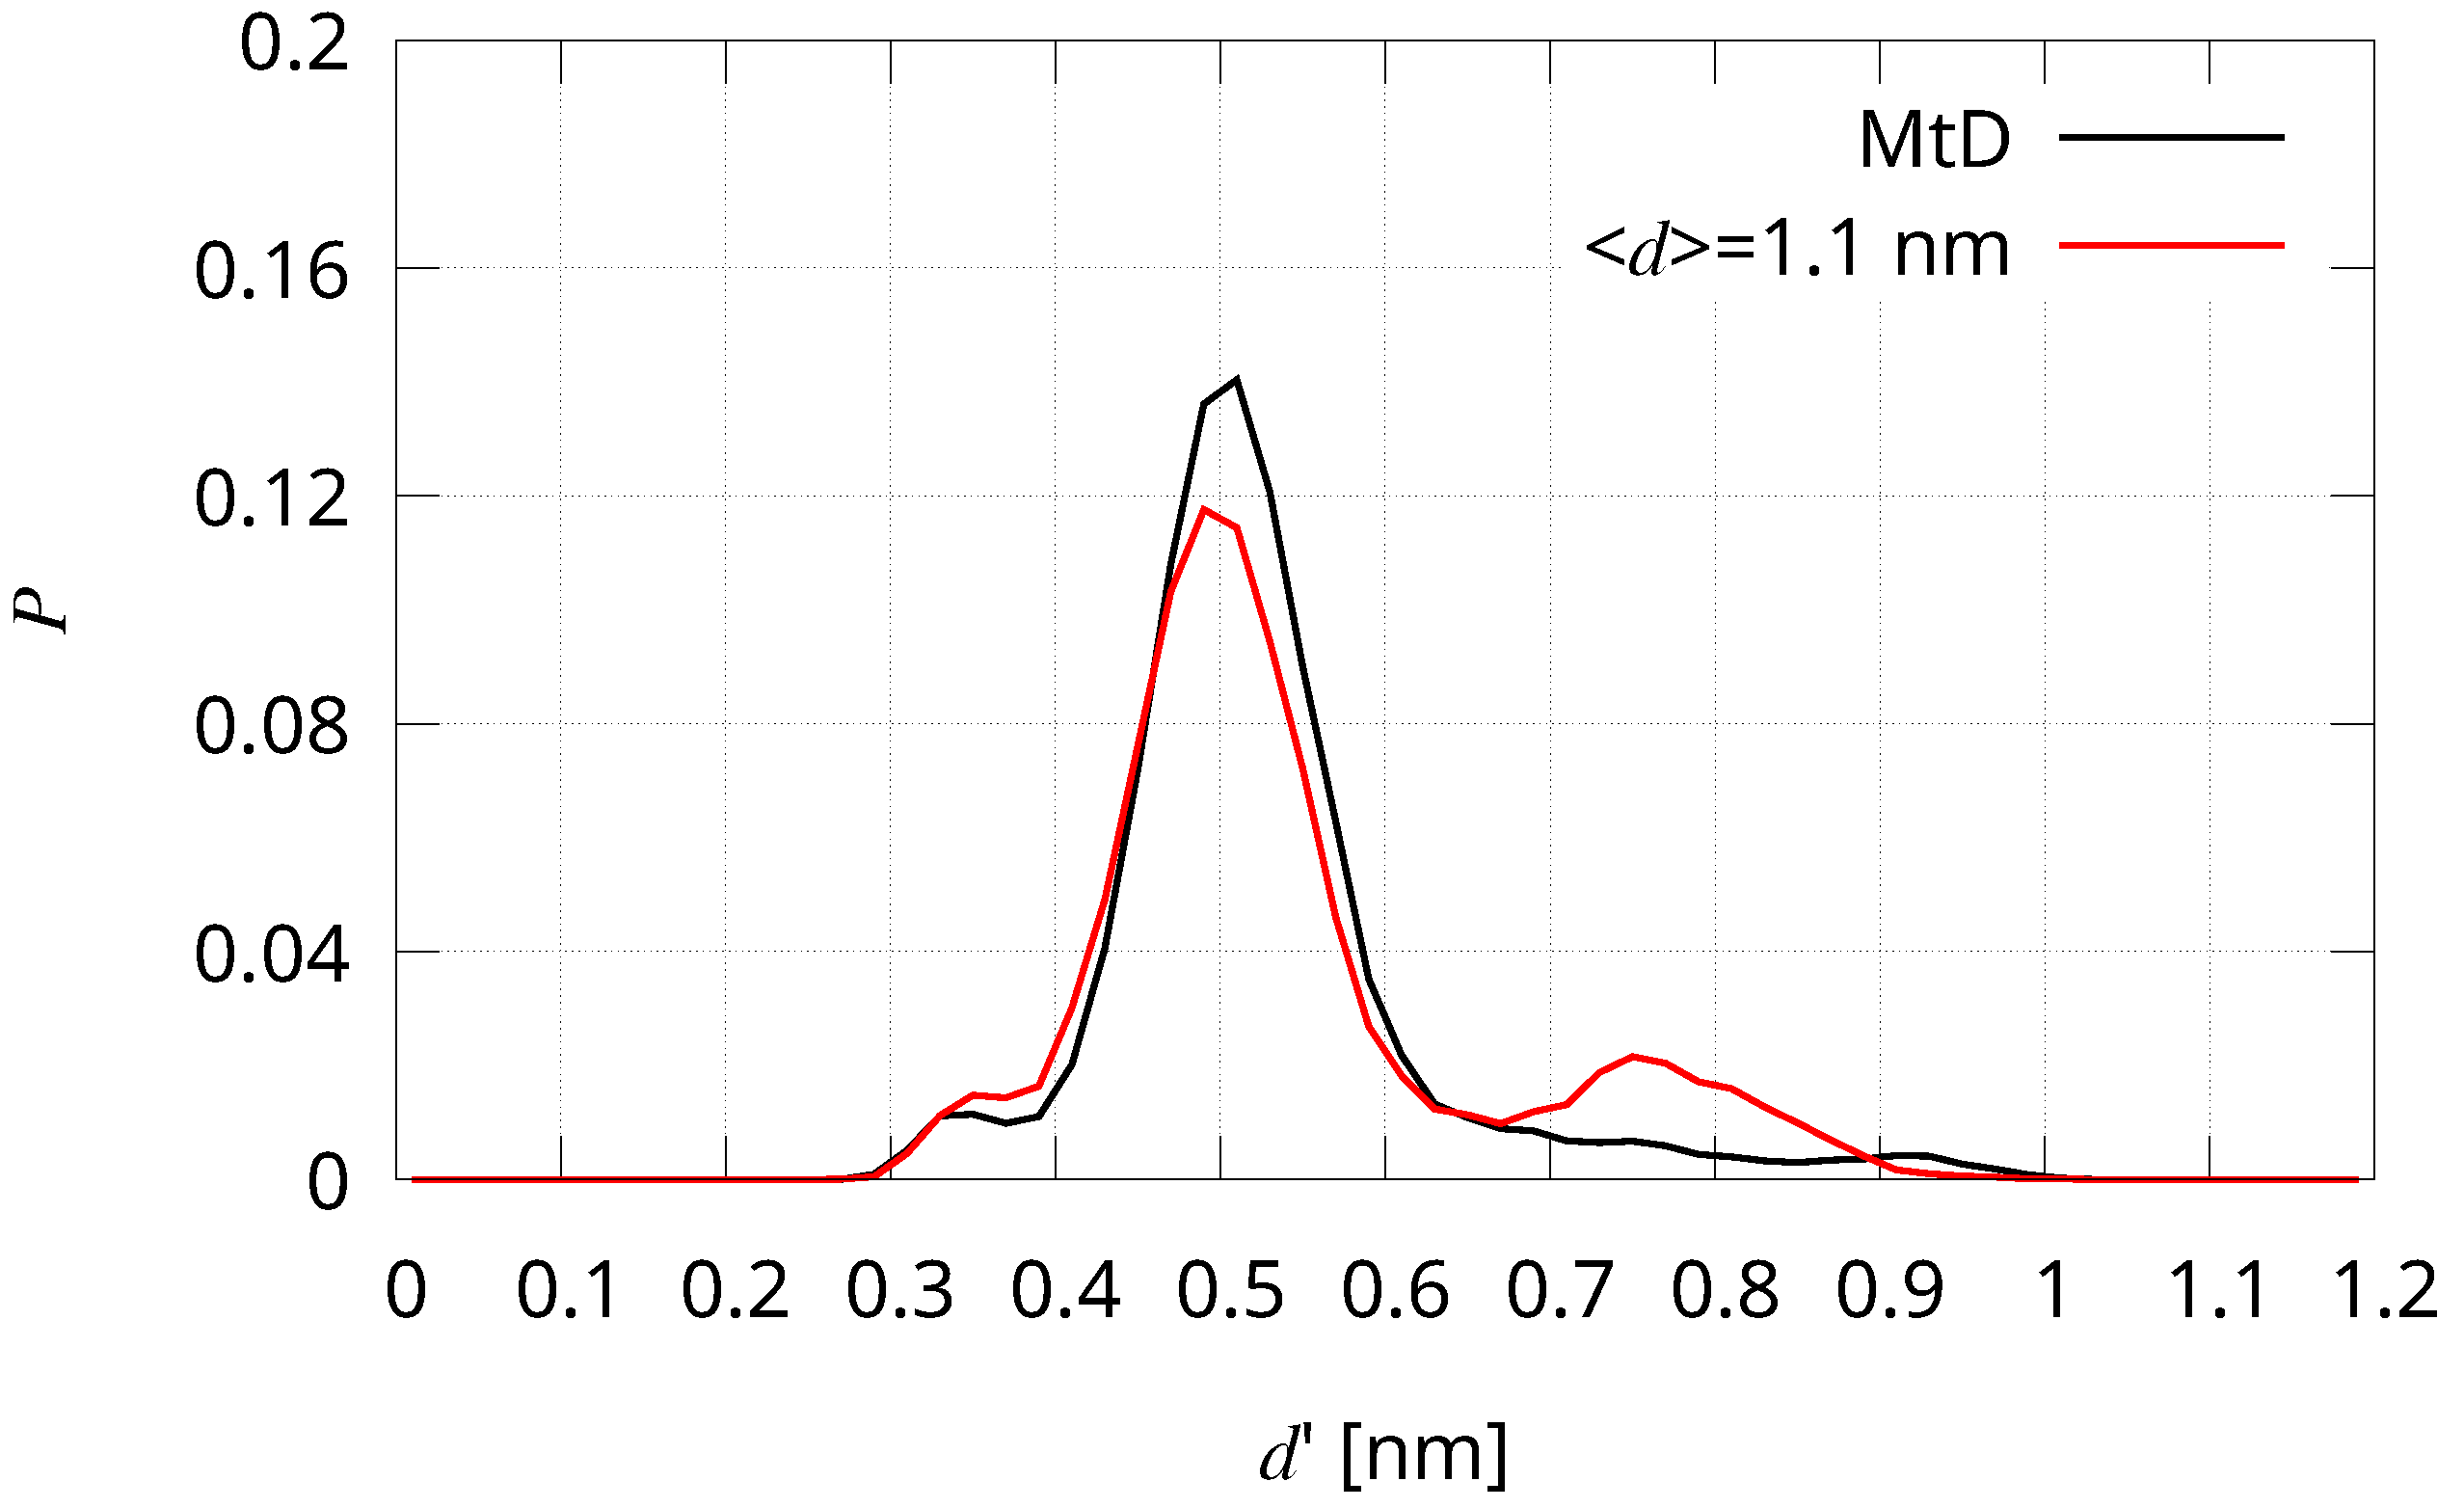
According to the data supporting a protecting effect, in the following we study in more details the protein region of Ns corresponding to that containing Cys 299 in CpI. A large segment of this CpI region is conserved in Ns: 294–313 segment of CpI is identical to segment 409–418 in Ns. Thus, Cys 299 of CpI is Cys 414 in Ns. We calculated the minimal distance of all residues in the protein from Fe d and we found that in the MtD statistics 6 residues (413, 414, 439, 473, 540, and 546) have atoms closer than 3 Å. Cys 414 is the one reaching the shortest distance, 1.7 Å. When such short distance is achieved, the water molecule close to Fe d is displaced. To better define the probability of the approach of S γ (Cys 414) to the first Fe d coordination sphere, we calculated the probability of the distance Fe d -S γ (Cys 414) in different statistics (Figure 8).
The function clearly shows that two states are contained in the MtD statistics (black curve): one with S γ (Cys 414) at binding distance (3.5 Å) and one, with larger probability, at about 5 Å. It is also shown that by imposing a short average distance between cluster 1 and cluster 2 (red curve, d = 1.1 nm), the relative probability of short Fe d -S γ distance decreases, by increasing the probability of open configurations with Fe d -S γ distance of 0.75 nm. This observation is consistent with our observation that low inter-cluster distances open the pocket in front of Fe d enhancing water access (see previous sub-section) and displacing eventual protein sidechains protecting Fe d .

4. Discussion

The aim of our computational work was to provide an ensemble of 3d-structures of [FeFe] hydrogenase in the microalga Nannochloropsys salina. The reason of this research is to design Hyd in Ns with many FeS clusters, to possibly make slower the process of FeS oxidation and to make hydrogen production lasting longer in time. The assembly of many FeS clusters mimic the architecture of CpI that is less sensitive to oxygen compared to Cr. In vitro the rate of H2 production in CpI incubated for 20 min at 1% of O2 in the headspace becomes 1/2 of that with no oxygen [48]. On the other hand, in Cr, with no auxiliary FeS clusters, the change of rate in H2 production by a corresponding change in conditions is 1/10 [49]. Nevertheless, the oxygen sensitivity of CpI is still too high for large-scale H2 production. Because of this, both evolutionary and artificial sequence changes are continuously searched [50,51,52]. An almost complete discussion of the strategy to overcome the oxygen resistance, as well as other technological limitations of direct biophotolysis in MA and cyanobacteria is in Ref. [53].
The oxygen sensitivity is even lower in Dd bacteria [52], that express Hyd with two auxiliary Fe4S4 clusters in addition to the H-cluster. As for Dd we notice that the Dd Hyd is active in a dimeric state, where Fe4S4 clusters are more protected. The modulation of oxygen sensitivity in [FeFe] hydrogenase combines changes in H-cluster environment (particularly around the distal Fe atom where water reduction occurs) with changes in protein matrix flexibility. The latter is strictly related to long-range linkages exerted by FeS clusters and the presence of additional protein domains interacting with H-domain.
The correlation between Hyd structure, microalgal evolution, and Hyd resistance/sensitivity to oxygen has been investigated by several authors by means of bioinformatic tools [25]. This analysis is more advanced for [NiFe] hydrogenases because of the presence of more cases of O2 resistance produced by evolution [54] compared to [FeFe] hydrogenase. As an addition to the first structural proposal for Ns based on SwissModel [25], our work proposes a more robust in silico investigation based on the recent AlphaFold methodology combined to metadynamics. The latter technique allows to understand the interactions responsible of the found two-domains protein architecture.
The effects on electron transfer, protein stability (multi-domain organization), oxygen sensitiviy, and interactions with other partners of the presence of more than 2 FeS clusters have not been systematically investigated and our work was the first attempt in this direction. A distance consistent with electron transfer to H-cluster is 1.1 nm [42], as demonstrated by the bacterial Hyd structures like those available for CpI and Dd. But the organization of clusters 3–5 is more intricate. While it is expected a mutual distance in the same range of that of 1–2 clusters to form a working electron conducting wire, the presence of two branches to the molecular surface, 3–4 and 3–5, is a possible molecular switch. Cluster 5, the Fe2S2 cluster, is ready to condense with an external Fe2S2 cluster (for instance in ferredoxin) to form a unique Fe4S4 cluster upon electron reduction. Conversely, the role of Fe4S4 cluster 4 can be to interact with oxygen, rather than with a reductant species in the environment.
A Hyd oxidation mechanism starting at the di-iron H-cluster complex has been proposed [55]. In this mechanism the most reducing spot (Fe d ) meets the most oxidizing species, O2, and superoxide, the one-electron transfer reactive oxygen species (ROS), is formed. This event requires the access to the buried Fe d by O2, likely via channels [56]. As for the inhibition of the first step of ROS production at Fe d , the presence of an inactive state (H inact ) in certain Hyd sequences has been demonstrated [45,46,57]. Interestingly, in these cases the inactive state can be stabilized by protein dimerization [47]. The ROS formed at Fe d , superoxide and/or rapidly formed peroxide, then react with S atoms in the protein, breaking the Cys-Fe bonds and demolishing the whole protein 3d organization stabilized by the many Fe-S linkages. These propagation steps occur at Fe4S4 clusters.
The mechanism of Fe4S4 oxidation has been studied in vitro by using fumarate and nitrate reduction regulators in E. coli [58,59,60]. These studies identified Fe3S4+ as the most persistent intermediate in the oxidation of Fe4S42+ by dioxygen. The species is the product of the first fast step in oxidation, because Fe4S43+ is so unstable that rapidly releases Fe2+ to the environment:
[ Fe 4 S 4 ] 2 + + O 2 [ Fe 3 S 4 ] + + Fe 2 + + O 2 ,
where superoxide anion, when not degraded by ROS scavengers, propagates the Hyd oxidation. The second step involving the release of Fe from Fe3S4+ to produce the Fe2S2 cluster is slow, thus allowing a transient detection of the Fe3S4+ intermediate.
[ Fe 3 S 4 ] + [ Fe 2 S 2 ] 2 + + Fe 3 + + 2 S 2 2 .
The spectral features of Fe3S4+ have been reported by using model peptides stabilizing it [61]. Moreover, it has been observed in whole Cvu cells by means of electron spin resonance experiments [62].
According to the above described oxidation pathway, it can be speculated that cluster 4 is not essential to transfer electrons, but is a hot spot for Hyd oxidation. Cluster 4 could be removed provided the F-domain is kept stable with cluster 5 in the solvent accessible arrangement. The Ns hydrogenase with 4 FeS clusters could be a working enzyme for water reduction to H2 without a reactive Fe4S4 cluster exposed to oxidation propagation. This hypothesis should be investigated.
As for the protection of the Hyd active site, our results are consistent with the recent literature data on Dd [46] and Cb [45,47] describing the inactive state upon air exposure of several Hyd sequences. We observed both states in the metastatistics and a strong modulation of their population by the collective variable acting on interactions between the H- and F-domain. The observed correlation between long-range interactions and the size of the pocket in front of the active Fe center looks an important handle to engineer large-size [FeFe] hydrogenase like that in Ns.
Our study is limited to N. salina [FeFe] hydrogenase computational models of isolated monomers. The force field used reproduced quite well the interactions between iron-sulfur clusters and the protein matrix, as it was shown in our previous application [24], at least in the resting oxidation state, indicated as H ox . Models can be extended to protein oligomers and to hydrogenase/ferredoxin complex, to test the formation of a larger working assembly of iron-sulfur clusters embedded into intricate protein matrices. The major drawback of the applied models are, as usual, statistical limitations: a small number of initial configurations (5); a small number of walkers (100); the huge conformational landscape to explore for proteins with more than a few tens of residues and with intrinsically disordered regions. These limitations were analyzed in our previous applications [22,23]. As for proposing initial complex structures, the stochastic component of AlphaFold2, proposing structures with a significantly low predicted per-residue local distance difference test (plDDT) parameter, can be more effective. As summarized in Methods and Results, increasing the requested number of models allows proposals with low plDDT to be included. The drawback is to use structural information of proteins with different functions and genetic phyla, something that can be roughly described as including larger diversity. This perspective is worth to be systematically investigated in the future.
In order to tackle hydrogenase/ferredoxin complexes, the recent AlphaFold3 tool [63] including information of protein complexes to predict the relative arrangement of components, will be the natural prosecution. However, before attempting other models, the actual working conditions of hydrogenase must be investigated in more details in vivo. Since N. salina is a microalga easy to grow in different conditions, including salt water, and it has been genetically modified, the presence in the genome of an effective [FeFe] hydrogenase shows a great potential for tunable, both environmentally and genetically, direct biophotolysis of hydrogen. Therefore, we plan routine measurements of hydrogen production of N. salina cultures as it was done in laboratory for Chlorella vulgaris [64] and Chlamydomonas reinhardtii [65].

5. Conclusions

We built atomic structures of [FeFe] hydrogenase with the sequence of Nannochloropsys salina, a microalga with possible biotechnological applications in green hydrogen production by direct biophotolysis. The AlphaFold2 deep learning method was used to build initial proposals that are found based on the two-domains architecture of bacterial [FeFe] hydrogenase in Clostridium pasteurianum isoform I. The two-domains architecture is critical to host five iron-sulfur clusters assembled as a working electron conducting wire from the solvent to the di-iron active site, where water reduction and H2 production occurs. The Cys and His placement in N. salina sequence allows the hosting of the five FeS clusters.
Molecular dynamics simulations show that the protein scaffold can move significantly around an almost rigid FeS scaffold. Among the basin of configurations able to host the FeS scaffold, the configurations where the distance between the H-cluster and the most proximal FeS cluster (1–2 distance) is minimal (1.0 ÷ 1.4 nm) are favoured, according to different measures of free energy. A small value for this distance closes the interface between the two domains, while opening the distal iron atom to water access. The other inter-cluster distances are less fluctuating compared to the 1-2 inter-cluster distance because 1-2 distance connects two domains (the H- and F-domain), while the other inter-cluster distances are all embedded in a partially folded F-domain. The reduced structural fluctuations of the nascent F-domain, due to the 4 auxiliary FeS clusters bound to it via the many Cys residues in the sequence, facilitate the electrostatic interactions stabilizing the two-domain organization of Hyd in N. salina.
As for FeS cluster composition and architecture [FeFe] hydrogenase in N. salina is a good candidate for hydrogen production. The models encourage systematic measurements of hydrogen production by N. salina cultures, where environmental (nutrients, light exposure, anaerobic conditions) and genetic conditions (antenna and hydrogenase genes, respiration rate) are changed. Also, the usual technological conditions for outdoor hydrogen production (cell immobilization and light exposure cycles) must be investigated for N. salina strains, on the basis of knowledge about growth conditions already accumulated for producing lipids. In particular, the oxygen sensitivity is worth to be measured and eventual genetic engineering to increase oxygen resistance in this microalgal species can be pursued to possibly achieve biological production of green hydrogen, starting from a laboratory scale and avoiding hydrogenase purification outside from whole cells.

Supplementary Materials

The following supporting information can be downloaded at: https://www.mdpi.com/article/10.3390/hydrogen6040077/s1. The AlphaFold2 input data is reported in the file “settings.txt” deposited as Supplementary Materials.

Author Contributions

Conceputalization, S.B. and G.L.P.; methodology, S.B. and G.L.P.; investigation, S.B. and G.L.P.; resources, G.L.P.; funding acquisition, C.F.; writing–review and editing, G.L.P. All authors have read and agreed to the published version of the manuscript.

Funding

This research was supported by PRIN-201744NR8S (MIUR, Italy), PON “Ricerca e innovazione” 2014-2020 (Italy), and by the BIOPHYS specific initiative of INFN. Numerical calculations have been made possible through the ISCRA HydGen project and the CINECA-INFN agreement on Leonardo high-performance infrastructure (CINECA, Italy).

Institutional Review Board Statement

Not applicable.

Informed Consent Statement

Not applicable.

Data Availability Statement

All data are available upon request to corresponding author.

Conflicts of Interest

The authors declare no conflicts of interest.

Abbreviations

The following abbreviations are used in this manuscript:
MAmicroalgae
MSAmultiple sequence alignment
OECoxygen evolving center
PSphotosystem
FeSiron-sulfur
Hyd[FeFe] hydrogenase
NsNannochloropsis salina
CpI[FeFe] hydrogenase of Clostridium pasteurianum, isoform I
DdDesulfovibrio desulfuricans
CrChlamydomonas reinhardtii
CbClostridium beijerinckii
MDmolecular dynamics
RMSDroot-mean square deviation
RMSFroot-mean square fluctuation

References

  1. Megía, P.J.; Vizcaíno, A.J.; Calles, J.A.; Carrero, A. Hydrogen Production Technologies: From Fossil Fuels toward Renewable Sources. A Mini Review. Energy Fuels 2021, 35, 16403–16415. [Google Scholar] [CrossRef]
  2. Echim, S.M.; Budea, S. Use of Hydrogen Energy and Fuel Cells in Marine and Industrial Applications—Current Status. Hydrogen 2025, 6, 50. [Google Scholar] [CrossRef]
  3. Min Woon, J.; Shiong Khoo, K.; Akermi, M.; Alanazi, M.M.; Wei Lim, J.; Jing Chan, Y.; Sean Goh, P.; Silas Chidi, B.; Kee Lam, M.; Zaini, J.; et al. Reviewing biohydrogen production from microalgal cells through fundamental mechanisms, enzymes and factors that engendering new challenges and prospects. Fuel 2023, 346, 128312. [Google Scholar] [CrossRef]
  4. Ghirardi, M.L.; King, P.W.; Mulder, D.W.; Eckert, C.; Dubini, A.; Maness, P.C.; Yu, J. Hydrogen Production by Water Biophotolysis. In Microbial BioEnergy: Hydrogen Production; Zannoni, D., De Philippis, R., Eds.; Springer: Dordrecht, The Netherlands, 2014; pp. 101–135. [Google Scholar] [CrossRef]
  5. Seibert, M.; Torzillo, G. (Eds.) Microalgal Hydrogen Production; Comprehensive Series in Photochemical & Photobiological Sciences; The Royal Society of Chemistry: Cambridge, UK, 2018. [Google Scholar] [CrossRef]
  6. Babu Pallam, R.; Ramamoorthy, N.K.; Rakshit, S.; Jaiswal, K.K.; Sarma, V.V. Microalgae for the Sustainable Production of Biohydrogen. In Clean Energy Transition-via-Biomass Resource Utilization: A Way to Mitigate Climate Change; Kumar, S., Sundaramurthy, S., Kumar, D., Chandel, A.K., Eds.; Springer Nature: Singapore, 2024; pp. 151–175. [Google Scholar] [CrossRef]
  7. Chandrasekhar, T.; Chandra Obul Reddy, P.; Swapna, B.; Veeranjaneya Reddy, L.; Anuprasanna, V.; Dakshayani, L.; Ramachandra Reddy, P.; Reddy, M.C. Algae: The game-changers in biohydrogen sector. Crit. Rev. Biotechnol. 2025, 45, 509–529. [Google Scholar] [CrossRef] [PubMed]
  8. Lubitz, W.; Ogata, H.; Rüdiger, O.; Reijerse, E. Hydrogenases. Chem. Rev. 2014, 114, 4081–4148. [Google Scholar] [CrossRef] [PubMed]
  9. Birrell, J.A.; Rodríguez-Maciá, P.; Reijerse, E.J.; Martini, M.A.; Lubitz, W. The catalytic cycle of [FeFe] hydrogenase: A tale of two sites. Coord. Chem. Rev. 2021, 449, 214191. [Google Scholar] [CrossRef]
  10. Artz, J.H.; Zadvornyy, O.A.; Mulder, D.W.; Keable, S.M.; Cohen, A.E.; Ratzloff, M.W.; Williams, S.G.; Ginovska, B.; Kumar, N.; Song, J.; et al. Tuning Catalytic Bias of Hydrogen Gas Producing Hydrogenases. J. Am. Chem. Soc. 2020, 142, 1227–1235. [Google Scholar] [CrossRef]
  11. Sahin, S.; Brazard, J.; Zuchan, K.; Adachi, T.B.M.; Mühlenhoff, U.; Milton, R.D.; Stripp, S.T. Probing the ferredoxin:hydrogenase electron transfer complex by infrared difference spectroscopy. Chem. Sci. 2025, 16, 10465–10475. [Google Scholar] [CrossRef]
  12. Frowijn, L.S.; van Sark, W.G.J.H.M. Analysis of photon-driven solar-to-hydrogen production methods in the Netherlands. Sustain. Energy Techn. 2021, 48, 101631. [Google Scholar] [CrossRef]
  13. Touloupakis, E.; Faraloni, C.; Silva Benavides, A.M.; Torzillo, G. Recent Achievements in Microalgal Photobiological Hydrogen Production. Energies 2021, 14, 7170. [Google Scholar] [CrossRef]
  14. Ye, Y.; Liu, M.; Yu, L.; Sun, H.; Liu, J. Nannochloropsis as an Emerging Algal Chassis for Light-Driven Synthesis of Lipids and High-Value Products. Mar. Drugs 2024, 22, 54. [Google Scholar] [CrossRef] [PubMed]
  15. Ramprakash, B.; Lindblad, P.; Eaton-Rye, J.J.; Incharoensakdi, A. Current strategies and future perspectives in biological hydrogen production: A review. Renew. Sustai. Energy Rev. 2022, 168, 112773. [Google Scholar] [CrossRef]
  16. Viviano, E.; Limongi, A.R. Chapter 13—Production of biofuels from microalgae. In Sustainable Industrial Processes Based on Microalgae; Lafarga, T., Acién, G., Eds.; Elsevier: Amsterdam, The Netherlands, 2024; pp. 297–321. [Google Scholar] [CrossRef]
  17. Nicolet, Y.; Piras, C.; Legrand, P.; Hatchikian, C.E.; Fontecilla-Camps, J.C. Desulfovibrio desulfuricans iron hydrogenase: The structure shows unusual coordination to an active site Fe binuclear center. Structure 1999, 7, 13–23. [Google Scholar] [CrossRef] [PubMed]
  18. Mulder, D.W.; Boyd, E.S.; Sarma, R.; Lange, R.K.; Endrizzi, J.A.; Broderick, J.B.; Peters, J.W. Stepwise [FeFe]-hydrogenase H-cluster assembly revealed in the structure of HydA Delta EFG. Nature 2010, 465, 248–251. [Google Scholar] [CrossRef]
  19. Swanson, K.D.; Ratzloff, M.W.; Mulder, D.W.; Artz, J.H.; Ghose, S.; Hoffman, A.; White, S.; Zadvornyy, O.A.; Broderick, J.B.; Bothner, B.; et al. [FeFe]-Hydrogenase Oxygen Inactivation Is Initiated at the H Cluster 2Fe Subcluster. J. Am. Chem. Soc. 2015, 137, 1809–1816. [Google Scholar] [CrossRef]
  20. Humphrey, W.; Dalke, A.; Schulten, K. VMD visual molecular dynamics. J. Mol. Graph. 1996, 14, 33–38. [Google Scholar] [CrossRef]
  21. Jumper, J.; Evans, R.; Pritzel, A.; Green, T.; Figurnov, M.; Ronneberger, O.; Tunyasuvunakool, K.; Bates, R.; Žídek, A.; Potapenko, A.; et al. Highly accurate protein structure prediction with AlphaFold. Nature 2021, 596, 583–589. [Google Scholar] [CrossRef]
  22. Botticelli, S.; La Penna, G.; Nobili, G.; Rossi, G.; Stellato, F.; Morante, S. Modelling Protein Plasticity: The Example of Frataxin and Its Variants. Molecules 2022, 27, 1955. [Google Scholar] [CrossRef]
  23. Nobili, G.; Botticelli, S.; La Penna, G.; Morante, S.; Rossi, G.; Salina, G. Probing protein stability: Towards a computational atomistic, reliable, affordable, and improvable model. Front. Mol. Biosci. 2023, 10, 1122269. [Google Scholar] [CrossRef]
  24. Botticelli, S.; La Penna, G.; Minicozzi, V.; Stellato, F.; Morante, S.; Rossi, G.; Faraloni, C. Predicting the Structure of Enzymes with Metal Cofactors: The Example of [FeFe] Hydrogenases. Int. J. Mol. Sci. 2024, 25, 3663. [Google Scholar] [CrossRef]
  25. Tamayo-Ordoñez, Y.d.J.; Ayil-Gutiérrez, B.A.; Moreno-Davila, I.M.M.; Tamayo-Ordoñez, F.A.; Córdova-Quiroz, A.V.; Poot-Poot, W.A.; Damas-Damas, S.; Villanueva-Alonzo, H.d.J.; Tamayo-Ordoñez, M.C. Bioinformatic analysis and relative expression of hyd and fdx during H2 production in microalgae. Phycol. Res. 2023, 71, 37–55. [Google Scholar] [CrossRef]
  26. Eddy, S.R. Accelerated Profile HMM Searches. PLoS Comput. Biol. 2011, 7, e1002195. [Google Scholar] [CrossRef]
  27. Mariani, V.; Biasini, M.; Barbato, A.; Schwede, T. lDDT: A local superposition-free score for comparing protein structures and models using distance difference tests. Bioinformatics 2013, 29, 2722–2728. [Google Scholar] [CrossRef]
  28. Varadi, M.; Bertoni, D.; Magana, P.; Paramval, U.; Pidruchna, I.; Radhakrishnan, M.; Tsenkov, M.; Nair, S.; Mirdita, M.; Yeo, J.; et al. AlphaFold Protein Structure Database in 2024: Providing structure coverage for over 214 million protein sequences. Nucl. Acids Res. 2023, 52, D368–D375. [Google Scholar] [CrossRef]
  29. Chang, C.H.; Kim, K. Density Functional Theory Calculation of Bonding and Charge Parameters for Molecular Dynamics Studies on [FeFe] Hydrogenases. J. Chem. Theory Comput. 2009, 5, 1137–1145. [Google Scholar] [CrossRef] [PubMed]
  30. Best, R.B.; Zhu, X.; Shim, J.; Lopes, P.E.M.; Mittal, J.; Feig, M.; MacKerell, A.D. Optimization of the Additive CHARMM All-Atom Protein Force Field Targeting Improved Sampling of the Backbone phi, psi and Side-Chain chi1 and chi2 Dihedral Angles. J. Chem. Theory Comput. 2012, 8, 3257–3273. [Google Scholar] [CrossRef] [PubMed]
  31. Páll, S.; Hess, B. A flexible algorithm for calculating pair interactions on SIMD architectures. Comput. Phys. Commun. 2013, 184, 2641–2650. [Google Scholar] [CrossRef]
  32. Darden, T.; York, D.; Pedersen, L. Particle Mesh Ewald: An N-log(N) Method for Ewald Sums in Large Systems. J. Chem. Phys. 1993, 98, 10089–10092. [Google Scholar] [CrossRef]
  33. Miyamoto, S.; Kollman, P.A. Settle: An analytical version of the SHAKE and RATTLE algorithm for rigid water models. J. Comput. Chem. 1992, 13, 952–962. [Google Scholar] [CrossRef]
  34. Hess, B.; Bekker, H.; Berendsen, H.J.C.; Fraaije, J.G.E.M. LINCS: A linear constraint solver for molecular simulations. J. Comput. Chem. 1997, 18, 1463–1472. [Google Scholar] [CrossRef]
  35. Berendsen, H.J.C.; van der Spoel, D.; van Drunen, R. GROMACS: A message-passing parallel molecular dynamics implementation. Comput. Phys. Commun. 1995, 91, 43–56. [Google Scholar] [CrossRef]
  36. Abraham, M.J.; Murtola, T.; Schulz, R.; Páll, S.; Smith, J.C.; Hess, B.; Lindahl, E. GROMACS: High performance molecular simulations through multi-level parallelism from laptops to supercomputers. SoftwareX 2015, 1–2, 19–25. [Google Scholar] [CrossRef]
  37. Vermaas, J.V.; Hardy, D.J.; Stone, J.E.; Tajkhorshid, E.; Kohlmeyer, A. TopoGromacs: Automated Topology Conversion from CHARMM to GROMACS within VMD. J. Chem. Inform. Model. 2016, 56, 1112–1116. [Google Scholar] [CrossRef] [PubMed]
  38. Hošek, P.; Kříž, P.; Toulcová, D.; Spiwok, V. Multisystem altruistic metadynamics- Well-tempered variant. J. Chem. Phys. 2017, 146, 125103. [Google Scholar] [CrossRef] [PubMed]
  39. Bonomi, M.; Branduardi, D.; Bussi, G.; Camilloni, C.; Provasi, D.; Raiteri, P.; Donadio, D.; Marinelli, F.; Pietrucci, F.; Broglia, R.A.; et al. PLUMED: A Portable Plugin for Free-Energy Calculations with Molecular Dynamics. J. Comput. Phys. 2009, 180, 1961–1972. [Google Scholar] [CrossRef]
  40. Tribello, G.A.; Bonomi, M.; Branduardi, D.; Camilloni, C.; Bussi, G. PLUMED 2: New feathers for an old bird. Comp. Phys. Commun. 2014, 185, 604–613. [Google Scholar] [CrossRef]
  41. Bonomi, M.; Bussi, G.; Camilloni, C.; Tribello, G.A.; Banás̆, P.; Barducci, A.; Bernetti, M.; Bolhuis, P.G.; Bottaro, S.; Branduardi, D.; et al. Promoting transparency and reproducibility in enhanced molecular simulations. Nat. Methods 2019, 16, 670–673. [Google Scholar] [CrossRef]
  42. Rumpel, S.; Siebel, J.F.; Diallo, M.; Farès, C.; Reijerse, E.J.; Lubitz, W. Structural Insight into the Complex of Ferredoxin and [FeFe] Hydrogenase from Chlamydomonas reinhardtii. ChemBioChem 2015, 16, 1663–1669. [Google Scholar] [CrossRef]
  43. Fukuyama, K. Structure and Function of Plant-Type Ferredoxins. Photosynth. Res. 2004, 81, 289–301. [Google Scholar] [CrossRef]
  44. Pandey, A.S.; Harris, T.V.; Giles, L.J.; Peters, J.W.; Szilagyi, R.K. Dithiomethylether as a Ligand in the Hydrogenase H-Cluster. J. Am. Chem. Soc. 2008, 130, 4533–4540. [Google Scholar] [CrossRef]
  45. Winkler, M.; Duan, J.; Rutz, A.; Felbek, C.; Scholtysek, L.; Lampret, O.; Jaenecke, J.; Apfel, U.P.; Gilardi, G.; Valetti, F.; et al. A safety cap protects hydrogenase from oxygen attack. Nat. Commun. 2021, 12, 756. [Google Scholar] [CrossRef]
  46. Rodríguez-Maciá, P.; Galle, L.M.; Bjornsson, R.; Lorent, C.; Zebger, I.; Yoda, Y.; Cramer, S.P.; DeBeer, S.; Span, I.; Birrell, J.A. Caught in the Hinact: Crystal Structure and Spectroscopy Reveal a Sulfur Bound to the Active Site of an O2-stable State of [FeFe] Hydrogenase. Angew. Chem. Int. Ed. 2020, 59, 16786–16794. [Google Scholar] [CrossRef]
  47. Duan, J.; Rutz, A.; Kawamoto, A.; Naskar, S.; Edenharter, K.; Leimkühler, S.; Hofmann, E.; Happe, T.; Kurisu, G. Structural determinants of oxygen resistance and Zn2+-mediated stability of the [FeFe]-hydrogenase from Clostridium beijerinckii. Proc. Natl. Acad. Sci. USA 2025, 122, e2416233122. [Google Scholar] [CrossRef]
  48. Koo, J.; Shiigi, S.; Rohovie, M.; Mehta, K.; Swartz, J.R. Characterization of [FeFe] Hydrogenase O2 Sensitivity Using a New, Physiological Approach. J. Biol. Chem. 2016, 291, 21563–21570. [Google Scholar] [CrossRef]
  49. Ghirardi, M.L.; Togasaki, R.K.; Seibert, M. Oxygen sensitivity of algal H2 production. Appl. Biochem. Biotechnol. 1997, 63, 141–151. [Google Scholar] [CrossRef] [PubMed]
  50. Bingham, A.S.; Smith, P.R.; Swartz, J.R. Evolution of an [FeFe] hydrogenase with decreased oxygen sensitivity. Int. J. Hydrogen Energy 2012, 37, 2965–2976. [Google Scholar] [CrossRef]
  51. Morra, S.; Arizzi, M.; Valetti, F.; Gilardi, G. Oxygen Stability in the New [FeFe]-Hydrogenase from Clostridium beijerinckii SM10 (CbA5H). Biochemistry 2016, 55, 5897–5900. [Google Scholar] [CrossRef] [PubMed]
  52. Morra, S. Fantastic [FeFe]-Hydrogenases and Where to Find Them. Front. Microbiol. 2022, 13, 853626. [Google Scholar] [CrossRef]
  53. Schumann, C.; Fernández Méndez, J.; Berggren, G.; Lindblad, P. Novel concepts and engineering strategies for heterologous expression of efficient hydrogenases in photosynthetic microorganisms. Front. Microbiol. 2023, 14, 1179607. [Google Scholar] [CrossRef]
  54. Jespersen, M.; Greening, C.; Ernst, L.; Man Leung, P.; Shafaat, H.S.; Grinter, R. Diverse lineages and adaptations of oxygen-adapted hydrogenases. Trends Biochem. Sci. 2025, 50, 596–609. [Google Scholar] [CrossRef]
  55. Stripp, S.T.; Goldet, G.; Brandmayr, C.; Sanganas, O.; Vincent, K.A.; Haumann, M.; Armstrong, F.A.; Happe, T. How oxygen attacks [FeFe] hydrogenases from photosynthetic organisms. Proc. Natl. Acad. Sci. USA 2009, 106, 17331–17336. [Google Scholar] [CrossRef]
  56. Cohen, J.; Kim, K.; King, P.; Seibert, M.; Schulten, K. Finding Gas Diffusion Pathways in Proteins: Application to O2 and H2 Transport in CpI [FeFe]-Hydrogenase and the Role of Packing Defects. Structure 2005, 13, 1321–1329. [Google Scholar] [CrossRef]
  57. Ghosh, S.; Das, C.K.; Uddin, S.; Stripp, S.T.; Engelbrecht, V.; Winkler, M.; Leimkühler, S.; Brocks, C.; Duan, J.; Schäfer, L.V.; et al. Protein Dynamics Affect O2-Stability of Group B [FeFe]-Hydrogenase from Thermosediminibacter oceani. J. Am. Chem. Soc. 2025, 147, 15170–15180. [Google Scholar] [CrossRef]
  58. Crack, J.C.; Green, J.; Cheesman, M.R.; Le Brun, N.E.; Thomson, A.J. Superoxide-mediated amplification of the oxygen-induced switch from [4Fe-4S] to [2Fe-2S] clusters in the transcriptional regulator FNR. Proc. Natl. Acad. Sci. USA 2007, 104, 2092–2097. [Google Scholar] [CrossRef] [PubMed]
  59. Outten, F.W. Iron-sulfur clusters as oxygen-responsive molecular switches. Nat. Chem. Biol. 2007, 3, 206–207. [Google Scholar] [CrossRef] [PubMed]
  60. Crack, J.C.; Green, J.; Thomson, A.J.; Le Brun, N.E. Iron–Sulfur Clusters as Biological Sensors: The Chemistry of Reactions with Molecular Oxygen and Nitric Oxide. Acc. Chem. Res. 2014, 47, 3196–3205. [Google Scholar] [CrossRef] [PubMed]
  61. Hoppe, A.; Pandelia, M.E.; Gärtner, W.; Lubitz, W. [Fe4S4]- and [Fe3S4]-cluster formation in synthetic peptides. Biochim. Biophys. Acta Bioenerg. 2011, 1807, 1414–1422. [Google Scholar] [CrossRef]
  62. Pizzanelli, S.; Pitzalis, E.; Botticelli, S.; Machetti, F.; Faraloni, C.; La Penna, G. Electron spin resonance in microalgae whole-cells to monitor hydrogen production. J. Biol. Inorg. Chem. 2025, 30, 229–240. [Google Scholar] [CrossRef]
  63. Abramson, J.; Adler, J.; Dunger, J.; Evans, R.; Green, T.; Pritzel, A.; Ronneberger, O.; Willmore, L.; Ballard, A.J.; Bambrick, J.; et al. Accurate structure prediction of biomolecular interactions with AlphaFold 3. Nature 2024, 630, 493–500. [Google Scholar] [CrossRef]
  64. Touloupakis, E.; Faraloni, C.; Silva Benavides, A.M.; Masojídek, J.; Torzillo, G. Sustained photobiological hydrogen production by Chlorella vulgaris without nutrient starvation. Int. J. Hydrogen Energy 2021, 46, 3684–3694. [Google Scholar] [CrossRef]
  65. Torzillo, G.; Scoma, A.; Faraloni, C.; Ena, A.; Johanningmeier, U. Increased hydrogen photoproduction by means of a sulfur-deprived Chlamydomonas reinhardtii D1 protein mutant. Int. J. Hydrogen Energy 2009, 34, 4529–4536. [Google Scholar] [CrossRef]
Figure 1. Representation of the CpI [FeFe] hydrogenase architecture, using chain A in PDB 6N59 [10]. Residues’ sidechains and hydrogen atoms are not displayed for clarity. Secondary motifs are calculated by STRIDE method: α -helices are purple; 1–3 helices are blue; β -sheets are yellow; turns are cyano. Iron-sulfur clusters are represented as spheres with radii of 1 Å. Fe is pink, S is yellow, C is gray, O is red, N is blue. Clusters are numbered (1–5) according to the distance from the H-cluster, where di-iron cluster contains the CO, CN- and adt fragments binding distal (Fe d ) and proximal iron atoms. Molecular drawing was performed with VMD [20].
Hydrogen 06 00077 g001
Figure 2. Predicted local distance difference test (plDDT) as a function of residue index for the 5 highest rank structural predictions performed by AlphaFold2. Horizontal bars indicate the regions aligned to CpI sequence. The + symbols indicate Cys, while the × symbols are assigned to Cys linking the H-cluster to the protein (see Table 1).
Hydrogen 06 00077 g002
Figure 3. Left - Overlap of heavy backbone atoms (N, C α , C, O) in the 5 highest rank models predicted by AF. Cys C α of rank 1 model (red) are emphasized as spheres. Low plDDT loops (Figure 2) and O atoms are not displayed for clarity. Right—The position of S γ (Cys) (23 residues) compared within the 5 structures (5 models in left panel). Different structures are displayed in different colors. Atomic radii (right panel) are of 1 Å. The positions have been aligned to minimize the relative root-mean square deviation of the displayed atoms: backbone atoms in the left panel; S γ of all Cys in the right panel. The scale is different in the two panels, the orientation is similar, but not identical. Cluster numbering is chosen according to increasing distance from the active site (H-cluster).
Hydrogen 06 00077 g003
Figure 4. The free energy change Δ G as a function of the chosen collective variable (d, distance between cluster 1 and cluster 2) by using the two methods described in Methods, MtD and MEC.
Hydrogen 06 00077 g004
Figure 5. Representative structures 1 and 3 described in Table 2. FeS clusters are displayed as spheres (Fe is pink, S is yellow). Atomic radii are arbitrary. Secondary motifs are displayed according to STRIDE algorithm. Molecular drawing was performed with VMD [20]. Left—Initial MtD structure where two domains are separated. Protein orientation is similar to that in Figure 3: F-domain is towards the upper-right corner of the panel; H-domain is towards the lower-left corner. Middle—Sample 1, reference for RMSD. Right—Sample 3, RMSD is 10.4 Åfrom rereference.
Hydrogen 06 00077 g005
Figure 6. Root-mean square fluctuation of C α atoms for each residue. The projections over the first three eigenvectors of covariance matrix have been averaged. The horizontal bars indicate the protein regions aligned to CpI sequence. The + symbols indicate Cys, while the × symbols are assigned to Cys linking the H-cluster to the protein (see Table 1).
Hydrogen 06 00077 g006
Figure 7. Radial distribution function ( g ( r ) ) computed for different Fe-water distances. Left—Fe atoms belonging to FeS clusters 1–5, water atoms are always O (Ow). All the 100 MD walkers are included in the statistics. Right—Fe atom is Fe d (the distal Fe in di-iron complex of H-cluster) and water atoms are O (Ow, thick lines) and H (Hw, thin lines). The average including the walkers with d < 1.1 nm are used as low d statistics. The other walkers ( d 1.1 nm) are used as high d statistics.
Hydrogen 06 00077 g007
Figure 8. Probability (P) computed for Fe d -S γ (Cys 414) distance (d’). Black—The MtD statistics (100,000 configurations) was used. Red—The MtD statistics is reweighted with the MEC method to obtain the average of the collecitve variable d (cluster 1–cluster 2 distance) of 1.1 nm. The sum of values of P is one, and the same number of P values is used in the two statistics.
Hydrogen 06 00077 g008
Table 2. Rules used to select representative low free energy configurations.
SampleSelection Rule
1Maximal MEC modulation weight using the constraint d = 0.95 nm
2Center of the maximally populated cluster in MtD
(using a RMSD cut-off of 0.3 nm) obtained for configurations with d 0.95 nm
3Minimal distances between FeS clusters in MtD
Table 3. Distances (nm) between FeS clusters in the crystal structure of CpI and in representative samples 1 and 3 extracted from the metadynamics.
SampleCpI13
Cluster234523452345
11.152.092.682.940.912.02.93.10.942.02.82.8
2-1.232.202.25-1.22.32.3-1.22.12.2
3--1.221.37--1.31.3--1.21.4
4---1.92---1.9---1.9
Disclaimer/Publisher’s Note: The statements, opinions and data contained in all publications are solely those of the individual author(s) and contributor(s) and not of MDPI and/or the editor(s). MDPI and/or the editor(s) disclaim responsibility for any injury to people or property resulting from any ideas, methods, instructions or products referred to in the content.