Article

Undoped Polybenzimidazole Membranes Composited with CeP5O14 for Use in Hydrogen Fuel Cells at 200 °C

1
Department of Mechanical Engineering, North Dakota State University, Fargo, ND 58108, USA
2
Department of Coatings and Polymeric Materials, North Dakota State University, Fargo, ND 58108, USA
*
Author to whom correspondence should be addressed.
Hydrogen 2025, 6(3), 70; https://doi.org/10.3390/hydrogen6030070
Submission received: 31 July 2025 / Revised: 2 September 2025 / Accepted: 12 September 2025 / Published: 16 September 2025

Abstract

Intermediate-temperature (IT) proton-exchange membranes (PEMs) play vital roles in hydrogen and direct liquid fuel cells, electrolyzers, and other electrochemical membrane reactors at elevated temperatures of higher than 150 °C. This article reports the fabrication and performance assessment of a type of new IT polymer–inorganic composite (PIC) PEMs that were made of cerium ultraphosphate (CeP5O14-CUP) as the durable solid-state proton conductor and undoped polybenzimidazole (PBI) as the high-temperature (HT) polymeric binder. The proton conductivity and electrochemical performance of the PIC PEMs were characterized at 200 °C with varying membrane thickness, processing parameters, and operating conditions using a single-stack hydrogen fuel cell connected to a fuel cell test station. Experimental results show that the PIC membranes (with CUP of 75 wt.%) carried high mechanical flexibility and strength as well as noticeably reduced water uptake of 4.4 wt.% compared to pristine PBI membranes of 14.0 wt.%. Single-stack hydrogen fuel cell tests at 200 °C in a humidified hydrogen and air environment showed that the proton conductivity of the PIC PEMs was measured up to 0.105 S/cm, and the electrochemical performance exhibited its dependence upon the membrane thickness with the power density of up to 191.7 mW/cm2. Discussions are made to explore performance dependence and improvement strategies. The present study expects the promising future of the IT-PIC-PEMs for broad applications in high-efficiency electrochemical energy conversion and value-added chemical production at elevated temperatures of 200 °C or higher.

1. Introduction

Proton-exchange fuel cells (PEMFCs) have emerged as a type of leading electrochemical energy conversion device in clean energy technology, owing to their high efficiency, low emissions, and sound scalability [1,2,3]. Yet, conventional PEMFCs are operated at relatively low temperatures (LT) (typically below 100 °C), which limits their performance in terms of efficiency, fuel flexibility, and long-term durability. To overcome these limitations, growing research interests have been evidenced in developing intermediate-temperature (IT) PEMFCs that are designed to operate in the temperature range from 120 to 400 °C [4,5,6,7,8]. Fuel cells operated in the IT range exhibit several technical advantages including enhanced electrochemical kinetics, high tolerance to contaminating CO, H2S, and other fuel impurities, lowered electrocatalyst loading, simplified heat and water management, as well as the potential for favorable waste heat recovery and use of low-cost non-platinum-group (NPG) catalysts and liquid fuels (e.g., ethanol) [9,10,11,12,13,14]. Yet, to develop and deploy high-performance PEMFCs to be operated at elevated temperatures, a number of technical barriers still need to be resolved in order to achieve high-performance IT proton-exchange membranes (PEMs) that carry sufficient mechanical and thermochemical durability, high electrochemical stability and proton conductivity (>0.02 S/cm), and low gas crossover [15,16,17,18,19,20,21,22].
As the core component of IT-PEMFCs, PEM directly influences the proton conductivity and the overall electrochemical performance of the resulting membrane electrode assemblies (MEAs) of the PEMFCs. To date, polybenzimidazole (PBI) as one of the common high-temperature (HT) polymers has been extensively investigated for developing acid-doped IT PEMs for IT-PEMFCs due to its exceptional thermal stability (with Tg of 425–436 °C), high mechanical strength, and ability to retain the high proton conductivity at elevated temperatures [10,11,12,13]. PBI, doped with phosphoric acid (H3PO4-PA), has demonstrated reasonably high proton conductivity at temperatures of above 150 °C. Nevertheless, the proton-conducting performance of PA-doped PBI membranes is often hindered due to unavoidable water loss at elevated temperatures, leading to decreasing proton conductivity and degrading fuel cell efficiency [11,13,23]. To date, several technical approaches have been devoted to synthesizing novel polymers, e.g., poly(pyridobisimidazole) (PPI), which exhibited an excellent acid uptake of over 550%, resulting in exceptional proton conductivity of 0.23 S/cm at 180 °C [24]. PEMs made of these HT polymers offer advantages in terms of mechanical flexibility, proton conductivity, and HT structural integrity and thermochemical stability. However, their scalability and stability in long-term PEMFC operation, especially in the presence of fuel impurities and extended cycling, are still an outstanding issue under intensive investigation [10,11,12,13,14,15,16]. A brief comparison of work temperatures, electrolytes, technical features, and outstanding issues among LT, IT, and HT fuel cells is summarized in Table 1 [3,5,6,7,10,11,12,13,14,15,16,17,18,19,20,21,22], which shows the unique technical features and promising future of IT-PEMFCs for low-cost, high-efficiency and durable electrochemical energy conversion.
On the other hand, inorganic solid-state proton conductors have attracted particular attention in recent years due to their potential applications in electrochemical energy conversion and storage devices, including fuel cells and electrolyzers operated at elevated temperatures [7,9,12,13,14,15,16,17,18,19,20,21,22]. Among broad materials under exploration, cerium-based compounds demonstrate their unique electrochemical properties beneficial to enhance the proton conductivity of the resulting PEMs. Cerium (Ce), a rare-earth metal, is the most abundant element in the lanthanide series and carries fascinating redox behavior due to its unique atom electronic structure with four outer valence electrons and similar 4f, 5d, and 6s electron energy levels, which plays a crucial role in facilitating proton and oxide ion transport [4,7,9,15,16,17,18,19,25,26,27,28,29,30,31]. For instance, by means of so-gel method, Bhanu et al. [30] synthesized Nd3+ and Dy3+ co-doped cerium oxide (CeO2) systems of Ce0.8NdyO2-(x−y/2+y) (x = 0.2; y = 0.04, 0.08, 0.1) as IT solid-state electrolytes for IT solid-oxide fuels cells (SOFCs) with the superior oxide ion conductivity of 2.2 × 10⁻² S/cm and activation energy of 0.83 eV at 600 °C. The performance is comparable to those of SOFCs based on doped metal transition perovskites and working at lowered temperatures (e.g., 700 °C) [32,33,34,35,36,37,38].
CeO2 is often coined as ceria and has been widely studied for its oxygen storage capacity and ability to undergo reversible transformations between Ce4+ and Ce3+ oxidation states. This redox flexibility not only contributes to its versatile catalytic properties but also influences the proton-conducting mechanisms [39,40,41,42,43]. Integration of protons into the CeO2 structure, particularly under hydrated or acidic conditions, enables it to act as a proton-conducting medium [15,16,17,18,27]. Yet, inorganic proton conductors are typically brittle and fragile, and it is necessary to composite their finely ground particles with HT polymers (e.g., PBI, polytetrafluoroethylene—PTFE, etc.) as polymeric binders to form polymer–inorganic composite (PIC) membranes to improve the membrane processibility, structural integrity, and mechanical flexibility and strength [15,17,18,44]. Fabrication of the PIC membranes utilizes the advantages of both inorganic solid-state proton conductors (high proton conductivity) and HT polymers (high mechanical performance). In addition, more recent investigations have been concentrated on design and fabrication of various composite membranes made of PBI composited with a variety of inorganic materials, e.g., metal phosphates and pyrophosphates, silica, and cerium-based compounds (CeO2, Ce(SO4)2, Ce2(SO4)3, Ce(HPO4)2, CePO4, CeP2O7, etc.) [15,16,17,18,27,45,46]. These PIC membranes have demonstrated improved structural integrity, electrochemical stability, proton conductivity, and better chemical tolerance to fuel impurities (e.g., CO, SO2, CH4, etc.) [47,48].
Furthermore, recent studies also indicated that PIC proton-conducting membranes, e.g., those made of inorganic solid-state proton conductors and PBI, demonstrated noticeably improved membrane proton conductivity, structural durability, and PEMFC performance. For instance, PIC membranes incorporating silica or phosphate nanoparticles (NPs) have exhibited enhanced proton conductivity, increased mechanical strength, and better resistance to fuel impurities [25,27,48]. In addition, PIC membranes have also demonstrated the potential for improved long-term performance durability. However, challenges still remain in optimization of the composite formulation to balance the proton conductivity, durability, and manufacturing costs. Other inorganic proton conductors, e.g., doped CeO2 and pyrophosphates, have also been under exploration for fabrication of IT-PIC-PEMs for use in PEMFCs. For instance, PBI membrane incorporated with Sn0.95Al0.05P2O7 (SAPO) fine particles was able to achieve the proton conductivity of 0.1 S/cm at 240 °C, with a peak power density of 840 mW/cm2 in fuel cell tests [49]. While these PIC membranes have exhibited high cell performance and good stability in the IT range, outstanding technical challenges remain in enhancing their mechanical properties and reducing the manufacturing costs [15,27]. On the other hand, acid-doped PBI membranes demonstrated high proton conductivity and overall electrochemical performance. Yet, the level of acid doping in PBI is typically limited by various material and process factors, e.g., the acid retainability of PBI under fuel cell operating conditions, particularly at elevated temperatures. Acid loss due to evaporation or leaching with time can result in decreasing proton conductivity, thereby compromising the long-term membrane stability and the fuel cell performance [4,11,13,15,50]. Additionally, high acid content that is required to achieve the optimal proton conductivity can accelerate the mechanical degradation of the PEMs and therefore shorten their lifespans [14,24].
Moreover, the chemical compatibility of acid-doped PBI with other fuel cell components, e.g., the anode and cathode electrodes, is still an outstanding technical issue. The acidic environment can accelerate the degradation of the catalyst layers and other cell components and further negatively influences the overall durability and performance of the fuel cells [51,52]. Beyond these technical challenges, the cost and complexity of the acid-doping process itself also pose technical barriers to large-scale production in industry. Synthesis of high-quality highly acid-doped PBI membranes requires expensive chemicals and precise control of the reaction conditions, which makes the process both costly and time-consuming.
The present experimental study was the extension of our recent research of developing and characterizing acid-free (e.g., phosphoric acid) IT-PIC-PEMs for use in PEMFCs [45]. The present PIC membranes were made of CUP particles as the solid-state proton conductor and undoped PBI as the HT polymeric binder. Specifically, the experimental study was conducted to investigate the effects of membrane thickness and processing conditions as well as the fuel cell operating conditions on the proton conductivity and electrochemical performance of the PIC membranes at 200 °C. The research was aimed at providing valuable insights into the potential of IT-PIC-PEMs for use in next-generation IT, high-efficiency, durable electrochemical energy conversion devices.

2. Experimental

2.1. Materials

PBI S26 solution (with 26.2 wt.% PBI of Mw= ~35,000, dissolved in 72.3 wt.% dimethylacetamide (DMAc) in the presence of 1.5 wt.% lithium chloride (LiCl) stabilizer) was purchased from PBI Performance Products Inc. (Charlotte, NC, USA). CeO2 nanoparticle (NP) powder, H3PO4 (86 wt.%), and DMAc anhydrous (99.8 wt.%) were purchased from MilliporeSigma (St. Louis, MO, USA). Platinum (Pt) catalyst NPs (60 wt.% Pt on Vulcan XC 72) and gas diffusion layers (GDLs) (CT carbon cloths with microporous layers) were purchased from the Fuel Cell Store (College Station, TX, USA).

2.2. Synthesis of CUP

Cerium ultraphosphate (CUP-CeP5O14) as the solid-state proton conductor was synthesized according to our recent study [45]. In brief, CeO2 and H3PO4 (with the molar ratio of Ce/P = 1:12) were mixed and heated at 100 °C for 4 h in a tubular furnace under an argon atmosphere. Then, the mixture was heated to 800 °C in a Pt crucible and was further maintained at this temperature for 24 h in the argon atmosphere. Finally, the product was cooled down to 500 °C at a ramping temperature rate of 2 °C/h and air-quenched to ambient temperature. The obtained crystalline CUP powder had been further purified by rinsing in boiling deionized (DI) water three times, followed by drying in an air-circulated oven at 130 °C. Finally, the raw CUP powder was stored in a sealed glass vial before use.

2.3. Solution-Casting of PIC Membranes

The as-synthesized raw CUP powder was made up of irregular CUP particles within a wide range of particle sizes from a few dozen micrometers down to tens of nanometers. In order to achieve finer and more uniform CUP particles for preparing quality CUP-PBI PIC membranes in this study, the raw CUP powder was finely ground using a mortar and pestle for two hours. After grinding, a field-emission scanning electron microscope (FE-SEM) (JEOL JSM-7600F, JEOL Ltd., Tokyo, Japan) was employed to measure the particle size of the sampled CUP powder. For the convenience and accuracy of the particle size measurement by SEM, the sampled CUP powder was separated into three groups according to their relative CUP particle sizes, designated as “Large,” “Medium,” and “Small,” respectively, which was realized by using a lab-made multi-grade sedimentation setup, as illustrated in Figure 1. Therefore, for each designated group of the CUP particles, its mass was measured by a high-resolution digital balance, and its mean particle size and size deviation were determined via statistical analysis of the particle size data obtained from computerized image analysis of the CUP particle SEM images during SEM characterization of an ultrathin layer of CUP powder with the particle size of either “Large,” “Medium,” or “Small.”
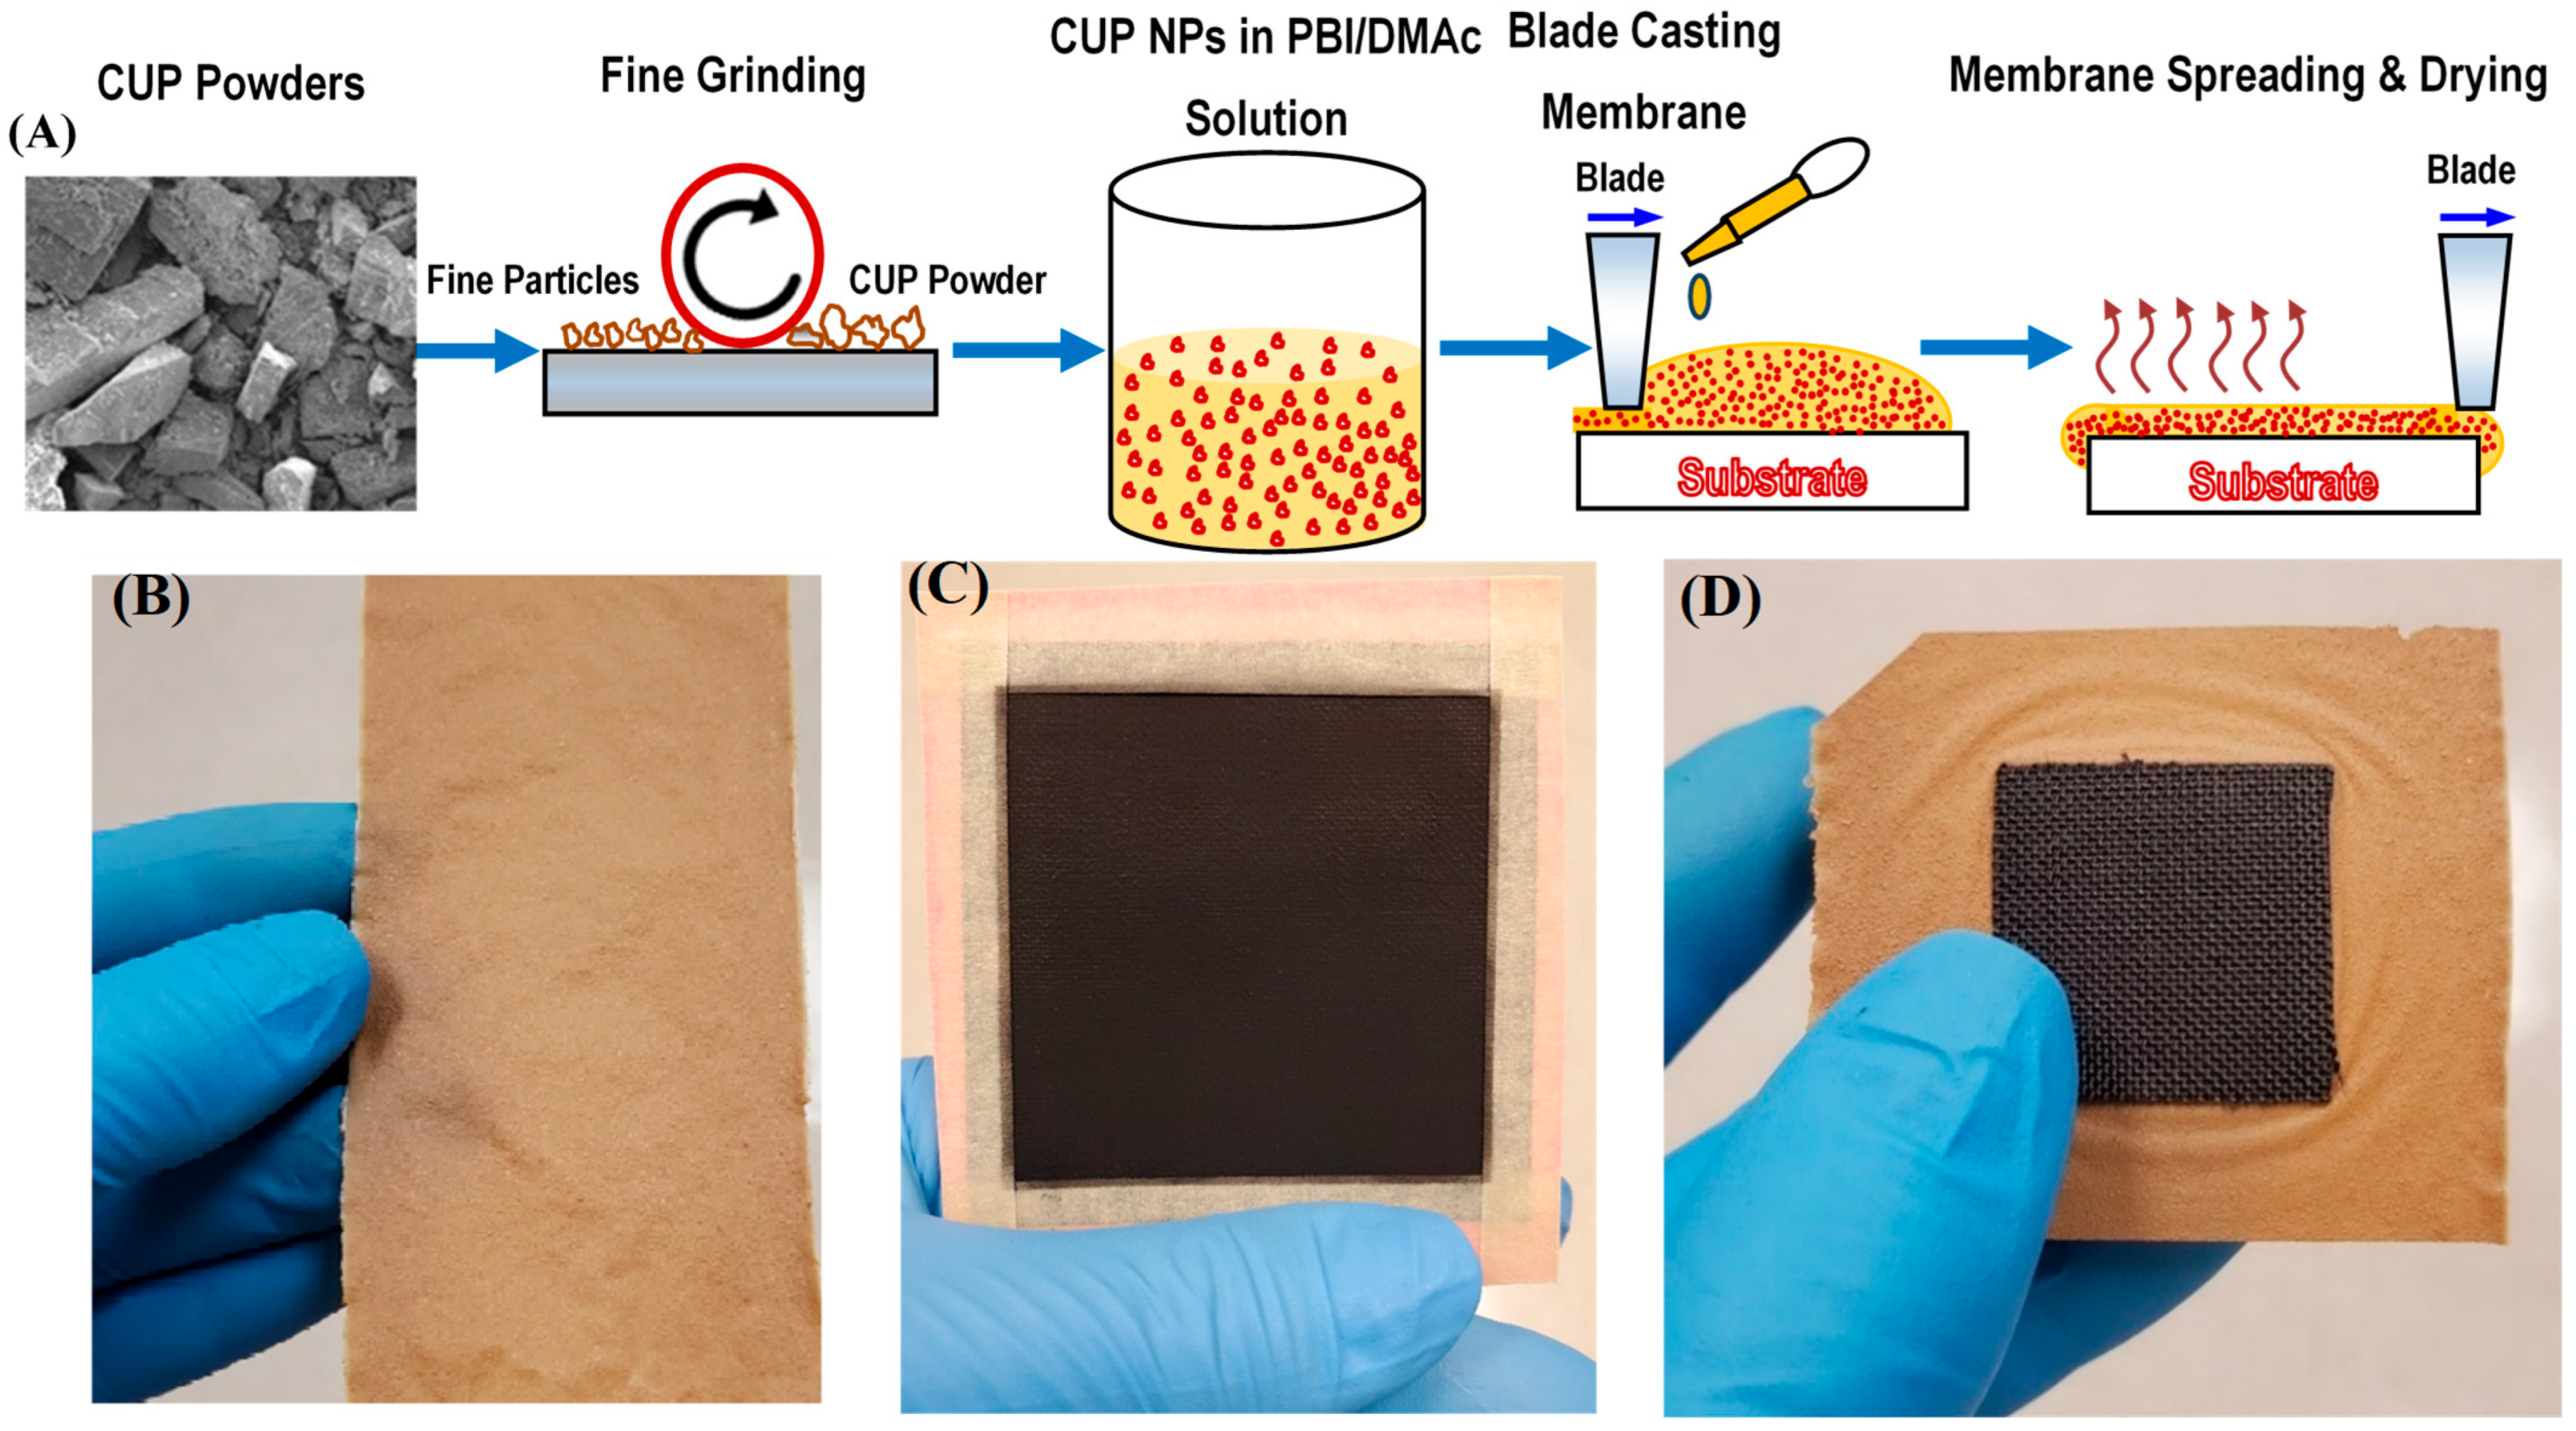
The targeted CUP-PBI PIC membranes with the CUP/PBI mass ratio of 3:1 (75 wt.%) were fabricated using a solution-casting method, as illustrated in Figure 2A [45]. During the process, the finely ground CUP powder was dispersed in a DMAc solvent in a glass vial to form a CUP-DMAc colloid after sonication for 15 min, followed by magnetic stirring for 2 h. Then, a proper amount of PBI-DMAc solution was added to the CUP-DMAc colloid under vigorous stirring, followed by magnetic stirring for 24 h at room temperature. The formed slurry of the trinary CUP-PBI-DMAc mixture was cast onto a flat steel panel (Q-panel, the Q-Lab Co., Ltd., Westlak, OH, USA) with a controlled wet layer thickness using a drawdown bar with specific specifications (the Paul N. Gardner Co., Ltd., Pompano Beach, FL, USA) [53]. The as-cast PIC membranes attached to the steel panels had been placed in an air-circulating oven at 125 °C for a few minutes to evaporate the DMAc solvent and form a dry PIC membrane. Then, the steel panel covered with the dried PIC membrane was submerged in DI water and the PIC membrane was peeled off easily from the steel panel. Consequently, the newborn free-standing PIC membranes were further annealed at 125 °C in the same air-circulating oven for a few minutes to yield the undoped CUP-PBI PIC membranes ready for tests and characterization. Figure 2B–D shows the typical PIC membrane, gas diffusion electrode (GDE), and IT-MEA prepared in this study. For the purpose of comparison, undoped pure PBI membranes were also prepared using the same aforementioned procedure, which were used as the control membrane samples.

2.4. Water Uptake Testing

Samples of the PIC membrane (designated as CUP_75%) and pure PBI membrane prepared above were soaked in a DI water bath for specified time intervals from 2 to 24 h. After soaking, the membrane samples were taken out of the water bath, dried using lab tissue paper, and weighed to record their weights (mwet). Weights of the dehydrated membrane samples (mdry) were measured after desiccating the membrane samples in an air-circulating oven at 110 °C until no change in the weights was detected. The water uptake at 0 h represents the water content in the samples at the ambient temperature and humidity condition. The water uptake percentage of the membrane sample is calculated as
W a t e r   u p t a k e % = m w e t m d r y m d r y × 100 % ,
which is used to indicate the water uptake property of the PIC membranes.

2.5. Preparation of GDEs and IT-MEAs

The GDEs used in the present fuel cell tests were prepared via air-brushing the Pt/C catalyst ink onto the procured gas diffusion layers (GDLs). In a typical process of MEA fabrication, the catalyst ink was lab-prepared by mixing 30 mg Pt/C catalyst (the Pt/C mass ratio = 60:100), 2.0 mg of the CUP-PBI suspension (with the CUP/PBI mass ratio = 98:2), and 0.8 g of DMAc as the carrier. The formed ink in a glass vial had been sonicated for 30 min for uniform mixing and then air-sprayed onto the surface of a square-shaped GDL with the areal area of 25 cm2 that was placed onto a heated vacuum table at 120 °C. As a result, the as-fabricated GDEs carried the Pt-catalyst load of 1.0 mg/cm2.
The MEA used in this study was assembled following a common hot-pressing procedure. During a typical process, an MEA laminate of five layers was assembled using a hand lay-up. The resulting MEA laminate with the areal dimensions of about 4.0 cm × 4.0 cm was placed in between the two GDEs prepared above (i.e., the anode and cathode, respectively), each of which carried an active area of 5 cm2, and then hot-pressed at 150 °C with a pressure of 2.5 MPa for 10 min. After hot-pressing, the thickness of each GDL was reduced to ~83% of its original thickness. Consequently, the resulting MEA was installed into a single-stack fuel cell fixture (SAI Cell-525, the Scribner Associates Inc., Southern Pines, NC, USA) for the present hydrogen fuel cell testing at 200 °C. Figure 2B–D show the optical images of a typical CUP-PBI PIC membrane sample, a GDE covered with Pt/C catalyst, and an as-prepared IT-MEA in this study.

2.6. Structural Characterization of GDEs

Surface and cross-sectional morphologies of the GDEs were characterized by using a field-emission scanning electron microscope (FE-SEM) (JEOL JSM-7600F, JEOL Ltd., Tokyo, Japan). Prior to SEM characterization, small patches of GDE samples were scissored from the prepared GDE and sputter-coated with an ultrathin layer of carbon to avoid possible charge accumulation onto the samples during the SEM characterization. The elemental composition of the GDE samples was analyzed by using energy-dispersive X-ray spectroscopy (EDS) after the SEM micrographs were taken.

2.7. Single-Stack Hydrogen Fuel Cell Testing

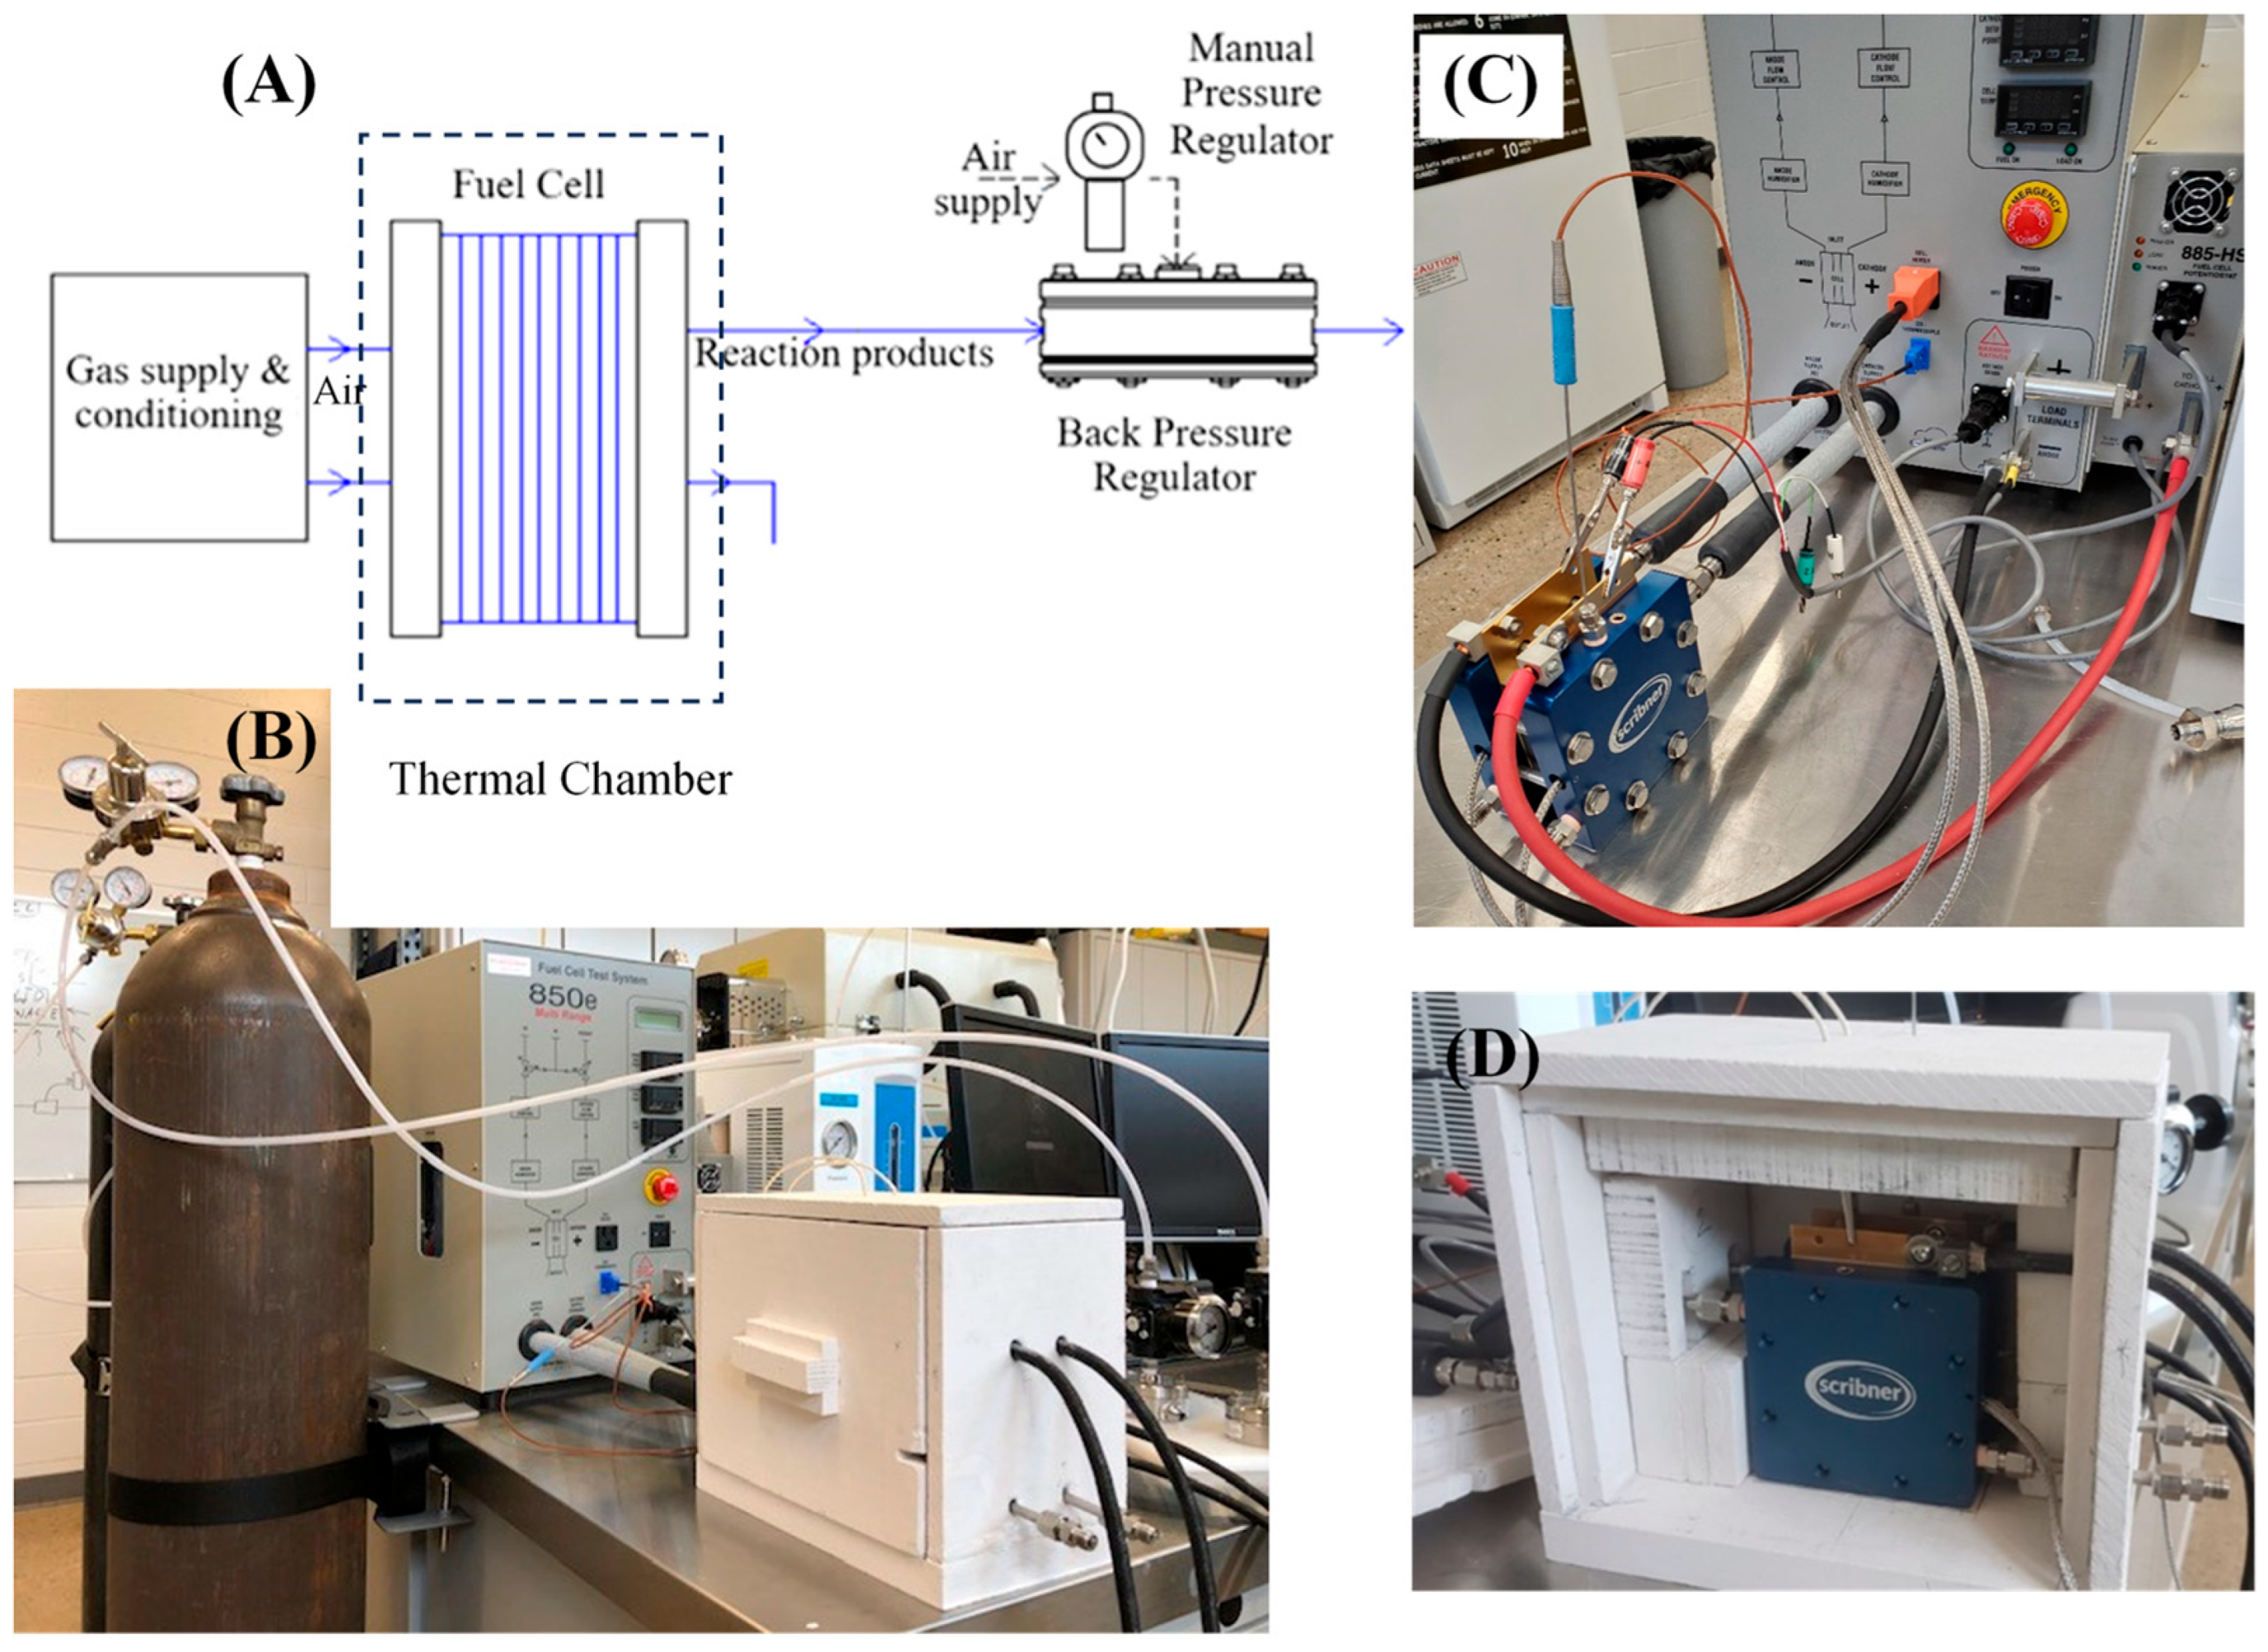
A Scribner® 850e fuel cell test station (the Scribner Associates Inc., Southern Pines, NC, USA) was utilized for characterization of the electrochemical performance of the IT-MEA and the proton conductivity of the IT-PIC-PEM prepared in this study. Figure 3 shows the fuel cell testing setup, in which a lab-made thermal chamber installed with a proportional–integral–derivative (PID) temperature control unit was used to maintain the fuel cell temperature at 200 °C. A single-stack hydrogen fuel cell (the Scribner® SAI Cell-525) installed with the IT-MEA was operated under the testing condition: Inlet reactant gas temperatures of TH2 = TAir = 80 °C (humidified with relative humidity (RH) of ~47%), fuel cell temperature of Tcell = 200 °C, backpressure = 1.0 bar (for either H2 or air), a minimum mass flow rate of 0.08 L/min and the stoichiometry of 1.2 applied for H2 as well as a minimum mass flow rate of 0.15 L/min and the stoichiometry of 2.5 applied for air. Prior to data acquisition of the single-stack fuel cell performance, the MEA was first activated via a vendor-recommended break-in procedure at the cell temperature of 200 °C, such that the cell had been held via applying a pseudo-cyclic voltage with the alternative amplitudes of 0.6 V, 0.3 V, and then an open circuit condition, respectively, for a constant duration of 60 s for 20 cycles. Application of the break-in procedure in a fuel cell test was to eliminate the possible tiny amount of DMAc residues (with the boiling point of 165 °C) that might remain in the PIC membranes after fabrication and also to stabilize the MEA before a fuel cell test. The proton conductivity of the PIC membrane was extracted from the electrochemical impedance spectroscopy (EIS) measurement of the single-stack hydrogen fuel cell, which was operated at the constant direct current (DC) density of 0.1 A/cm2, with 10 steps/decade in the frequency range from 0.1 to 10 kHz, and an alternative current (AC) with the amplitude of 5% that of the DC superimposed onto the DC. The Z-plot of the EIS measurement was recorded for spectra analysis, and the value of proton conductivity of the PIC membrane is calculated as
σ ( S / c m ) = L   ( c m ) R   O h m × A   ( c m 2 ) ,
where σ (S/cm) stands for the proton conductivity of the PIC membrane, L (cm) is the membrane thickness, R (ohm) is the membrane ionic resistance that was extracted from the Nyquist plot, and A (cm2) is the active areal area of the membrane (5 cm2). During an EIS measurement, the single-stack fuel cell was maintained at an open circuit condition between two consecutive measurements.

3. Results and Discussion

The present IT-PIC-PEMs were fabricated by means of a low-cost solution-casting technique via casting the slurry of the CUP particles uniformly dispersed in a PBI/DMAc solution as aforementioned. To reduce the size of the particles, the CUP powder was carefully ground using mortar and pestle before preparing the slurry for casting. The present PEM fabrication technique can be conveniently employed for processing thin CUP-PBI PIC membranes with the CUP mass concentration as high as 85 wt.% [45].

3.1. CUP Particle Size Characterization

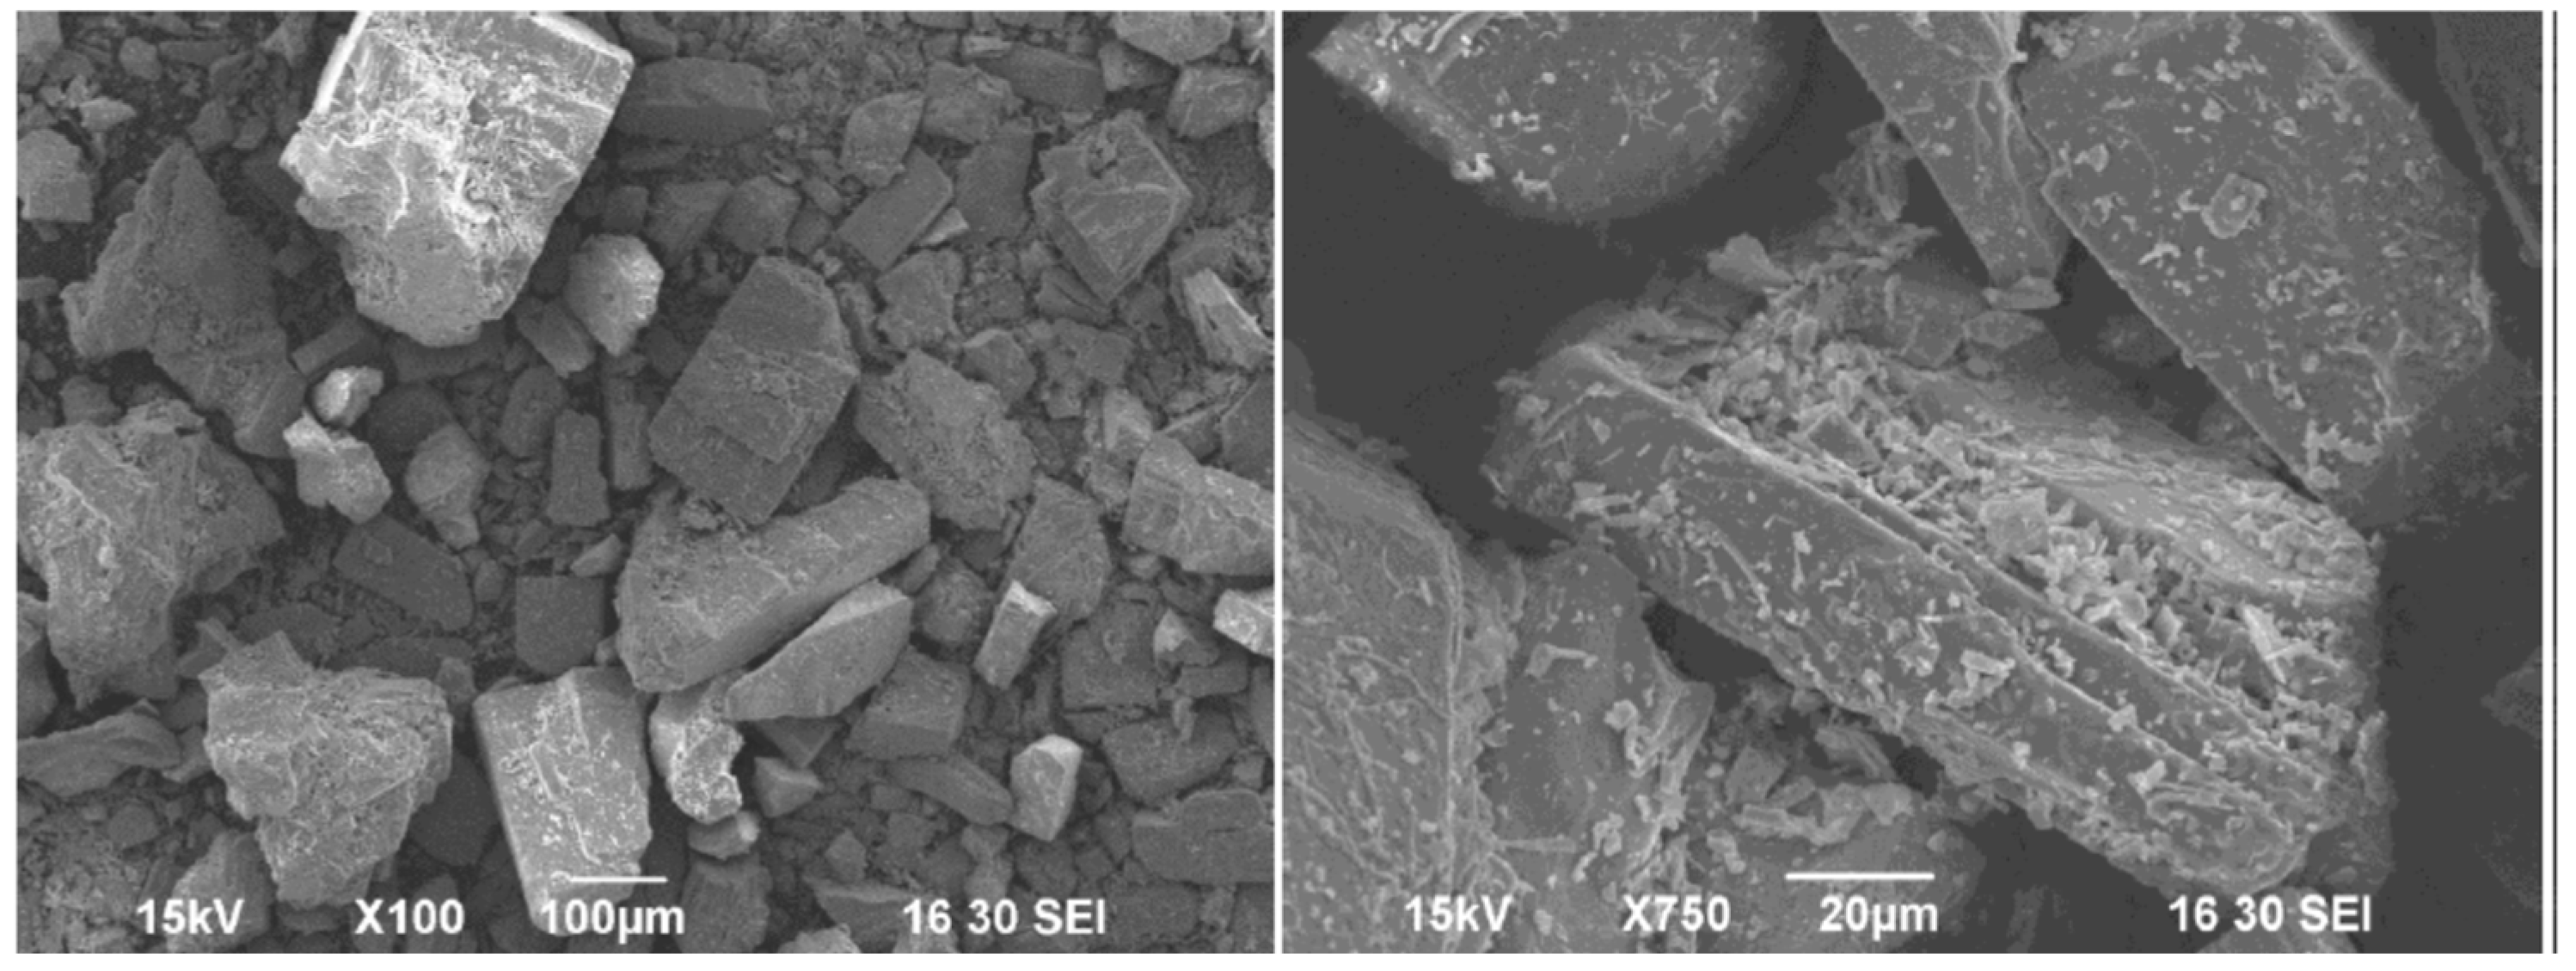
Figure 4 shows the typical SEM micrographs of as-synthesized CUP powder that was made up of irregular CUP particles with the particle sizes in a wide range. It can be observed that some CUP particles even carry the particle length of over 100 μm. Figure 5 shows the typical SEM images of three groups of a batch of finely ground CUP powder after being ground for 2 h, which are designated as “Large,” “Medium,” and “Small,” respectively. The statistical results of the CUP particle size of the three CUP particle groups are shown in Table 2, and the mass distribution of the three CUP particle groups is shown in Table 3. It can be found that after having ground the raw CUP particles using mortar and pestle for two hours, the average particle size was obviously reduced. In addition, the lab-made three-grade sedimentation setup can effectively separate the CUP particles into three groups of CUP particles according to their particle sizes, which provides a simple, effective way to further grind the CUP particles in the larger particle groups into smaller ones.

3.2. GDE Characterization

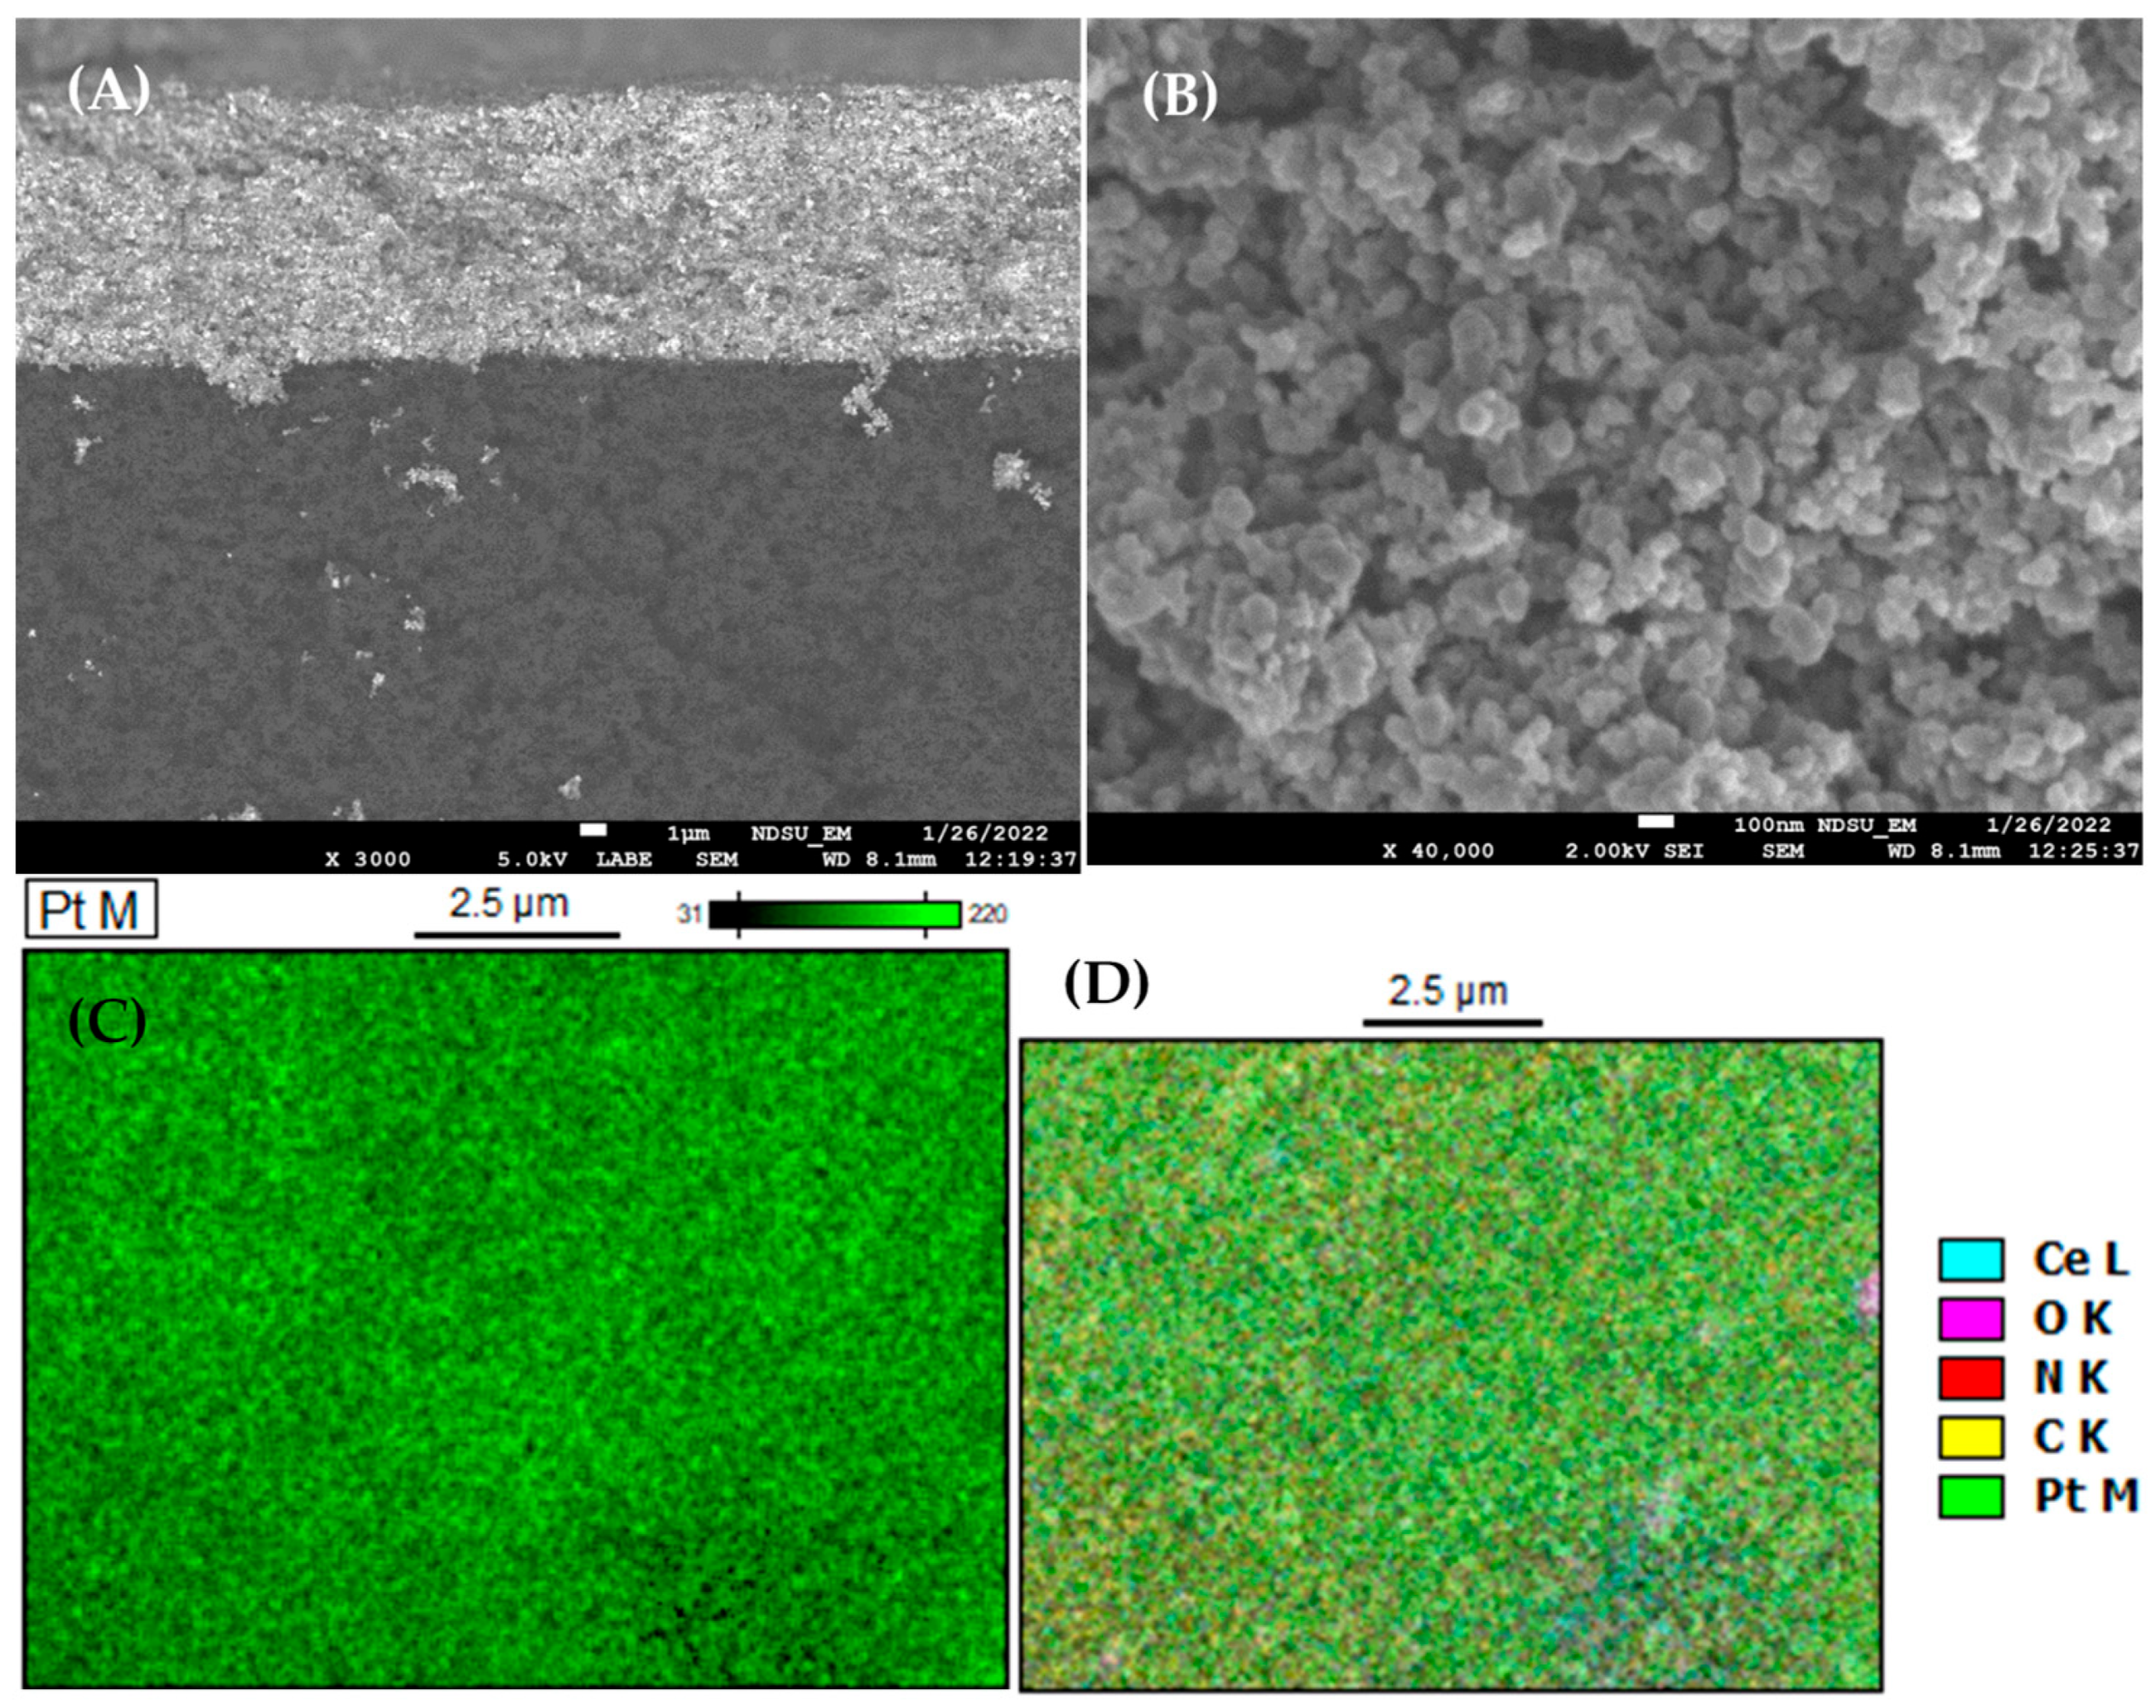
To characterize the electrochemical performance of the IT-PIC-PEMs, each PIC membrane sample was assembled with two as-fabricated Pt-catalyst-covered GDEs to form an IT-MEA, which was further assembled into a single-stack hydrogen fuel cell that was connected to a fuel cell test station (Figure 3). Prior to assembling the IT-MEA, pieces of the typical as-prepared GDEs were scissored and sampled for characterization of the GDEs. SEM was employed to characterize the cross-sectional microstructures and surface morphology of the Pt-catalyst layer of the GDEs. EDX analysis was conducted to estimate the element distribution on the GDE surface. The typical SEM micrographs and EDX color mapping of the GDEs are shown in Figure 6. Surface morphology of the GDE indicates the porous nanostructure of the surface layer with visible Pt NPs. It is evidenced that the Pt-catalyst NPs were evenly distributed at the GDE surface with no visible agglomeration. The backscattered SEM micrograph of the cross-sectional GDE layer shows a visible boundary between the Pt-catalyst layer and the carbon substrate. The thickness of the Pt-catalyst layer (with the load of 1.0 mg/cm2) is estimated ~12–14 µm.
EDX color mapping of the element distribution on a sampled catalyst layer was made in terms of general elements and specific elements of Pt, N, O, and Ce on the surface, respectively, which shows the existence of the representing elements Pt, Ce, and N and their even distribution. In addition, elemental composition of the Pt-NP-covered GDE sample was further analyzed by means of energy-dispersive X-ray spectroscopy (EDS) after taking the SEM micrographs (Figure 7 and Table 4). The gained EDS results confirm the even distribution of the Pt-catalyst NPs as well as other elements at the surface of the catalyst layer, corresponding to the theoretical predictions.

3.3. Proton Conductivity Measurements of IT-MEAs Made of CUP-PBI PIC PEMs

The values of proton conductivity of the lab-made IT-PIC-PEMs were extracted from the EIS measurements. During a single-stack fuel cell test, the measured value of the proton conductivity of an IT PIC membrane typically increased with time until reaching a stable value at a certain point. Figure 7B shows the variation in the proton conductivity with increasing time of a typical IT-PIC-PEM, which was measured in a hydrogen fuel cell test at 200 °C using a Scribner 850e fuel cell test station. After having been tested for ~20 h, the measured proton conductivity reached 0.105 S/cm, which is at the higher side of the range of proton conductivity of Nafion® membranes used in low-temperature PEMFCs [29].
Table 5 summarizes the values of proton conductivity of several IT-PIC-PEM samples prepared in this study with different membrane thicknesses and processing parameters. These PIC membranes exhibited consistently high proton conductivity at 200 °C and 47% RH, which endorses the reliable processing technique of the IT-PIC-PEMs in this study. Table 6 compares the values of proton conductivity of the present IT-PIC-PEMs at 200 °C with several common LT and IT PEMs reported in the literature. Compared to other LT and IT PEMs in Table 6, the present CUP-PBI PIC membranes exhibited excellent proton conductivity at 200 °C. Moreover, the present measurement of proton conductivity of the PIC membranes was based on in situ single-stack hydrogen PEMFC testing, and the PIC membranes were prepared using the low-cost solution-casting technique, which can be conveniently scaled up for low-cost, massive production of large-sized IT PEMs for industry.
Figure 8 shows the orthorhombic crystal structure of CUP (CeP5O14) that was determined and analyzed by X-ray diffraction (XRD) and related software package in our recent study [45]. Due to its condensation state of the phosphate state, the ultraphosphate crystal structure is more complex than common orthophosphates that are made up of isolated PO4 tetrahedra sharing corners with metal oxide polyhedra. The overall structure of the (P5O14)3− anion contains eight-membered conjugate rings, while the coordination state of all rare-earth cations in ultraphosphates is usually eight [26,63], in which five tetrahedral PO4 units are linked by sharing oxygen atoms and the pendant oxygen anion in each PO4 unit can easily form the hydrogen bond with one proton. Thus, protons bonded with the pendant oxygen anions can easily transport through the ultraphosphate crystal via Grotthuss mechanism, i.e., proton hopping, due to the short distance between two neighboring pendant oxygen anions in metal ultraphosphates, e.g., CUP. In addition, the main advantage of CUP is its ability to conduct protons at IT range of 100–400 °C with relatively low humidity, superior to the common LT PEMs like Nafion®, which require a high level of hydration and are operated effectively only below 100 °C. Unlike many other proton conductors where water molecules act as the primary proton carriers, i.e., the vehicle mechanism, CUP’s proton conductivity is not solely dependent on a high concentration of mobile water molecules. Instead, the proton transport is an intrinsic property of the solid-state material itself, involving the movement of protons within the phosphate framework [26]. This allows the material to be operated at temperatures where liquid water would evaporate, thus avoiding those water management problems commonly confronted in traditional low-temperature fuel cells. In the present PIC membrane, the CUP particles provide the primary proton conduction pathway, while the polymer provides mechanical stability and flexibility. In this context, even in a slightly humidified environment, the proton transport is still dominated by the solid-state Grotthuss mechanism in the CUP-PBI membrane, since virtually PBI is not proton conductive. Nevertheless, additional efforts are still desired to explore more in-depth understanding of the proton-transporting mechanisms in the present IT-PIC-PEMs.
Furthermore, in the present fuel cell test, the measured proton conductivity of the IT-PIC-PEMs grew with increasing time until it reached the plateau with the value as high as >0.105 S/cm. This observation shows that the fuel cell needed an interval of time to hydrate the PIC membrane by moisture in the system. As reported in the literature [53], the proton conductivity of PIC membranes is closely correlated to the water content in the membranes. To fully understand the fuel cell behavior, the impedance response was measured at different current densities and RH levels (controlled by backpressure), as shown in Figure 7C. The impedance behavior of the CUP_75% membrane samples varies with the current density. As expected, the change in the high-frequency real-axis intercepts corresponding to the membrane ohmic resistance is negligible. However, the diameters of the loops vary depending on the testing conditions. The activation loop decreases with increasing current density. At lower current densities, the activation losses are dominant compared to the ohmic and mass transport losses. At higher current densities, the activation kinetics improve, resulting in a decrease in the loop diameter. The loop diameter also changes with the change in the backpressure, which corresponds to the RH level of the system. Increasing the RH level results in the improved activation kinetics of the system, as evidenced by the decrease in the loop diameter. However, no significant changes were observed in the high-frequency real-axis intercepts.

3.4. Water Absorption of the CUP-PBI PIC PEMs

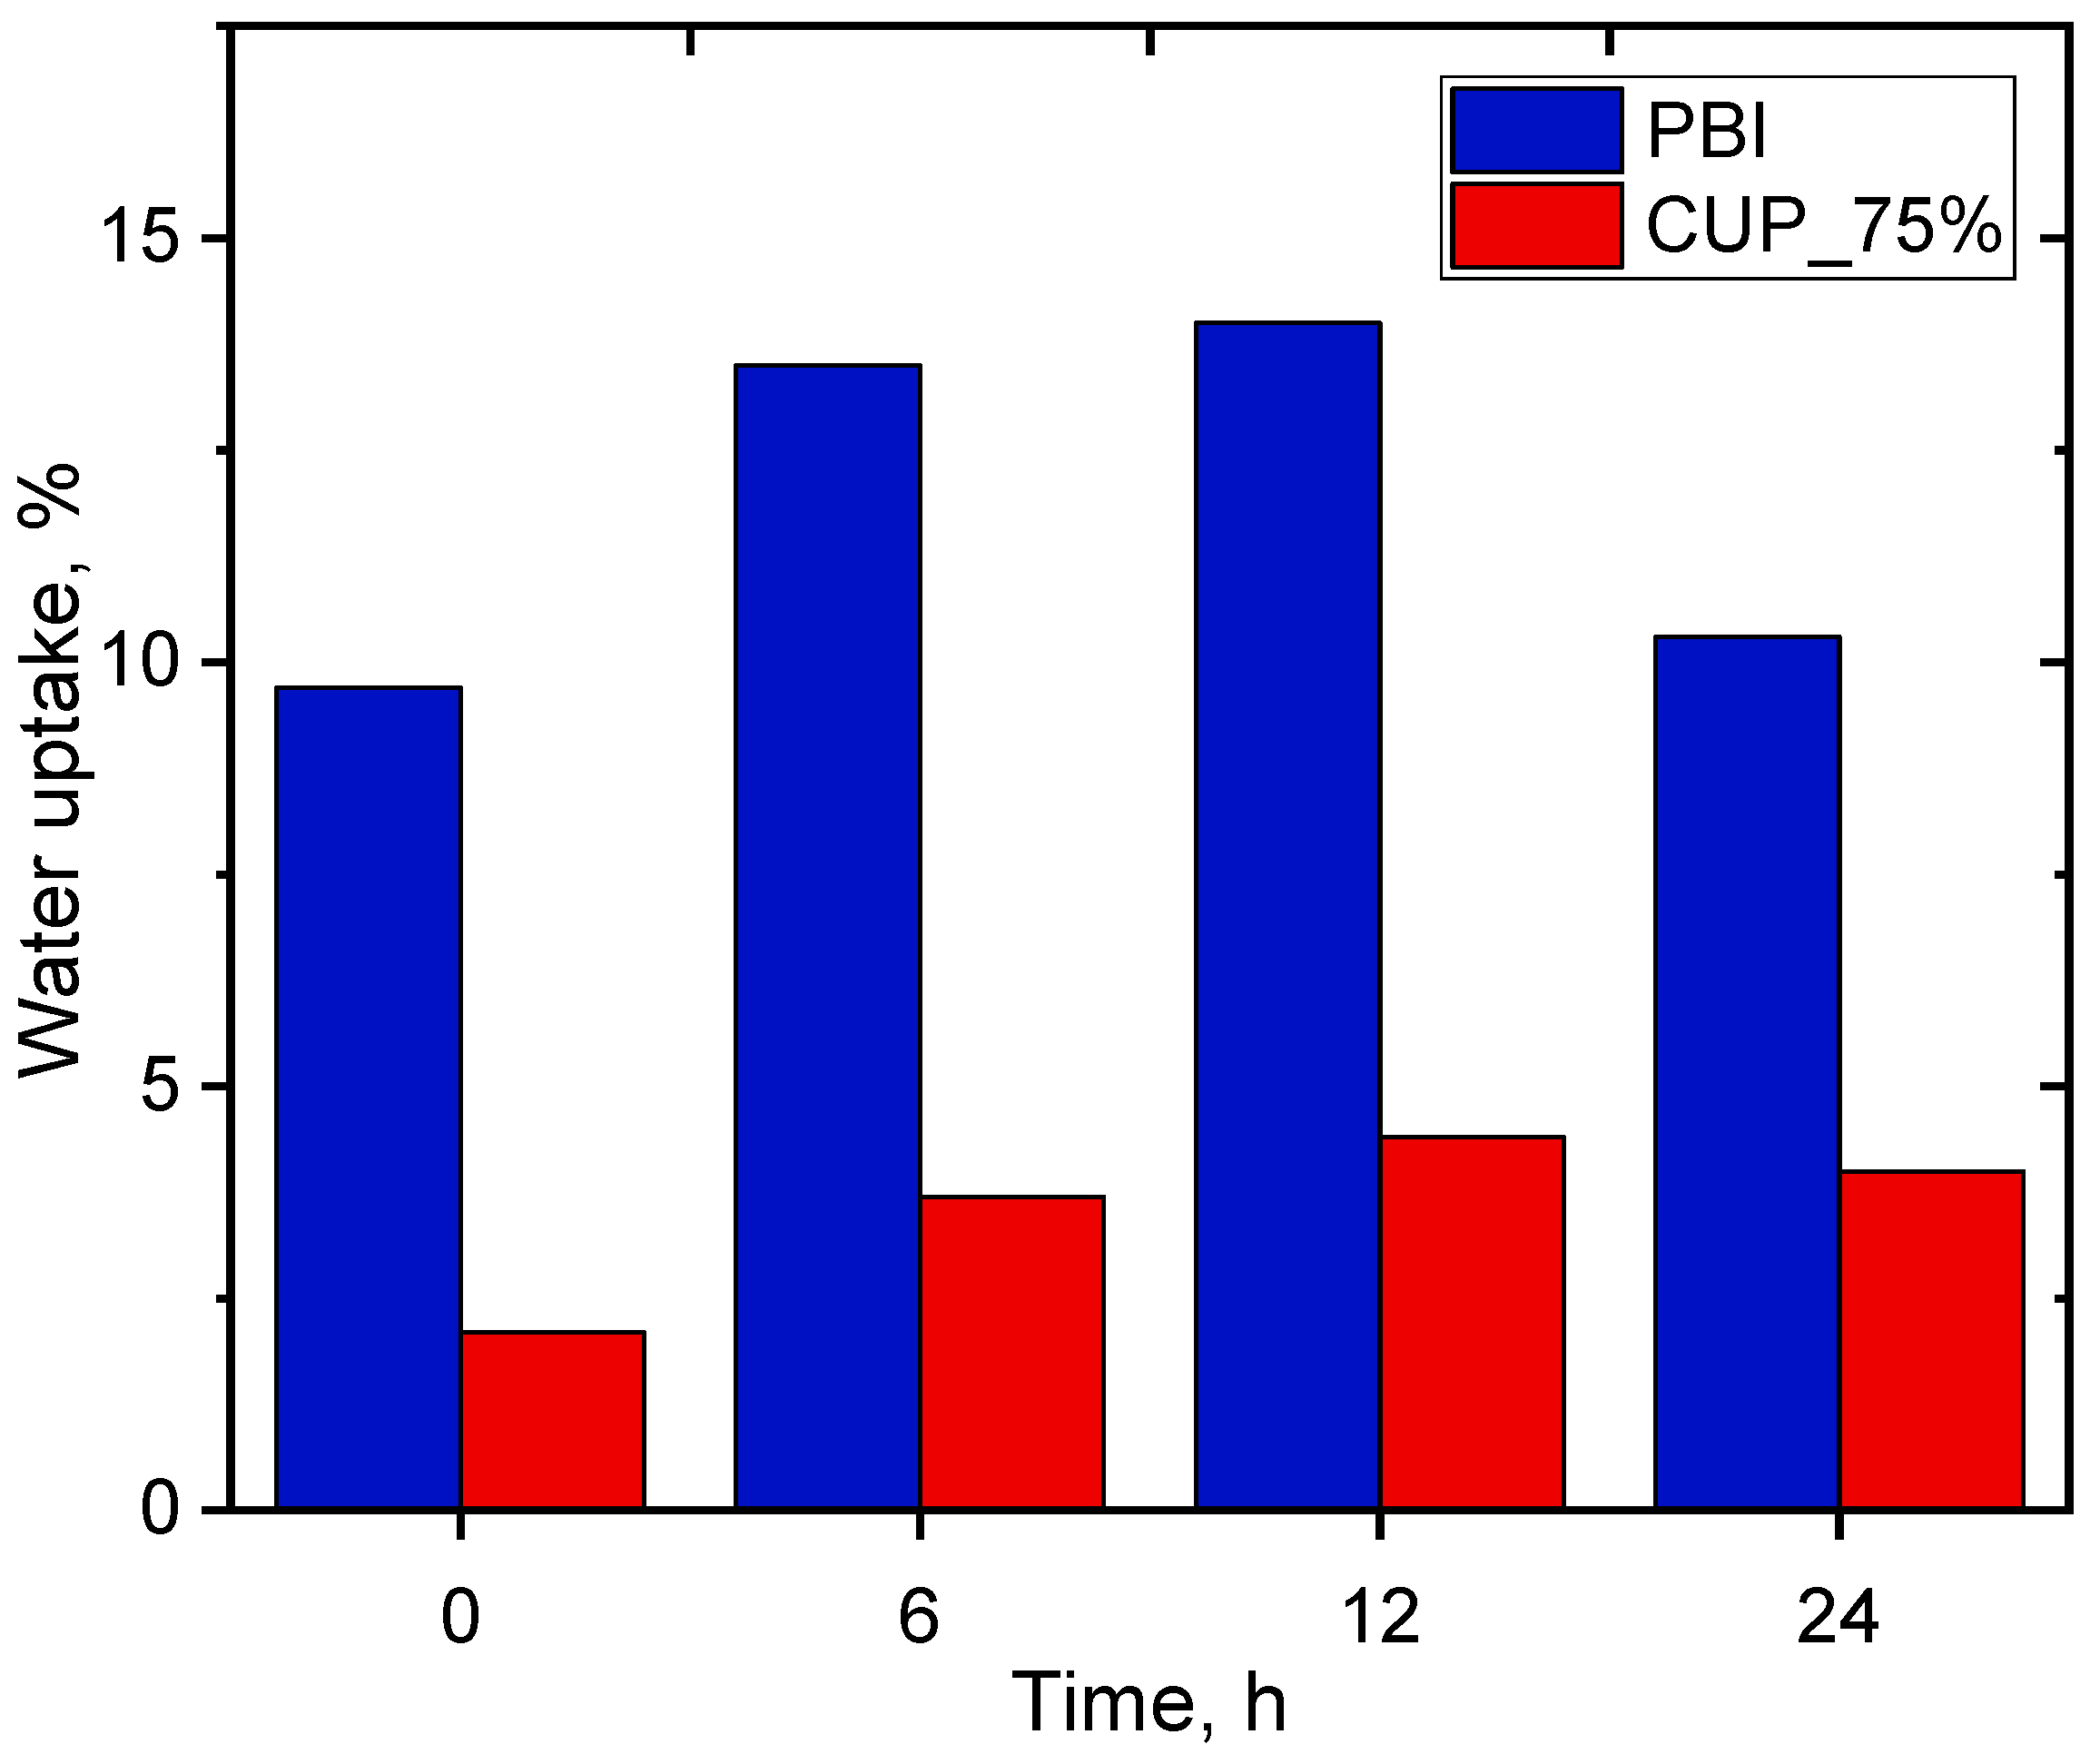
The water uptake levels of a typical PIC membrane (with CUP 75 wt.%) and pure PBI membrane were measured, as shown in Figure 9. As expected, the water uptake of the pure PBI membrane is higher than that of the PIC membrane. After 12 h of soaking the membrane samples in water, the water uptake of the pure PBI membrane was about 14 wt.%, while it was 4.4 wt.% for the PIC membrane. Such low water uptake of the PIC membrane can be responsible for the negligible change in the proton conductivity with varying RH level. However, increasing the water content in the system can improve the activation kinetics and the overall performance of the fuel cell.

3.5. Fuel Cell Performance Characterization

To evaluate the electrochemical performance of the IT-MEA developed in this study, the polarization curves were measured at varying membrane parameters and fuel cell operating conditions. Table 7 summarizes the typical polarization V-I curves of several IT-MEAs that were tested on the single-stack hydrogen fuel cell at 200 °C with humidified H2 and air. Below we examine the effects of the PIC membrane parameters and operating conditions on the fuel cell performance.

3.5.1. Membrane Thickness Effect

Recent studies demonstrated that PEM thickness can noticeably impact the fuel cell performance [64,65]. The thickness can affect the membrane polymer hydration and structure, thermal and mechanical stability, gas impermeability (gas crossover), and ion transport, among others. A thick membrane exhibits higher ionic (proton) resistance and, therefore, a lower value of proton conductivity. However, decreasing membrane thickness may negatively increase the hydrogen crossover rate and thus reduces the cell performance, e.g., the open circuit voltage (OCV).
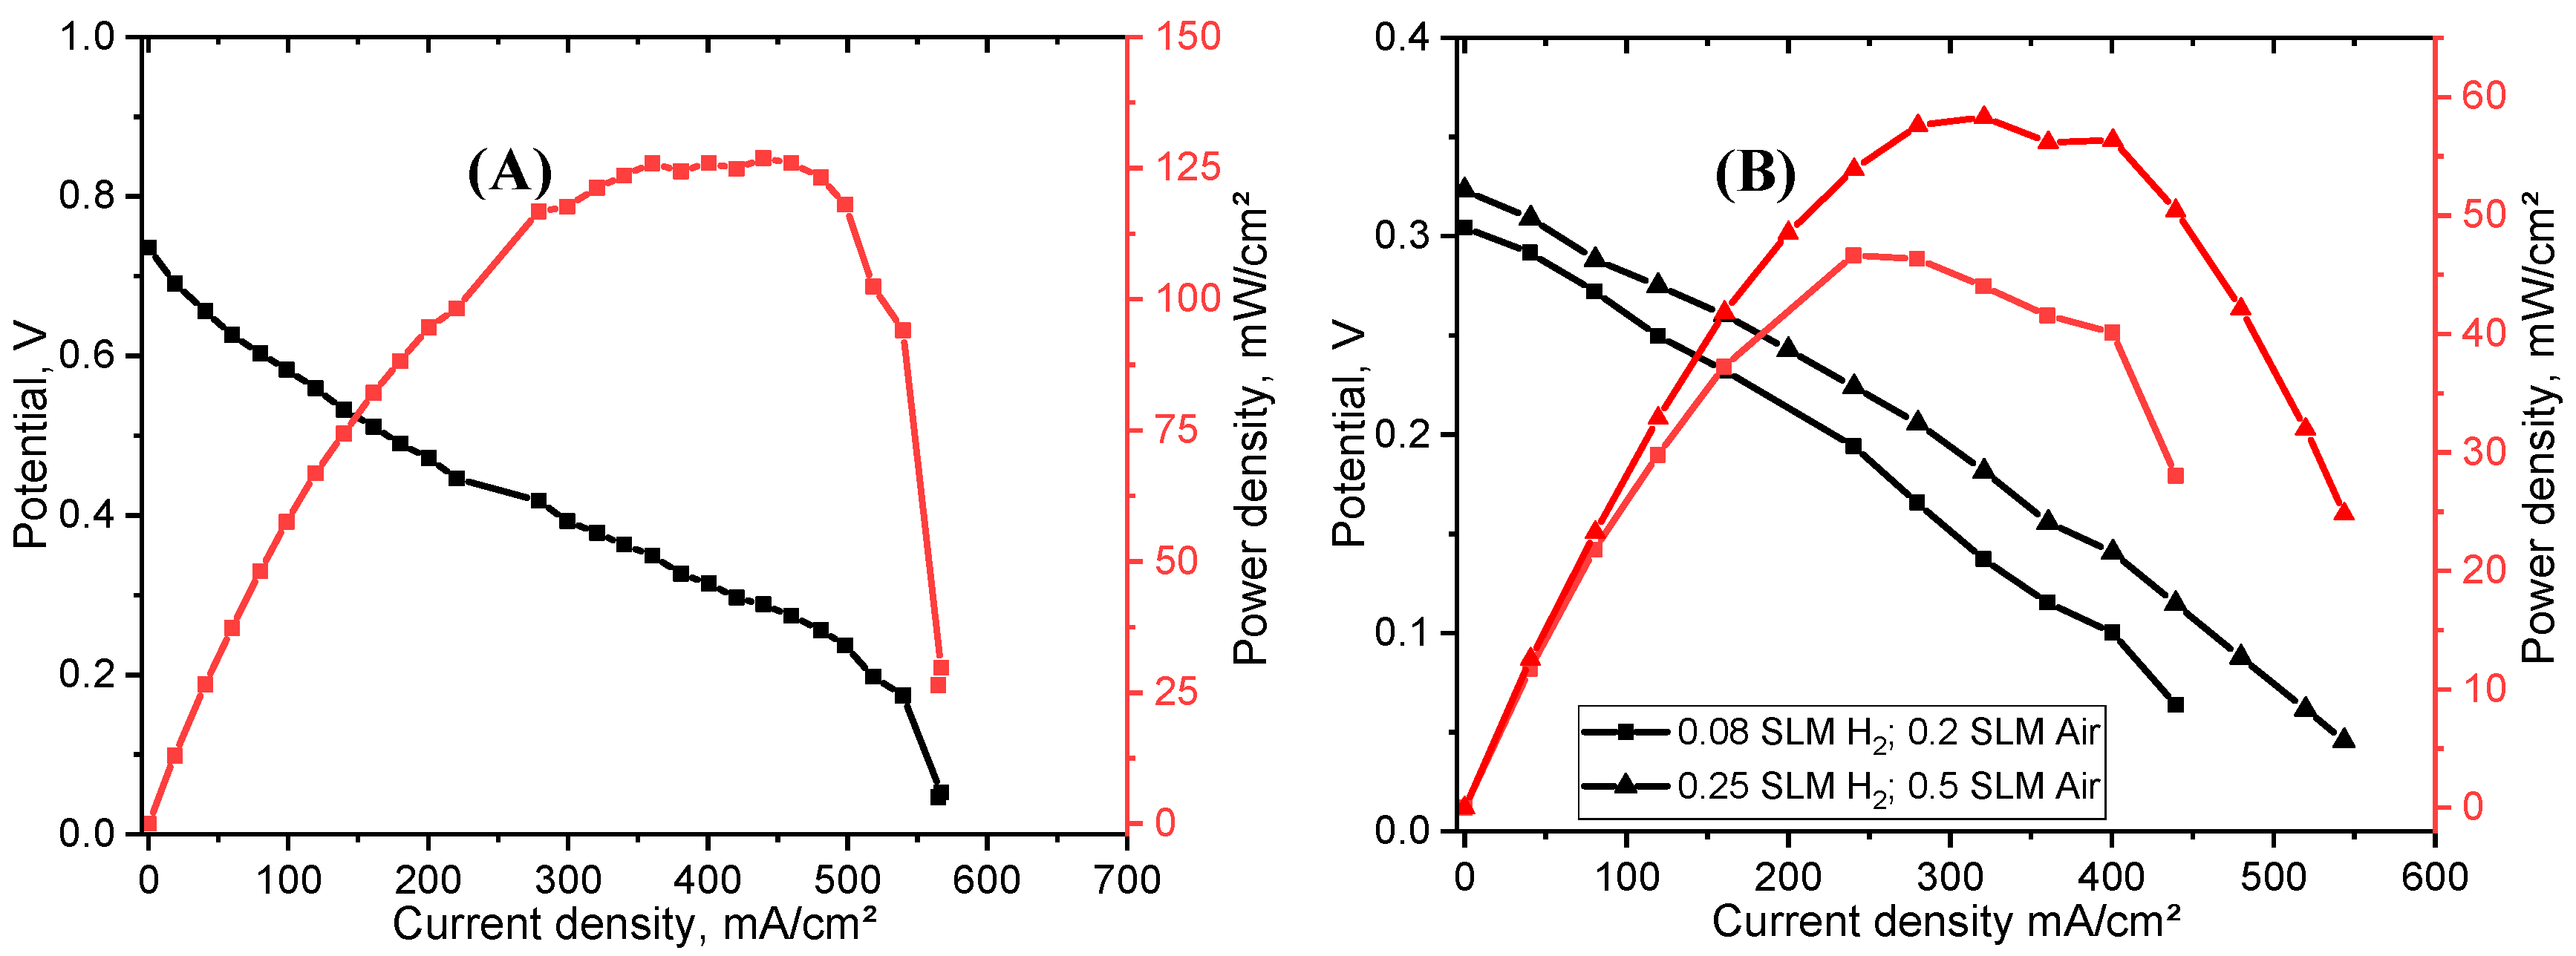
Figure 10A shows the fuel cell polarization (V-I) curve of a typical IT-MEA made of the PIC membrane with thickness of ~125 μm. Its maximum current density, peak power density, and OCV were measured as 566.8 mA/cm2, 126.9 mW/cm2, and 0.75 V, respectively. For the purpose of comparison, a thin PIC membrane with a thickness of 82 μm was also fabricated and assembled into an IT-MEA for electrochemical characterization on the single-stack fuel cell. The comparative results show that decreasing the membrane thickness down to 82 μm resulted in reduced ionic resistance. As observed in Table 2, the values of proton conductivity of the thinner PIC membranes are slightly lower than those of the thicker ones (with thickness of ~125–132 μm). However, such an effect is not significant. In addition, the electrochemical characterization results, as shown in Figure 10B, indicate a drastic decrease in OCV (0.33 V) and a decrease in power density (58.3 mW/cm2) due to the high hydrogen crossover rate and other possible side reactions in this thin PIC membrane (82 μm). In addition, reduced electrochemical performance and low OCV in the thin PIC membranes can also be induced by the large CUP particle size. Such observations were also confirmed by other experimental studies reported in the literature [66,67], where pure polymer membranes exhibited performance limitations due to thickness reduction. In addition, ultrathin membranes commonly display a severe performance degradation that can be overcome by properly increasing membrane thickness.

3.5.2. Effect of Spraying CUP Particles onto Membrane

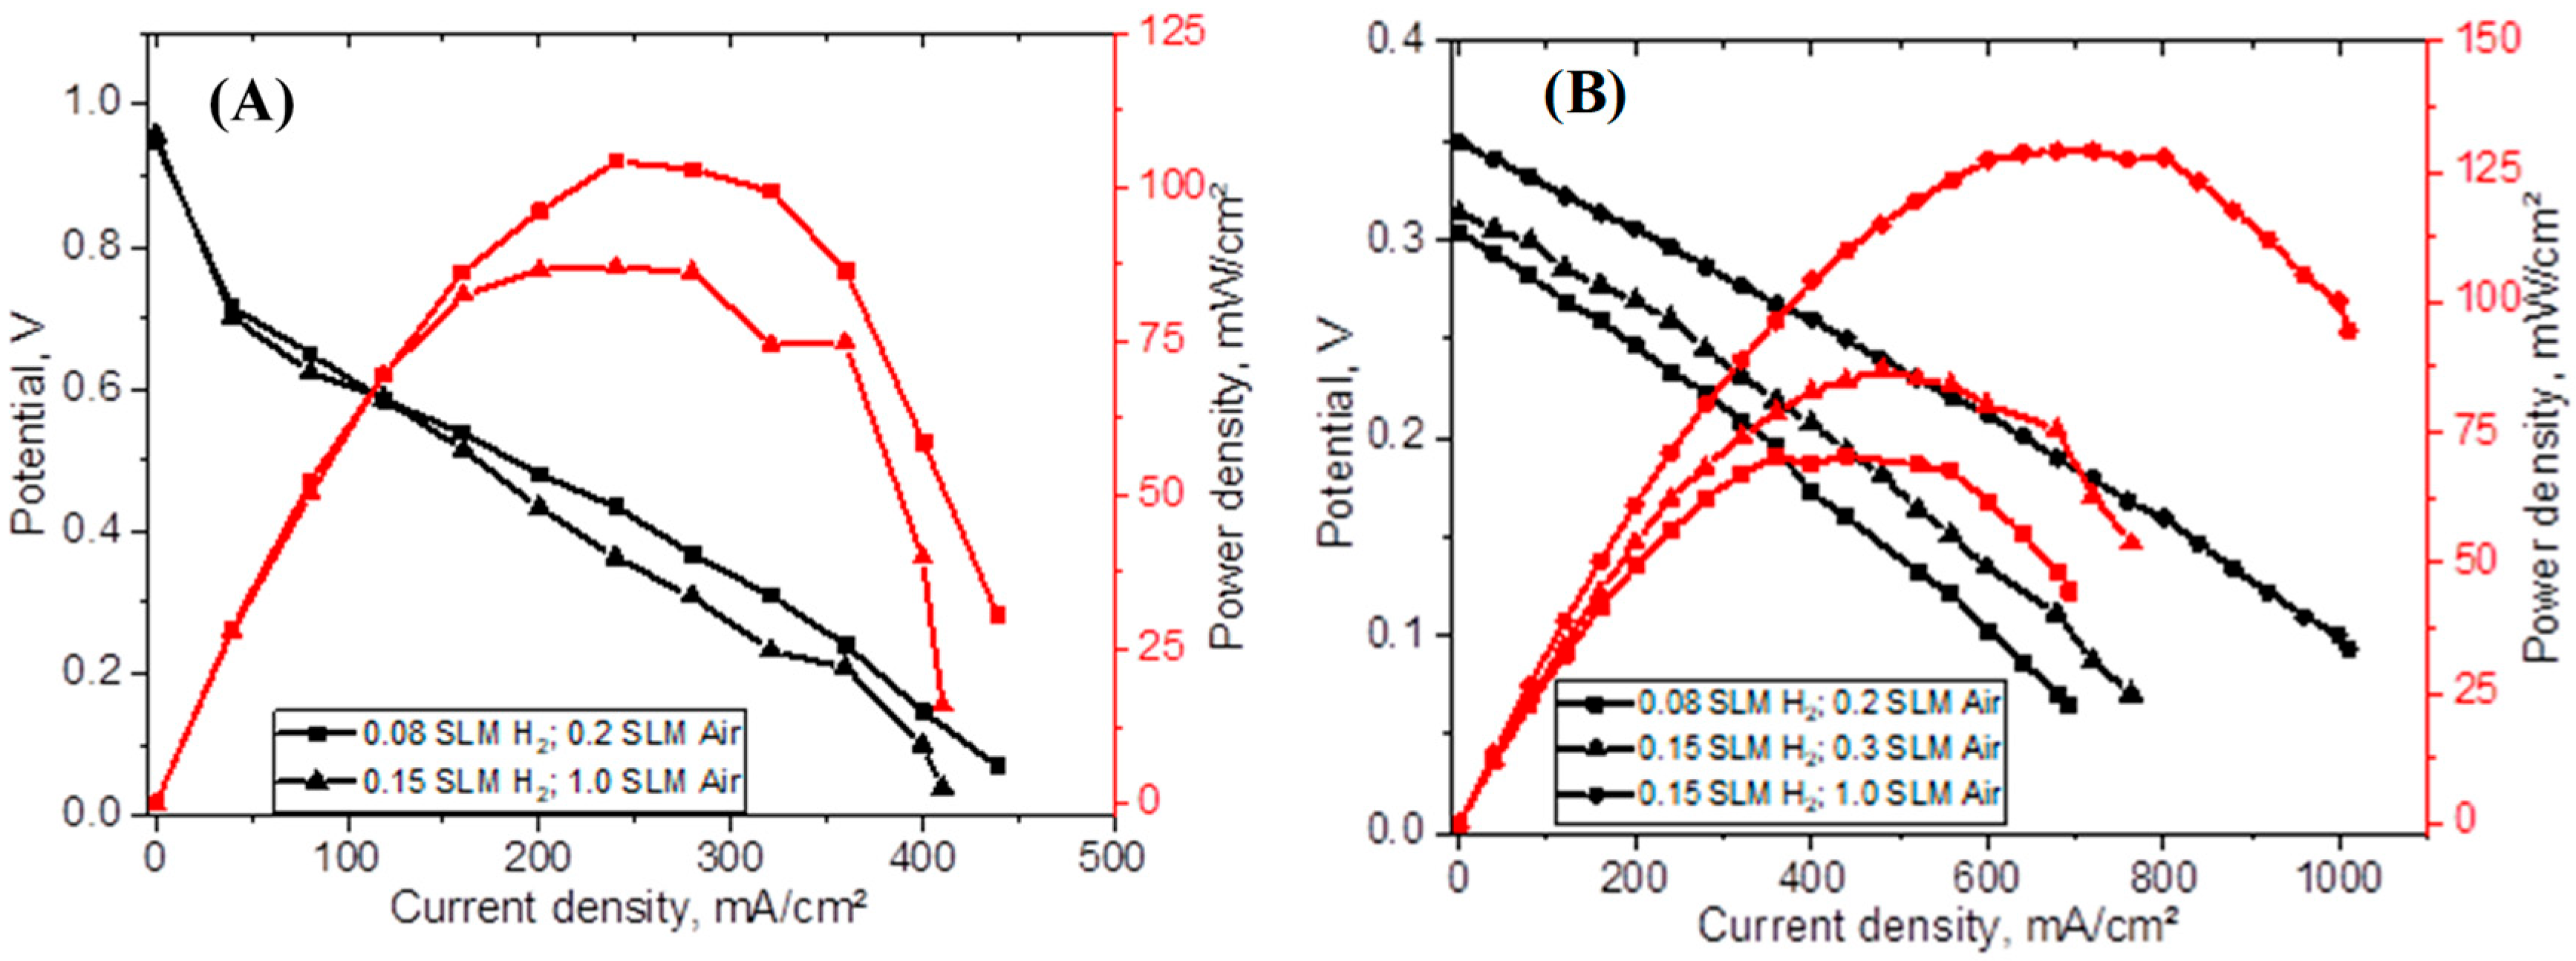
To improve the hydrogen impermeability and surface proton conductivity of a PIC membrane, surface reinforcement was applied via spraying a thin layer of CUP-rich PBI/DMAc solution at its two sides. The thickness of the sprayed CUP-PBI surface layer after drying was ~20 µm. Figure 11A shows the V-I diagram of the IT-MEA installed with a CUP_75%_sprayed PIC membrane and Pt-NP-coated GDEs with the thickness of 166 µm. The maximum current density and peak power density at the gas flow rates of 0.08 L/min for H2 and 0.2 L/min for air were 439.3 mA/cm2 and 104.2 mW/cm2, respectively. The corresponding overall OCV in this case was 0.96 V, close to the theoretical estimate of ~1.13 V, which demonstrates the low hydrogen crossover rate of the membrane with a large thickness. In addition, the IT-MEA performance abnormally decreased after increasing the reactant flow rates to 0.15 L/min for H2 and 1.0 L/min for air.
Furthermore, in the case of the reactant flow rates of 0.15 L/min for H2 and 1.0 L/min for air, an abnormal drop in the cell power density (P-I) diagram is observed at the current density between 300 and 400 mA/cm2, which could be caused by the data acquisition system affected by electronic noise relevant fluctuations, which are also found in other diagrams. In this case, the system voltage efficiency at 200 °C is
ε V = E c e l l E t h e o r = 0.96 1.13 = 0.85 .
The polarization diagrams also indicate that a thicker membrane is correlated to higher ohmic losses, which negatively influence the overall electrochemical performance of the fuel cell and are in agreement with the proton conductivity results as shown in Table 5.
Figure 11B shows the polarization (V-I) and power density (P-I) diagrams of an IT-MEA installed with a thin CUP_75%_sprayed_105 µm membrane that was sprayed with CUP-PBI particles at two sides and carried the membrane thickness of ~105 μm. The measurements show that this PIC membrane exhibited higher current densities. The maximum current density and peak power density at the reactant flow rates of 0.15 L/min for H2 and 1.0 L/min for air were 1010.1 mA/cm2 and 129.1 mW/cm2, respectively. Yet, the overall OCV of this IT-MEA was measured as only 0.35 V due to the high hydrogen crossover in this thinner PIC membrane integrated with 75 wt.% CUP particles. The present experimental observations indicate that additional research is desired to enhance the gas impermeability of the PIC membranes at high CUP mass fraction (75 wt.%) and low membrane thickness (<50 μm or less), which may lead to a type of commercially viable IT-PIC-PEM with high proton conductivity and gas impermeability, sufficient mechanical strength and integrity, and excellent thermal and oxidative stability.
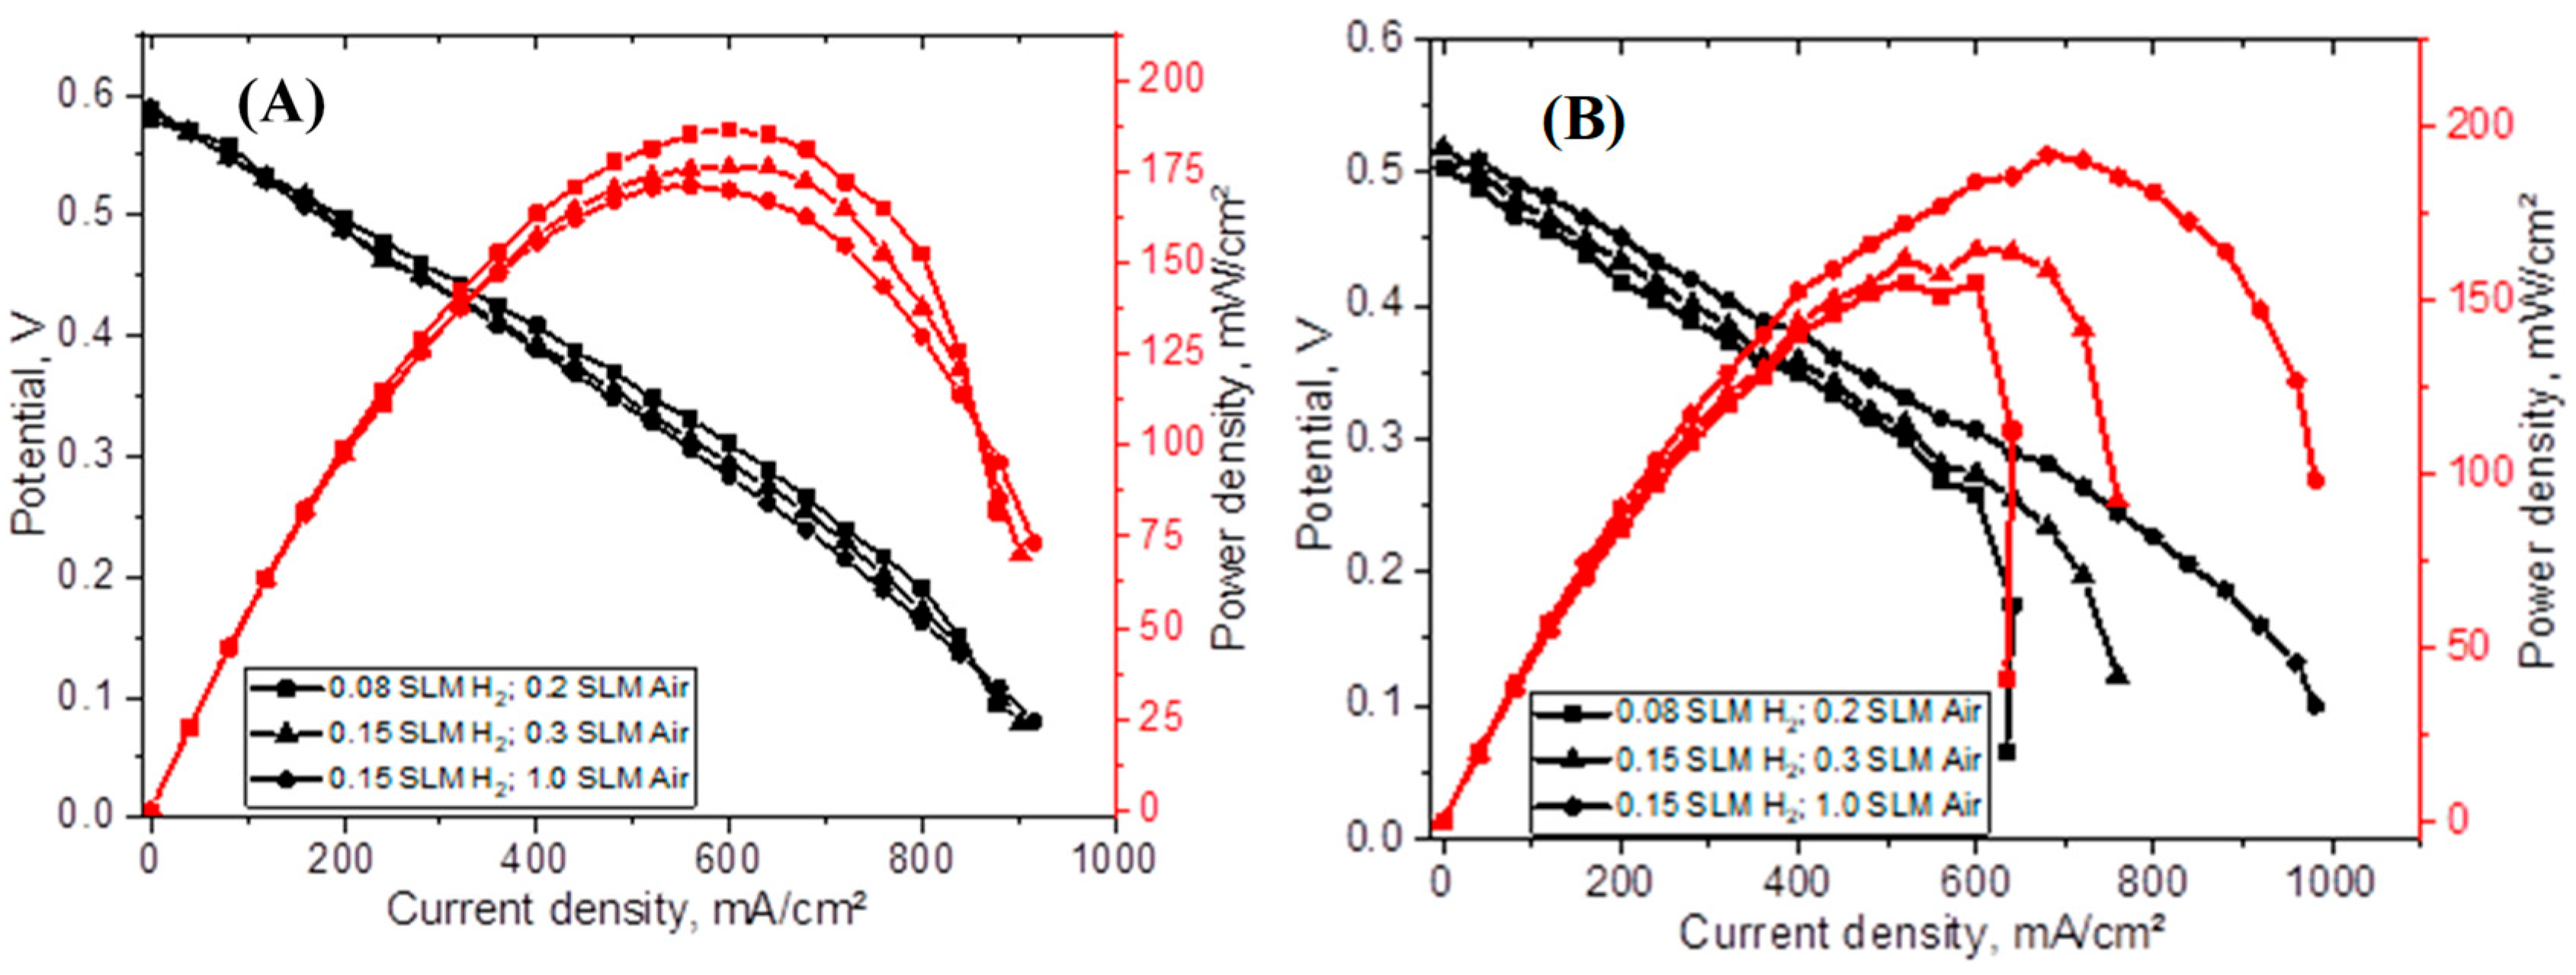
In the above figure, the fuel cell performance results show that high hydrogen crossover can be exerted due to the low membrane thickness and the large size of the CUP particles as the solid-state proton conductor. Thus, additional efforts can be made to further reduce the CUP particle size, which can improve the membrane microstructure, gas impermeability, and proton conductivity. One handy approach employed in this study was to finely grind the as-synthesized CUP powder for 2 h using mortar and pestle prior to the PIC membrane processing. This method can be further combined with the multi-grade sedimentation method to separate the ground CUP powder into large- and small-sized particle groups for the next step of finer grinding. In addition, the as-fabricated PIC membrane was sprayed at two sides with a thin layer of the finely ground CUP particles mixed with a small quantity of PBI/DMAc solution. The finely ground CUP particles were further utilized in GDE fabrication to form the effective three-phase catalyst layers. Figure 12A shows the polarization (V-I) and power density (P-I) diagrams of an IT-MEA installed with such a refined IT-PIC-PEM and tested at 200 °C.
Similarly, the polarization and power density diagrams of an IT-MEA installed with CUP_75%_spr_2h membrane and Pt-NP-loaded GDEs were obtained at three reactant flow rates: (a) 0.08 L/min for H2 and 0.2 L/min for air, (b) 0.15 L/min for H2 and 0.3 L/min for air, and (c) 0.15 L/min for H2 and 1.0 L/min for air, respectively. The overall thickness of the PIC membrane after spraying with CUP-rich/PBI particles at two sides is ~ 94 μm. The maximum current density, peak power density, and overall OCV of the IT-MEA in case (a) were 877.9 mA/cm2, 186.4 mW/cm2, and 0.58 V, respectively. After increasing the reactant flow rates as shown in cases (b) and (c), the maximum current density and OCV of the IT-MEA were slightly improved, while the peak power density was slightly decreased. In case (b), these performance values were 902.1 mA/cm2, 176.3 mW/cm2, and 0.59 V, and in case (c) were 915.9 mA/cm2, 171.1 mW/cm2, and 0.59 V. The decrease in the peak power can be related to the larger gas crossover with increasing reactant flow rates.
In the above, the fuel cell performance results were obtained using the IT-MEA installed with the PIC membrane and GDEs that were both fabricated with the finely ground CUP particles (grinding for 2 h). It was shown that size reduction in the CUP particles did obviously improve the electrochemical performance of the IT-MEA, e.g., the current and power densities and OCV compared to those of the IT-MEA made of a thin PIC membrane [Figure 7B]. In addition, CUP particles with reduced size can even benefit the electrochemical performance of an IT-MEA installed with a thin PIC membrane (~ 94 μm), compared to the one installed with the PIC membrane of relatively large CUP particles, as shown in Figure 6B. In principle, small-sized CUP particles can enhance the specific CUP surface area (at a fixed CUP wt.%) and thus improve the interaction between the proton conductor and the catalyst layers in GDEs, which benefits the efficient proton transport across the GDEs and ensures better reaction kinetics at the catalyst sites [34]. In addition, small-sized CUP particles can lead to better integration with the catalyst layer, improving the interaction between the catalyst particles and the proton-conducting particles, and thus enhancing the catalyst utilization.
Moreover, reduction in the catalyst load in fuel cells can favorably reduce the unit costs per fuel cell stack. In this study, effect of the GDE catalyst load, i.e., 1.0 mg/cm2 (See above) and 0.5 mg/cm2, was examined on the electrochemical performance of the present IT-MEAs. Figure 12B shows the fuel cell performance of the IT-MEA installed with a CUP_75%_2h_spr PIC membrane (thickness: ~95 μm, catalyst load: 0.5 mg/cm2 (Pt/C)). It is shown that the IT-MEA performance increased with increasing H2 and air flow rates to 0.15 and 1.0 L/min, respectively. The maximum current density, peak power density, and OCV were measured as 981.3 mA/cm2, 191.7 mW/cm2, and 0.51 V, respectively. The fuel cell performance results show that halving the Pt-catalyst load in the IT-MEAs did not noticeably influence the cell performance, which offers the technical opportunity to explore the effect and related mechanisms of catalyst load reduction in the fuel cell performance, a promising strategy to reduce the costs of IT fuel cell stacks.

4. Conclusions

A comprehensive experimental study was conducted to characterize the proton conductivity and electrochemical performance of novel IT-MEAs installed with acid-free PIC proton-conducting membranes developed in this study. These PIC membranes were made of CUP particles as the solid-state proton conductor and undoped HT PBI as the polymeric binder, which fundamentally overcome the technical disadvantages of acid-doped PBI membranes. The test results indicate that the mechanically flexible CUP-PBI PIC membranes (loaded with CUP of 75 wt.%) carried a reduced water uptake of 4.4 wt.% compared to pristine PBI membranes (14.0 wt.%). The reduced water uptake can benefit less membrane swelling during the fuel cell cycling. In addition, the PIC membranes carried high proton conductivity of up to 0.105 S/cm, which was measured at RH 47% and 200 °C. In addition, the PIC membrane performance exhibited dependence upon the membrane thickness, process parameters, fuel cell operating conditions, etc.
The present experimental results also indicated that increasing reactant flow rates benefit the IT-MEA performance, while reducing membrane thickness drastically decreased the overall OCV of the IT-MEA due to the high hydrogen crossover and other side reactions. As a handy technical approach, spraying a thin layer of the mixture of the fine CUP particles and a small amount of PBI at both sides of the PIC membranes can noticeably enhance the overall cell OCV of up to 0.95V and resulted in the voltage efficiency of 0.85. Furthermore, reduction in the CUP particle size in the PIC membranes can improve the cell performance with the maximum power density of 191.7 mW/cm2, which prospects a great opportunity to adopt nanostructured CUP particles to further enhance the IT-MEA performance while suppressing the hydrogen crossover rate of the PIC membranes. The present single-stack hydrogen fuel cell tests also indicated that reduction in the Pt-catalyst load from 1.0 to 0.5 mg/cm2 did not noticeably influence the IT-MEA performance at 200 °C. Therefore, the present experimental study predicts the promising future of IT-PIC-PEMs for broad applications in IT electrochemical energy conversion and chemical production, e.g., IT hydrogen and direct liquid PEMFCs, steam electrolyzers, electrolytic CO2 capture, low-pressure electrolytic ammonia production, etc.

Author Contributions

X.-F.W. conceived and monitored the research. X.-F.W., O.Z. and X.Q. secured the funding. O.Z. conducted the experimental investigation and analyzed the data. O.Z., X.-F.W., A.S., M.M.A. and X.Q. participated in analysis of the data and experimental processes. O.Z. and X.-F.W. wrote and revised the paper. All authors have read and agreed to the published version of the manuscript.

Funding

The research work was partially supported by the National Center for Manufacturing Sciences (Grant No.: NCMS-CTMA 142060); the United States Department of Energy (Grant No.: DE-EE0008324); North Dakota State University Development Foundation (Grants No.: 46000-2490-FAR0031220 and 46000-2490-FAR0035860). Muhammad M. Ashfaq’s and Abdul Salam’s stay as PhD students at NDSU is sponsored by the US-Pakistan Knowledge Corridor Scholarship.

Data Availability Statement

The original contributions presented in this study are included in the article. Further inquiries can be directed to the corresponding author.

Acknowledgments

The financial support of this research by the National Center for Manufacturing Sciences (NCMS) (Award No.: NCMS-CTMA 142060) with John Keippala as the project manager and Theodore Burye as the government representative of the United States Army Combat Capabilities Development Command (DEVCOM) Ground Vehicle Systems Center (GVSC) is gratefully acknowledged. The initial study of the research was also financially supported in part by the Office of Energy Efficiency and Renewable Energy (EERE) of the U.S. Department of Energy under the Advanced Manufacturing Office (Award No.: DE-EE0008324) and the NDSU Development Foundation (Award No.: FAR0031220, FAR0035860). Muhammad M. Ashfaq’s and Abdul Salam’s stay as PhD students at NDSU is sponsored by the US-Pakistan Knowledge Corridor Scholarship. The views and opinions of the authors expressed herein do not necessarily state or reflect those of the United States Government, NCMS, EERC, or any agency thereof.

Conflicts of Interest

The authors declare no conflicts of interest.

References

  1. Winter, M.; Brodd, R.J. What are batteries, fuel cells, and supercapacitors. Chem. Rev. 2004, 104, 4245–4269. [Google Scholar] [CrossRef]
  2. Singla, M.K.; Nijhawan, P.; Oberoi, A.S. Hydrogen fuel and fuel cell technology for cleaner future: A review. Environ. Sci. Pollut. Res. 2021, 28, 15607–15626. [Google Scholar] [CrossRef] [PubMed]
  3. Jiang, S.P.; Li, Q. Introduction to Fuel Cells: Electrochemistry and Materials; Springer: New York, NY, USA, 2022. [Google Scholar]
  4. Zeis, R.; Beilstein, J. Materials and characterization techniques for high-temperature polymer electrolyte membrane fuel cells. Nanotechnology 2015, 6, 68–83. [Google Scholar] [CrossRef]
  5. Haider, R.; Wen, Y.; Ma, Z.F.; Wilkinson, D.P.; Zhang, L.; Yuan, X.; Song, S.; Zhang, J. High temperature proton exchange membrane fuel cells: Progress in advanced materials and key technologies. Chem. Soc. Rev. 2021, 50, 1138–1187. [Google Scholar] [CrossRef]
  6. Ying, J.; Liu, T.; Wang, Y.; Guo, M.; Shen, Q.; Lin, Y.; Yu, J.; Yu, Z. Perspectives on membrane development for high temperature proton exchange membrane fuel cells. Energy Fuels 2024, 38, 6613–6643. [Google Scholar] [CrossRef]
  7. Brett, D.J.L.; Atkinson, A.; Brandon, N.P.; Skinner, S.J. Intermediate temperature solid oxide fuel cells. Chem. Soc. Rev. 2008, 37, 1568–1578. [Google Scholar] [CrossRef]
  8. Sun, W.; Sahin, N.E.; Sun, D.; Wu, X.; Munoz, C.; Thakare, J.; Aulich, T.; Zhang, J.; Hou, X.; Oncel, N.; et al. One-pot synthesis of ruthenium-based nanocatalyst using reduced graphene oxide as matrix for electrochemical synthesis of ammonia. ACS Appl. Mater. Interfaces 2022, 15, 115–1128. [Google Scholar] [CrossRef]
  9. Kilner, J.A.; Burriel, M. Materials for intermediate-temperature solid-oxide fuel cells. Annu. Rev. Mater. Res. 2014, 44, 365–393. [Google Scholar] [CrossRef]
  10. Steininger, H.; Schuster, M.; Kreuer, K.D.; Kaltbeitzel, A.; Bingöl, B.; Meyer, W.H.; Schauff, S.; Brunklaus, G.; Spiess, H.W. Intermediate temperature proton conductor for PEM fuel cells based phosphoric acid as protogenic group: A progress report. Phys. Chem. Chem. Phys. 2007, 9, 1764–1773. [Google Scholar] [CrossRef]
  11. Li, Q.; Jensen, J.Q.; Savinell, R.F.; Bjerrum, N.J. High temperature proton exchange membranes based on polybenzimidazoles for fuel cells. Prog. Polym. Sci. 2009, 34, 449–477. [Google Scholar] [CrossRef]
  12. Authayanun, S.; Im-orb, K.; Arpornwichanop, A. A review of the development of high temperature proton exchange membrane fuel cells. Chin. J. Catal. 2015, 36, 473–483. [Google Scholar] [CrossRef]
  13. Li, Q.; Aili, D.; Hjuler, H.A.; Jensen, J.O. High Temperature Polymer Electroltye Membrane Fuel Cells: Approaches, Status, and Perspectives; Springer: Berlin/Heidelberg, Germany, 2016. [Google Scholar]
  14. Zhou, Z.; Zholobko, O.; Wu, X.F.; Aulich, T.; Thakare, J.; Hurley, J. Polybenzimidazole-based polymer electrolyte membranes for high-temperature fuel cells: Current status and prospects. Energies 2021, 14, 135. [Google Scholar] [CrossRef]
  15. Scott, K.; Xu, C.; Wu, X. Intermediate temeprature proton-exchange memrbane electrolyte for fuel cells. WIREs Energy Environ. 2014, 3, 24–41. [Google Scholar] [CrossRef]
  16. Xiao, T.; Wang, R.; Chang, Z.; Fang, Z.; Zhu, Z.; Xu, C. Electrolyte membranes for intermediate temeprature proton exchange membrane fuel cell. Prog. Nat. Sci. Mater. Int. 2020, 30, 743–750. [Google Scholar] [CrossRef]
  17. Hibino, R.T. Intermediate-tempeature proton conductors and their applications to energy and environmental devices. J. Ceram. Soc. Jpn. 2011, 119, 677–686. [Google Scholar] [CrossRef]
  18. Jin, Y.; Shen, Y.; Hibino, T. Proton conduction in metal pyrophospates (MP2O7) at intermediate tempeatures. J. Mater. Chem. 2010, 20, 6214–6217. [Google Scholar] [CrossRef]
  19. Steele, B.C.H.; Heinzel, A. Materials for fuel-cell technologies. Nature 2001, 414, 345–352. [Google Scholar] [CrossRef]
  20. Mo, S.; Du, L.; Huang, Z.; Chen, J.; Zhou, Y.; Wu, P.; Meng, L.; Wang, N.; Xing, L.; Zhao, M.; et al. Recent advances on PEM fuel cells: From key materials to membrane electrode assembly. Electrochem. Energy Rev. 2023, 6, 28. [Google Scholar] [CrossRef]
  21. Wang, Y.; Diaz, D.F.R.; Chen, K.S.; Wang, Z.; Adroher, X.C. Materials, technological status, and fundamentals of PEM fuel cells—A review. Mater. Today 2020, 32, 178–203. [Google Scholar] [CrossRef]
  22. Wang, M.; Su, C.; Zhu, Z.; Wang, H.; Ge, L. Composite cathodes for protonic ceramic fuel cells: Ratinales and materials. Compos. Part B Eng. 2022, 238, 109881. [Google Scholar] [CrossRef]
  23. Büchi, F.N.; Inaba, M.; Schimidt, J.J. Polymer Electrolyte Fuel Cell Durability; Springer: New York, NY, USA, 2009. [Google Scholar]
  24. Lin, K.; Wang, C.; Qiu, Z.; Yan, Y. Enhancement of proton conductivity performance in high temperature polymer electrolyte membrane, processed the adding of pyridobismidazole. Polymers 2022, 14, 1283. [Google Scholar] [CrossRef] [PubMed]
  25. Anfimova, T. Metal Phosphates as Proton Conducting Materials for Intermediate Temperature Fuel Cell and Electrolyser Applications. Ph.D. Thesis, Technical University of Denmark, Copenhaken, Denmark, 2014. [Google Scholar]
  26. Salam, A.; Zholobko, O.; Wu, X.F. Roles of functionalized nanoparticles in the performance improvement of proton-exchange membranes used in low- and intermediate-temperature hydrogen fuel cells: A review. Prog. Nat. Sci. Mater. Int. 2024, 34, 437–453. [Google Scholar] [CrossRef]
  27. Le, M.V.; Tsai, D.S.; Yang, C.Y.; Chung, W.H.; Lee, H.Y. Proton conductors of cerium pyrophosphate for intermeidate temperature fuel cell. Electrochim. Acta 2011, 56, 6654–6660. [Google Scholar] [CrossRef]
  28. Zhou, F.; Liu, Y.; Zhao, X.; Tang, W.; Yang, S.; Zhong, S.; Wei, M. Effects of cerium doping on the performance of LSCF cathodes for intermediate temperature solid oxide fuel cells. Int. J. Hydrogen Energy 2018, 43, 18946–18954. [Google Scholar] [CrossRef]
  29. Shirbhate, S.C.; Singh, K.; Acharya, S.A.; Yadav, A.K. Review on local structural properties of ceria-based electrlytes for IT-SOFC. Ionics 2017, 23, 1049–1057. [Google Scholar] [CrossRef]
  30. Bhabu, K.A.; Theerthagiri, J.; Madhavan, J.; Balu, T.; Rajasekaran, T.R. Superior oxide ion conductivity of novel acceptor doped cerium oxide electrolytes for intermediate-temperature solid oxide fuel cell applications. J. Phys. Chem. C 2016, 120, 18452–18461. [Google Scholar] [CrossRef]
  31. Huang, J.; Mao, Z.; Liu, Z.; Wang, C. Development of novel low-telperature SOFCs co-ionic conducting SDC-carbonate composite elecrolytes. Electrochem. Commun. 2007, 9, 2601–2605. [Google Scholar] [CrossRef]
  32. Gao, Z.; Mogni, L.V.; Miller, E.C.; Railsback, J.G.; Barnett, S.A. A perspective on low-temperature solid oxide fuel cells. Energy Environ. Sci. 2016, 9, 1602. [Google Scholar] [CrossRef]
  33. Zhang, J.; Lenser, C.; Menzler, N.H.; Guillon, O. Comparison of solid oxide fuel cell (SOFC) electrolyte materials for operation at 500 °C. Solid State Ionics 2020, 344, 115138. [Google Scholar] [CrossRef]
  34. Zhang, W.; Hu, Y.H. Progress in proton-conducting oxides as electrolytes for low-temperature solid oxide fuel cells: From materials to devices. Energy Sci. Eng. 2021, 9, 984–1011. [Google Scholar] [CrossRef]
  35. Ahmed, S.; Kazmi, W.W.; Hussain, A.; Khan, M.Z.; Bibi, S.; Saleem, M.; Song, R.H.; Sajid, Z.; Ullah, A.; Khan, M.K. Facile and low-temperature synthesis approach to fabricate Sm0.5Sr0.5CoO3-δ cathode material for solid oxide fuel cell. J. Korean Ceram. Soc. 2023, 60, 272–282. [Google Scholar] [CrossRef]
  36. Gao, J.; Liu, Z.; Akbar, M.; Gao, C.; Dong, W.; Meng, Y.; Jin, X.; Xia, C.; Wang, B.; Zhu, B.; et al. Efficiently enhance the proton conductivity of YSZ-based electrolyte for low temperature solid oxide fuel cell. Ceram. Int. 2023, 49, 5637–5645. [Google Scholar] [CrossRef]
  37. Desta, H.G.; Gebreslassie, G.; Zhang, J.; Lin, B.; Zheng, Y.; Zhang, J. Enhancing performance of low-tempeature solid oxide fuel cell cathodes through surface engineering. Prog. Mater. Sci. 2025, 147, 101353. [Google Scholar] [CrossRef]
  38. Younis; Chu, D.; Li, D.S. Cerium oxide nanostructures and their applications. In Functionalized Nanomaterials; Farrukh, M.A., Ed.; InTech: Rijeka, Croatia, 2016; pp. 53–68. [Google Scholar]
  39. Trovarelli, A.; Fornasiero, P. Catalysis by Ceria and Related Mateials, 2nd ed.; Imperial College Press: London, UK, 2013. [Google Scholar]
  40. Scire, S.; Palmisano, L. Cerium oxide (CeO2): Synthesis, Properties and Applications (Metal Oxides), 1st ed.; Elsevier: New York, NY, USA, 2019. [Google Scholar]
  41. Das, S.; Bhaskar, R.; Narayanan, K.B. Multifunctional applications of gadolinium-doped cerium oxide (Ce1–xGdxO2–) ceramics: A review. J. Rare Earth 2024, 42, 1817–1834. [Google Scholar] [CrossRef]
  42. Shirpour, M.; Gregori, G.; Merkle, R.; Maier, J. On the proton conductivity in pure and gadolinium doped nanocrystalline cerium oxide. Phys. Chem. Chem. Phys. 2011, 13, 937–940. [Google Scholar] [CrossRef] [PubMed]
  43. Gregori, G.; Shirpour, M.; Maier, J. Proton conduction in dense and porous nanocrystalline ceria thin films. Adv. Funct. Mater. 2013, 23, 5861–5867. [Google Scholar] [CrossRef]
  44. Escorihuela, J.; Olvera-Mancilla, J.; Alexandrova, L.; del Castillo, L.F.; Compañ, V. Recent progress in the development of composite membranes based on polybenzimidazole for high temperature proton exchange membrane (PEM) fuel cell applications. Polymers 2020, 12, 1861. [Google Scholar] [CrossRef]
  45. Zholobko, O.; Hurley, J.; Wu, X.F.; Aulich, T.; Thakare, J. Intermediate-temperature proton exchange membranes based on cerium ultraphosphate composited with polybenzimidazole. J. Electrochem. Soc. 2022, 169, 94505. [Google Scholar] [CrossRef]
  46. Aulich, T.R.; Thakare, J.; Hurey, J.; Wu, X.; Zhou, Z.; Zholobko, O. Proton-Exchange Membrane. U.S. Patent No. 1190582, 19 February 2024. [Google Scholar]
  47. Cheng, Y.; Zhang, J.; Lu, S.; Kuang, H.; Bradley, J.; De Marco, R.; Aili, D.; Li, Q.; Cui, C.Q.; Jiang, S.P. High CO tolerance of new SiO2 doped phosphoric acid/polybenzimidazole polymer electrolyte membrane fuel cells at high temperatures of 200–250 °C. Int. J. Hydrogen Energy 2018, 43, 22487–22499. [Google Scholar] [CrossRef]
  48. Zhang, J.; Aili, D.; Lu, S.; Li, Q.; Jiang, S.P. Advancement toward polymer electrolyte membrane fuel cells at elevated temperatures. Research (AAAS SPJ) 2020, 2020, 9089405. [Google Scholar] [CrossRef]
  49. Cong, S.; Wang, J.; Wang, Z.; Liu, X. Polybenzimidazole (PBI) and benzimidazole-linked polymer (BILP) membranes. Green Chem. Eng. 2021, 2, 44–56. [Google Scholar] [CrossRef]
  50. Tang, H.; Geng, K.; Aili, D.; Ju, Q.; Pan, J.; Chao, G.; Yin, X.; Guo, X.; Li, Q.; Li, N. Low Pt loading for high-performance fuel cell electrodes enabled by hydrogen-bonding microporous polymer binders. Nat Commun. 2022, 13, 7577. [Google Scholar] [CrossRef] [PubMed]
  51. Zucconi, A.; Hack, J.; Stocker, R.; Suter, T.A.M.; Rettie, A.J.E.; Brett, D.J.L. Challenges and opportunities for characterisation of high-temperature polymer electrolyte membrane fuel cells: A review. J. Mater. Chem. A 2024, 12, 8014–8064. [Google Scholar] [CrossRef]
  52. Zholobko, O.; Wu, X.F.; Zhou, Z.; Aulich, T.; Thakare, J.; Hurley, J. A comparativev experimental study of the hydroscopic and mechanical behaviors of electrospun membranes and solution-cast films of polybenzimidazole. J. Appl. Polym. Sci. 2020, 137, 49639. [Google Scholar] [CrossRef]
  53. Yan, X.; Hou, M.; Sun, L.; Liang, D.; Shen, Q.; Xu, H.; Ming, P.; Yi, B. AC impedance characteristics of a 2 kW PEM fuel cell stack under different operating conditions and load changes. Int. J. Hydrogen Energy 2007, 32, 4358–4364. [Google Scholar] [CrossRef]
  54. Park, K.T.; Jung, U.H.; Choi, D.W.; Chun, K.; Lee, H.M.; Kim, S.H. ZrO2–SiO2/Nafion® composite membrane for polymer electrolyte membrane fuel cells operation at high temperature and low humidity. J. Power Sources 2008, 177, 247–253. [Google Scholar] [CrossRef]
  55. Kawahara, M.; Rikukawa, M.; Sanui, K. Relationship between absorbed water and proton conductivity in sulfopropylated poly(benzimidazole). Polym. Adv. Technol. 2000, 11, 544–547. [Google Scholar] [CrossRef]
  56. He, R.; Li, Q.; Xiao, G.; Bjerrum, N.J. Proton conductivity of phosphoric acid doped polybenzimidazole and its composites with inorganic proton conductors. J. Membr. Sci. 2003, 226, 169–184. [Google Scholar] [CrossRef]
  57. Baranov, A.I.; Khiznichenko, V.P.; Sandler, V.A.; Shuvalov, L.A. Frequency dielectric dispersion in the ferroelectric and superionic phases of CsH2PO4. Ferroelectrics 1988, 81, 183–186. [Google Scholar] [CrossRef]
  58. Louie, M.W.C. Electrocatalysis in Solid Acid Fuel Cells. Ph.D. Thesis, California Institute of Technology, Pasadena, CA, USA, 2011. [Google Scholar]
  59. Colomban, P.; Novak, A. Proton conductors: Classification and conductivity. In Proton Conductors: Solids, Membranes and Gels—Materials and Devices; Colomban, P., Ed.; Cambridge University: Cambridge, UK, 1992. [Google Scholar]
  60. Nagao, M.; Kamiya, T.; Heo, P.; Tomita, A.; Hibino, T.; Sano, M. Proton conduction in In3+-doped SnP2O7 at intermediate temperatures. J. Electrochem. Soc. 2006, 153, A1604–A1609. [Google Scholar] [CrossRef]
  61. Heo, P.; Nagao, M.; Kamiya, T.; Sano, M.; Tomita, A.; Hibino, T. Sn0.9 In0.1P2O7-based organic/inorganic composite membranes. J. Electrochem. Soc. 2007, 154, B63–B67. [Google Scholar] [CrossRef]
  62. Sun, X.; Wang, S.; Wang, Z.; Ye, X.; Wen, T.; Huang, F. Proton conductivity of CeP2O7 for intermediate temperature fuel cells. Solid State Ion 2008, 179, 1138–1141. [Google Scholar] [CrossRef]
  63. Averbuch-Pouchot, M.T.; Durif, A. Topics in Phosphate Chemistry; World Scientific: Singapore, 1996. [Google Scholar]
  64. Luo, X.; Lau, G.; Tesfaye, M.; Arthurs, C.R.; Cordova, I.; Wang, C.; Yandrasits, M.; Kusoglu, A. Thickness dependence of proton-exchange-membrane properties. J. Electrochem. Soc. 2021, 168, 104517. [Google Scholar] [CrossRef]
  65. Mohanty, S.; Desai, A.N.; Singh, S.; Ramadesigan, V. Effects of the membrane thickness and ionomer volume fraction on the performance of PEMFC with U-shaped serpentine channel. Int. J. Hydrogen Energy 2021, 46, 20650–20663. [Google Scholar] [CrossRef]
  66. Oh, Y.; Kim, S.K.; Peck, D.H.; Jung, D.H.; Shul, Y. Effects of membranes thickness on performance of DMFCs under freeze-thaw cycles. Int. J. Hydrogen Energy 2014, 39, 15760–15765. [Google Scholar] [CrossRef]
  67. Seo, S.H.; Lee, C.S. The effects of membrane thickness on the performance and impedance of the direct methanol fuel cell. Proc. Inst. Mech. Eng. C 2010, 224, 2211–2221. [Google Scholar] [CrossRef]
Figure 1. Schematic diagram of a three-grade sedimentation process for particle separation into three fractions with different particle sizes. (a) A well stirred particle–liquid suspension added into a multi-grade sedimentation tube filled with liquid (two upper valves are switched on while the bottom one is switched off). (b) Particles with different sizes gain different sedimentation speeds in the tube. (c) After a certain time, the upper two valves are switched off to gain three fractions of particles with different particle sizes that can be removed from the tube one by one via switching on the valves from the bottom to the top, one by one, consecutively.
Hydrogen 06 00070 g001
Figure 2. (A) Schematic technical route to processing solution-casting PBI-CUP PIC membranes [37]. (BD): The optical images of (B) a typical as-fabricated PIC membrane sample (CUP_75% with dimensions of 130 mm × 50 mm× 0.082 mm), (C) a typical as-fabricated GDE covered with Pt/C catalyst with the areal dimensions: ~5.0 cm × 5.0 cm, and (D) an as-prepared IT-MEA made of CUP_75% PIC membrane with the thickness of 82 μm (the MEA areal dimensions: 4.0 cm × 4.0 cm, active areal area: 5 cm2, and catalyst load: 1.0 mg/cm2 of Pt/C).
Hydrogen 06 00070 g002
Figure 3. (A) Schematic diagram of the single-stack IT hydrogen fuel cell testing setup, (B) optical image of the lab setup of the fuel cell testing system, (C) view of connection of the single-stack IT hydrogen fuel cell (out of the thermal chamber) to the Scribner® 850e fuel cell test station, and (D) view of the single-stack IT hydrogen fuel cell housed in the lab-made thermal chamber.
Hydrogen 06 00070 g003
Figure 4. Typical SEM micrographs of the as-synthesized CUP powder sample.
Hydrogen 06 00070 g004
Figure 5. Typical SEM micrographs of a bath of CUP powder sample after grinding for 120 min (2 h): (a) Fraction of large-sized CUP particles, designated as “Large”, (b) fraction of medium-sized CUP particles, designated as “Medium”, and (c) fraction of small-sized CUP particles, designated as “Small”.
Hydrogen 06 00070 g005
Figure 6. (A) The SEM micrograph of a sampled GDE cross-section (backscattered imaging), (B) the SEM micrograph of the surface microstructure of a sampled Pt-catalyst layer, (C) EDX color mapping of the Pt-catalyst-NP distribution on a sampled GDE surface, and (D) general mapping of the element distribution on a sampled GDE surface.
Hydrogen 06 00070 g006
Figure 7. (A) The SEM micrograph of surface morphology of a sampled Pt-catalyst-covered GDE (Pt/C load: 1.0 mg/cm2, SEM magnification: 10,000, and labeled spots for elemental analysis). (B) Variation in the proton conductivity of a typical IT-PIC-PEM with respect to the testing time. (C) Nyquist plots of EIS characterization of a typical IT-PIC-PEM at 200 °C, two current densities, and two backpressures, respectively.
Hydrogen 06 00070 g007
Figure 8. Crystal structure of CUP (CeP5O14) [37].
Hydrogen 06 00070 g008
Figure 9. Variation in the water uptake percentage (wt.%) of a typical pure PBI membrane sample (blue) and a typical PIC membrane sample (red) with respect to soaking time.
Hydrogen 06 00070 g009
Figure 10. Polarization (V-I) (black) and power density (red) (P-I) diagrams of the IT-MEAs made of PIC membranes with the thickness (A) 125 µm and (B) 82 µm, respectively, and Pt-NP-loaded GDEs at different reactant gas flow rates: square symbols—0.08 L/min for H2 and 0.2 L/min for air, and triangle symbols—0.25 L/min for H2 and 0.5 L/min for air (catalyst load: 1.0 mg/cm2 of Pt/C).
Hydrogen 06 00070 g010
Figure 11. Polarization (V-I) (black) and power density (P-I) (red) diagrams of an IT-MEA installed with two CUP_75%_sprayed membranes of thickness (A) 166 µm and (B) 105 µm, respectively, and Pt-NP-loaded GDEs at three reactant flow rates: square symbols—0.08 L/min for H2 and 0.2 L/min for air; triangle symbols—0.15 L/min for H2 and 1.0 L/min for air (Pt/C catalyst load: 1.0 mg/cm2).
Hydrogen 06 00070 g011
Figure 12. Polarization (V-I) (black) and power density (P-I) (red) diagrams of an IT-MEA installed with a CUP_75%_spr_2h membrane (thickness: ~94 μm) and Pt-NP-loaded GDEs at three reactant flow rates: square symbols—0.08 L/min for H2 and 0.2 L/min for air; triangle symbols—0.15 L/min for H2 and 0.3 L/min for air; circle symbols—0.15 L/min for H2 and 1.0 L/min for air for Pt/C catalyst load: (A) 1.0 mg/cm2 and (B) 0.5 mg/cm2, respectively.
Hydrogen 06 00070 g012
Table 1. Comparison of LT, IT, and HT fuel cells [3,5,6,7,10,11,12,13,14,15,16,17,18,19,20,21,22].
LT PEMFCsIT Fuel CellsHT Fuel Cells
Work
Temperature
50–100 °C150–700 °C (e.g., IT-SOFCs, PAFCs )600–1000 °C (e.g., SOFCs, MCFCs )
Electrolytes● Polymer electrolyte membranes (e.g., Nafion®).
● Aqueous alkaline solutions (e.g., KOH), etc.
● H3PO4 for PAFCs.
● Metal phosphates, e.g., CsH2PO4, Zr(HPO4)2.nH2O, metal pyrophosphates (CeP2O7, Ti P2O7, Sn2O7); CsHSO4, etc.
● Heteropolyacids, e.g., H3PW12O40, H4SiW12O40, H4GeW12O40, H6P2W18O62, H5BW12O40, H6CoW12O40, H3PMo12O40, etc.
● Ceramic materials, e.g., doped ceria (CeO2) or stabilized zirconia (ZrO2), etc.
● Ceramic materials, e.g., yttria (Y2O3)-stabilized zirconia (YSZ).
● Molten carbonate salts, e.g., Li2CO3/K2CO3 mixture.
Advantages● Fast start-up time and rapid dynamic response, suitable for mobile and portable applications, e.g., vehicles, personal electronics, etc.
● High power density, compact size.
● Zero-emissions.
● Higher tolerance to fuel impurities, e.g., CO, H2S, etc., compared to LT PEMFCs.
● High energy efficiency via recovering waste heat for combined heat and power (CHP) systems.
● High energy conversion rate due to faster reaction kinetics than LT PEMFCs.
● Simpler water and thermal management than LT PEMFCs.
● Lower degradation rates compared to SOFCs.
● Use of low-loading Pt or non-Pt-group catalysts.
● Suitable for hydrogen and direct liquid fuel cells, e.g., methanol, ethanol, etc.
● Fuel flexibility, suitable to use a wide variety of fuels, e.g., natural gas, biogas, liquid fuels, etc., through internal reforming.
● Noble metal catalysts are not required, leading to lower material costs.
● Not vulnerable to CO poisoning.
● High electrical efficiency up to 60–65%.
● High-quality waste heat for CHP.
Disadvantages● Complex and costly water/thermal management.
● High costs due to use of expensive noble metal catalysts, e.g., Pt, and high-purity H2.
● High sensitivity to CO poisoning.
● Slower start-up than LT PEMFCs.
● Materials degradation at higher temperatures, existing a trade-off between efficiency and component degradation.
● Very slow start-up.
● Request expensive and heat-resistant materials.
● Significant challenges with thermal expansion and system sealing.
Challenges● High cost of catalysts.
● Long-term durability.
● Building a costly hydrogen infrastructure of production, delivery, and storage.
● Developing new IT cathode materials with faster kinetics.
● Degradation mitigation.
● Improvement of long-term stability.
● Material degradation at HT.
● Thermal stress management.
● Complex system design.
Note: PAFCs : Phosphoric acid fuel cells; MCFCs : Molten carbonate fuel cells.
Table 2. The statistical results of the CUP particle size after grinding for hours.
CUP Powder SamplesFractionsAverage Size (µm)
As-synthesized raw CUP
powder
Initial16.18 ± 5.54
2.4 ± 0.9
0.3 ± 0.1
After 2 h grinding using mortar and pestleLarge19.3 ± 5.7
2.1 ± 0.9
Medium7.5 ± 2.6
0.3 ± 0.1
Small2.0 ± 0.6
0.3 ± 0.1
Note: : Relatively smaller-sized CUP particles picked by mouse during SEM imaging; : Much smaller-sized CUP particles picked by mouse during SEM imaging.
Table 3. Mass distribution of three CUP particle groups (Large-, Medium-, and Small-sized) of finely ground CUP powder sample after sedimentation-based separation.
Particle FractionsLargeMediumSmallTotal
Mass (g)3.13790.76090.79964.6984
Mass Percent (%)66.816.217.0100
Table 4. Elemental composition at the GDE surface.
ElementCNOPCePt
Wt. %11.18 ± 0.820.62 ± 0.143.75 ± 0.771.23 ± 1.200.79 ± 0.8981.40 ± 1.99
Table 5. Proton conductivities of the IT CUP-PBI PIC PEMs at 200 °C.
Sample SpecificationMembrane Thickness (μm)Proton Conductivity (S/cm)
CUP_75%_82 µm 820.048
CUP_75%_134 µm 1340.063
CUP_75%_sprayed_166 µm 1660.046
CUP_75%_sprayed_105 µm1050.105
CUP_75%_spr_2 h_94 µm *940.051
CUP_75%_spr_2 h_95 µm
(0.5 mg/cm2 Pt/C)
950.066
Note: : 75 wt.% CUP, thickness: 82 μm, time for grading CUP prior to casting: 15 min. : 75 wt.% CUP, thickness: 166 μm, time for grading CUP prior to casting: 15 min, two sides sprayed with CUP particles. *: 75 wt.% CUP, thickness: 94 μm, time for grading CUP prior to casting: 2 h, two sides sprayed with CUP particles.
Table 6. Comparison of proton conductivity of various PEMs reported in the literature and this work.
Proton ConductorsProton Conductivity (S/cm)Measurement Temperature (°C)Refs.
Nafion® 1120.092
0.06
~0.15–0.16
0.0175
20 (in liquid water)
30 (100% RH)
80–100 (90–100% RH)
120 (50% RH)
[16]
[16]
[54]
[54]
H3PO4-doped PBI10−9–10−5
0.04–0.07
160 (1.9 H3PO4 per unit)
200 (4–6 H3PO4 per unit)
[55]
[56]
CsH2PO410−7
10−2
Room temperature
232
[57,58]
CaHPO4.2H2O10−3327[59]
In0.1Sn0.9P2O7 (pellet)0.01–0.195750–300[60,61]
CeP2O7 (pellet)0.001–0.018
0.002–0.035
50–200 (dry)
60–200 (PH2O = 0.15 atm)
[62]
[27]
CeP5O14 (pellet)0.03250 (PH2O = 0.15 atm)[26]
CUP-PBI membrane (CeP5O14, 75 wt.%)0.046–0.105200this study
Table 7. The fuel cell performance data of typical lab-made IT-PIC-PEMs at 200 °C.
PIC MembranesFlow Rates (H2 and Air) (L/min)OCV (V)Max. Current
Density (A/cm2)
Max. Power
Density (mW/cm2)
CUP_75%_82 µm
(1.0 mg/cm2 Pt/C)
0.08, 0.20.31439.646.6
0.25, 0.50.33543.658.3
CUP_75%_134 µm
(1.0 mg/cm2 Pt/C)
0.08, 0.20.58572.9114.3
CUP_75%_sprayed_166 µm
(1.0 mg/cm2 Pt/C)
0.08, 0.20.95439.3104.2
0.15, 1.00.96410.587.1
CUP_75%_sprayed_105 µm
(1.0 mg/cm2 Pt/C)
0.08, 0.20.31693.870.5
0.15, 0.30.32763.387.1
0.15, 1.00.351010.1129.1
CUP_75%_spr_2 h_94 µm
(1.0 mg/cm2 Pt/C)
0.08, 0.20.58877.9186.4
0.15, 0.30.59902.1176.3
0.15, 1.00.59915.9171.1
CUP_75%_spr_2 h_95 µm
(0.5 mg/cm2 Pt/C)
0.08, 0.20.51640.4155.3
0.15, 0.30.52759.0164.5
0.15, 1.00.51981.3191.7
Disclaimer/Publisher’s Note: The statements, opinions and data contained in all publications are solely those of the individual author(s) and contributor(s) and not of MDPI and/or the editor(s). MDPI and/or the editor(s) disclaim responsibility for any injury to people or property resulting from any ideas, methods, instructions or products referred to in the content.