Abstract
Pipe exits into cryogenic systems, such as an exit of a venting or sensor tube inside a cryogenic storage tank, can affect spontaneously occurring acoustic oscillations, known as Taconis oscillations. The amplitude which such oscillations will reach is dependent on losses at the pipe exit that prevent resonant oscillations from growing without bound. Consequently, being able to accurately determine minor losses at a pipe exit is important in predicting the behavior of these oscillations. Current thermoacoustic modeling of such transitions typically relies on steady-flow minor loss coefficients, which are usually assumed to be constant for a pipe entrance or exit. In this study, numerical simulations are performed for acoustic flow at a pipe exit, with and without a wall adjacent to the exit. The operating fluid is cryogenic hydrogen gas, while the pipe radius (2 and 4 mm), temperature (40 and 80 K), and acoustic velocity amplitudes (varying in the range of 10 m/s to 70 m/s) are variable parameters. The simulation results are compared with one-dimensional acoustic models to determine the behavior of minor losses. Results are also analyzed to find harmonics behavior and a build-up of mean pressure differences. Minor losses decrease to an asymptotic value with increasing Reynolds number, while higher temperatures also reduce minor losses (10% reduction at 80 K versus 40 K). A baffle sharply increases minor losses as the distance to pipe exit decreases. These findings can be used to improve the accuracy of oscillation predictions by reduced-order thermoacoustic models.
1. Introduction
Thermoacoustic phenomena are important for cryogenic storage systems. Thermoacoustic instabilities like Taconis oscillations are produced by large temperature gradients in pipes penetrating cryogenic tanks [1]. In a hydrogen storage system, the coldest portion of the storage system will be in the range of around 20 to 40 K, while piping that enters the system will reach ambient temperature outside the tank. These instabilities can produce significant heat leaks, negatively affecting hydrogen storage. Acoustic oscillations occurring in pipes with entrances and exits, such as those created by Taconis oscillations, can be predicted using thermoacoustic models to estimate the amount of heat leak into the system. More broadly, general acoustic problems, such as the exhaust in a muffler, involve acoustics in ducts with sudden changes of cross-sectional area. Presently, acoustic models usually assume the validity of steady-flow correlations for minor losses, but these have not typically been validated for oscillatory flows, particularly for cryogenic fluids. While some research on the behavior of minor losses in cryogenic hydrogen at a pipe junction has been performed [2], similar research for pipe exits has not.
The theoretical treatment of acoustic minor losses is often based on the hypothesis by Iguchi [3], who postulated that acoustic oscillations may be treated as quasi-steady, allowing the use of steady-flow correlations. The oscillating flow is considered to behave independently of its history at any given point in time, such that the flow will behave similarly to steady flow at any instant. Many steady-flow correlations for minor losses, including pipes exiting near a baffle, were produced by Idelchik [4], and simplified steady-flow correlations for thermoacoustic modeling were described by Swift [5].
The low-amplitude, thermoacoustic wave equations account for the thermoviscous effects near the wall through form functions [5], which describe the velocity and temperature gradients in the boundary layer. However, these equations do not account for the additional losses resulting from turbulent behavior or minor losses. Swift [5] proposed a modification to account for turbulent behavior in thermoacoustic models. This modification adjusts the viscous form function and the thermal penetration depth. However, this model is not well-validated and is difficult to compare with experiments [6,7]. Minor losses are usually empirically accounted for through the introduction of a pressure drop controlled by minor loss coefficients, and , respectively, for the upstream and downstream flow components of the loss. An example of research software implementing these models is DeltaEC, developed by Ward et al. [6], which models thermoacoustics based on analytical solutions to the wave equation across discrete elements.
In steady flow, the minor loss coefficient at the exit of a pipe is generally of the order of 1 [4,8]. Flanged pipe entrances are treated as having a minor loss coefficient of about 0.5, which corresponds to the prediction based on Idelchik for an infinite area ratio [4], while unflanged pipe entrances experience greater minor losses, with reported coefficients of 0.78 [6]. Standard correlations, consequently, predict a constant value for minor loss correlations. Hooper [9] proposed a more sophisticated set of steady-flow minor-loss correlations that accounted for Reynolds number and some turbulent flow characteristics. However, these correlations are not specifically designed for acoustic flows. Still, these correlations provide a useful basis for establishing more complex correlations.
Doller [10] experimentally measured minor losses in quarter- and half-wave resonators, using pressure and power measurements to determine the upstream and downstream components separately. While some cases showed decent agreement with Idelchik [2] correlations, they were noted to have not reached an asymptotic state, where they may have deviated further. Other cases showed a significant underprediction from Idelchik’s correlations. King and Smith [11] experimentally determined minor losses for acoustic oscillations with a tapered diffuser, subject to variations in displacement amplitude, diffuser angle, and Reynolds number. Minor losses were found to decrease with Reynolds number and increase with displacement amplitude, with steady-flow correlations either overpredicting or underpredicting losses, depending on the amplitude.
Ueda et al. [12] used experimental apparatuses to assess correlations with both air and high-pressure helium. They found that frequency has a fairly weak effect on minor losses. While the steady-flow correlations they employed showed good accuracy for some selected geometries, the experimental values reported across different area ratios showed lower accuracy. Multiple ranges of area ratios resulted in significant departures from the predicted values based on steady-flow correlations, demonstrating a lack of general applicability.
Prior research on minor losses in experimental cryogenic systems is lacking. Regier [13] modeled minor losses for a cryogenic helium system but did not validate the correlations. Ding et al. [14] examined minor losses in tube bends for a thermoacoustic cryocooler, but the operating fluid in the study was at ambient temperatures. Kurai et al. [15] also modeled minor losses for a thermoacoustic cooler. They performed an empirical analysis on the data for a bent tube and a T-junction, finding that minor losses scale roughly according to velocity cubed, as expected. These results were not, however, compared to predictions based on steady-flow correlations or analytical analysis.
Buick et al. [16] performed an experimental analysis of oscillating flow at the exit of a pipe using particle image velocimetry and conducted an axisymmetric simulation using the lattice Boltzmann method. However, only qualitative comparisons could be made, while there were large discrepancies between simulated and experimental data for the impedance at the exit of the pipe.
Su et al. [17] used computational fluid dynamics to model acoustic radiation from an infinitely flanged pipe set at an angle. This system was modeled in three dimensions, producing a significant computational load for a finely refined mesh, with a hybrid boundary element method used to improve accuracy. The acoustic field was noted to vary across the exit with frequency, while the peak in the field shifted position along the pipe in response to frequency, shifting toward the upper section with higher frequency. However, acoustic minor losses were not considered.
Su et al. [18] experimentally measured flow with both mean flow and acoustic components through an opening covered by a perforated film. This system was reproduced with computational fluid dynamics, using Reynolds-averaged Navier–Stokes equations with the k-ω SST turbulence model. While the study showed reasonable agreement between numerical and experimental results for reactance and resistance at the orifice, the characteristics of the study, such as the perforated film and mean flow, imply that it is less applicable to the study of minor losses relevant to this work.
In the previous study by the authors [2], a minor loss associated with a transition between two tubes of different diameters was numerically investigated, and correlations were obtained in a range of Reynolds numbers and ratios of cross-sectional areas. Additional effects exist for pipe exits, such as different recirculation zones, radiation losses, and vortex detachment. In the present study, two other important conditions are considered (Figure 1). A fully open gaseous space is considered similar to that of a large tank. A cryogenic tank may have the liquid surface imitated as a solid wall along the boundary perpendicular to acoustic flow, as well as a solid tank wall near the tube exit.
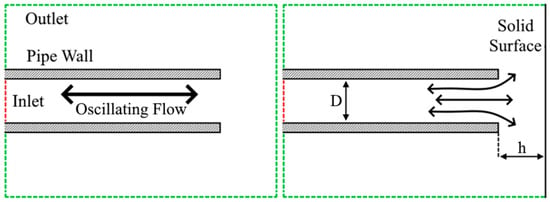
Figure 1.
Oscillating flow in pipe exit without baffle (left) and with baffle (right), representing fully open flow and entering a space near surface. Green dashed lines indicate outlets, and red dashed lines represent an inlet. Wall distance h and pipe diameter D are also shown.
Axisymmetric CFD simulations, such as those employed in this study, can significantly reduce computing requirements, allowing a range of parameters to be assessed, but do not fully accurately model 3D vortices. Roma [19] observed higher turbulent kinetic energy and faster dissipation in three dimensional versus axisymmetric turbulence, indicating that minor losses would likely be greater in full 3D modeling. The present study aims to determine the dependence of minor losses in such cases based on acoustic flow amplitude, pipe geometry, and the wall-to-pipe-exit distance. Besides identifying the minor loss coefficients, acoustically induced mean pressure and harmonics in the inlet pressure signal are assessed. Results demonstrate an inverse dependence on Reynolds number for minor losses, as well as lower (~10%) minor losses at 80 K compared to 40 K. A baffled exit drastically increases minor losses at lower spacings, starting from around = 0.1.
2. Materials and Methods
2.1. Modeling and Numerical Aspects
Computational fluid dynamics (CFD) is a powerful and versatile tool to model fluid flows. It works by numerically solving the Navier–Stokes equations over a discretized volume mesh. For the purposes of this study, the commercial CFD program Star-CCM+, version 15.04.008 was used [20]. The Reynolds-averaged Navier–Stokes (RANS) equations were employed for turbulent flow modeling, using an implicit solver with 2nd-order discretization in space and 1st-order discretization in time. The governing equations for the RANS approach are given by the following [21],
with time averaged velocity components , pressure , fluid density , dynamic viscosity , total specific energy , and heat flux components . is the turbulent stress tensor, which describes turbulent flow based on the specific turbulence model employed. For this study, the realizable model was used with 2-layer blending [22]. This turbulence model is suitable for both high and low wall y+ values and displays improved accuracy compared to the standard model for boundary layer and rotational flow. Consequently, it is of use in the modeling of minor losses. The CFD software employed demonstrated applicability and showed good accuracy for complex fluid flows in our previous studies [2,23,24]. While RANS less accurately resolves vortex formation in comparison to other numerical schemes, such as large eddy simulation (LES), it is the only numerical scheme available for axisymmetric modeling in this software. Fully three-dimensional modeling would be too computationally expensive in this study, so the RANS approach was selected. Resulting inaccuracies are likely associated with the 10 to 15% error noted in Section 2.3. Minor losses are likely slightly underpredicted as a result.
The numerical domain for CFD simulation represents an unflanged pipe exiting into an open space at assigned mean pressure and temperature (Figure 2). Pressure outlet boundaries employ acoustic suppression zones available in the CFD software and are set to a non-reflecting condition [20], with a length scale of 3 cm, about 20% of domain length. The static pressure and temperature of the outlet boundaries are set to the mean pressure and temperature. The inlet uses a velocity boundary condition with a sinusoidally oscillating magnitude, and corresponding temperature oscillations based on acoustic theory according to inlet acoustic pressure. Most oscillations were fixed to 20 Hz, near the lower end of experimentally observed frequencies in Taconis oscillations [1], as minor losses vary little with frequency. Additional notes on sensitivities to frequency are included in Section 3. Inlet and outlet turbulence specifications used a standard value for the software, 0.01 turbulence intensity. For the “plane-wall” simulations, a no-slip, fixed-temperature wall is used for the boundary on the right side of the domain (Figure 2). Similarly, the walls of the tube were no-slip and isothermal. The length of the domain is variable, based on the pipe-to-wall distance. The simulation is performed with an axisymmetric domain, with the axis of symmetry defined at the bottom (Figure 2).
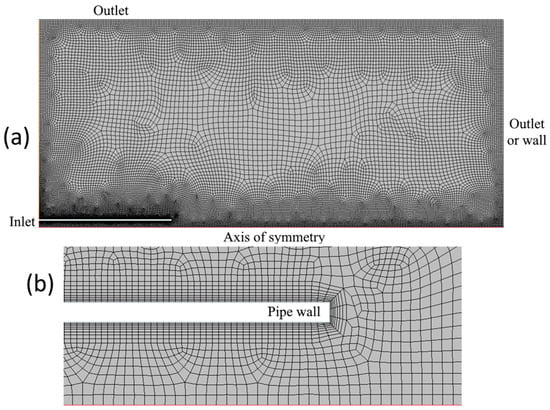
Figure 2.
Numerical mesh of (a) full domain and (b) detail view near pipe exit.
The straight section of the tube is 4 cm long, while the total domain is 14 cm long, and extends 6 cm above the outer wall of the tube, which is 0.5 mm thick (Figure 2). Prism layers were employed to more accurately capture the boundary layer, with sufficient depth to be appropriate for a range of conditions. The required domain length for the open space was assessed based on inlet power variation. The power difference between a 15 cm and 30 cm domain was found to be less than half a percent.
In order to utilize acoustic suppression, a real-gas equation of state model had to be used in the software. The Redlich–Kwong model was selected based on prior research with cryogenic fluids [25]. A comparison to the real density–pressure–temperature relationship of parahydrogen, as provided by the open-source fluid reference package CoolProp [26], showed good accuracy above around 35 K. Due to these limitations, the lower bound for mean temperature was selected as 40 K, with a higher temperature of 80 K selected for comparison, when fluid is close to an ideal gas. Transport properties were provided by data tables, with both temperature and pressure generated using CoolProp, version 7.0.0.
The mesh-convergence study was run at the inlet velocity amplitude of 20 m/s for the open-pipe case at 40 K. The mesh displays good convergence in both integrated inlet acoustic power and time-averaged inlet pressure, relative to the mean pressure (Figure 3). The finest mesh was subsequently used for other simulations in this study. The estimated numerical uncertainty was determined by multiplying the Richardson extrapolation, [21], by a factor of safety, F [27], to obtain the final uncertainty, u.
where Δ12 is the difference between fine and medium mesh results, Δ23 is the difference between medium and coarse mesh results, the order of accuracy, and β the scaling ratio. For the conditions in this study, the numerical error predicted for inlet power is 0.94%, with 0.10% error for inlet mean pressure, with a cell count of 28,421. The maximum observed wall y+ value is around 40. Variations in results with the time step around the selected value are very small, below a tenth of a percent for both power and mean inlet pressure (Table 1). The finest time step is used for smaller wall spacings, while other simulations employ the 5 × 10⁻⁵ s time step.

Figure 3.
Mesh convergence for (a) inlet power and (b) inlet gauge mean pressure.

Table 1.
Time-step convergence for baffled pipe at spacing = 0.2.
2.2. Analytical Models
The basis of reduced-order thermoacoustics is the acoustic approximation, which assumes that properties oscillate sinusoidally with low amplitude at the fundamental frequency. In the quasi-one-dimensional approximation, nonlinear effects from minor losses may be accounted for by introducing discontinuity of acoustic pressure amplitude via a minor loss coefficient. The amplitude of the pressure discontinuity is defined by Swift [5] as follows,
where the pressure amplitude jump is defined in terms of the mean density , the volumetric acoustic velocity amplitude, , the minor loss coefficient , and the pipe’s cross-sectional area, .
Minor loss coefficients in this study are determined in the manner previously described in [2], with the outlet boundary condition defined to include sound radiation impedance—a negligible contribution in the studied situations—and minor losses. The minor loss coefficient is iteratively adjusted in the reduced-order model until the acoustic power at the inlet matches the inlet acoustic power calculated from CFD results to within 0.01%. This ensures the combined power dissipated by major and minor losses in CFD is equal to the combined amount of power dissipated through the major and minor losses in the reduced order model.
Other nonlinear acoustics results produced by the CFD were also analyzed. The mean pressure drop at the inlet relative to the stagnant outlet is simply calculated by taking the time average of the pressure over one period of oscillation. To assess other nonlinear effects, a Fourier analysis is performed on the fundamental frequency and the first few harmonics for the inlet pressure signal. The relative amplitudes of different harmonics can indicate the relative nonlinearity of the system under different conditions.
The Fourier analysis [28] is performed by numerically integrating the signal over one period multiplied by for each harmonic. This can be presented by splitting this operation into real and imaginary components as follows:
where is the time-domain function being processed; in this study, it is the acoustic pressure at the inlet, as the velocity is assigned as the boundary condition and is always perfectly sinusoidal and at zero phase. and are the real and imaginary components, respectively, of the harmonic, while is the magnitude of the harmonic; is the number of the harmonic, is the fundamental frequency of the system, which is in this case the acoustic driving frequency, is the starting time for the sample, is the period corresponding to the fundamental frequency, and is the phase of the harmonic. A perfectly linear system, such as suggested by the linearized acoustic approximation, will have zero amplitude in all harmonics above the fundamental frequency.
2.3. Validation
While there is little usable published data for performing validation with a fully open tube, Ueda et al. [12] studied an experimental system with a high area ratio, expanding into a very large resonator, which resembles a pipe entering a large tank in some respects. The experimental system had an extended narrow section with 49 mm radius, with a tapered expansion at 33 degrees into a 195 mm radius closed resonator. The working fluid was high-pressure helium at ambient temperature and 59 Hz oscillatory frequency. To obtain more accurate results, a sufficiently high fraction of the total acoustic power in the system needed to be caused by minor losses. For this purpose, as well as to reduce computational load, much of the 3 m long narrow tube was cut out of the simulation, leaving only a 10 cm section at the beginning. This had the additional benefit of allowing for the throat velocity to be directly set to match the experimental data points.
Although the study from Ueda et al. [12] differs in certain significant ways from this study, the uncertainty is still expected to be similar for hydrogen at the selected numerical conditions far from states where phase change may occur. In addition, while the geometry is quite different between these two studies, the area ratio and volume at the end of the experimental system are quite large.
A velocity inlet was used in place of a pressure inlet for this system due to strongly nonlinear behavior of velocity at the throat and the much longer time required to reach a steady state. The two highest velocities for each pressure (excepting the nearly identical second point at the end of the 8-bar data) were selected for modeling. Experimental values were determined by using geometry and reported minor loss coefficients from [12] to determine predicted acoustic power at the inlet. The error between CFD and experimental values varied from 11% to 15% in the selected range (Table 2).

Table 2.
Comparison between experiment and CFD for 300 K helium gas.
3. Results and Discussion
Two categories of simulations were performed in this study: an unflanged pipe exiting into a fully open space, and an unflanged pipe exiting near a solid surface, intended to represent a container wall or approximately simulate a liquid surface adjacent to the pipe exit. In both cases, comparisons were made for 40 and 80 K temperatures, with pipe radii of 2 mm and 4 mm. The fluid mean pressure was set to 5 bar, which corresponds to common pressures used in cryogenic hydrogen systems.
In this system, based on thermoacoustic theory, minor losses are expected to dominate power dissipation at velocities 10 m/s or larger. As velocity increases, the internal tube wall’s “major” losses (due to friction and thermal relaxation), become negligible in the numerical domain in comparison to minor losses, which scale with the cube of velocity. To represent a range of Reynolds numbers in which minor losses may dissipate a significant amount of power in a system, simulations with no external wall were run at a more granular range of velocities from about 10 m/s up to around 40 m/s. To save computational requirements, simulations with an external wall, which had to be run for a variety of spacings, used velocities of 10, 30, 40, and 50 m/s at 40 K, and 10, 20, 40, and 70 m/s at 80 K, roughly spanning the range from the lower end of the acoustic turbulence threshold to the beginning of the asymptotic range.
The oscillation frequency used in most simulations was set to 20 Hz, but additional simulations examined the effects of other frequencies. Similarly to Ueda et al. [12], we found negligible differences at twice higher or lower frequencies. At 40 Hz, the maximum difference in power and pressure was around 5% at the lowest speeds, and around 1% or less in most cases. At 10 Hz, the maximum difference was about 0.4%, with most cases being around 0.1% or lower. Interestingly, different frequencies also had a negligible effect with the adjacent wall simulations, which might be expected due to the change in fluid displacement over a cycle. The minor losses in these results are reported as the average of upstream and downstream coefficients, as used in reduced-order modeling for calculating the acoustic press amplitude change.
As seen in Figure 4, minor loss coefficients in a fully open pipe are essentially unaffected by pipe radius at the same , defined according to Swift’s [5] turbulence onset condition in terms of viscous boundary layer thickness, , as follows,
where is the smaller radius at the junction, is the velocity amplitude, is kinematic viscosity, and is angular frequency. The latter condition (Equation (13)) is always the case in this study. Minor losses do, however, differ at different temperatures for the same modified Reynolds number, with roughly 20% lower minor losses at 80 K compared to 40 K. At 80 K, density is roughly half that at 40 K, while viscosity is around 70% greater. A nearby rigid surface, however, results in a greater difference between different pipe radii. This difference scales inversely with the distance of the surface, , from the pipe exit. This inverse scaling also applies to the minor loss coefficient in general, with a significant increase from to , with being the tube diameter (Figure 1). There is some increase from a pipe exit with no wall to a wall at as well. Values reported in the figures are not given with error bars for the numerical uncertainties, as they would be comparable in size to plot symbols.
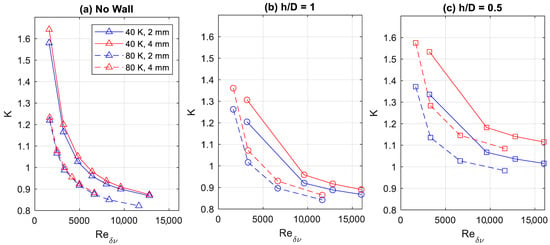
Figure 4.
Minor loss coefficients under different conditions with (a) no adjacent wall, (b) a wall with spacing = 1, and (c) a wall with spacing = 0.5.
The data for minor loss coefficient represent the average value of the upstream-flow and downstream-flow minor loss coefficients. As the upstream coefficient in steady flow is about 1, and the downstream coefficient is in the range of 0.5 to 0.8, the average would be expected to fall within the range of 0.75 to 0.9, which corresponds well with the asymptote approached in the observed range of results. A correlation from our previous work [2] predicts a K value of 0.775 at infinite area ratio, which is consistent with these predictions. However, these coefficients predict a constant value, while results indicate different asymptotes for 40 and 80 K operating conditions. An adjacent wall also introduces a dependency on a pipe radius, relative to the wall distance from the pipe exit.
Equation (14) below is proposed to describe the general observed trends, accounting for the effects caused by temperature, modified Reynolds number, and relative spacing to the wall.
with critical temperature , equal to 32.938 K for parahydrogen. The first term describes Reynolds number dependence, the second term the temperature dependence, and the third term a constant shift based on wall spacing. At lower speeds, the error is as much as 10% due to the temperature effect, but at higher amplitudes, the error drops to 2% or less. Figure 5 below compares the fit to data averaged between 2 mm and 4 mm pipe radii.
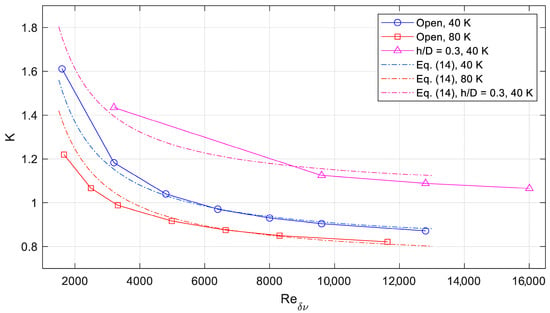
Figure 5.
Comparison between selected CFD data and fit equation, with different temperatures and proximity to the wall.
The mean pressure difference from the inlet to the outer boundary of the open volume, the latter of which is at the mean pressure, is a combination of major and minor losses and the change in pressure governed by the Bernoulli equation [5]. For an open pipe with no adjacent wall, the time-averaged inlet gauge pressure shows a greater difference between different temperatures (Figure 6), with around a 50% greater drop compared to the external mean pressure at 80 K versus 40 K when not accounting for the Bernoulli pressure contribution. The Bernoulli change in pressure resulting from the velocity dropping to 0 outside the pipe exit for acoustic oscillations is given by the following [29]:
with density , sound speed , acoustic pressure magnitude before and after the step and , and similar acoustic velocity amplitudes and . The velocity amplitude well outside the pipe becomes 0, and the pressure term is negligible under these conditions, so this can be simplified to the following form:
which will cause the pressure at the inlet to appear lower than it otherwise would. In this case, a slight decrease in mean pressure is observable in a 4 mm tube compared to 2 mm tube (Figure 6). The pressure jump is significantly higher at 80 K, roughly twice the pressure jump at 40 K.
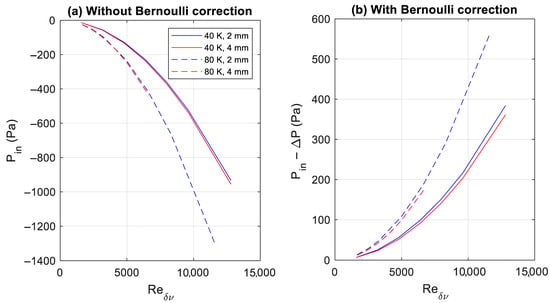
Figure 6.
Time-averaged inlet gauge pressure for open pipe with no adjacent wall, (a) without and (b) with Bernoulli pressure correction.
A potential explanation for the difference observed between 2 mm and 4 mm pipe radius is the difference in the fraction of the pipe cross-sectional that is inside the acoustic viscous boundary layer, whose depth depends only on the temperature and acoustic frequency. A similar effect may occur with the boundary layer along the wall when it is present. Waves will also reflect off the wall and back into the tube at sufficiently small spacings, and these may be affected by developing flow and minor losses at the entrance. This is supported by the increased pressure loss observed at closer spacings in Figure 7.
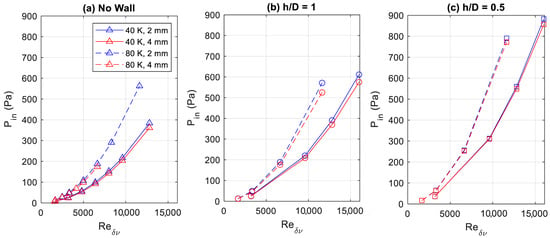
Figure 7.
Time-averaged gauge pressure at inlet with Bernoulli pressure correction at (a) no adjacent wall, (b) a wall with spacing = 1, and (c) a wall with spacing = 0.5.
A comparison of time-averaged inlet pressure for simulations without an adjacent wall, compared to those with an adjacent wall, shows an increase in inlet pressure as the surface moves closer to the pipe exit (Figure 7). This is expected, as the adjacent surface will increase the exit impedance. Interestingly, the difference between 2 mm and 4 mm pipe radii decreases as the wall distance decreases.
A distinct effect in the results is observed when going from 40 to 80 K, where, in all cases, minor losses are lower at higher temperatures. The temperature of 40 K is relatively near the saturation temperature, where fluid properties are significantly affected. Consequently, during a cycle, fluid properties may noticeably shift. The Prandtl number in particular, which describes the relative size of thermal and viscous boundary layers, varies significantly with temperature below 40 K in parahydrogen. At higher temperatures, hydrogen behaves closer to an ideal gas, and its properties vary less within a cycle.
The minor loss coefficients derived for the baffled pipe, shown in Figure 8, show a distinct horizontal shift in , but otherwise follow the same form of inverse proportionality to . Closer wall spacings produce a constant shift in the magnitude of the minor loss coefficient, not affecting the scaling with Reynolds number. This indicates that minor losses resulting from a proximate surface scale primarily with wall distance. Additionally, a wider pipe results in not only a slightly greater minor loss coefficient, but also a greater degree of scaling with . At the same value of for a greater pipe radius, the ratio of fluid acoustic displacement to spacing will be different, which may cause a greater sensitivity to oscillation magnitude. Dependence on wall spacing follows a very sharp curve, having negligible effect beyond roughly , and sharply rising below , as shown in Figure 9.
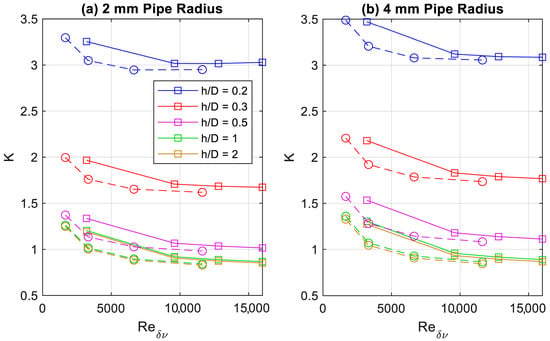
Figure 8.
Minor loss coefficient for open pipe with adjacent wall at different Reynolds numbers for pipe radii of (a) 2 mm and (b) 4 mm. Solid lines represent 40 K data, dashed lines represent 80 K data.
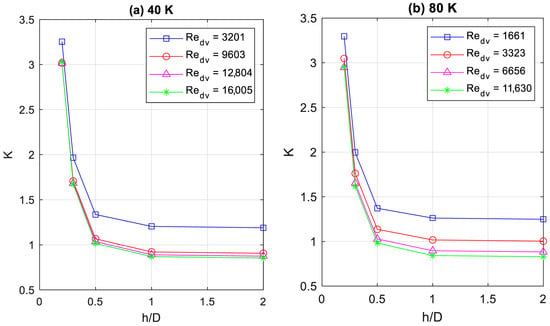
Figure 9.
Minor loss coefficient dependence on wall spacing at (a) 40 K and (b) 80 K in 2 mm pipe.
The amplitudes of the inlet pressure amplitude harmonics for different geometries and different velocities are illustrated in Figure 10, normalized by the amplitude at the fundamental frequency. At relatively lower velocity amplitudes, the second harmonic relative amplitude is about 0.2, which increases to 0.4 at higher velocities, demonstrating increasing nonlinearity with increasing oscillation amplitude. Two cases with a surface in front of the tube are presented, for values of 0.2 and 0.5. For = 0.5, the first harmonic above the fundamental frequency has a lower amplitude than the fully open system, with comparable amplitudes at further harmonics. The phase of each harmonic is similar for = 0.5 and the open system, except for the highest harmonic, which has a negligible influence on the system. In comparison, the system with = 0.2 has a very significantly different second harmonic. Additionally, the second harmonic has an even lower amplitude than the other two cases, while the third harmonic is greater, such that the third harmonic’s amplitude is greater than the second harmonic. Due to the increase in minor losses at lower spacings, the dominance of the second harmonic therefore correlates inversely to energy dissipation.


Figure 10.
Normalized pressure harmonic magnitudes and phases at (a,d) 10 m/s, (b,e) 30 m/s, and (c,f) 40 m/s.
Figure 11 presents the inlet acoustic pressure over a single period at low and high oscillation amplitudes, corresponding to the lowest and highest “open-tube” harmonics in Figure 10. Distinct nonlinearities are observable near the beginning of the cycle, indicated by the lack of sinusoidal shape. These are evident even at lower amplitudes but become much more distinct at high amplitudes. However, during inflow—the second half of the cycle— the nonlinearities become much less, with a nearly sinusoidal shape. This demonstrates that the circumstances producing nonlinear behavior occur primarily during outflow in the cycle.

Figure 11.
Acoustic pressure at the inlet for fully open 2 mm diameter tube at 40 K, oscillating at (a) 10 m/s and (b) 40 m/s inlet velocity amplitudes.
Figure 12 shows the interaction between the acoustic flow and an adjacent wall at a separation of one pipe diameter on the left side, and acoustic flow exiting a pipe with no adjacent surface on the right. Due to the difference in domain size, flow field images on the left are slightly magnified. Both cases are the pipes of 2 mm radius at 40 K, with fluid oscillating with an amplitude of 20 m/s. During the outflow, a jet forms from the pipe exit. With an adjacent wall, it impacts the wall, forming a small stagnation zone at the center, while the flow fans out along the solid surface. Flow entrainment along the surface of the jet can be seen, but no vortices are observed. During the inflow, there is fairly little interaction with the surface, and a small recirculation zone inside the pipe near the end accounts for energy dissipated to minor losses during that segment of the cycle. There is little qualitative difference to be seen between an adjacent wall and no wall during the inflow. Midway through the cycle, after the outflow has ceased, residual flow continues outside the pipe, resembling the form of the exit jets. Flow continues to be entrained along much of the jets. The interaction of the jet with surrounding fluid in the open volume correlates with the nonlinearities observed during the outflow segment of the cycle.
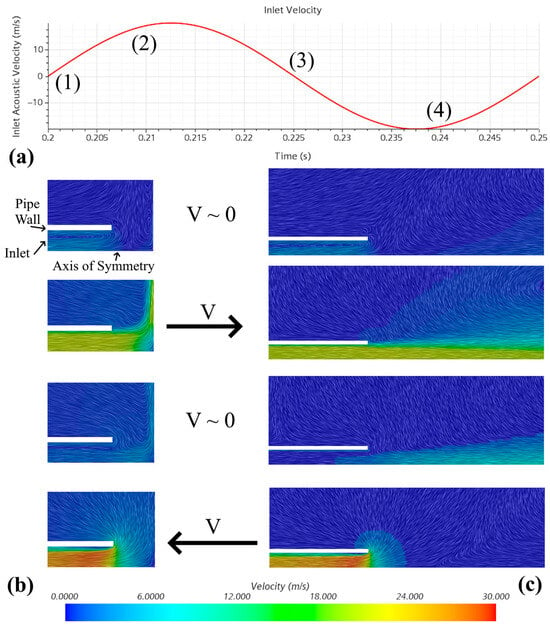
Figure 12.
Inlet acoustic velocity time-domain graphs and velocity flow fields at different points in a single cycle, with (a) labeled inlet velocity over one period, (b) flow fields in the case with a wall at spacing = 1 for four time instances shown in (a), and (c) flow fields with no external wall at the same time instances.
4. Conclusions
This study has demonstrated the applicability of computational fluid dynamics for establishing minor loss values in cryogenic thermoacoustic systems, as well as acoustic systems in general. Due to high experimental cost, experimental uncertainties, and time requirement to test minor losses in physical systems, the computational method can be used to determine, with reasonable accuracy, minor loss coefficients for various geometries. The results of these simulations for tube exits demonstrate an inverse proportionality to Reynolds number, observed previously for another configuration in [2]. The effect of temperature is a reduction in a minor loss coefficient at the same for a higher temperature, while also shifting the point at which asymptotic values are reached to a lower Reynolds number. At 80 K, minor losses are around 10% lower than at 40 K at high . Trends in the temperature effect remain the same at different spacings to an adjacent wall. The spacing itself shifts the minor loss coefficient upward by a constant value, increasing considerably as spacing approaches zero. Interestingly, the pipe radius has an effect that increases with magnitude as wall spacing decreases, with minor losses increasing at a larger tube radius. This effect is nearly negligible for an unobstructed pipe but increases to around 10% at a spacing of = 0.5, similar to the magnitude of the temperature effect.
Additionally, nonlinearities at different amplitudes and with adjacent rigid surfaces were modeled, the results of which indicated that a nearby wall may reduce nonlinear behavior. The amplitude of the second harmonic, relative to the fundamental, with an unobstructed pipe exit is as much as a third greater than with a wall at a spacing of = 1, with relatively little difference in phase. Even closer spacings result in considerable phase shift and a third harmonic stronger than the second harmonic, possibly as a result of acoustic reflection from the surface. Future research in this vein may investigate three-dimensional effects, which are not represented with an axisymmetric simulation. Three dimensional models such as the large eddy simulation (LES) can be employed to better model vortex formation and shedding. Three-dimensional vortices are expected to dissipate more energy, as their turbulent kinetic energy has been observed to be higher, and their dissipation faster, compared to axisymmetry. While the Redlich–Kwong equation of state fairly accurately models hydrogen gas under these conditions, the full use of real hydrogen properties would further improve the simulation accuracy. Multiphase modeling can also be used to analyze acoustic interactions at the surface of a liquid, which will not behave exactly as a solid wall when exposed to nearby large-amplitude oscillations. Additional experiments to establish full validation for simulations of cryogenic hydrogen flow will also be necessary in future research.
Author Contributions
Conceptualization, K.C. and K.I.M.; methodology, K.C. and K.I.M.; software, K.I.M.; validation, K.C.; investigation, K.C.; writing—original draft preparation, K.C.; writing—review and editing, K.I.M.; project administration, K.I.M.; funding acquisition, K.I.M. All authors have read and agreed to the published version of the manuscript.
Funding
This research was funded by the U.S. National Science Foundation, grant numbers 2214235 and 2244082.
Data Availability Statement
The data presented in this study are available on request from the corresponding author.
Conflicts of Interest
The authors declare no conflicts of interest.
References
- Shenton, M.; Leachman, J.W.; Matveev, K.I. Investigating Taconis oscillations in a U-shaped tube with hydrogen and helium. Cryogenics 2024, 143, 103940. [Google Scholar] [CrossRef]
- Conroy, K.; Matveev, K.I. Acoustic losses in cryogenic hydrogen at transitions between tubes of different diameters. Hydrogen 2025, 6, 25. [Google Scholar] [CrossRef]
- Iguchi, M.; Ohmi, M. Analysis of free oscillating flow in a U-shaped tube. Bull. JSME 1982, 25, 1398–1405. [Google Scholar] [CrossRef]
- Idelchik, I. Handbook of Hydraulic Resistance; Begell House: New York, NY, USA, 2003. [Google Scholar]
- Swift, G. Thermoacoustics: A Unifying Perspective for Some Engines and Refrigerators; Springer: Cham, Switzerland, 2017. [Google Scholar]
- Ward, B.; Clark, J.; Swift, G. Design Environment for Low-Amplitude Thermoacoustic Energy Conversion, DeltaEC Version 6.4b2.7 Users Guide; Los Alamos National Lab Network: Los Alamos, NM, USA, 2017.
- Matveev, K.I. Thermoacoustic energy analysis of transverse-pin and tortuous stacks at large acoustic displacements. Int. J. Therm. Sci. 2010, 49, 1019–1025. [Google Scholar] [CrossRef]
- Crane Co. Flow of Fluids Through Valves, Fittings and Pipes. Metric Edition-SI Units; Technical Paper No. 410M; Crane Co.: New York, NY, USA, 1982. [Google Scholar]
- Hooper, W. Calculate head loss caused by change in pipe size. Chem. Eng. 1988, 7, 89–92. [Google Scholar]
- Doller, A. Acoustic Minor Losses in High Amplitude Resonators with Single-Sided Junctions. Ph.D. Thesis, Pennsylvania State University, University Park, PA, USA, 2004. [Google Scholar]
- King, C.; Smith, B. Oscillating flow in a 2-D diffuser. Exp. Fluids 2011, 51, 1577–1590. [Google Scholar] [CrossRef]
- Ueda, Y.; Yonemitsu, S.; Ohashi, K.; Okamoto, T. Measurement and empirical evaluation of acoustic loss in tube with abrupt area change. J. Acoust. Soc. Am. 2020, 147, 364–370. [Google Scholar] [CrossRef] [PubMed]
- Regier, C. Dynamic Modeling of a Cryogenic System at the Canadian Light Source. Doctoral Thesis, University of Calgary, Calgary, AB, Canada, 2009. [Google Scholar]
- Ding, X.; Kang, H.; Sun, X.; Jiang, Y.; Zhang, L. Research on the effects of resonance tube bending in loop thermoacoustic refrigeration system. Appl. Therm. Eng. 2024, 246, 122985. [Google Scholar] [CrossRef]
- Kurai, Y.; Sekimoto, S.; Ueda, Y. Modeling of components of a traveling-wave thermoacoustic refrigerator taking into account nonlinear losses. Acoust. Sci. Technol. 2025, 46, 286–294. [Google Scholar] [CrossRef]
- Buick, J.; Atig, M.; Skulina, D.; Campbell, D.; Dalmont, J.; Gilbert, J. Investigation of non-linear acoustic losses at the open end of a tube. J. Acoust. Soc. Am. 2011, 129, 1261–1272. [Google Scholar] [CrossRef] [PubMed]
- Su, J.; Yang, D.; Morgans, A. Low-frequency acoustic radiation from a flanged circular pipe at an inclined angle. J. Acoust. Soc. Am. 2022, 151, 1142–1157. [Google Scholar] [CrossRef] [PubMed]
- Su, J.; Rupp, J.; Garmory, A.; Carrotte, J. Measurements and computational fluid dynamics predictions of the acoustic impedance of orifices. J. Sound. Vib. 2015, 352, 174–191. [Google Scholar] [CrossRef]
- Roma, R. Detached Eddy Simulation of an Aircraft Jet Flow using an Open Source CFD. Master’s Thesis, University of Illinois, Chicago, IL, USA, 2020. [Google Scholar]
- Siemens, STAR-CCM+. 2025. Available online: https://plm.sw.siemens.com/en-US/simcenter/fluids-thermal-simulation/star-ccm/ (accessed on 20 July 2025).
- Ferziger, J.H.; Peric, M. Computational Methods for Fluid Dynamics; Springer: Berlin/Heidelberg, Germany, 1999. [Google Scholar]
- Shih, T.; Liou, W.; Shabbir, A.; Yang, Z.; Zhu, J. New k-ɛ eddy viscosity model for high Reynolds number turbulent flows. Comput. Fluids 1995, 24, 227–238. [Google Scholar] [CrossRef]
- Wheeler, M.P.; Matveev, K.I.; Xing, T. Validation study of compact planing hulls at pre-planing speeds. In Proceedings of the 5th Joint US-European Fluids Engineering Summer Conference, ASME, Montreal, QC, Canada, 15–20 July 2018. [Google Scholar]
- Matveev, K.I.; Leachman, J.W. Modeling of liquid hydrogen tank cooled with para-orthohydrogen conversion. Hydrogen 2023, 4, 146–153. [Google Scholar] [CrossRef]
- Chueh, P.L.; Prausnitz, J.M. Vapor-liquid equilibria at high pressures. Vapor-phase fugacity coefficients in nonpolar and quantum-gas mixtures. Ind. Eng. Chem. Fundam. 1967, 6, 492–498. [Google Scholar] [CrossRef]
- Bell, I.; Wronksi, J.; Quoilin, S.; Lemort, V. Pure and pseudo-pure fluid thermophysical property evaluation and the open-source thermophysical property library CoolProp. Ind. Eng. Chem. Res. 2014, 53, 2498–2508. [Google Scholar] [CrossRef] [PubMed]
- Roache, P.J. Verification and Validation in Computational Science and Engineering; Hermosa Publishers: Albuquerque, NM, USA, 1998. [Google Scholar]
- He, L. Fourier methods for turbomachinery applications. Progress. Aerosp. Sci. 2010, 46, 329–341. [Google Scholar] [CrossRef]
- Wang, T.; Lee, C. Radiation pressure and acoustic levitation. In Nonlinear Acoustics; Hamilton, M., Blackstock, D., Eds.; Academic Press: New York, NY, USA, 1998; Chapter 6; pp. 177–204. [Google Scholar]
Disclaimer/Publisher’s Note: The statements, opinions and data contained in all publications are solely those of the individual author(s) and contributor(s) and not of MDPI and/or the editor(s). MDPI and/or the editor(s) disclaim responsibility for any injury to people or property resulting from any ideas, methods, instructions or products referred to in the content. |
© 2025 by the authors. Licensee MDPI, Basel, Switzerland. This article is an open access article distributed under the terms and conditions of the Creative Commons Attribution (CC BY) license (https://creativecommons.org/licenses/by/4.0/).