Article

Consequence Analysis of Liquid Hydrogen Leakage from Storage Tanks at Urban Hydrogen Refueling Stations: A Case Study

1
College of Safety Science and Engineering, Chongqing University of Science and Technology, Chongqing 401331, China
2
Chongqing Academy of Safety Science and Technology, Chongqing 401331, China
3
College of Chemistry and Chemical Engineering, Southwest Petroleum University, Chengdu 610500, China
*
Author to whom correspondence should be addressed.
Hydrogen 2025, 6(3), 58; https://doi.org/10.3390/hydrogen6030058
Submission received: 4 July 2025 / Revised: 14 August 2025 / Accepted: 14 August 2025 / Published: 15 August 2025

Abstract

Hydrogen energy is considered a crucial clean energy carrier for replacing fossil fuels in the future. Liquid hydrogen (LH2), with its economic advantages and high purity, is central to the development of future hydrogen refueling stations (HRSs). However, leakage poses significant fire and explosion risks, challenging its safe industrial use. In this study, a numerical model of LH2 leakage at an HRS in Chongqing was established using Computational Fluid Dynamics (CFD) software. The diffusion law of a flammable gas cloud (FGC) was examined under the synergistic effect of the leakage direction, rate, and wind speed of an LH2 storage tank in an HRS. The phase transition of LH2 presents dual risks of combustion and frostbite owing to the spatial overlap between low-temperature areas and FGCs. The findings revealed that the equivalent stoichiometric gas cloud volume (Q9) reached 685 m3 in the case of crosswind leakage, with the superimposed effect of reflected waves from the LH2 transport vehicle resulting in a peak explosion overpressure of 0.61 bar. The low-temperature hazard area and the FGC (with a concentration of 30–75%) show significant spatial overlap. These research outcomes offer crucial theoretical underpinning for enhancing equipment layout optimization and safety protection strategies at HRSs.

1. Introduction

The historical trajectory of hydrogen production has laid a key foundation for modern hydrogen-energy systems. In 1789, Troostwijk and Deiman demonstrated the electrochemical decomposition of water [1,2]. In 1902, the Reid alkaline electrolytic cell was applied in industry with an efficiency of less than 60% [3]. Driven by relevant policies, subsequent innovations have accelerated. In the 2000s, proton exchange membrane electrolyzers were commercialized, with system efficiencies exceeding 70% [4]. Currently, hydrogen is gradually replacing fossil fuel. The popularization of hydrogen-powered electric vehicles will also significantly improve road air quality [5].
HRSs are the key infrastructure connecting hydrogen production and consumption in the hydrogen energy ecosystem. It undertakes the core function of safely and efficiently transporting upstream hydrogen to end users, such as hydrogen fuel cell vehicles. Currently, approximately 30% of HRSs worldwide use LH2 technology, with its core equipment, the LH2 storage tank, operating at an ultra-low temperature of −253 °C [6,7]. LH2 leakage in HRSs presents critical hazards due to violent flashing, rapid dispersion, an extremely wide flammable range, and minimal ignition energy. These properties lead to abrupt onset, accelerated hazard escalation, extensive impact zones, and severe combustion consequences [8,9,10]. In recent years, leakage and explosion of HRS have occurred frequently. In 2019, a hydrogen storage tank leakage at Jiangling HRS in South Korea led to an explosion, resulting in two fatalities. The following year, equipment damage at Oslo HRS in Norway caused by a storage tank rupture resulted in two severe injuries. Therefore, addressing safety concerns associated with LH2 leakage resulting in accidents is crucial before the widespread adoption of hydrogen energy. These efforts can provide a theoretical basis for the intrinsic safety design, emergency response, and risk management of hydrogen refueling stations, supporting the sustainable development of the hydrogen energy industry.
Haoren et al. [11,12,13,14,15] clarified the suppression of turbulence in the stable atmosphere, the buoyancy uplift of FGCs, and the multiphase flow in the near and far fields surrounding large-scale LH2 container leakage events. Based on the study of leakage and diffusion of LH2 tanks, Winter et al. [16,17,18] analyzed the relationship between the trajectory of low-temperature hydrogen jets and the combustible range and found that the diffusion of FGCs in low-temperature leakage is larger than that in normal temperature. Qian et al. [19,20] studied the influence of key factors such as leakage rate and wind speed in open spaces on the shape and diffusion range of FGCs following leakage from an LH2 storage tank. Sun et al. [21,22] used Ansys Fluent software to simulate the transient evolution of combustible hydrogen clouds caused by leakage from an LH2 storage tank in a hydrogen refueling station, revealing the influence of storage pressure, leakage source height, and leakage direction on FGC distribution. Jiang et al. [23,24,25] found that protective wall design at HRSs can effectively block the leakage and diffusion of LH2 storage tanks, with the influence of different wall sizes on FGC diffusion being significantly different. Among them, Hansen et al. [26,27,28] verified the effectiveness of the pseudo-source model and, using FLACS software, studied the effects of wind speed, temperature, and leakage rate on the leakage and diffusion of LH2 containers in HRSs. Based on the above research, the pseudo-source model offers the advantage of avoiding the complex near-field processes and physical limitations of LH2 release, enabling the gas-phase solver to simulate subsequent diffusion. Therefore, a pseudo-source model was utilized for simulating the diffusion and potential explosion consequences of LH2 storage tanks in HRS under typical leakage conditions.
Following LH2 release and dispersion, mixing with air forms an FGC, where delayed ignition frequently triggers explosions. Extensive research has elucidated explosion mechanisms and critical influencing factors using integrated experimental, theoretical, and computational approaches. Shang et al. [29,30,31] conducted a series of experimental and numerical studies exploring the hydrogen explosion mechanism and the main factors leading to the failure of hydrogen explosion suppression devices. Hu et al. [32] investigated the leakage, diffusion, and explosion behavior of LH2 in tunnels and found that the overpressure generated by an LH2 explosion under such conditions exceeds 50 bar, and the temperature exceeds 2500 °C, far exceeding the hazards caused by gaseous hydrogen leakage. Shen et al. [33,34] performed CFD simulations of LH2 leakage in HRSs followed by ignition, discovering that explosion consequences are most severe when the equivalent stoichiometric cloud volume, explosion overpressure, and damage area are maximized. Yang et al. [35] simulated the leakage explosion of China’s first LHRS and concluded that the explosion hazard distance increased first and then decreased with the wind speed, and the upwind diffusion would aggravate the explosion risk. Compared to gaseous hydrogen, LH2 leakage events induce significantly more severe explosion consequences due to cryogenic phase-transition effects. Impact severity is modulated by ignition parameters, release dynamics, and spatial confinement. Consequently, comprehensive characterization of combustion behavior in HRS-based LH2 storage systems represents a critical research imperative.
Yang et al. [36] analyzed, through full-scale CFD simulation of an HRS, the influence of building and equipment layout on the diffusion path of hydrogen jets, concentration distribution of the leaking FGC, proposing corresponding safety protection strategies. Chen et al. [37] optimized, through CFD modeling, the distribution of HRS dispensers during peak hours and the positioning of HRSs in pipeline and truck transportation networks. Yang et al. [38] systematically classified LHRS process layouts according to different pressurization methods and proposed corresponding management strategies, focusing primarily on key factors affecting the stable operation of the LH2 pump. Li et al. [39] studied, through CFD simulation, the diffusion patterns of hydrogen leakage and the minimum explosion safety distance for mobile HRSs. Zhou et al. [40] designed two new dispenser roof structures to mitigate the consequences of internal leakage and explosion of main HRS components and proposed setting the safe distance between dispensers to 6.8 m. Wang et al. [41] simulated the hydrogen storage container leakage and explosion using CFD software and concluded that top vent placement provides better safety protection. While current research has optimized HRS equipment configuration and safety design, insufficient attention has been devoted to protection strategies against LH2 storage tank leakage explosions. Therefore, targeted safety protection strategies are proposed based on leakage diffusion and explosion consequences.
In summary, current research has predominantly focused on single-factor influences governing LH2 leakage and dispersion, treating leakage behavior and explosion processes as independent phenomena. A significant knowledge gap exists regarding the complete process of delayed FGC ignition following LH2 storage tank leaks in HRSs. To address this issue, a dynamic leakage dispersion model considering the synergistic effects of leakage direction, rate, and wind speed for HRS-based LH2 tanks was established, revealing multifactor influences on FGC formation range, concentration distribution, and migration patterns within HRS environments. CFD and explosion overpressure modeling were integrated to quantitatively characterize shockwave propagation from delayed ignition across leakage directions (downwind, upwind, crosswind), enabling the identification of high-risk orientations. Safety strategies were formulated to minimize FGC accumulation, prevent cryogenic hazards, and mitigate post-explosion damage to HRS infrastructure. This approach can provide foundational support for LH2 leakage risk assessments and design at urban HRSs.

2. Methods

2.1. Physical Model

A geometric model was established based on an HRS in an industrial park in Chongqing. The station includes a compressor room, control room, multiple hydrogen storage tanks, and hydrogen refueling dispensers. The station also includes an LH2 storage tank with a volume of 100 m3, a storage pressure of 3 bar, and storage temperature of −253 °C as well as supporting LH2 pumps and vaporizers. The east–west and north–south axial dimensions of the HRS are 60 m and 40 m, respectively. The model defines the −x axis as positive from west to east, the −y axis as positive from south to north, and the −z axis as vertically upward. To carry out refined numerical analysis of the consequences of LH2 leakage, the calculation domain is extended to 90 m × 110 m × 30 m to comprehensively evaluate the impact of potential leakage hazards on the surrounding environment. The LHRS model is shown in Figure 1.

2.2. Numerical Model

2.2.1. Pseudo-Source Model

The pseudo-source model is a simplified calculation method. It ignores the evaporation process of LH2 droplets and instantaneously equates the leakage source to the initial parameters of a gaseous plume. The detailed calculation procedure is described below.
Based on the relationship between storage tank pressure and ambient pressure, the outlet mass flow rate of liquid hydrogen is calculated using Bernoulli’s equation.
m 0 = A C 2 ρ 0 P 0 P a t m
where P0 represents the storage pressure in pascals (Pa), Patm denotes the ambient pressure in pascals (Pa), ρ0 stands for the density of liquid hydrogen under storage conditions in kilograms per cubic meter (kg/m3), A represents the area of the leakage orifice in square meters (m2), m0 signifies the initial mass flow rate of liquid hydrogen at the orifice in kilograms per second (kg/s), and C denotes the discharge coefficient.
The flash evaporation mass fraction of LH2 was quantitatively assessed using energy conservation principles, which assert that the total energy prior to leakage equals the combined energies of the gas and liquid phases post-flash evaporation. The outlet leakage velocity was then determined via the volumetric flow rate equation. The outlet leakage velocity was then determined using the volumetric flow rate equation.
m 0 h 0 = x m 0 h g + 1 x m 0 h 1
v 0 = x m 0 ρ g + 1 x m 0 ρ 1 A
where h0 represents the initial specific enthalpy of liquid hydrogen in the storage tank (J/kg), hg denotes the specific enthalpy of gaseous hydrogen post-leakage (J/kg), hl denotes the specific enthalpy of gaseous hydrogen post-leakage (J/kg), x indicates the mass fraction of gaseous hydrogen after flash evaporation, v0 stands for the average flow velocity at the leakage orifice (m/s), and ρ1 and ρg represent the densities of liquid and gaseous hydrogen under ambient pressure (kg/m3), respectively.
The quantity of air required to evaporate the residual liquid hydrogen following LH2 leakage is calculated based on the thermal equilibrium conditions observed during flash evaporation.
1 x m 0 γ = m a i r C p T T s a t
where γ represents the latent heat of vaporization of liquid hydrogen (LH2) in kJ/kg, mair denotes the mass of air needed to evaporate the remaining LH2 in kg, Cp is the specific heat capacity of air at constant pressure in kJ/kg·K, and T and Tsat indicate the ambient temperature and the saturation temperature of LH2 at ambient pressure (−253 °C), respectively.
The velocity of the pseudo-source plume entraining air was estimated using the law of momentum conservation. It was found to be lower than the actual outlet velocity. Subsequently, the pseudo-source area near the outlet was calculated and defined.
v i = m 0 v 0 m 0 + m a i r
A i = m 0 ρ g + m a i r ρ m a i r v i
where vi represents the pseudo-source velocity (m/s); Ai represents the pseudo-source area (m2); and ρmair represents the air density (kg/m3).

2.2.2. Model Validation

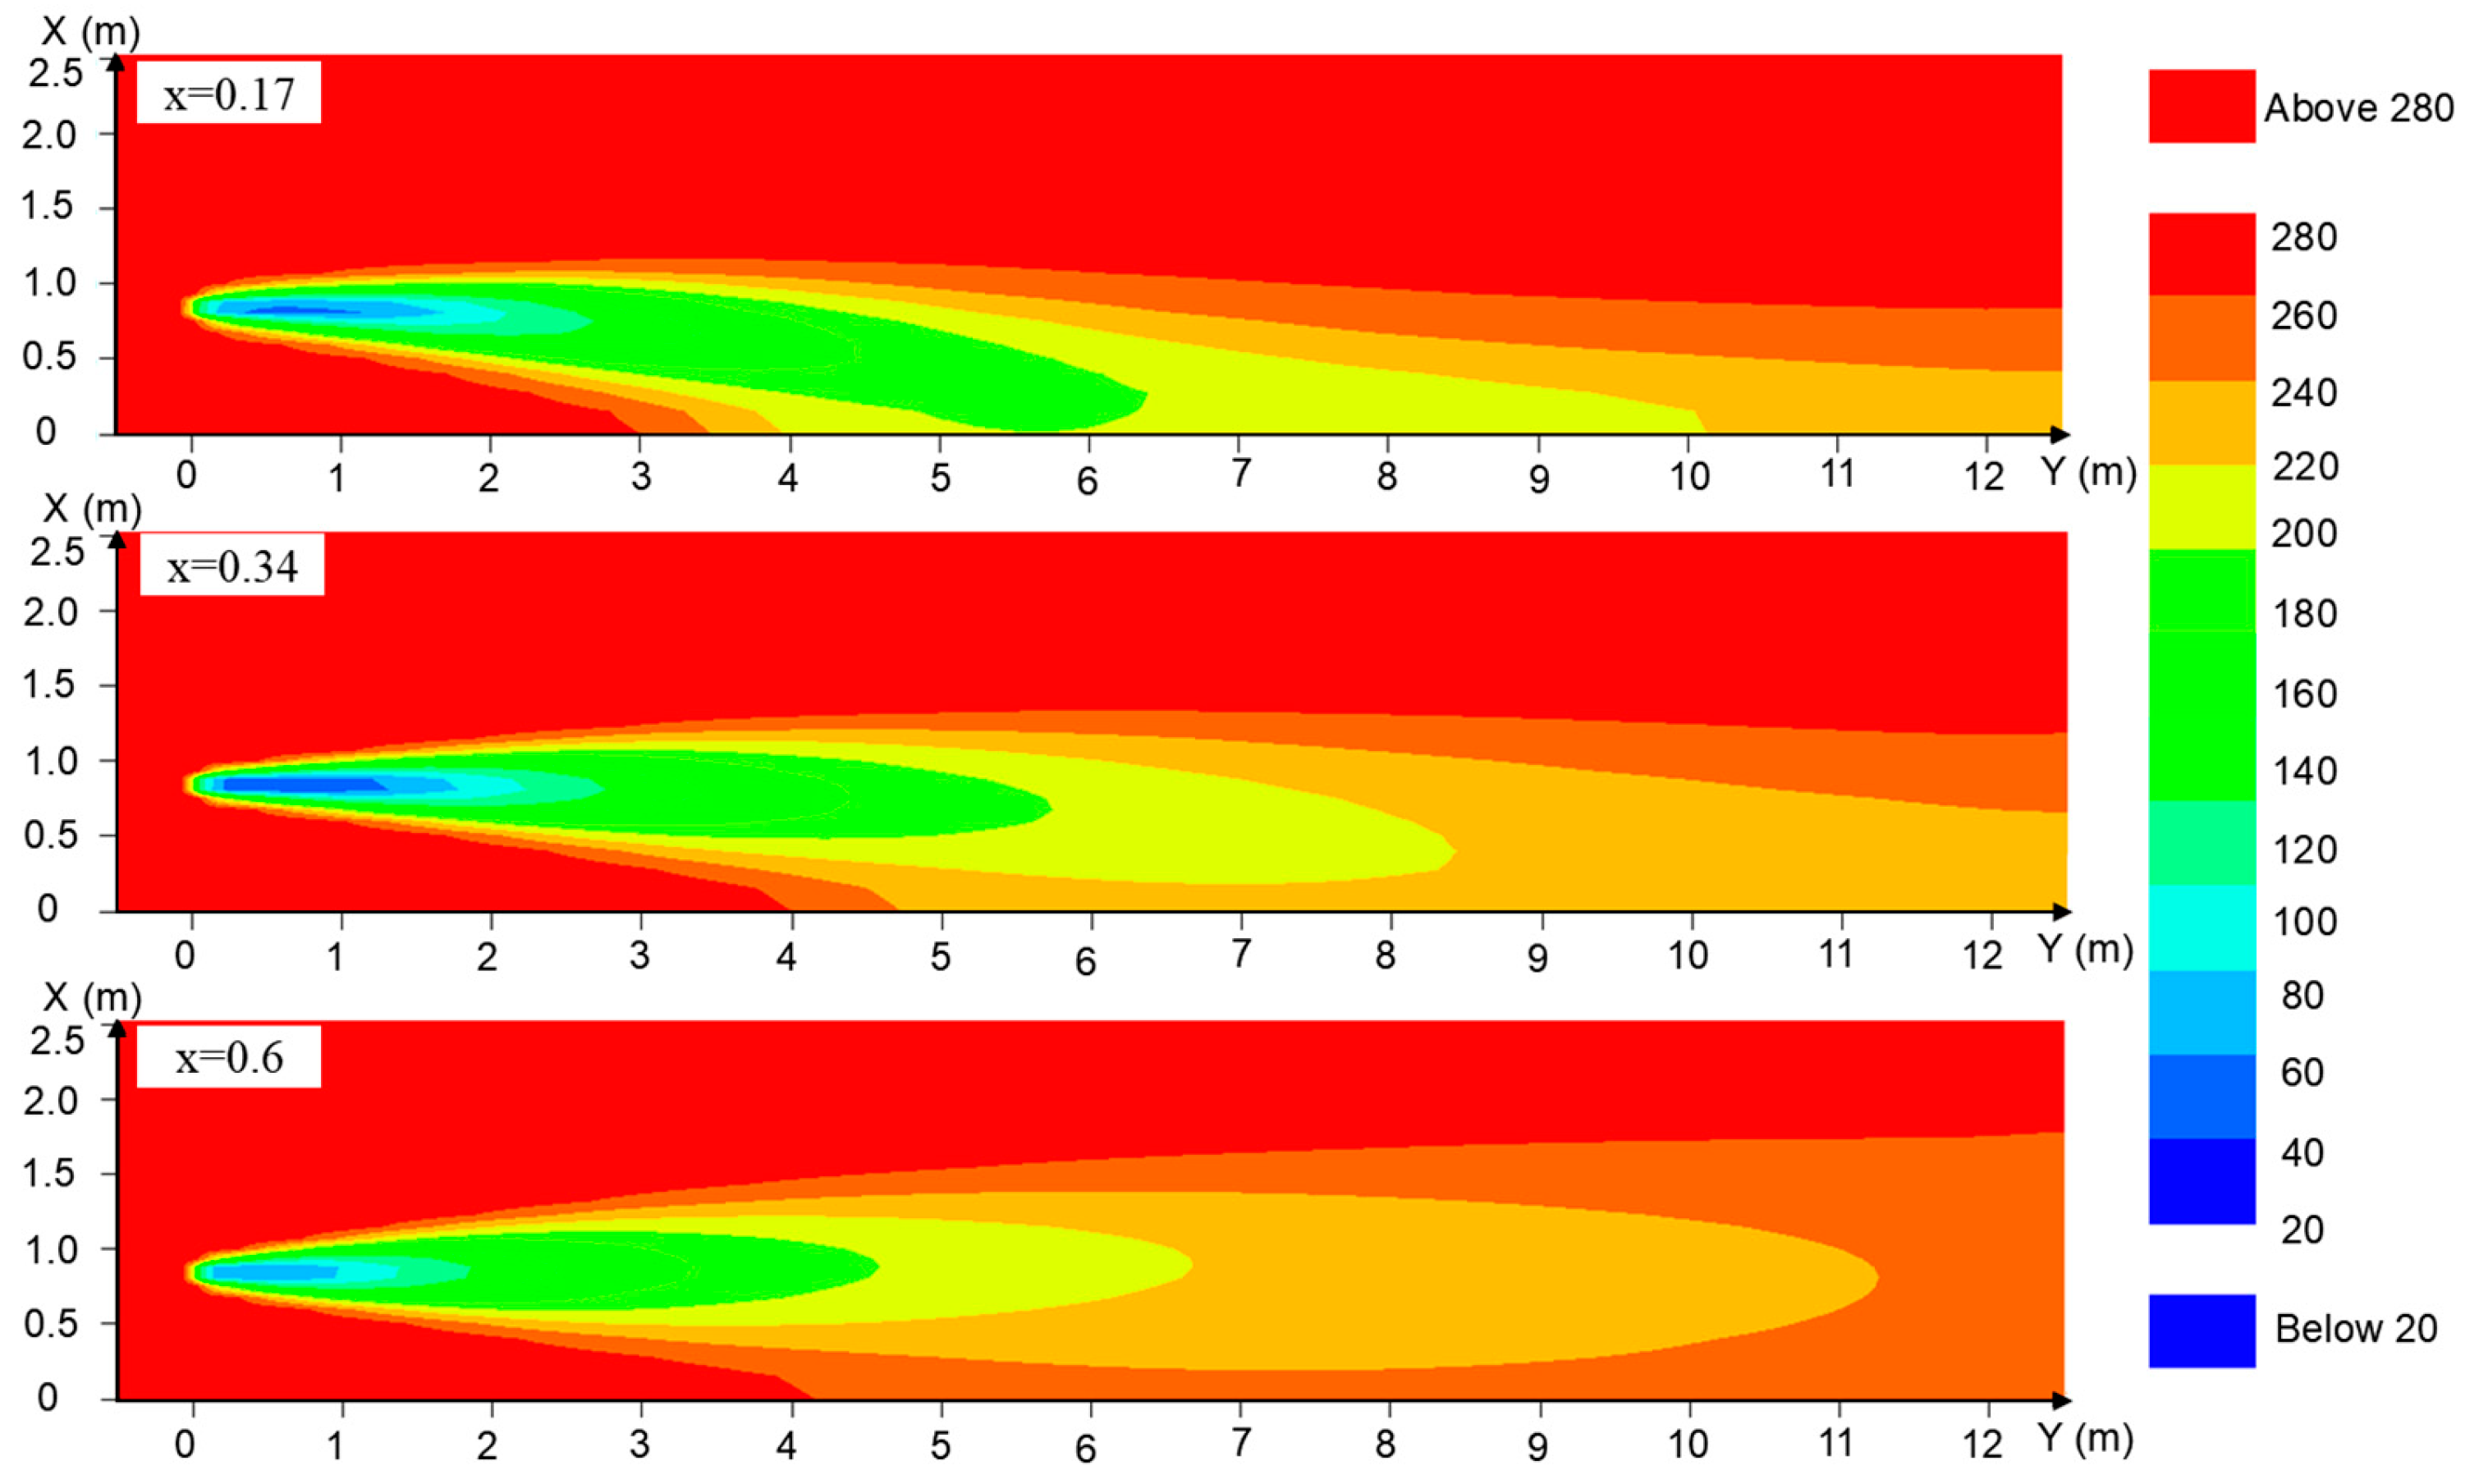
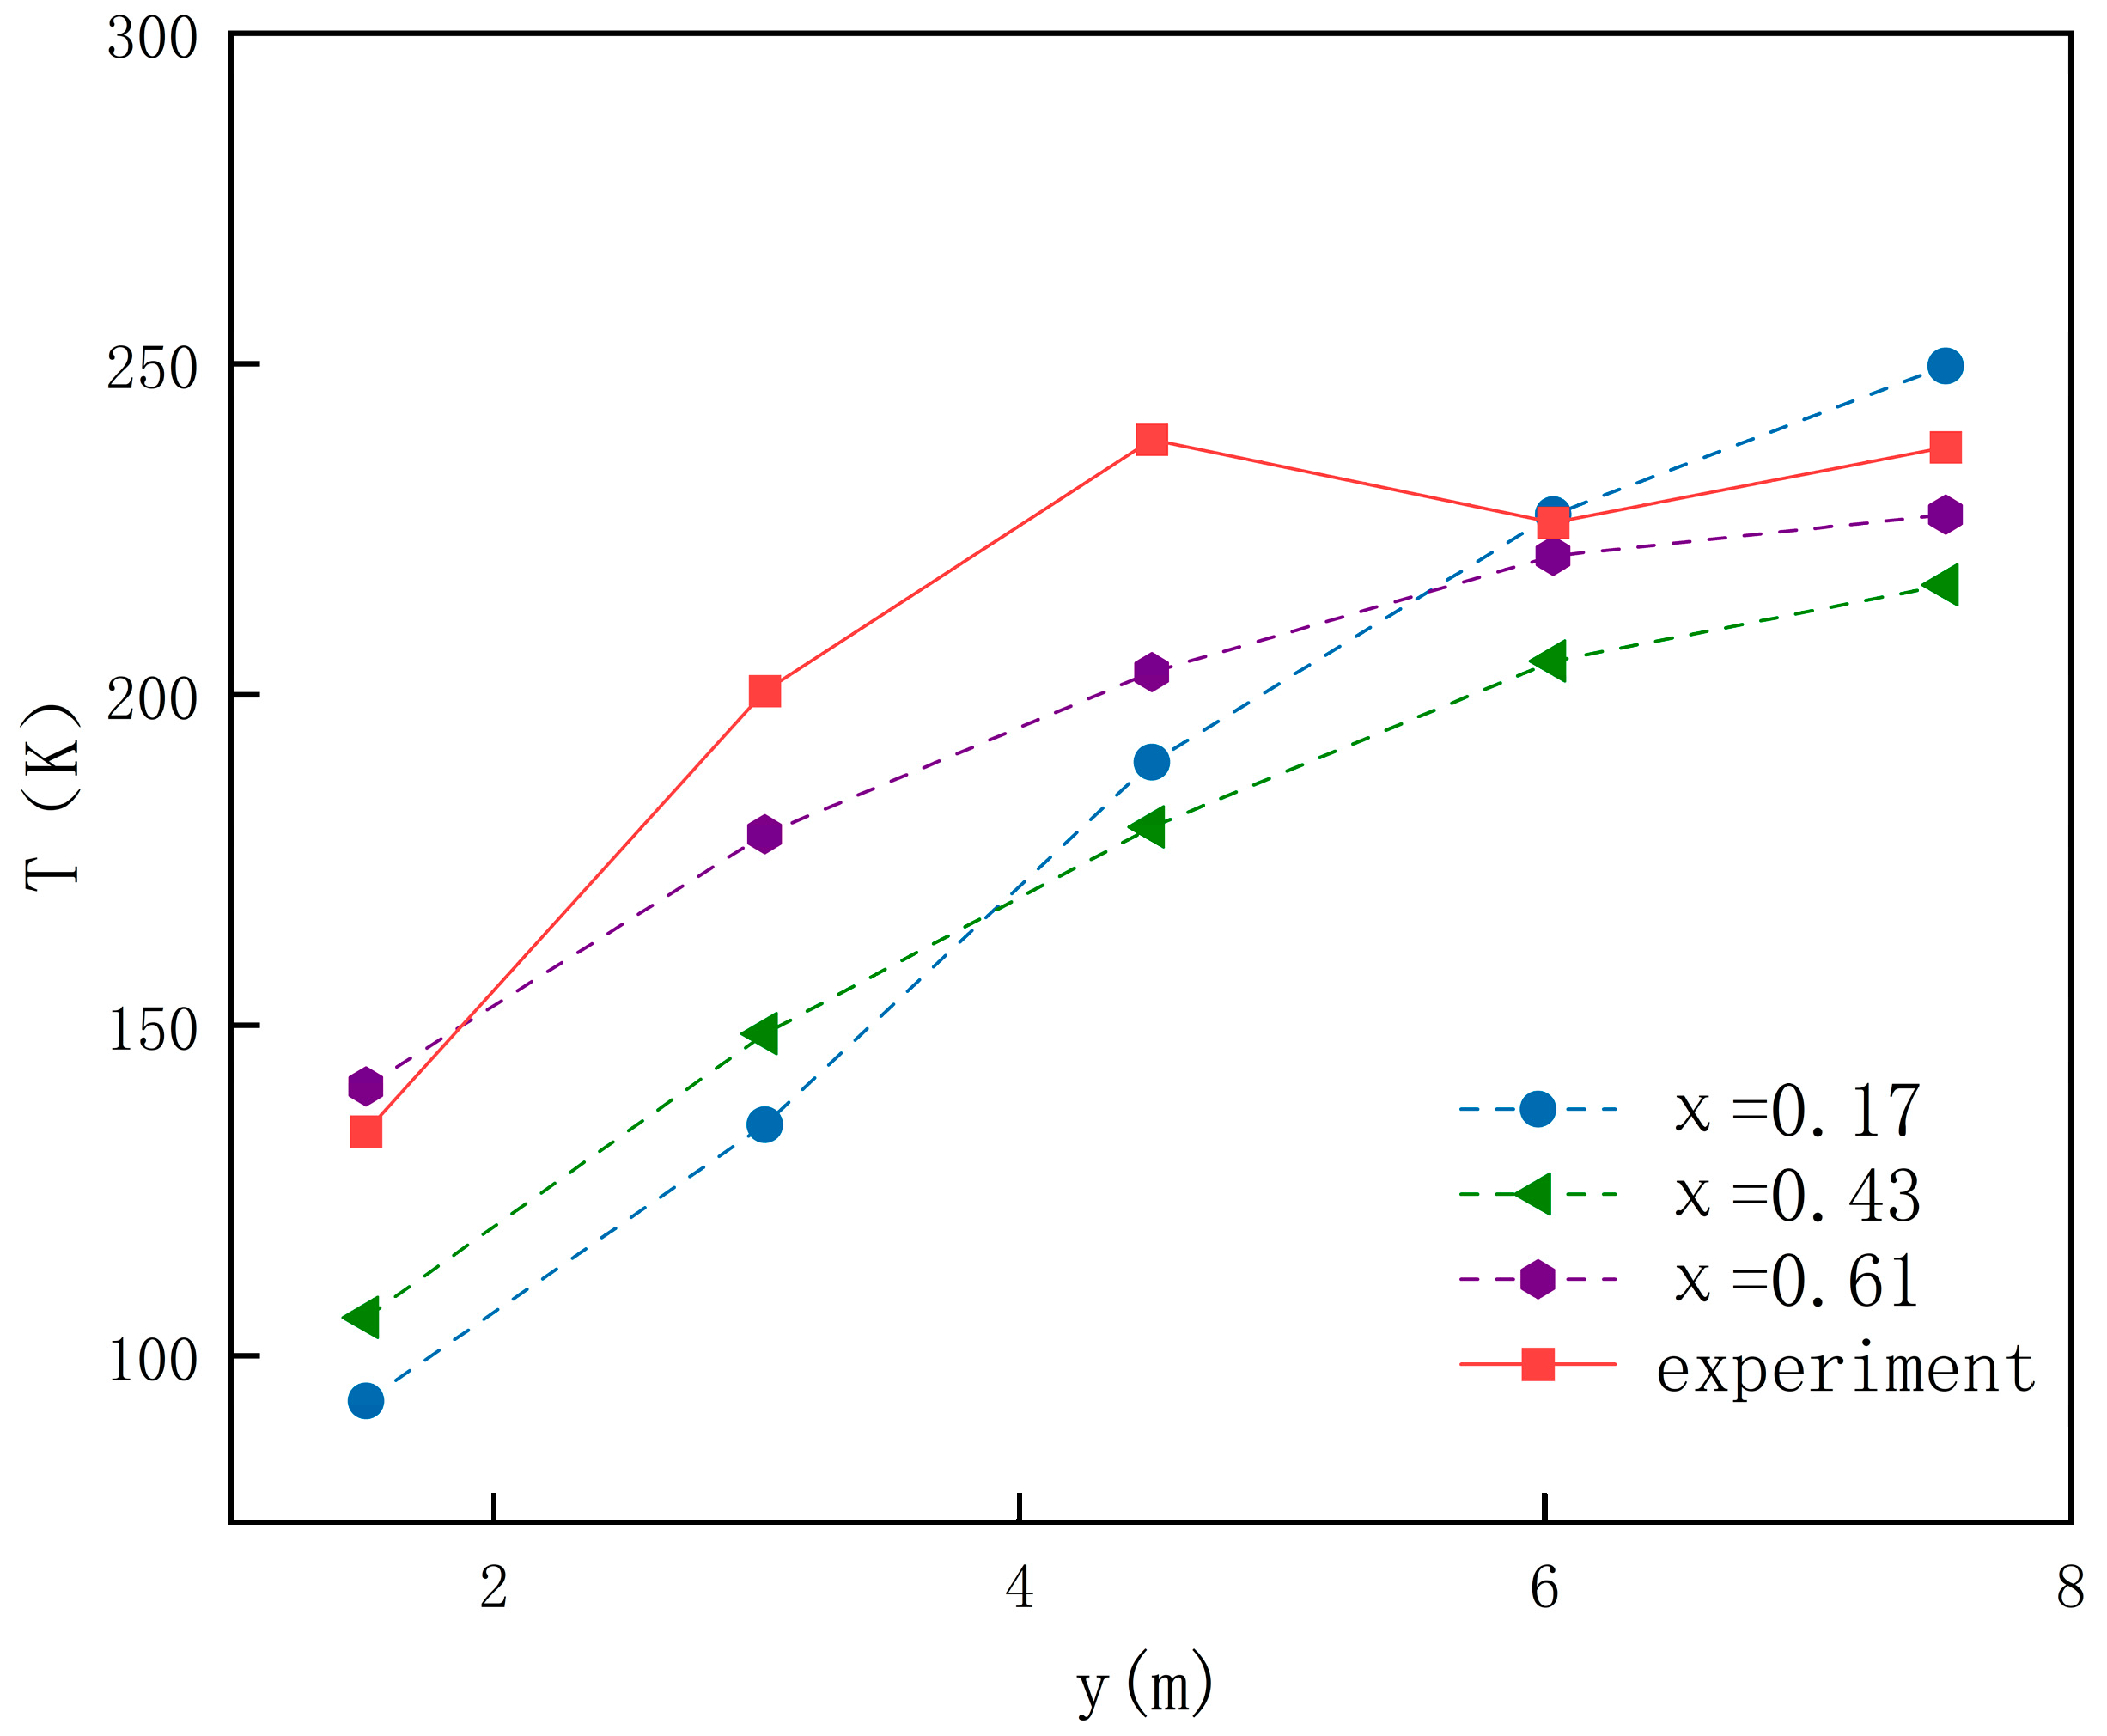
LH2 leakage experiments are costly and pose high risks. Thus, a pseudo-source model was used to simulate the Health and Safety Laboratory (HSL) test 7. The pseudo-source method was employed to estimate various hydrogen mass fractions for the calculations, with specific source term parameters detailed in Table 1. Validation outcomes are depicted in Figure 2, revealing close agreement between numerical simulations and experimental results at a hydrogen mass fraction of 0.6. The temperature deviation at a height of 0.75 m relative to experimental values fell within the 10% confidence interval, as illustrated in Figure 3, consistent with the validation conducted in Reference [29]. Both experimental observations and simulations concurred that the plume during the initial stage of LH2 leakage was primarily influenced by the cryogenic heavy-gas effect, displaying characteristic heavy-gas diffusion behavior. The spatial evolution pattern differed significantly from the buoyancy-driven diffusion of pressurized hydrogen.

2.3. Model Parameter

Chongqing generally experiences an average annual temperature of 17.7 °C, with prevailing southwest winds. The average wind speed at a height of 10 m is 1.1 m/s, with calm wind occurrences being notable. An increase in the ambient temperature accelerates the gasification of LH2. However, it has little impact on the concentration of FGCs formed after LH2 leaks. Thus, 20 °C was selected as the reference temperature in this study. Southwest winds are introduced via the YHI and XLO boundaries using WIND boundary conditions for inflow in the parallel direction. The remaining boundaries are designated as NOZZLE, with the leakage type specified as ‘JET’. However, the boundary conditions for the diffusion process are inapplicable to explosion calculations, necessitating adjusted explosion boundary conditions detailed in Table 2. The inlet boundary conditions are set based on Pasquill–Gifford stability class “D”. According to NFPA 2 hydrogen technical specifications, the initial 60 s after FGC formation are critical for intervention [42]. Therefore, the first 5 s of the simulation is used to establish a stable wind field, with leakage occurring from 5 s to 65 s, enabling a coordinated simulation of the dynamic wind field balance and the pre-leakage diffusion steady state.

2.4. Simulation Condition Parameters

Given that the research object is an open-air HRS, the core risk in its disaster prevention and control lies in chain accidents caused by the horizontal distribution of key facilities. Thus, this study focuses on analyzing the horizontal leakage direction of liquid hydrogen. Based on the physical model of the HRS, three representative leakage directions were selected as key analysis scenarios: upwind (−y), downwind (+y), and crosswind (−x). By varying the leakage apertures and initial pressures, two steady-state leakage mass flow rates were established: a low rate of 0.5182 kg/s and a high rate of 1.0329 kg/s. To characterize the LH2 dispersion behavior and associated risks, wind speeds of 1 m/s (low-speed weak disturbance) and 3 m/s (high-speed strong convection) were designated as boundary conditions. Using these three key parameters, an orthogonal experimental design method was employed to configure 12 sets of representative leakage scenarios, as detailed in Table 3.

3. Results and Discussion

3.1. Dispersion Characteristics of LH2 Leakage

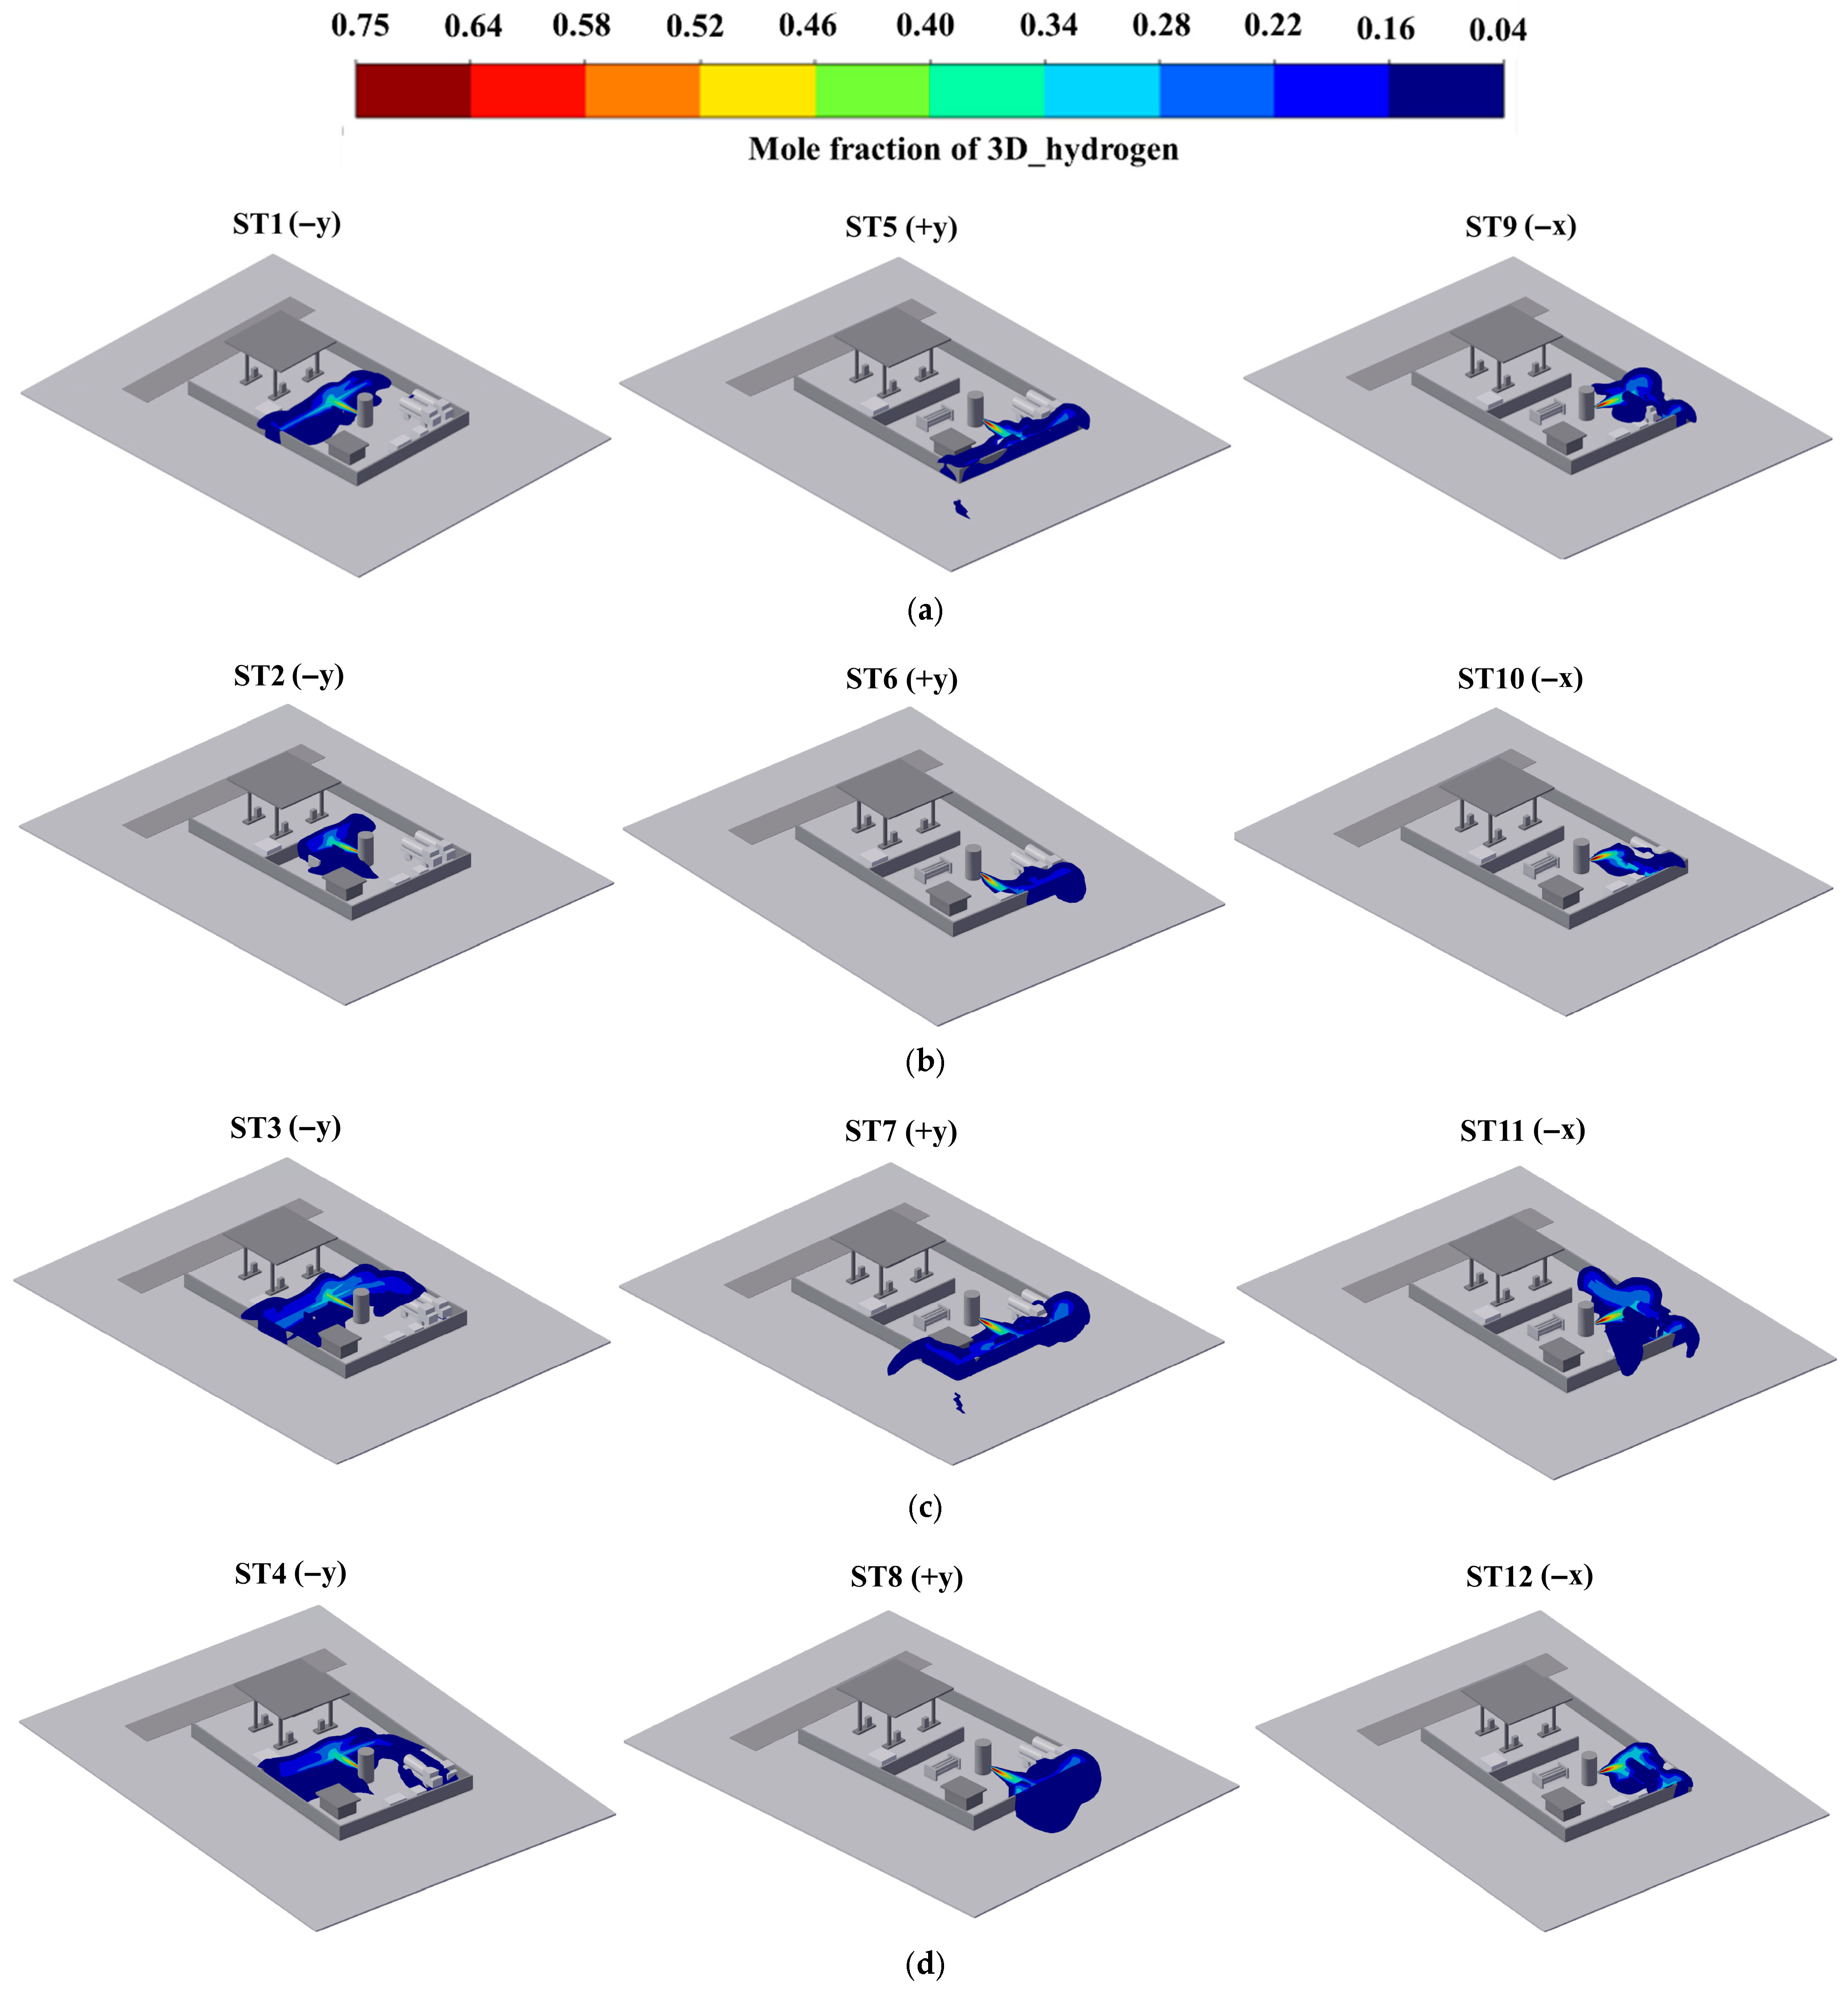
Figure 4 illustrates the spatial distribution of hydrogen within the combustible concentration range (4–75%) 60 s after an LH2 storage tank leakage at the HRS under 12 predetermined conditions. A comparative analysis of the sub-figures reveals that the precise leakage source location, prevailing wind direction, wind speed, and leak rate significantly influence the initial path of hydrogen diffusion, the area of high-concentration FGC accumulation, and the extent of the flammable hazard zone.

3.1.1. The Diffusion Characteristics of FGCs

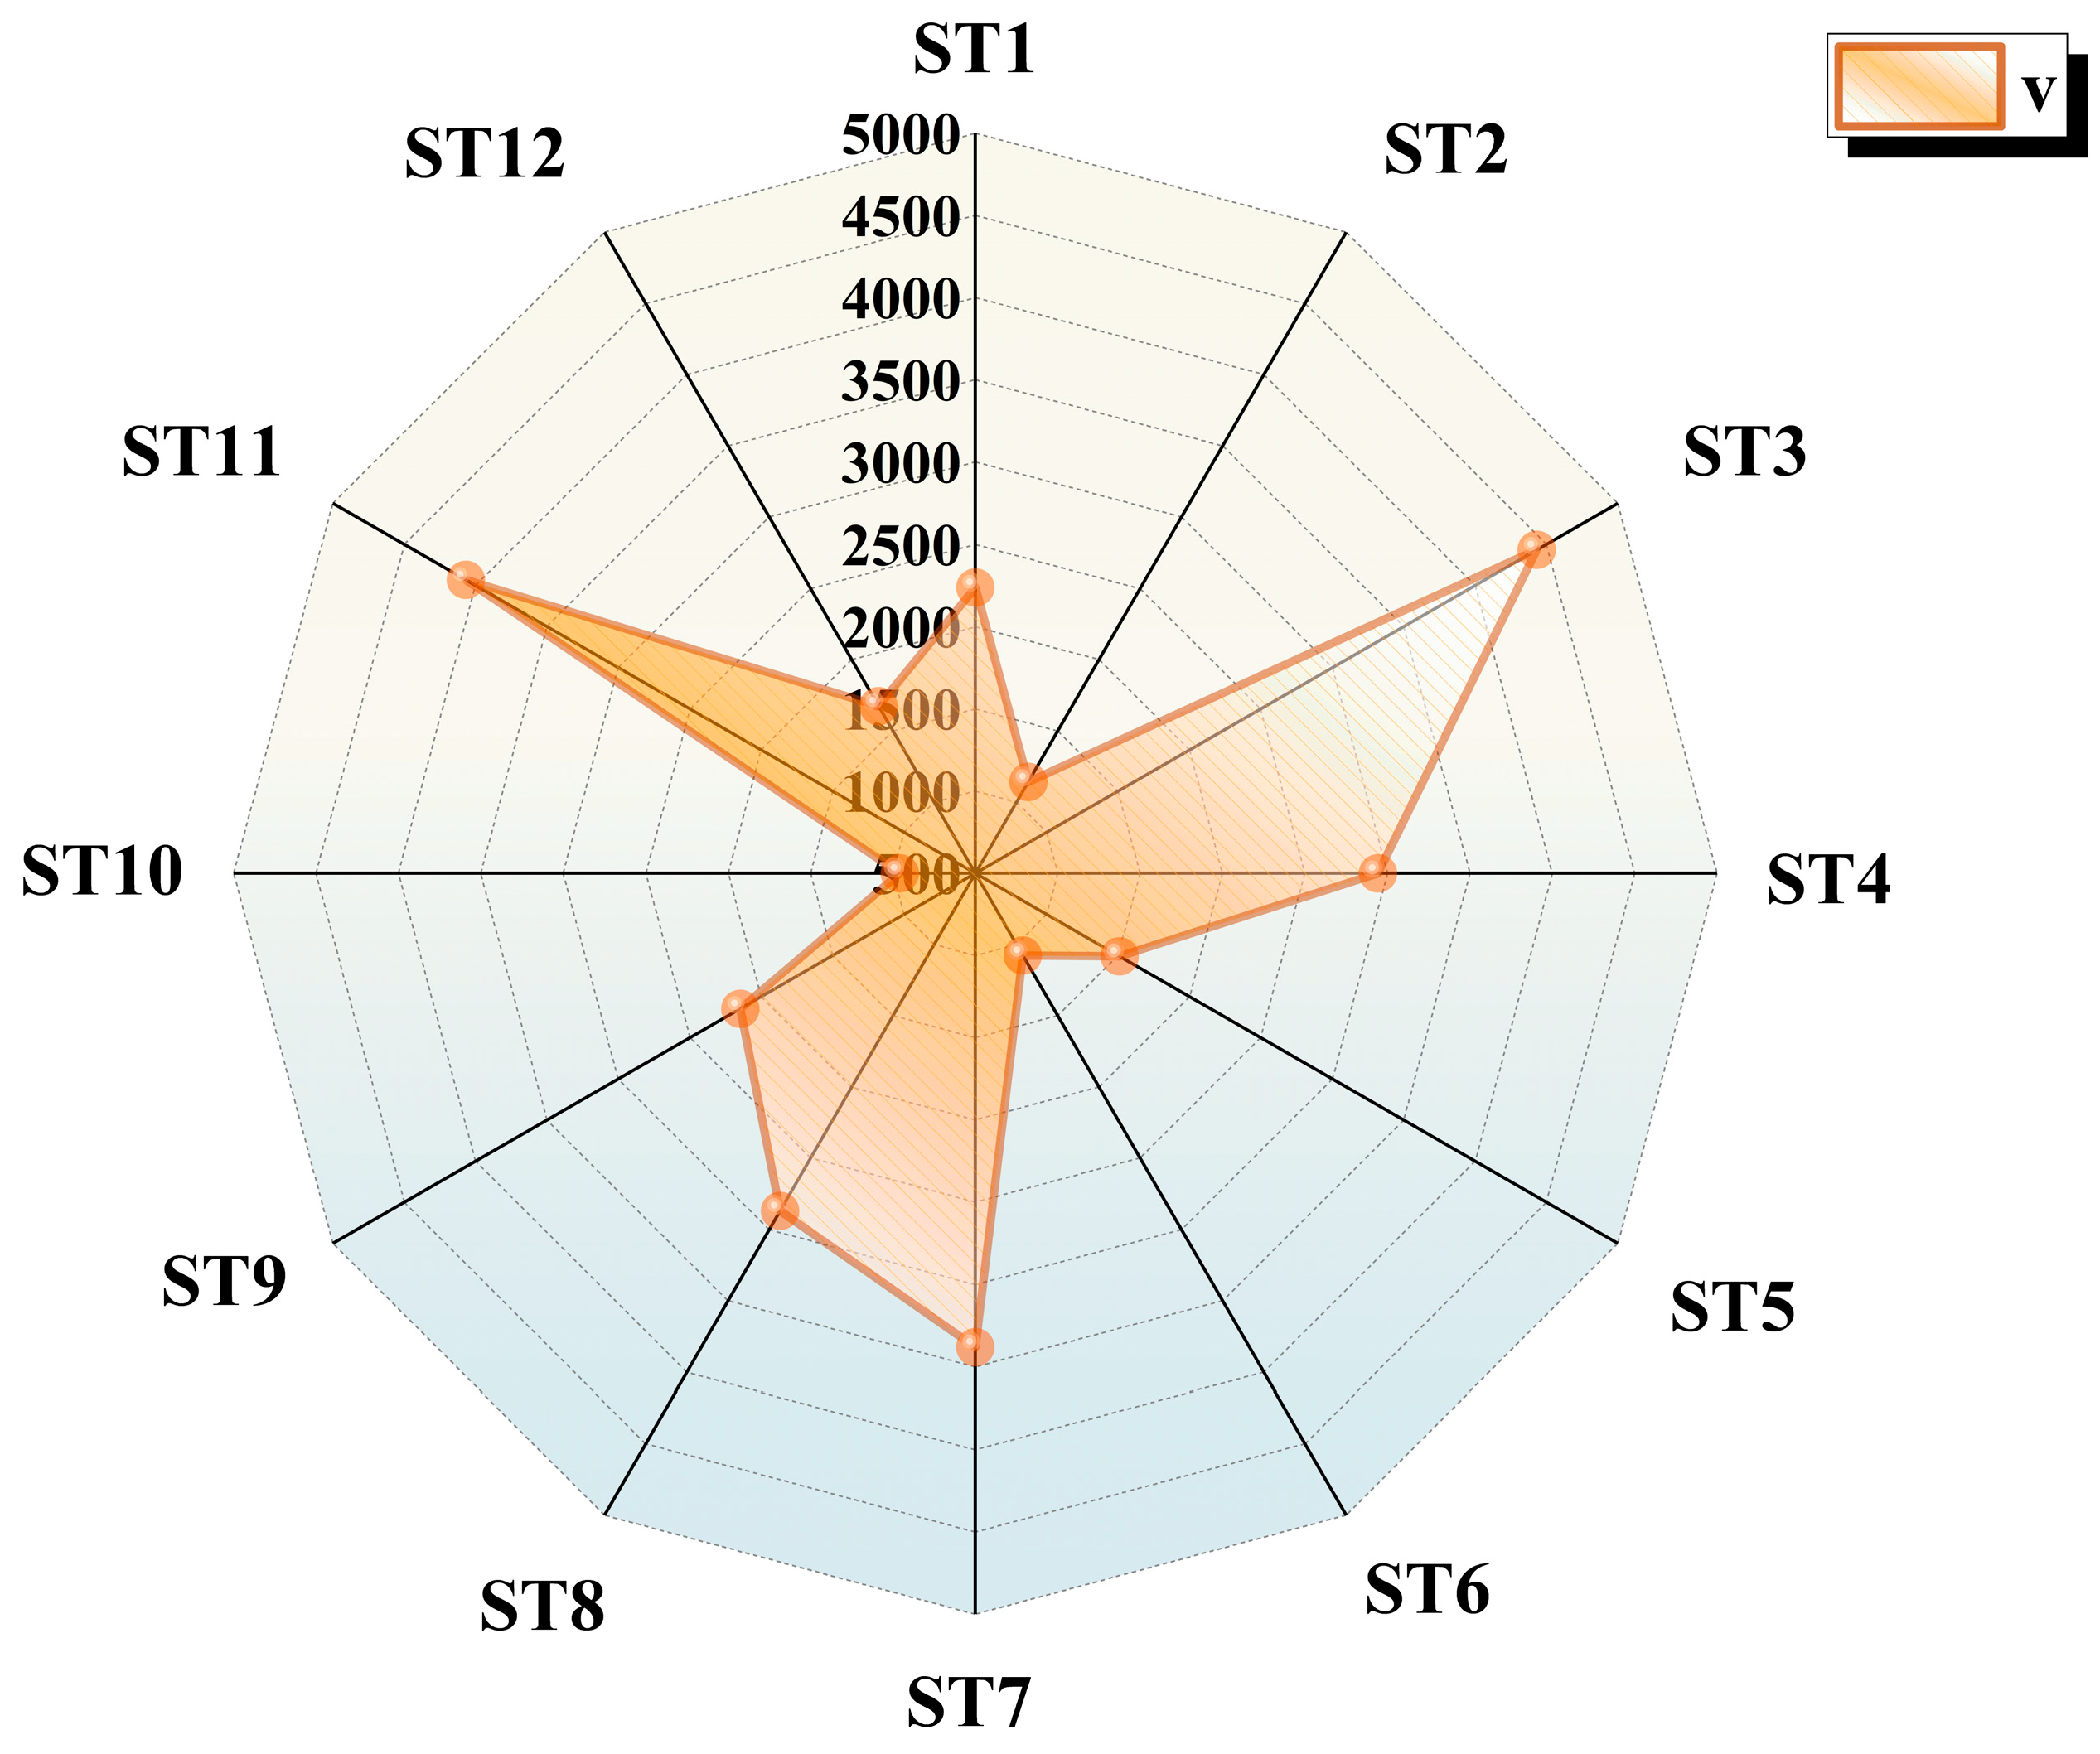
Under coupled low-leakage conditions (0.5182 kg/s) and weak wind fields (ambient wind speed of 1 m/s), buoyancy dominated hydrogen dispersion. Insufficient ambient turbulence intensity reduces turbulent mixing efficiency, resulting in isotropic dispersion of FGC. The maximum downwind dispersion distance reached 49 m under these conditions, approximately 1.8 times greater than that at a wind speed of 3 m/s, as depicted in Figure 4a. Conversely, under strong wind conditions (ambient wind speed of 3 m/s), the hydrogen is driven downstream, resulting in a significant reduction in the downwind diffusion range to 16 m from the leakage point. Concurrently, the FGC shifts vertically, creating a localized accumulation area in the crosswind position, as illustrated in Figure 4b.
When LH2 leakage occurs at a high rate of 1.0329 kg/s under weak ambient wind speed (1 m/s), depicted in Figure 4c, the increased leakage rate intensifies hydrogen diffusion. Consequently, the flammable area expands twofold compared to the low leakage rate scenario. Notably, under these circumstances, the furthest diffusion distance perpendicular to the wind direction reaches 50 m, surpassing distances observed along other wind directions. The hydrogen dispersion manifests as an umbrella-shaped pattern with a concentrated central region and a distinct perimeter. Conversely, under strong ambient wind speed conditions (3 m/s), illustrated in Figure 4d, the wind induces a boundary layer acceleration effect in the downwind direction. This effect compresses the hydrogen dispersion to a 16 m range downwind, thereby reducing the overall diffusion area. In cases of upwind leakage, flow dynamics around obstacles generate a backflow stagnation zone that hinders turbulent dissipation. Consequently, obstructed by obstacles, hydrogen accumulates in a cyclotron pattern near the leakage source, maintaining a combustible volume of 290 m3 (74 m3 larger than the downwind scenario) without a noticeable reduction in range.

3.1.2. Characteristics of Low-Temperature Hazard Area

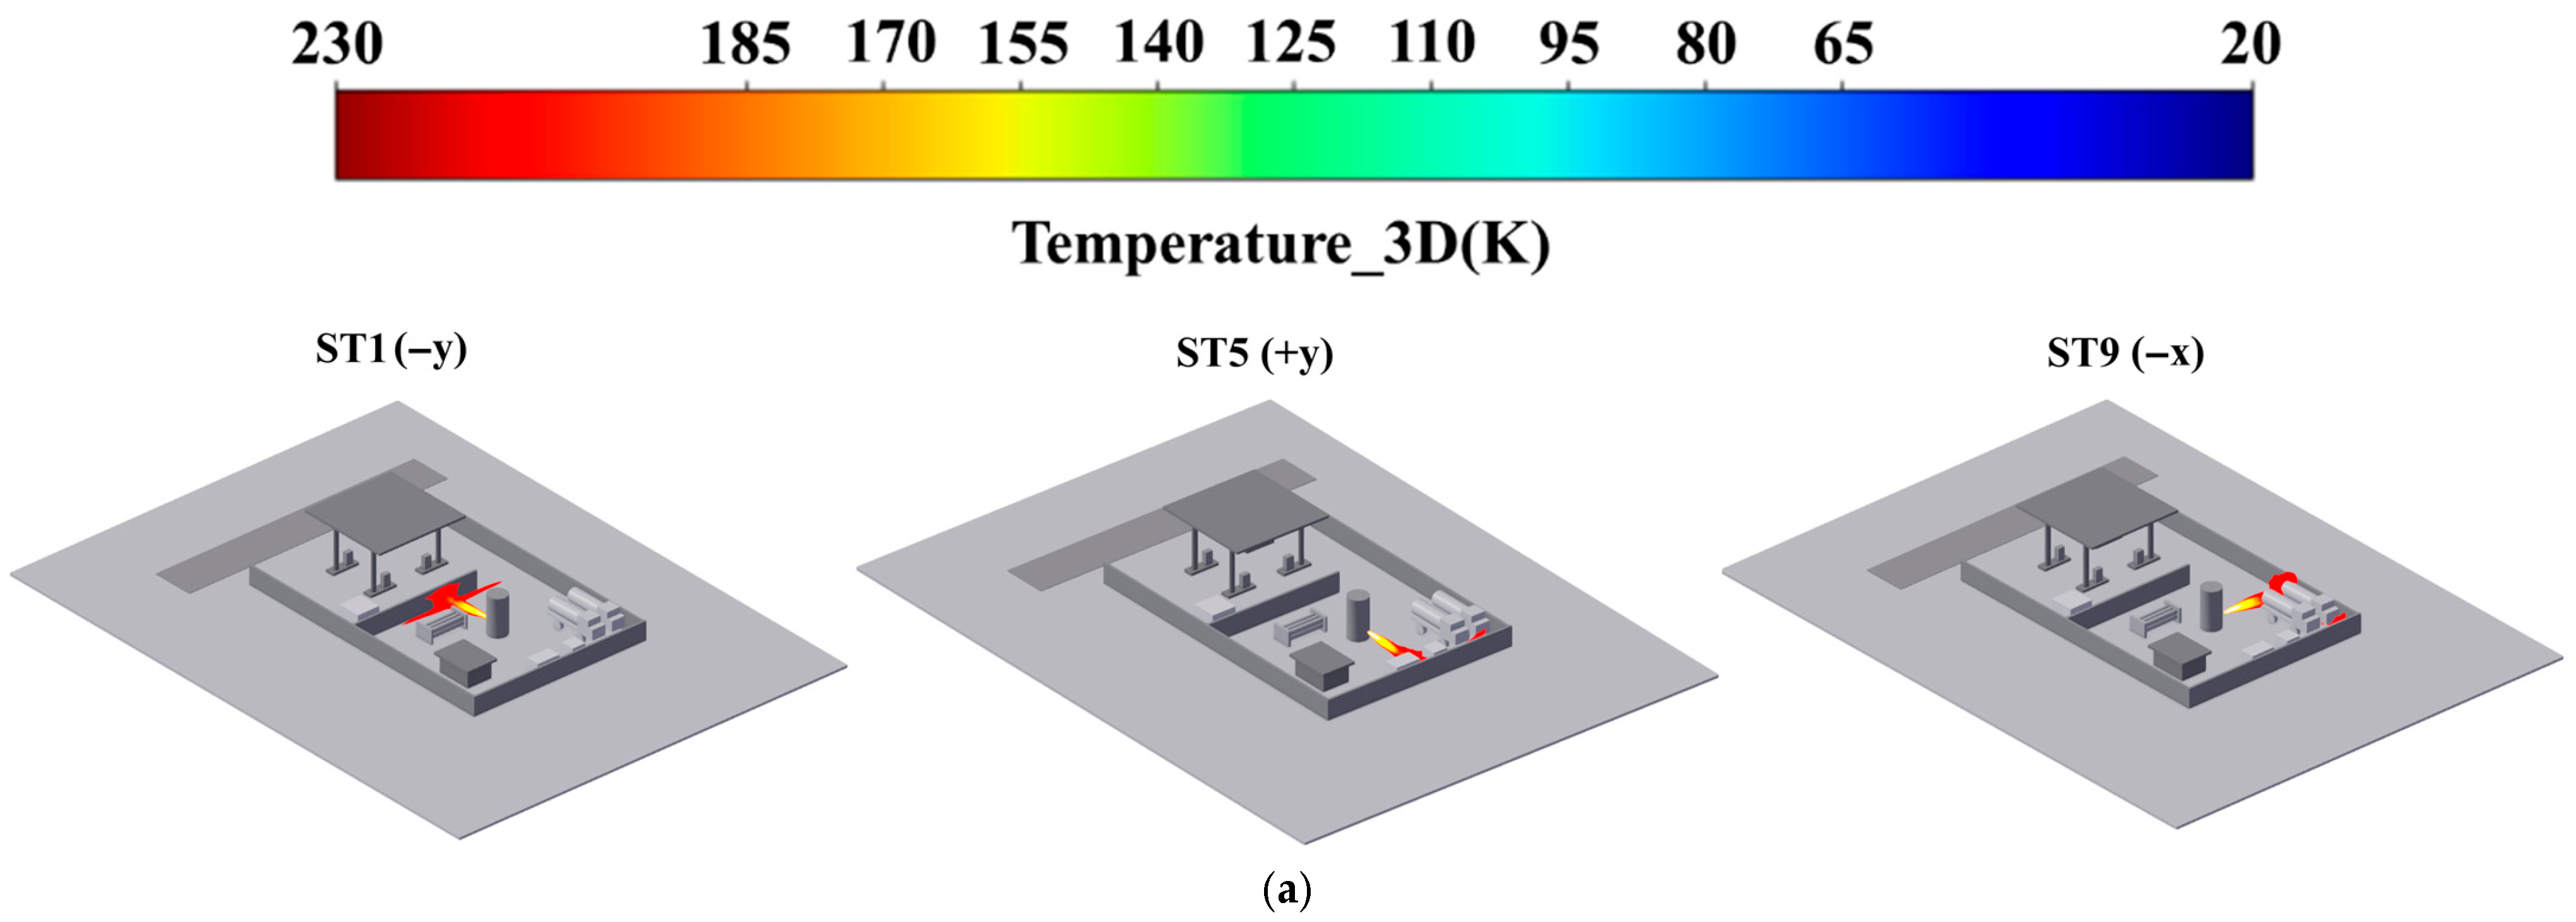
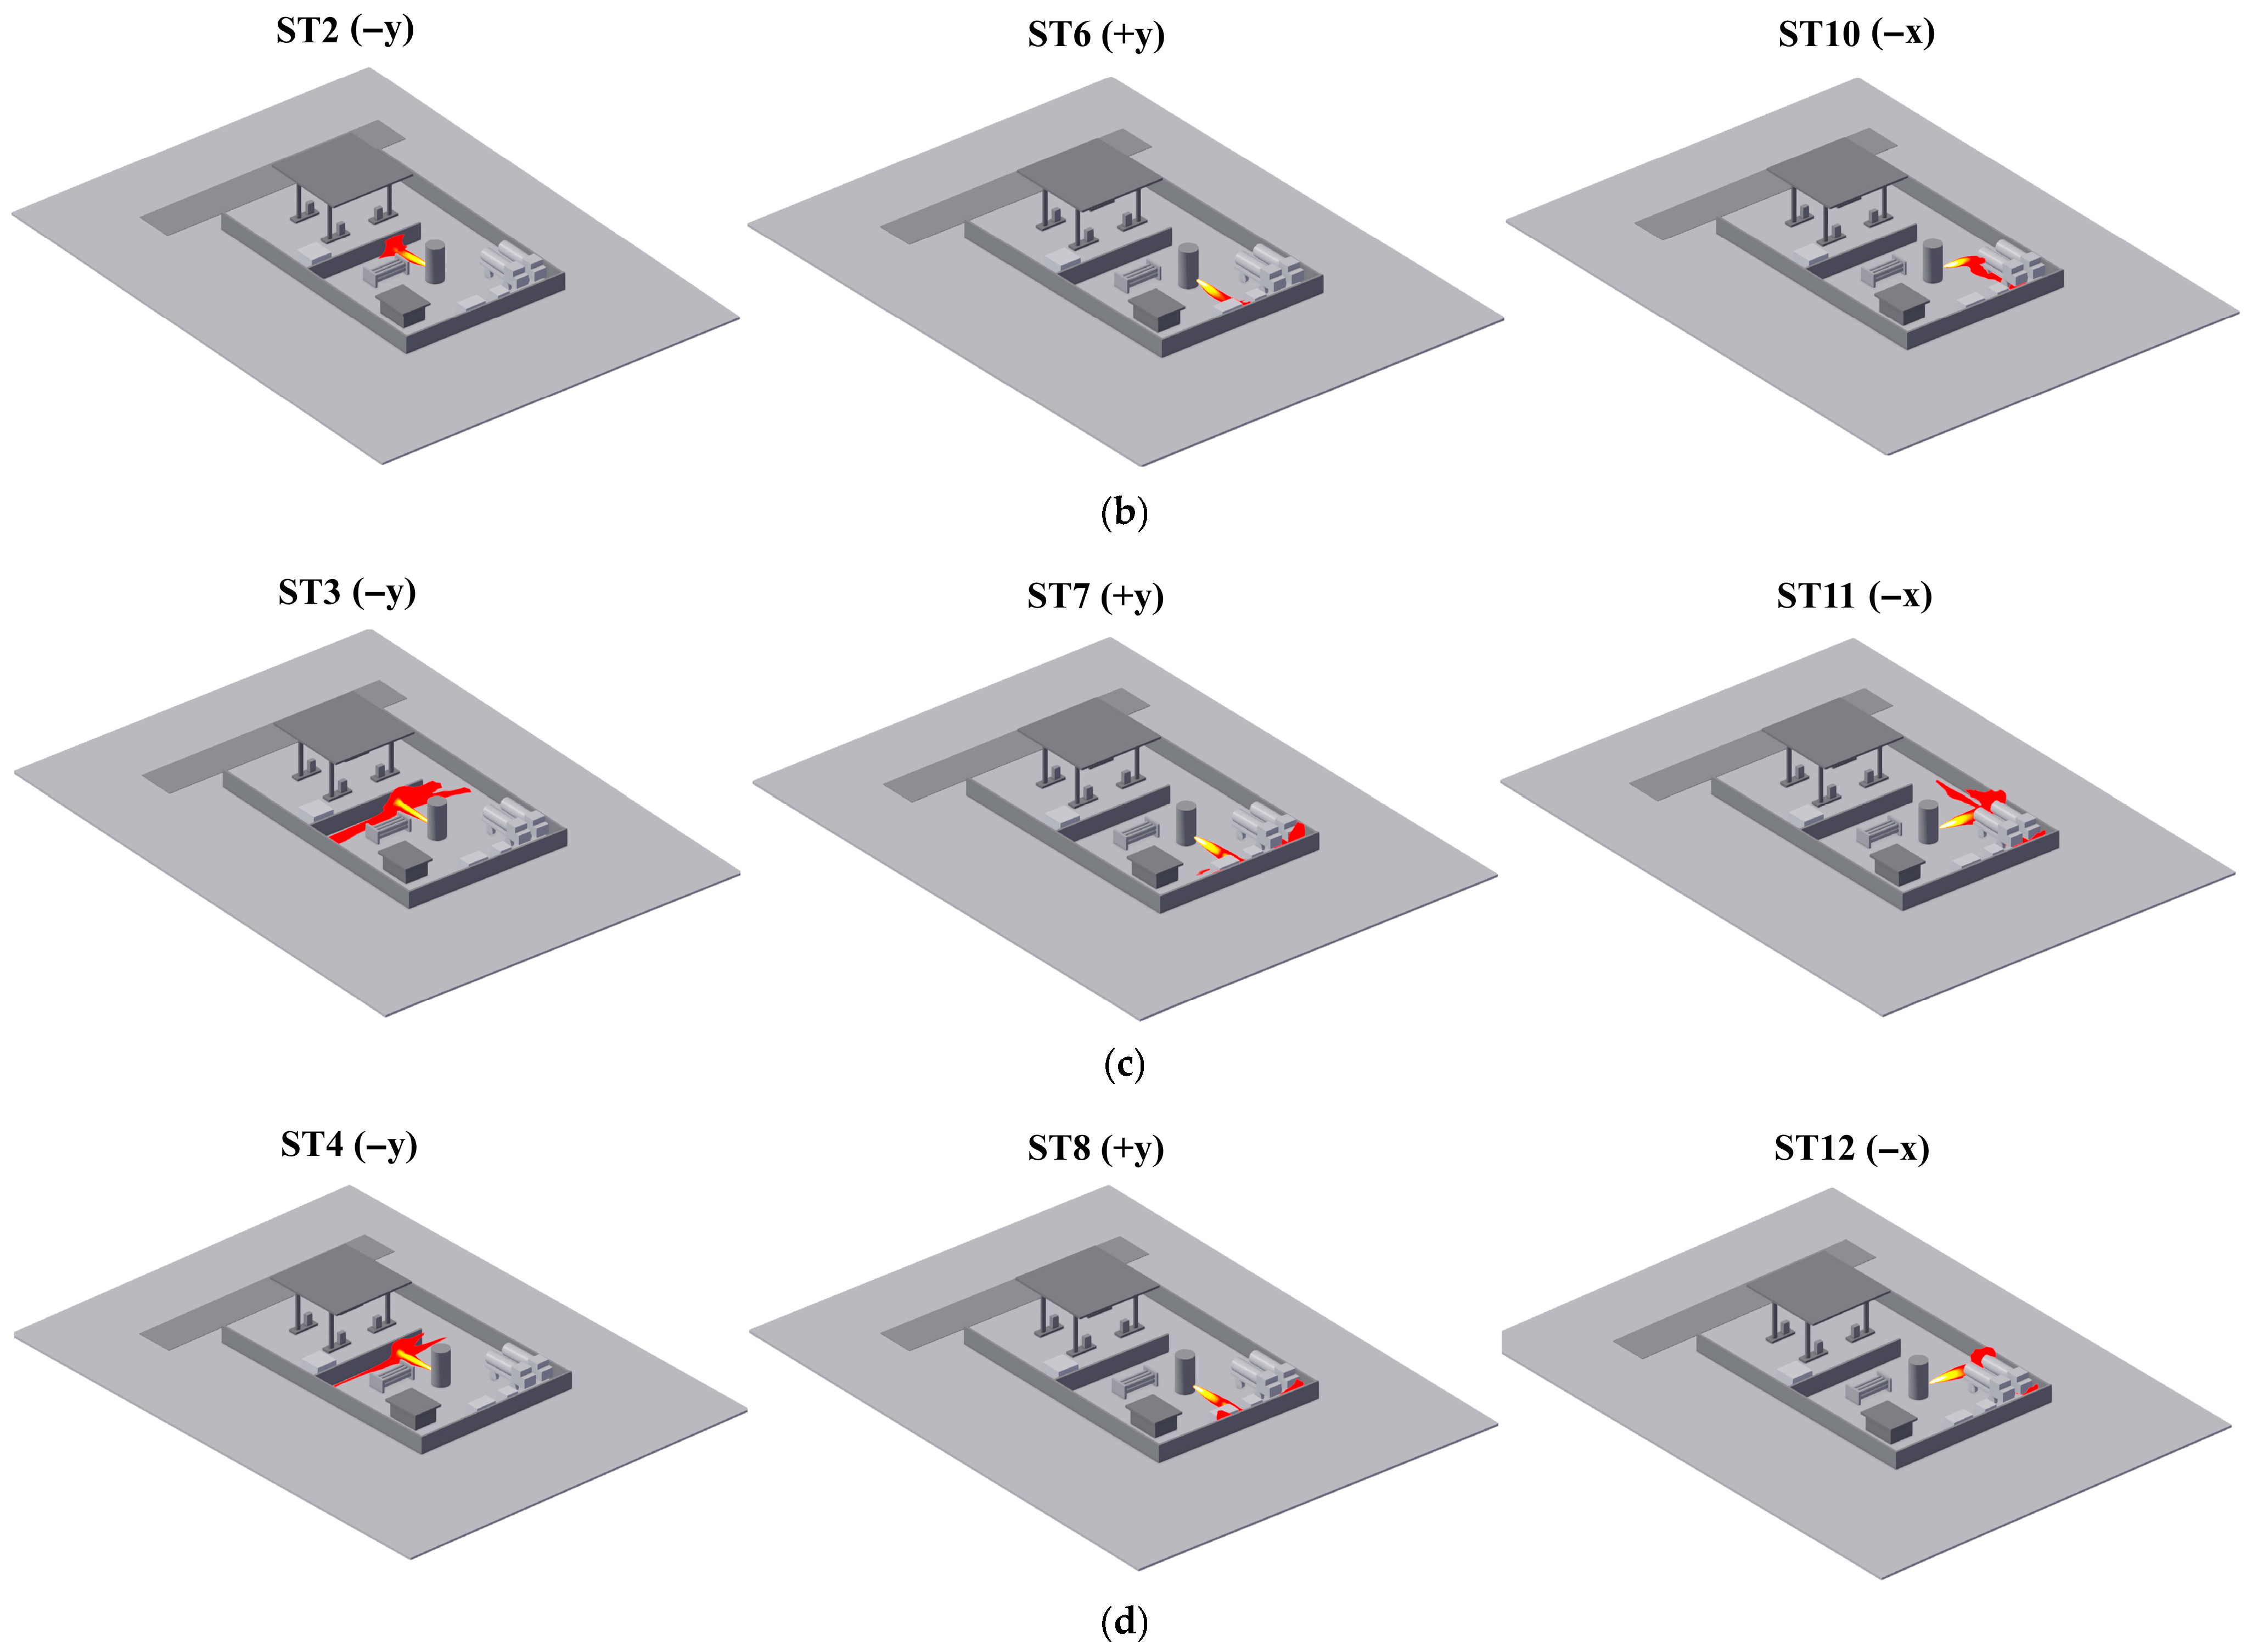
Due to LH2 ultra-low-temperature storage properties, it demonstrates a distinctive risk evolution pattern during a leakage event, where the diffusion process is primarily influenced by the flash phase transition. Upon leakage initiation, LH2 undergoes a rapid flash phase transition due to the intrusion of ambient heat, resulting in a vaporization rate that can exceed 30% of the leaked mass instantaneously. The unvaporized LH2 forms cold aerosols, which disperse swiftly due to the combined effects of buoyancy and inertial forces. Consequently, LH2 leakage leads to the accumulation of FGCs and poses risks of low-temperature hazards. Figure 5 illustrates the spatial extent of the low-temperature hazard zone 60 s after the release of LH2 from the storage tank at an HRS under 12 predefined scenarios.
The cold zone primarily occurs in close proximity to the leakage point, exhibiting strong spatial correlation with the FGC at concentrations ranging from 30% to 75%. Its spatial extent is predominantly influenced by the leakage rate, while the impact of wind speed on its spatial configuration is minimal. The farthest flammable distance of the flammable gas cloud is highly consistent with the propagation distance of the low-temperature front under most working conditions. However, under working condition 11, the farthest flammable distance is 50 m, and the farthest low-temperature distance is 19 m. The gap between the two is the largest and the risk is the highest, as shown in Table 4. In instances where the FGC concentration surpasses 30% and intersects with the low-temperature core region, the overlapping zone presents dual hazards of cold-induced frostbite and vapor cloud explosion, posing risks to both personnel and equipment. Hence, preventive measures and safety considerations should be prioritized in HRS design.

3.2. Explosion Consequence Analysis

3.2.1. FGC Volume Calculation

Figure 6 quantifies flammable cloud volumes 60 s post-LH2 storage tank leakage across the 12 scenarios. Upwind releases consistently yield the largest flammable volumes due to combined wind-fence aerodynamic obstruction effects. At 1 m/s ambient wind speed, crosswind releases exhibit the second-largest flammable volumes regardless of leak magnitude, indicating how tank-wall configurations restrict hydrogen jet dispersion. This confinement results in significantly less pronounced diffusion compared to downwind releases under low-wind conditions. At 3 m/s wind speed, downwind releases generate the predominant flammable volumes irrespective of leak rate. Obstacle interactions in the leakage path create recirculation zones that enhance downwind accumulation, exceeding crosswind accumulation by 18–22% across all leak scenarios.
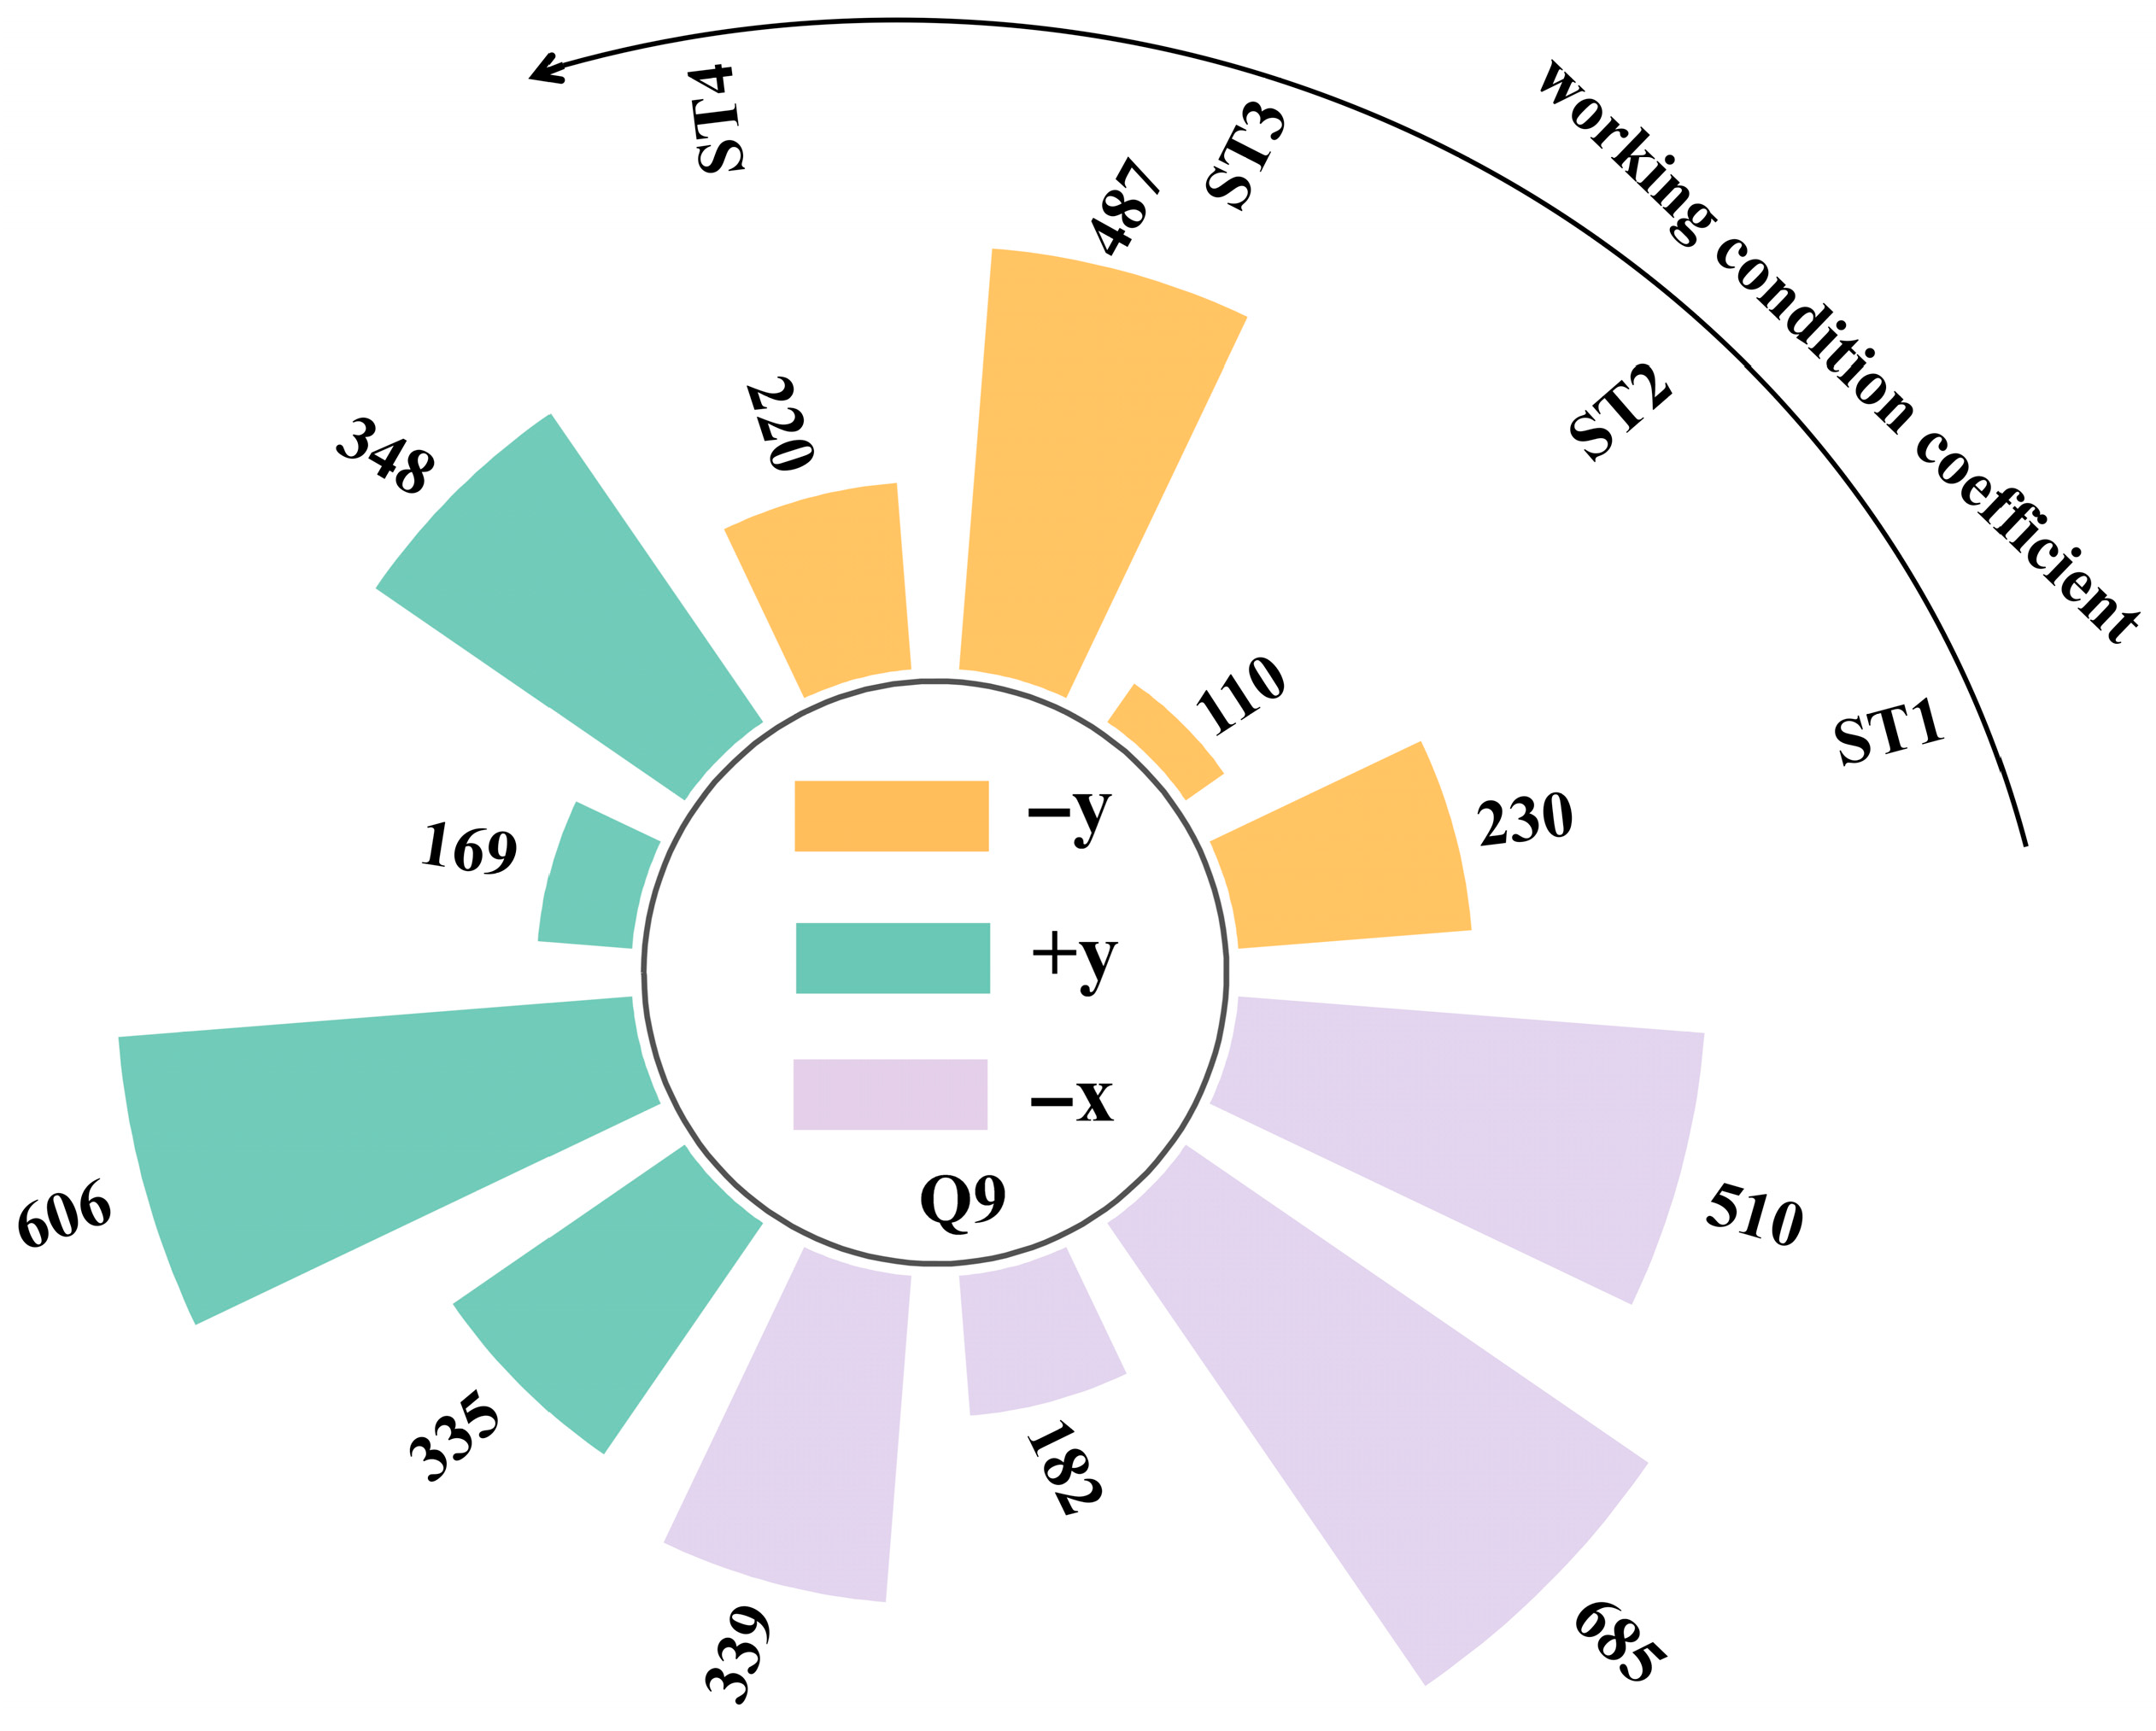
To evaluate the impact of an LH2 leakage explosion, FLACS 24.1 software calculates the volume of an equivalent stoichiometric gas cloud of LH2 across different conditions. Q9 is the equivalent stoichiometric gas volume obtained by compressing a non-uniform gas cloud and is expected to produce an explosion load similar to that of the original cloud. It is defined as follows.
Q 9 = V × B V × E / B V × E stoish
In the formula, V is the combustible volume, BV is the laminar burning velocity of hydrogen, and E is the volume expansion rate caused by combustion under constant pressure in hydrogen re-air.
Figure 7 represents the stoichiometric gas cloud volume. The ranking of explosion hazards across different working conditions is as follows: working condition 11 > working condition 7 > working condition 12 > working condition 3 > working condition 5 > working condition 9 > working condition 8 > working condition 1 > working condition 4 > working condition 10 > working condition 6 > working condition 2. In all scenarios, when the leakage rate of the LH2 storage tank is 1.0329 kg/s, the wind speed is 1 m/s, and there is leakage in the −x axis direction, ignition occurs after continuous leakage for 60 s, the explosion hazard of the hydrogen refueling station is the highest and is equivalent to the explosion hazard in the −y axis direction of leakage. Leakage in the +y direction also presents a relatively high explosion hazard. Therefore, when the liquid hydrogen storage tank leaks under high leakage rate and low wind speed conditions, the danger to the HRS is the greatest. The direction of leakage has the least impact on the danger of LH2 leakage.

3.2.2. Explosion Overpressure Analysis

The human injury threshold of 0.06895 bar overpressure was adopted as the critical value for overpressure contour mapping (Table 5). Maximum hazard scenarios (conditions 3/7/11) for each leakage direction were selected for ignition simulation. High-risk overpressure zones were quantitatively identified through dynamic pressure field analysis on x-y cross-sections, providing critical criteria for safety protection strategies.
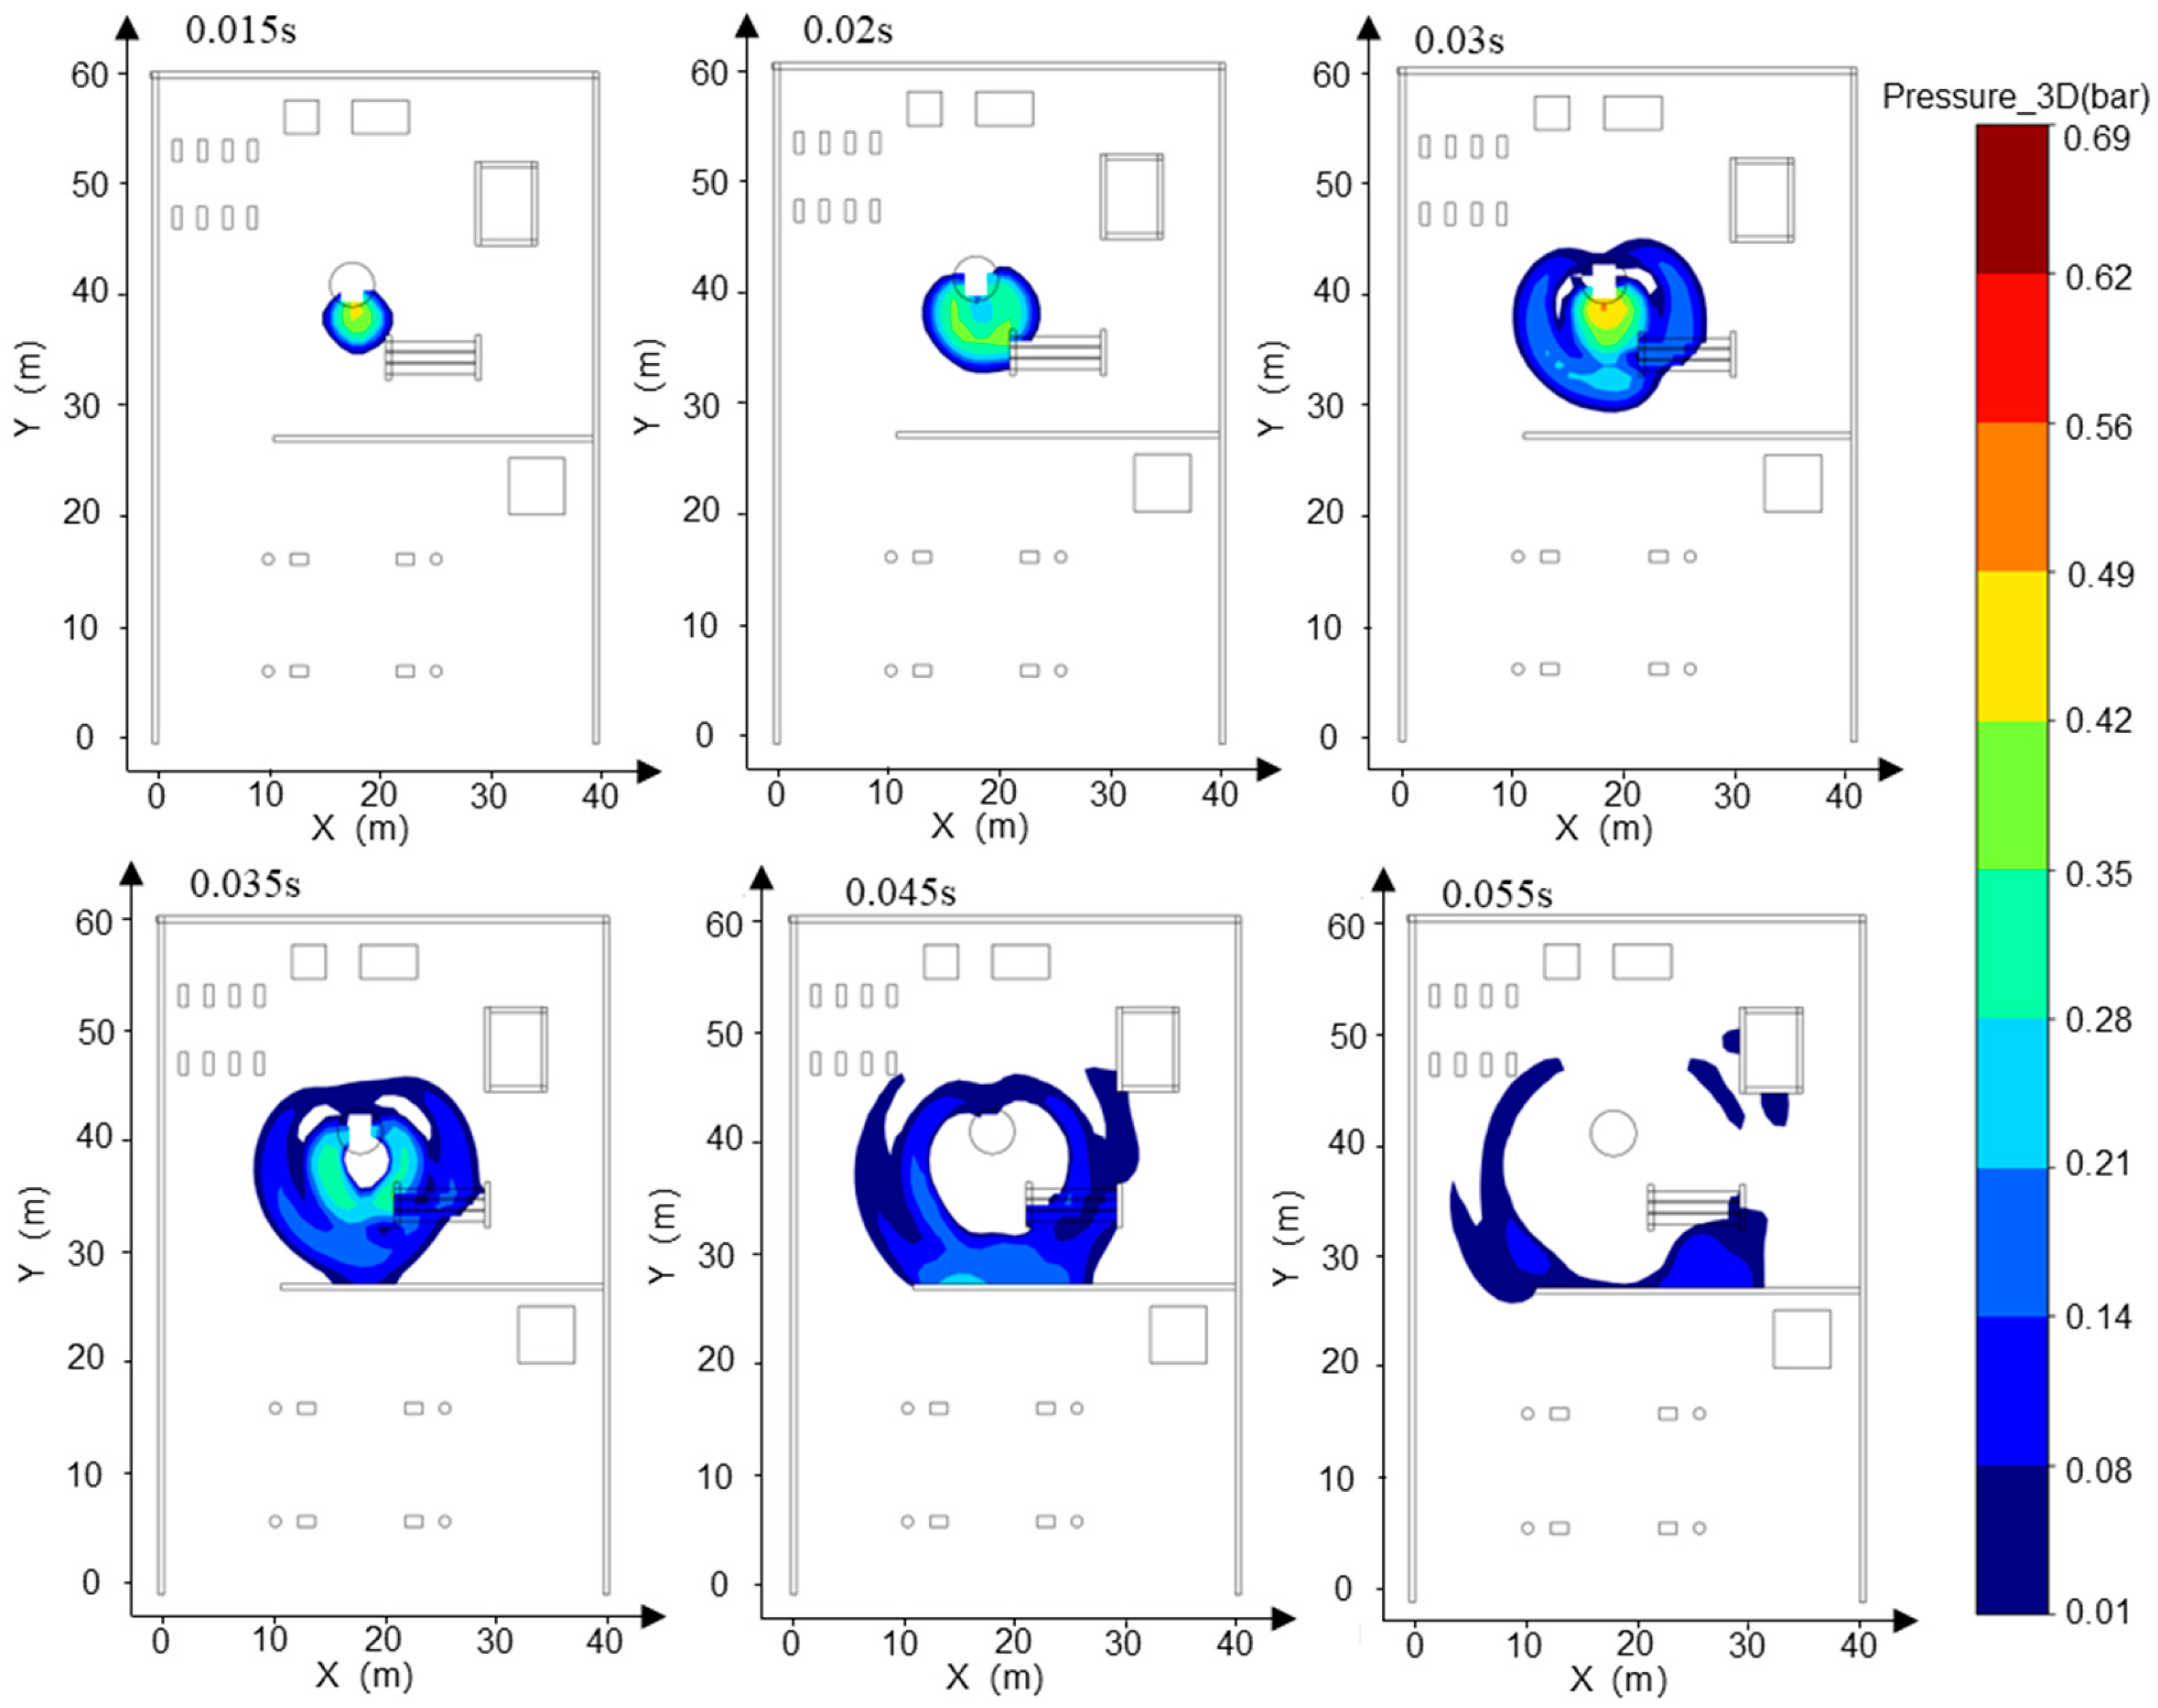
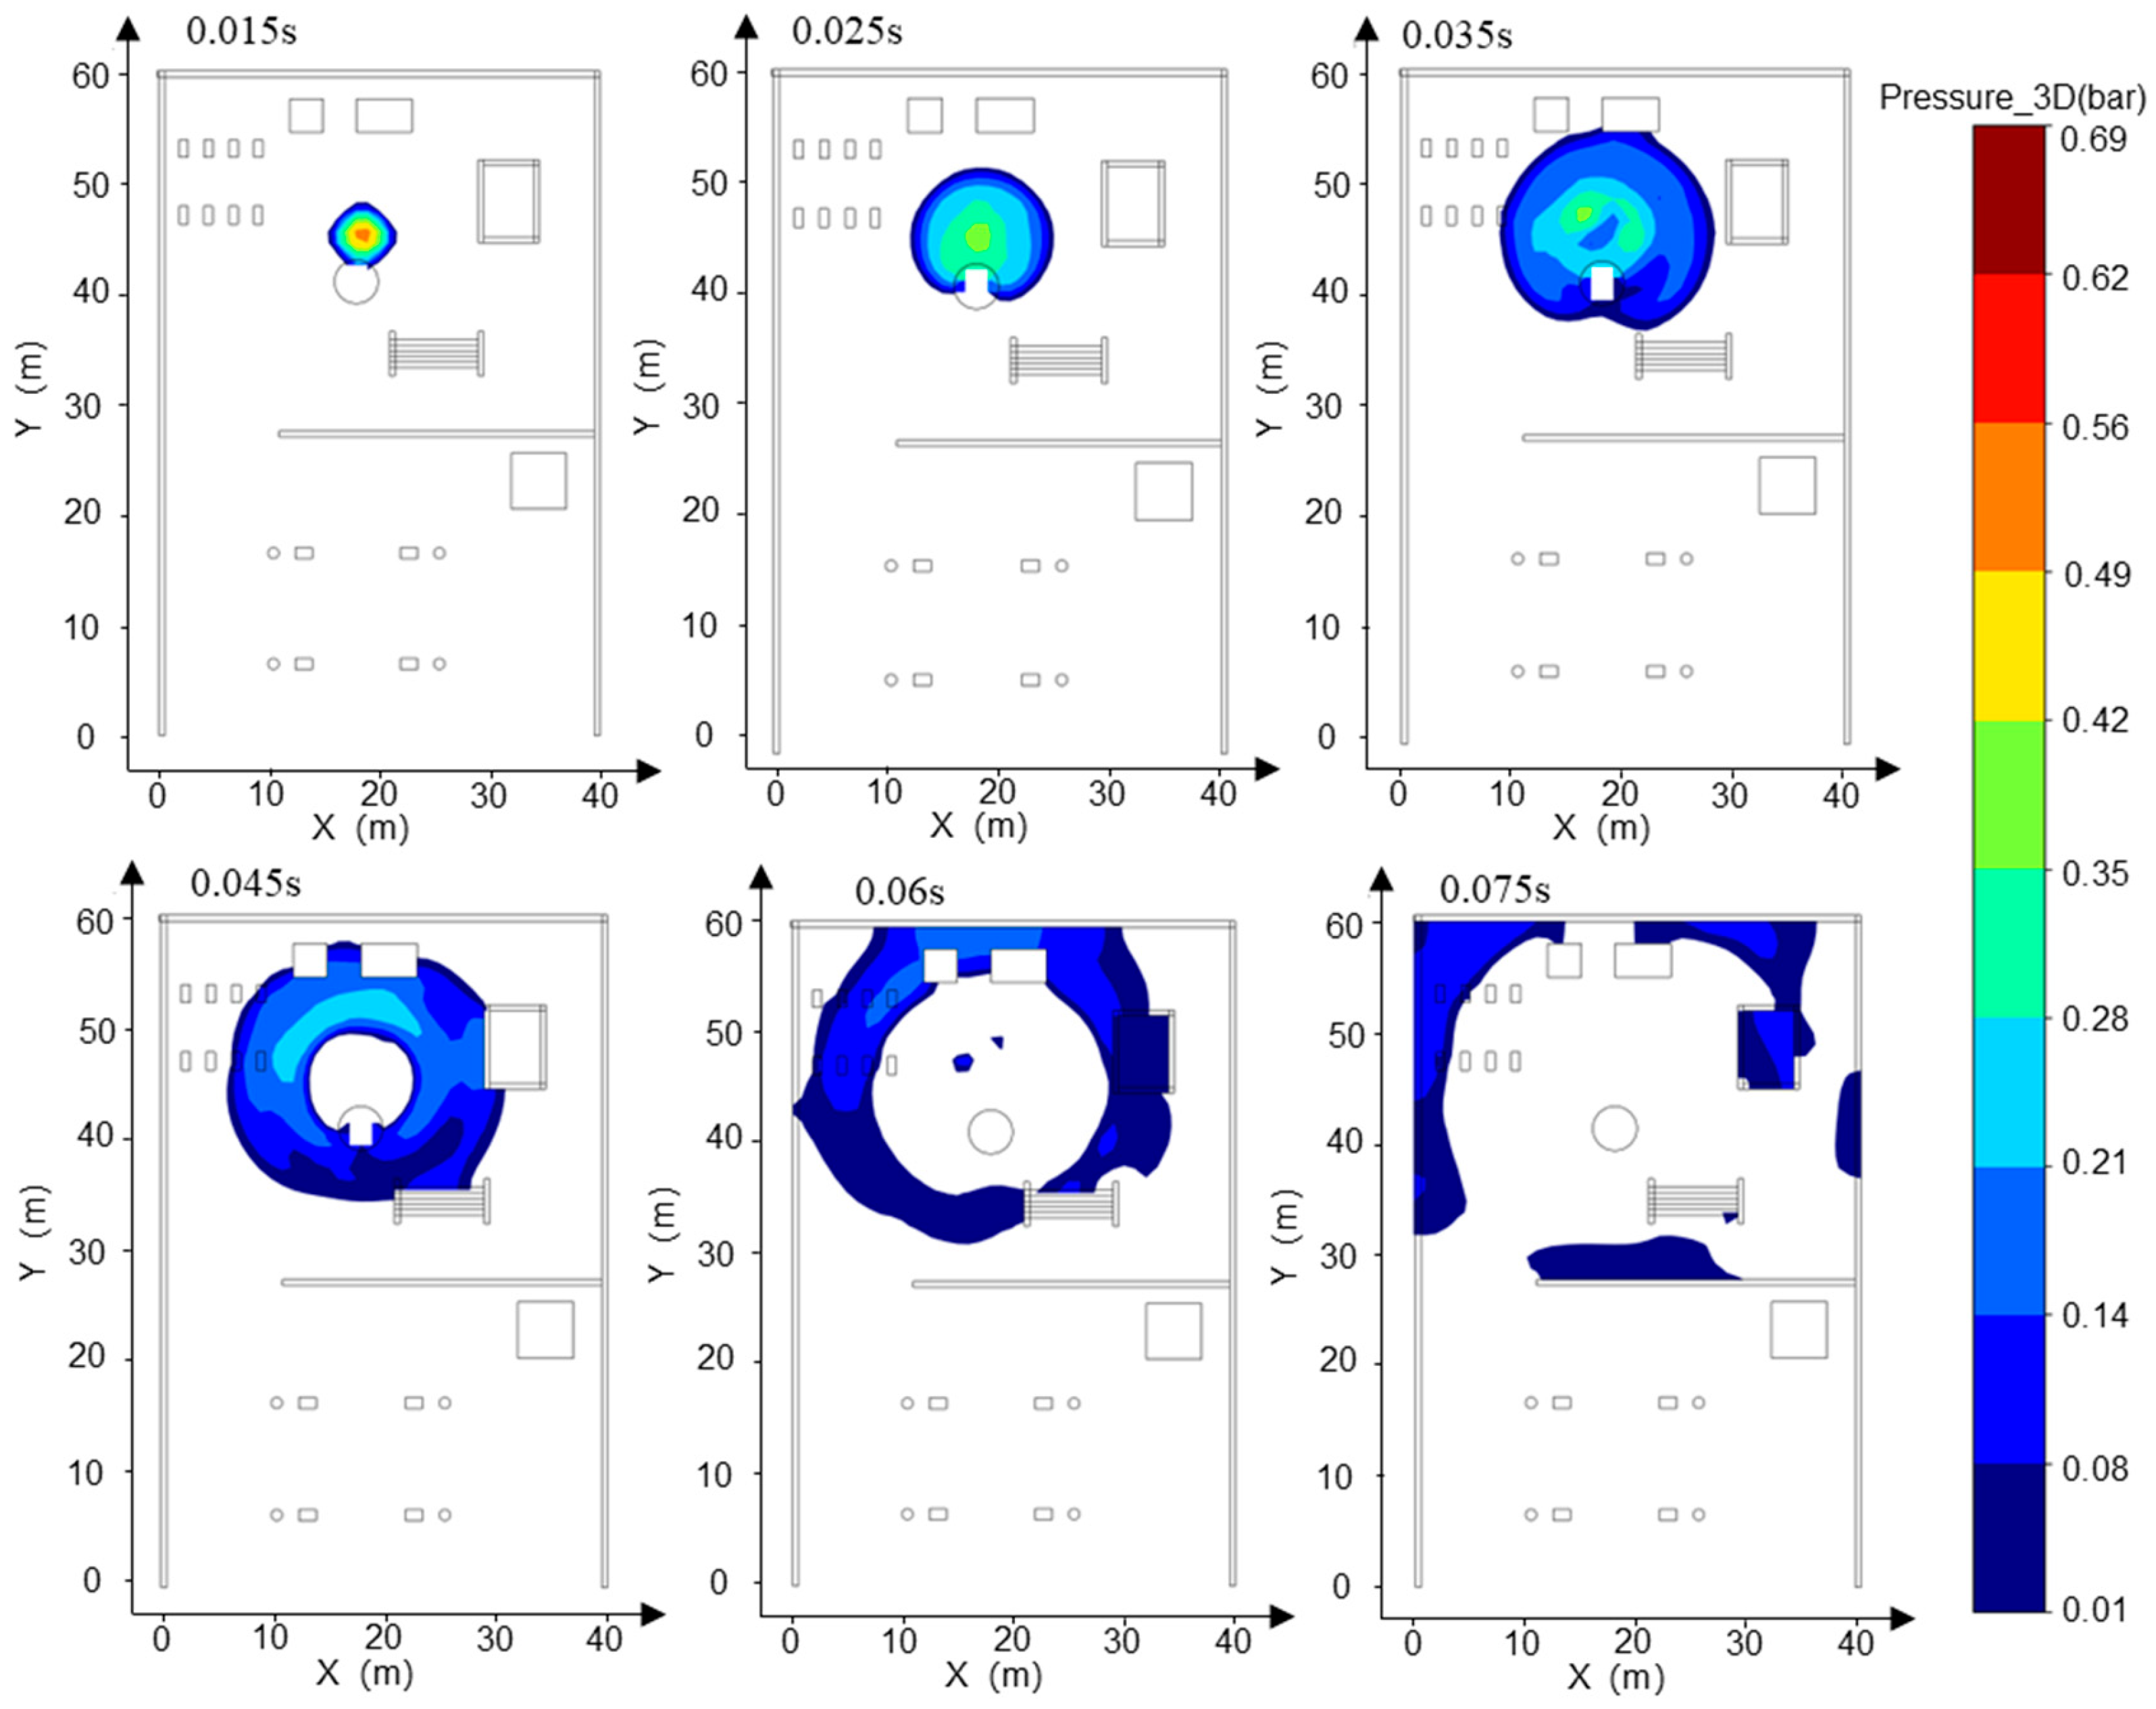
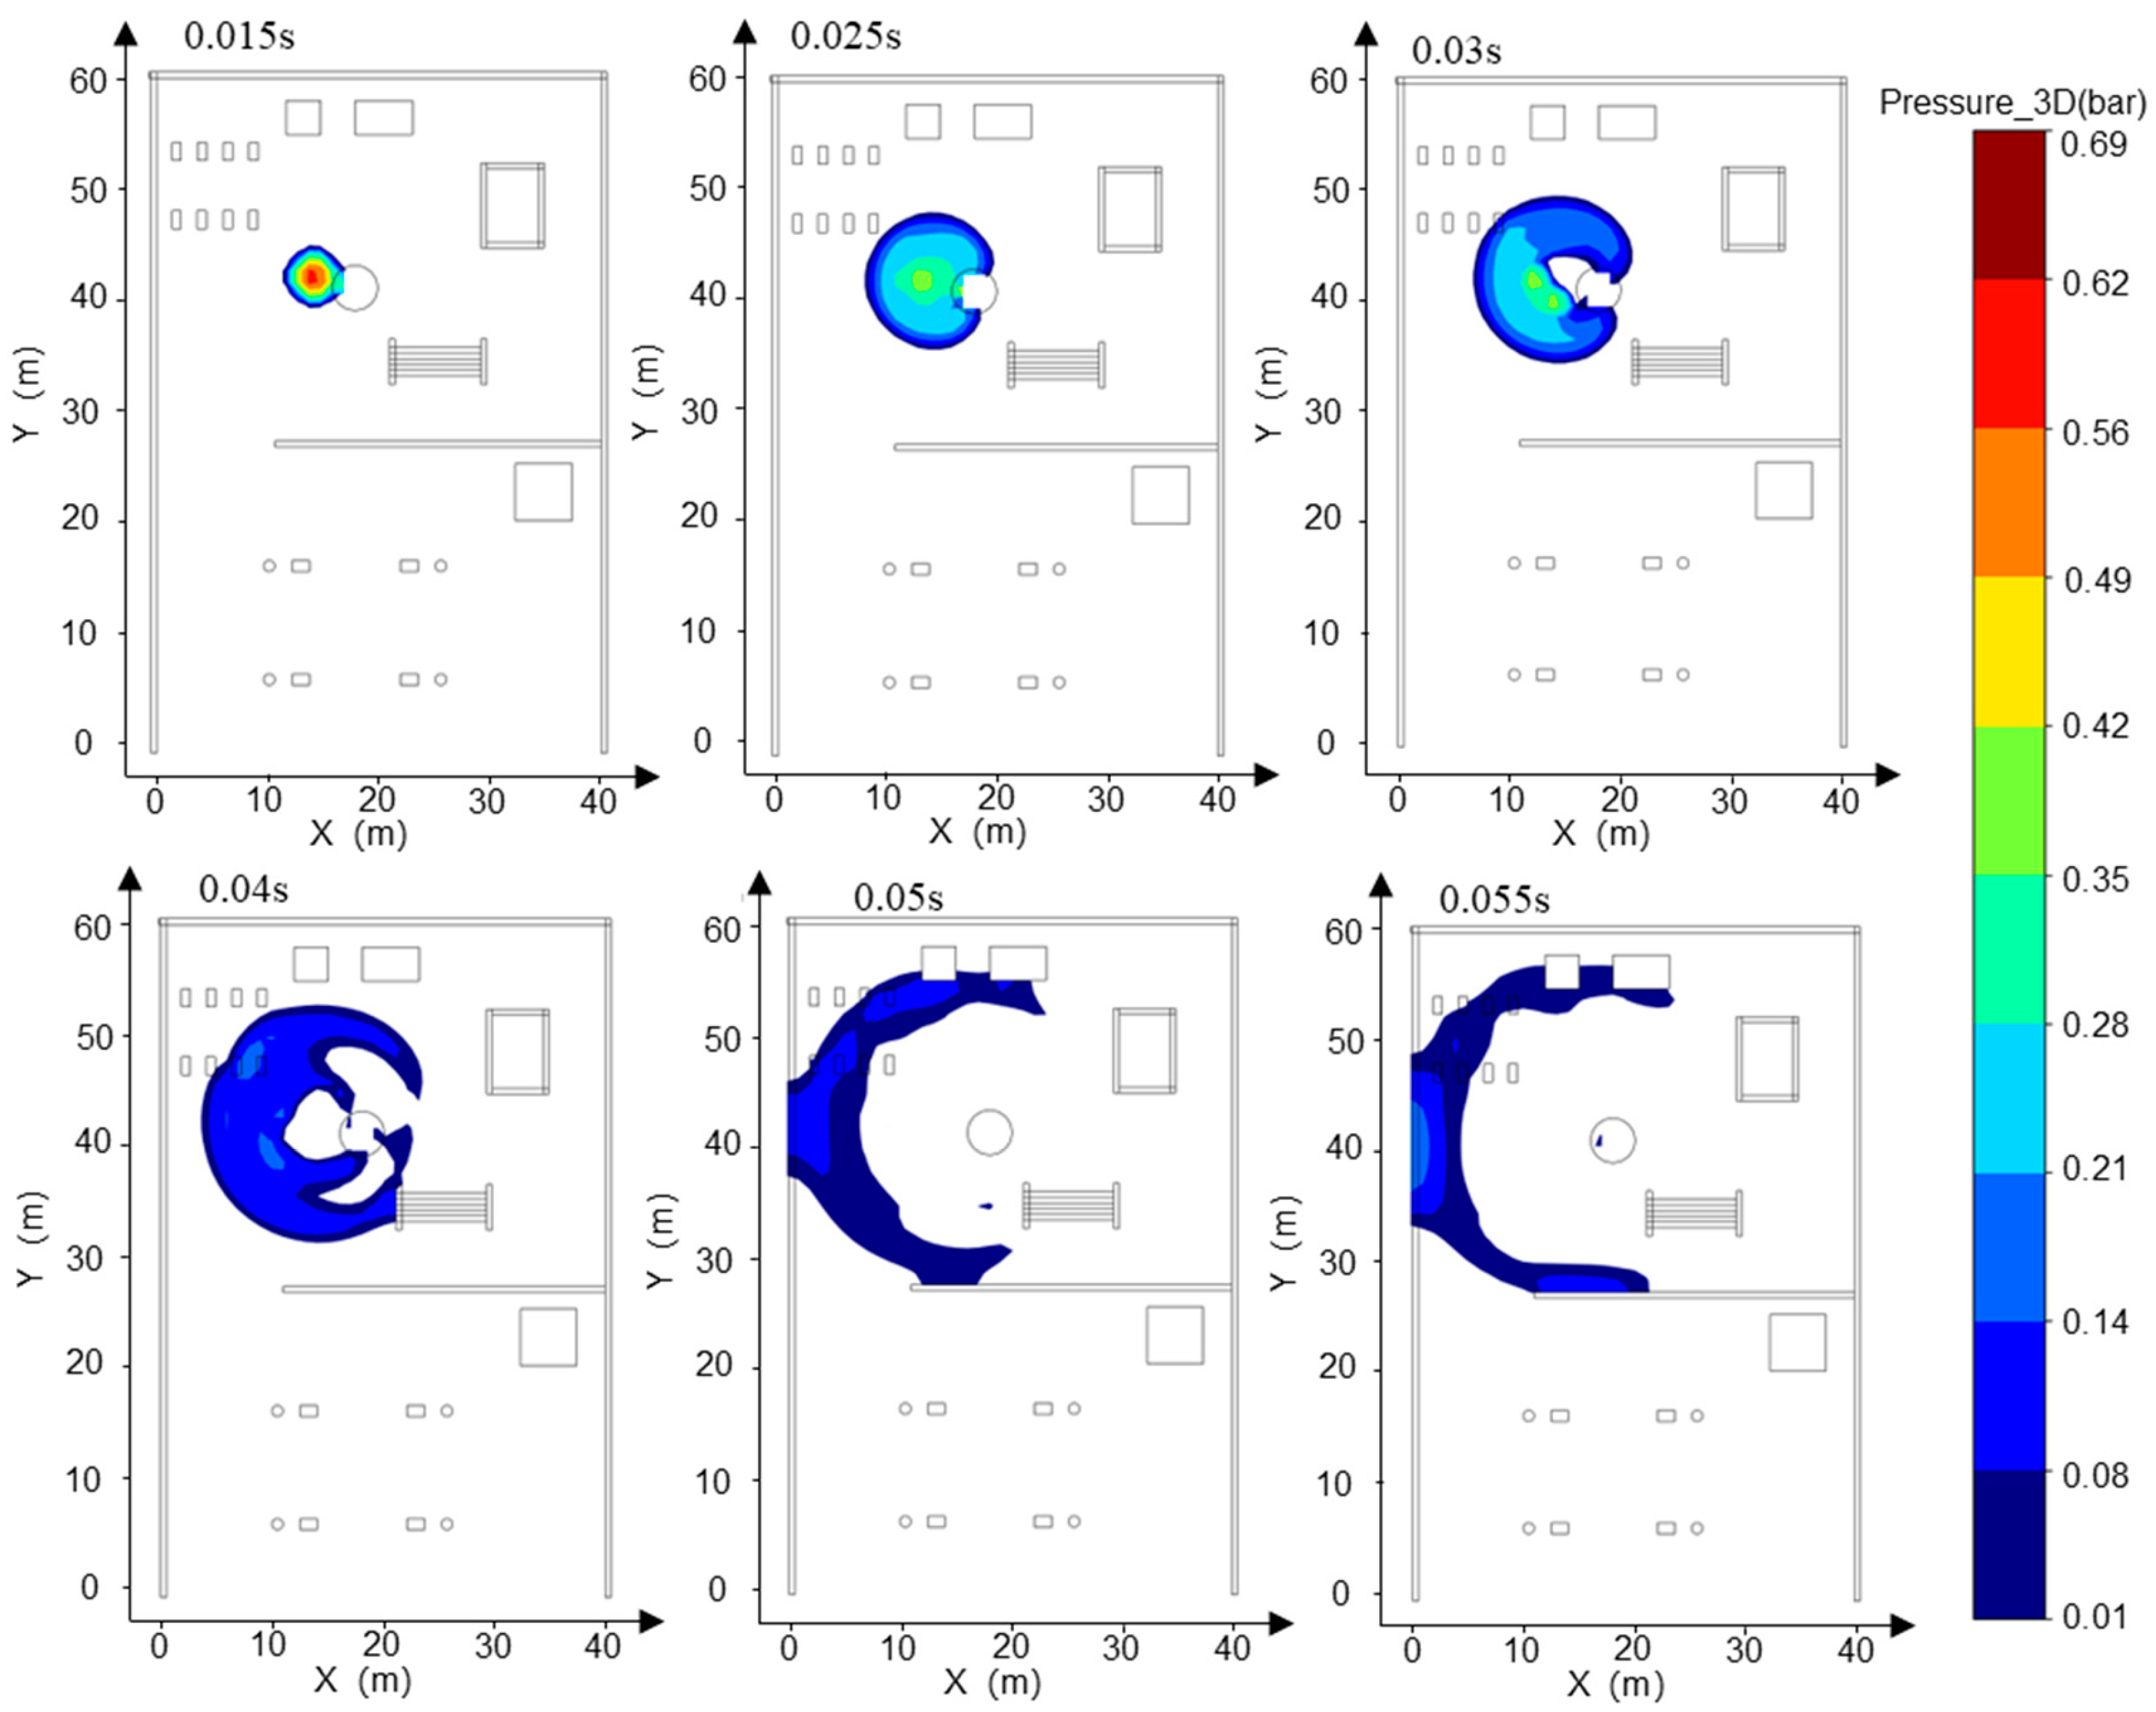
Figure 8, Figure 9, and Figure 10 depict the temporal evolution of explosion overpressure distribution in the X-Y plane along the −y, +y, and −x directions, respectively. Analysis of the monitoring data reveals that the maximum overpressure from the explosion is reached between 0.015 and 0.03 s post-ignition, with a duration not exceeding 1 s. The blast radius extends approximately 16 m in each direction. With surrounding walls at an equal distance from the epicenter, the danger zones are uniform in all orientations. However, the observed variations in the maximum explosion overpressure values across different directions can be attributed to the complex interplay of fluid dynamics and geometric factors. As shown in Table 6, the maximum overpressure in the −y direction is 0.55 bar. This reduction can be explained by the strong turbulent field induced by the opposing wind and the suppressing effect of the nearby wall, which dampens the peak overpressure of the shock wave. In contrast, the maximum overpressure in the +y direction is 0.49 bar, as the windward orientation forms a natural pressure relief channel, allowing the explosion energy to be released smoothly without significant reflection enhancement or turbulent suppression. The maximum overpressure of 0.61 bar in the −x direction is the highest, likely due to the proximity of the LH2 storage tank to the explosion source. In this direction, the shock wave first interacts with the tank wall, leading to reflection and subsequent superposition of the reflected and incident waves. This significantly inhibits energy dissipation and results in a directional jet enhancement effect that amplifies the peak shock wave overpressure. The maximum overpressure of 0.61 bar in the −x direction simulated in this study was 59.2% of the safety threshold, indicating that the current leakage scenario met the NFPA safety margin requirements [43].

3.3. Safety Protection Strategies

Accident simulations indicate that LH2 storage tank leakage at urban HRSs results in three primary hazards: FGC accumulation, cryogenic exposure risks, and vapor cloud explosions. Therefore, safety protection measures should prioritize FGC dispersion control, cryogenic hazard prevention, and explosion risk mitigation.
  • To prevent FGC accumulation near walls following an LH2 storage tank leak at an HRS, a directional airflow system should be installed to disrupt accumulation. Additionally, a spoiler should be placed downwind to mitigate wind field–obstacle interaction. Equipment layout in upwind and crosswind areas should be optimized to minimize the wake area, along with implementing other safety measures.
  • LH2 leaks at HRSs can easily cause low-temperature damage near the source. To mitigate these hazards, laser hydrogen sensors and infrared low-temperature detectors should be installed to continuously monitor leakage concentration and temperature, particularly within the 30–75% FGC concentration range. An automatic emergency shut-off valve should be configured to close within 0.5 s if leakage exceeds a preset threshold. Operators should be equipped with explosion-proof, self-contained oxygen antifreeze suits capable of withstanding temperatures as low as −196 °C and shock wave overpressures of 0.5 bar. Alternatively, deploying ultra-low-temperature dry powder fire extinguishing robots, capable of operating independently at −200 °C, is recommended for low-temperature disaster zones.
  • Addressing the characteristics of vapor cloud explosions occurring when the FGC encounters an ignition source after LH2 storage tank leakage at the HRS, combined with the time-dependent explosion overpressure distribution maps in the X-Y section for each leakage direction (Figure 8, Figure 9 and Figure 10) and the explosion hazard value data in Table 6, it is evident that key HRS facilities are at risk of overpressure from LH2 storage tank leakage and explosion, necessitating safety protection.
  • For the compressor room: When the LH2 storage tank leaks and explodes in the −x and −y directions, the explosion overpressure affecting the compressor room is 0 bar and 0.01 bar, respectively, posing no hazard. When delayed ignition leakage occurs in the +y direction, the maximum explosion overpressure affecting the compressor room reaches 0.07 bar. This overpressure can cause damage to the compressor room’s door and window glass and minor injuries from debris. Therefore, during HRS equipment layout, the distance between the LH2/gaseous hydrogen storage tank and the compressor room must be strictly observed. A specified distance exceeding 9 m can effectively reduce the explosion overpressure hazard to the compressor room from leakage explosion [44].
  • For the hydrogen storage cylinder group: When the LH2 storage tank leaks and explodes in the −x direction, the explosion overpressure affecting the gaseous hydrogen storage tank is 0 bar, posing no hazard. In the +y direction, an overpressure of 0.08 bar can cause damage to doors and windows and minor injuries from debris. In the −y direction, an overpressure of 0.31 bar is sufficient to collapse the structure of the hydrogen storage cylinder group and may cause serious injury or death within its range. Therefore, it is recommended to clearly define the distance between the gaseous hydrogen storage tank and the LH2 storage tank or to install a firewall between them.
  • For the LH2 transport vehicle: When the LH2 storage tank leaks and explodes in the −y and +y directions, the explosion overpressure affecting the LH2 transport vehicle is 0 bar, posing no hazard. In the −x direction, an overpressure of 0.3 bar will cause serious damage to the tank truck, leading to catastrophic leakage and chained secondary accidents, significantly increasing the risk of casualties. Therefore, to effectively mitigate the extreme risk of tank rupture and secondary accidents caused by LH2 storage tank leakage and explosion overpressure in the −x direction, engineering isolation measures based on explosion-proof design must be implemented in the tank truck loading and unloading area, along with establishing an independent reinforced concrete base to provide a necessary physical barrier and impact resistance.

4. Conclusions

A numerical model of urban HRS leakage was established to analyze multi-factor FGC diffusion characteristics and identify the associated low-temperature hazard zone during leakage. The evolution of explosion consequences under different leakage directions was revealed, and safety protection strategies were proposed. The main conclusions are as follows:
  • The low leakage rate combined with a weak wind field results in buoyancy-dominated diffusion, creating an isotropic FGC. When paired with a strong wind field, forced convection restricts the FGC’s diffusion in the +y, −y, and −x directions, leading to local aggregation in the crosswind area. A high leakage rate with a weak wind field expands the FGC volume in three directions to twice that of the low leakage rate, forming a high-concentration core with distinct boundary diffusion. In contrast, a high leakage rate with a strong wind field significantly reduces the diffusion range of FGCs in both downwind and crosswind directions. In the upwind direction, a backflow stagnation zone forms due to flow around an obstacle, allowing the FGC volume to reach 290 m3 without notable shrinkage.
  • The hazard zone resulting from the phase transition of LH2 at low temperatures overlaps spatially with the cluster of combustible clouds across nearly all operational scenarios, primarily concentrated within the 0.3–0.75 range of FGC concentration. The distribution is primarily influenced by the rate of leakage, with wind speed exerting minimal impact. Mitigation strategies in the overlapping region should concurrently address the risks of combustion and frostbite, necessitating the implementation of tailored protective measures.
  • The rapid vaporization and explosion of an LH2 leak at an HRS exhibit transient, high-impact characteristics, with a duration of less than 1 s. The explosion exhibits a homogeneous spatial distribution, with a radius of 16 m. However, the peak overpressure values differ in directionality, reaching up to 0.61 bar in the −x direction, 0.55 bar in the −y direction, and 0.49 bar in the +y direction. The leakage and explosion of the LH2 storage tank can cause varying degrees of damage to other critical components of the HRS. The most severe impact is the 0.30 bar overpressure spread in the −x direction, which may lead to the rupture of the LH2 transport vehicle body and catastrophic secondary leakage.
  • To mitigate the risk of FGCs, gradient concentration sensors should be installed on the leeward side of the upwind wall, the downwind wall, and in the crosswind zone. A directional airflow system should be implemented near the wall to disperse FGC accumulation, and a spoiler baffle added downwind to reduce wind field coupling effects. For low-temperature hazards, laser hydrogen sensors and infrared cryogenic detectors should be used within the 30–75% FGC range. Anti-freezing gear, or ultra-low-temperature fire-extinguishing robots should be deployed. To address explosion hazards, the distance between storage tanks and compressor rooms must exceed 9 m. Specifications for LH2/gaseous hydrogen storage tank spacing should be defined, and a firewall should be installed. Additionally, the explosion-proof brackets of hydrogen storage cylinders should be reinforced. An anti-explosion isolation base should be established in the LH2 tank truck loading and unloading area.
  • The simplification of the non-equilibrium mass transfer mechanism in the LH2 flash evaporation process relies on the steady-state wind-field assumption and pseudo-source model in this study. It is assumed that the isenthalpic equilibrium flash evaporation changes the droplet phase into an instantaneous process. Further research should focus on multiphase flow numerical simulation to quantify phase-change kinetics effects. Furthermore, the leakage consequences of LH2 storage tanks in HRSs in different leakage scenarios should be analyzed and investigated.

Author Contributions

Conceptualization, H.L. and W.W.; methodology, H.L.; investigation, W.W.; writing—original draft preparation, H.L.; writing—review and editing, W.W.; supervision, H.S., T.K., Y.L. and Y.G. All authors have read and agreed to the published version of the manuscript.

Funding

This work was supported by the Chongqing Natural Science Foundation (Grant No. CSTB2023TIAD-KPX0089) and the Innovation Project for Master’s Students of Chongqing University of Science and Technology (Grant No. YKJCX2420705).

Data Availability Statement

The data presented in this study are available on request from the corresponding author.

Conflicts of Interest

The authors declare no conflicts of interest.

Abbreviations

The following abbreviations are used in this manuscript:
LH2Liquid hydrogen
HRSHydrogen refueling station
LHRSLiquid hydrogen refueling station
FGCFlammable gas cloud
CFDComputational Fluid Dynamics
HSLThe Health and Safety Laboratory

References

  1. Buckle, N. Some Observations on the History of Electrochemistry in Europe. In Electrochemical Society Meeting Abstracts; The Electrochemical Society, Inc.: Pennington, NJ, USA, 2023; Volume 244, p. 3210. [Google Scholar]
  2. Smolinka, T.; Bergmann, H.; Garche, J.; Kusnezoff, M. The history of water electrolysis from its beginnings to the present. In Electrochemical Power Sources: Fundamentals, Systems, and Applications; Elsevier: Amsterdam, The Netherlands, 2022; pp. 83–164. [Google Scholar]
  3. Shaposhnik, V.A. Prospects of Membrane Catalysis in Hydrogen Energetics. Mini Review. Condens. Matter Interphases 2024, 26, 37–44. [Google Scholar] [CrossRef]
  4. Fabbrizzi, L. Strange Case of Signor Volta and Mister Nicholson: How Electrochemistry Developed as a Consequence of an Editorial Misconduct. Angew. Chem. Int. Ed. Engl. 2019, 58, 5810–5822. [Google Scholar] [CrossRef] [PubMed]
  5. Laghlimi, C.; Moutcine, A.; Ziat, Y.; Belkhanchi, H.; Koufi, A.; Bouyassan, S. Hydrogen: Chronology and electrochemical production. Sol. Energy Sustain. Dev. Spec. Issue 2024, 22–37. [Google Scholar] [CrossRef]
  6. Stein, A.; Nolte, B.; Kizgin, U.V.; Grünewald, O. Relationship Between Area and Capacity of Hydrogen Refueling Stations and Derivation of Design Recommendations. Hydrogen 2025, 6, 16. [Google Scholar] [CrossRef]
  7. Matveev, K.I.; Leachman, J.W. The Effect of Liquid Hydrogen Tank Size on Self-Pressurization and Constant-Pressure Venting. Hydrogen 2023, 4, 444–455. [Google Scholar] [CrossRef]
  8. Sun, Y.Q. Explosions of Hydrogen Storages and the Safety Considerations in Hydrogen-Powered Railway Applications—A Review. Hydrogen 2024, 5, 901–918. [Google Scholar] [CrossRef]
  9. Genovese, M.; Blekhman, D.; Fragiacomo, P. An Exploration of Safety Measures in Hydrogen Refueling Stations: Delving into Hydrogen Equipment and Technical Performance. Hydrogen 2024, 5, 102–122. [Google Scholar] [CrossRef]
  10. Deng, X.; Sun, J.; Yang, F. Simulation and Quantitative Assessment of Sensor Placement in a Hydrogen Bus for Risk Mitigation. Hydrogen 2024, 5, 976–986. [Google Scholar] [CrossRef]
  11. Haoren, W.; Bo, W.; Ruize, L.; Xian, S.; Yingzhe, W.; Quanwen, P.; Yuanxin, H.; Weiming, Z.; Zhihua, G. Theoretical investigation on heat leakage distribution between vapor and liquid in liquid hydrogen tanks. Int. J. Hydrogen Energy 2023, 48, 17187–17201. [Google Scholar] [CrossRef]
  12. Holborn, P.G.; Benson, C.M.; Ingram, J.M. Modelling hazardous distances for large-scale liquid hydrogen pool releases. Int. J. Hydrogen Energy 2020, 45, 23851–23871. [Google Scholar] [CrossRef]
  13. Qu, Z.; Cai, Z.; Ma, Z.; Zhang, X.; Shu, Z.; Liang, W.; Cai, L. Co-simulation of Thermal Behavior in Liquid Hydrogen Tanks under Vacuum degradation. Energy 2025, 329, 136841. [Google Scholar] [CrossRef]
  14. Lv, H.; Chen, L.; Zhang, Z.; Zhang, Z.; Chen, S.; Hou, Y. Investigation of the non-equilibrium heat transfer and self-pressurization behavior of liquid hydrogen tanks. Int. J. Hydrogen Energy 2025, 122, 125–138. [Google Scholar] [CrossRef]
  15. Ren, J.; Zhao, S.; Xie, Z.; Yang, S.; Bi, M. Experimental study on vaporization behavior of liquid hydrogen on different substrates. Int. J. Hydrogen Energy 2025, 132, 1–9. [Google Scholar] [CrossRef]
  16. Winters, W.; Houf, W. Simulation of small-scale releases from liquid hydrogen storage systems. Int. J. Hydrogen Energy 2011, 36, 3913–3921. [Google Scholar] [CrossRef]
  17. Wan, C.; Shi, C.; Zhu, S.; Fang, S.; Qiu, L.; Shi, G.; Li, D.; Shao, S.; Wang, K. Comprehensive design and preliminary experiments of liquid hydrogen storage tank for trucks. Int. J. Refrig. 2025, 169, 279–293. [Google Scholar] [CrossRef]
  18. Lv, H.; Su, Y.; Huang, G.; Zhang, Q.; Zhang, C. Research on rapid refueling of Type-IV hydrogen storage tanks for hydrogen-powered heavy-duty commercial vehicles. Renew Energy 2025, 6, 123673. [Google Scholar] [CrossRef]
  19. Qian, J.-Y.; Li, X.-J.; Gao, Z.-X.; Jin, Z.-J. A numerical study of hydrogen leakage and diffusion in a hydrogen refueling station. Int. J. Hydrogen Energy 2020, 45, 14428–14439. [Google Scholar] [CrossRef]
  20. Wu, J.; Xie, R.; Yu, M.; Luo, C.; Wang, B.; Zhang, X.; Jiang, L. Techno-economic analysis on the performance of hydrogen adsorbents in the vacuum layer of cryogenic liquid storage tank. Int. J. Hydrogen Energy 2024, 88, 132–141. [Google Scholar] [CrossRef]
  21. Sun, R.; Pu, L.; Yu, H.; Dai, M.; Li, Y. Modeling the diffusion of flammable hydrogen cloud under different liquid hydrogen leakage conditions in a hydrogen refueling station. Int. J. Hydrogen Energy 2022, 47, 25849–25863. [Google Scholar] [CrossRef]
  22. Shen, Y.; Wang, D.; Lv, H.; Zhang, C. Dispersion characteristics of large-scale liquid hydrogen spills in a real-world liquid hydrogen refueling station with various releasing and environmental conditions. Renew. Energy 2024, 236, 121327. [Google Scholar] [CrossRef]
  23. Jiang, Y.; Xing, Z.; Xu, Q.; Wu, J.; Peng, M.; Liu, Y. Research on fence protection for liquid hydrogen leakage in the storage tank area. J. Energy Storage 2024, 95, 112481. [Google Scholar] [CrossRef]
  24. Gao, X.; Huang, L.; Ren, J.; Lan, Y.; Li, M.; Xiao, H. Numerical study of the effect of barrier wall on liquid hydrogen leakage and dispersion. Int. J. Hydrogen Energy 2025, 142, 460–471. [Google Scholar] [CrossRef]
  25. Sun, Z.; Wang, Z.; Fei, Z.; Luan, X.; Duan, Y.; Zhang, B. Numerical study on mitigation effect of fence on the vapor dispersion of liquid hydrogen leak in a dike. Int. J. Hydrogen Energy 2025, 111, 667–680. [Google Scholar] [CrossRef]
  26. Hansen, O.R. Liquid hydrogen releases show dense gas behavior. Int. J. Hydrogen Energy 2020, 45, 1343–1358. [Google Scholar] [CrossRef]
  27. Yuan, W.; Li, J.; Zhang, R.; Li, X.; Xie, J.; Chen, J. Numerical investigation of the leakage and explosion scenarios in China’s first liquid hydrogen refueling station. Int. J. Hydrogen Energy 2022, 47, 18786–18798. [Google Scholar] [CrossRef]
  28. Peng, J.; Li, M.; Huang, X.; Xie, J.; Chen, J. Numerical investigation on evaluation of leakage and explosion overpressure at liquid hydrogen receiving terminal. Cryogenics 2025, 150, 104117. [Google Scholar] [CrossRef]
  29. Shang, S.; Zhang, J.; Zhang, J.; Luo, T.; Bi, M.; Jiang, H.; Li, Y.; Gao, W. Study on the effect of explosion suppression equipment on hydrogen explosions. J. Loss Prev. Process. Ind. 2023, 83, 105046. [Google Scholar] [CrossRef]
  30. Xiao, H.; Duan, Q.; Sun, J. Premixed flame propagation in hydrogen explosions. Renew. Sust. Energy Rev. 2018, 81, 1988–2001. [Google Scholar] [CrossRef]
  31. Ma, X.; Nie, B.; Wang, W.; Zhao, D.; Zhang, Y.; Yang, Y.; Ma, C.; Hu, B.; Chang, L.; Yang, L. Effect of hydrogen concentration, initial pressure and temperature on mechanisms of hydrogen explosion in confined spaces. Combust. Flame 2024, 269, 113696. [Google Scholar] [CrossRef]
  32. Hu, Q.; Zhang, S.; Zhang, X.; Wang, F. Enhancing disaster prevention and structural resilience of tunnels: A study on liquid hydrogen leakage, diffusion, and explosion mitigation. Tunn. Undergr. Space Technol. 2025, 162, 106626. [Google Scholar] [CrossRef]
  33. Shen, Y.; Wang, D.; Lv, H.; Zhang, C. Numerical study on leakage, diffusion and accident consequences of liquid hydrogen jet and analysis of influencing factors. Process Saf. Environ. Prot. 2025, 194, 14–34. [Google Scholar] [CrossRef]
  34. Amaral, P.C.S.; Oh, C.B.; Do, K.H.; Choi, B.-I. Risk assessment of hydrogen leakage and explosion in a liquid hydrogen facility using computational analysis. Int. J. Hydrogen Energy 2024, 91, 950–964. [Google Scholar] [CrossRef]
  35. Liang, Y.; Pan, X.; Zhang, C.; Xie, B.; Liu, S. The simulation and analysis of leakage and explosion at a renewable hydrogen refuelling station. Int. J. Hydrogen Energy 2019, 44, 22608–22619. [Google Scholar] [CrossRef]
  36. Yang, Z.; Chen, Z.; Han, X.; Chen, G.; Wang, X. Numerical and experimental studies on the evolution characteristics of high-pressure hydrogen leakage and explosion accidents in hydrogen refueling stations. Int. J. Hydrogen Energy 2025, 142, 580–595. [Google Scholar] [CrossRef]
  37. Chen, Y.L.; Wang, T.S.; Zhu, X.W. Location and capacity planning of hydrogen refueling station in highway network based on hydrogen life cycle cost: Modeling, optimization and case verification. Int. J. Hydrogen Energy 2025, 139, 606–620. [Google Scholar] [CrossRef]
  38. Yang, J.; Wang, Y.; Wang, J.; Wu, J.; Wu, H.; Li, W.; Yu, T.; Han, Y.; Lu, W.; Xing, Z.; et al. Liquid hydrogen refueling stations: A review on process layouts, pump technology, and cold energy utilization. Int. J. Hydrogen Energy 2025, 137, 260–280. [Google Scholar] [CrossRef]
  39. Li, Y.; Wang, Z.; Shi, X.; Fan, R. Safety analysis of hydrogen leakage accident with a mobile hydrogen refueling station. Process. Saf. Environ. Prot. 2023, 171, 619–629. [Google Scholar] [CrossRef]
  40. Zhou, C.; Yang, Z.; Chen, G.; Li, X. Optimizing hydrogen refueling station layout based on consequences of leakage and explosion accidents. Int. J. Hydrogen Energy 2024, 54, 817–54836. [Google Scholar] [CrossRef]
  41. Wang, X.; Li, W.; Zhao, H.; Liu, M.; Zhang, C. Numerical simulation of hydrogen leakage and accident consequence of hydrogen explosion in compact confined hydrogen-electric coupling systems. Process. Saf. Environ. Prot. 2025, 201, 107444. [Google Scholar] [CrossRef]
  42. NFPA. NFPA 2: Hydrogen Technologies Code; National Fire Protection Association: Quincy, MA, USA, 2020. [Google Scholar]
  43. Nolan, D.P. Explosion Protection Engineering Principles for Oil; China Petrochemical Press: Beijing, China, 2020; pp. 154–169. [Google Scholar]
  44. GB 50516-2010; Technical Code for Hydrogen Fuelling Station. GB Standards: Shenzhen, China, 2021.
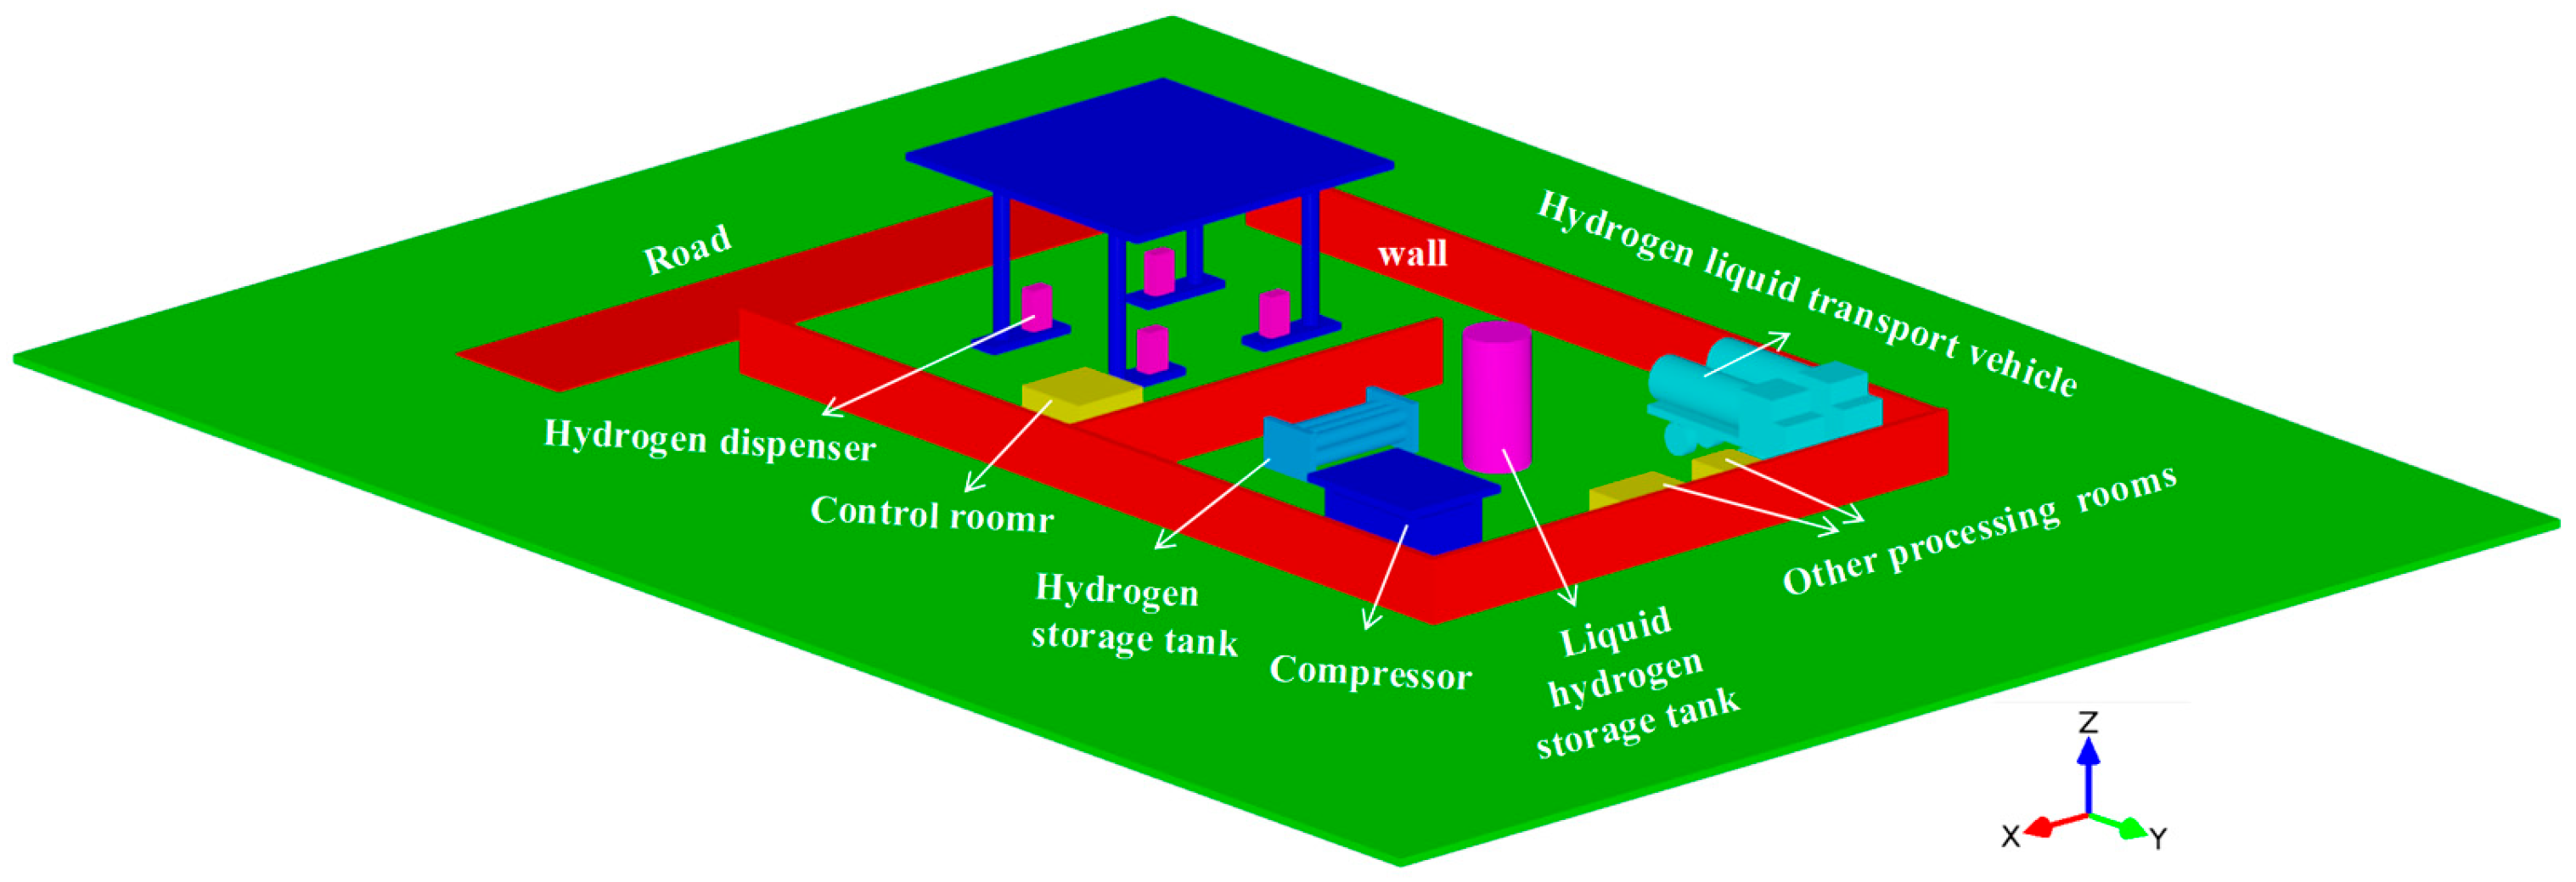
Figure 1. Geometric model of LHR.
Hydrogen 06 00058 g001
Figure 2. Temperature field of jet central axis section.
Hydrogen 06 00058 g002
Figure 3. Jet temperature distribution.
Hydrogen 06 00058 g003
Figure 4. Leakage of LH2 storage tank at HRS and distribution of FGC within 60 s, where (a) leakage rate: 0.5182 kg/s, wind speed: 1 m/s. (b) Leakage rate: 0.5182 kg/s, wind speed: 3 m/s. (c) Leakage rate: 1.0329 kg/s, wind speed: 1 m/s. (d) Leakage rate: 1.0329 kg/s, wind speed: 3 m/s.
Hydrogen 06 00058 g004
Figure 5. LH2 storage tank leakage 60 s low-temperature area distribution, where (a) leakage rate: 0.5182 kg/s, wind speed: 1 m/s. (b) Leakage rate: 0.5182 kg/s, wind speed: 3 m/s. (c) Leakage rate: 1.0329 kg/s, wind speed: 1 m/s. (d) Leakage rate: 1.0329 kg/s, wind speed: 3 m/s.
Hydrogen 06 00058 g005aHydrogen 06 00058 g005b
Figure 6. The volume of FGC in each working condition.
Hydrogen 06 00058 g006
Figure 7. Equivalent stoichiometric gas cloud volume (Q9).
Hydrogen 06 00058 g007
Figure 8. X-Y section explosion overpressure distribution with time (−y).
Hydrogen 06 00058 g008
Figure 9. X-Y section explosion overpressure distribution with time (+y).
Hydrogen 06 00058 g009
Figure 10. X-Y section explosion overpressure distribution with time (−x).
Hydrogen 06 00058 g010
Table 1. Parameters for various source terms.
Serial NumberOutlet Mass Flow Rate (kg/s)Temperature (k)Hydrogen Mass FractionOutlet Velocity (m/s)Fictitious Source Speed (m/s)False Source Area (m2)
ST10.07120.280.1730.2513.010.0055
ST20.07120.280.3457.4427.970.002
ST30.07120.280.60100.6262.010.0017
Table 2. Boundary conditions for FLACS leakage diffusion and explosion.
BoundaryDiffusion ProcessExplosion Process
XHINozzlePLANE_WAVE
XLOWindPLANE_WAVE
YHINozzlePLANE_WAVE
YLOWindPLANE_WAVE
ZHIWindPLANE_WAVE
ZLONozzleEULER
InletJET/
Table 3. Simulation conditions.
Simulation ConditionLeakage DirectionLeakage PointLeakage Rate (kg/s)Wind Speed (m/s)
ST1−y(19, 40, 2.5)0.51821.0
ST2−y0.51823.0
ST3−y1.03291.0
ST4−y1.03293.0
ST5+y(19, 45, 2.5)0.51821.0
ST6+y0.51823.0
ST7+y1.03291.0
ST8+y1.03293.0
ST9−x(16.5, 42.5, 2.5)0.51821.0
ST10−x0.51823.0
ST11−x1.03291.0
ST12−x1.03293.0
Table 4. The farthest flammability distance and low-temperature distance comparison table.
ComparisonST1ST2ST3ST4ST5ST6ST7ST8ST9ST10ST11ST12
The farthest combustible distance (m)171617.5164627413421255025
The farthest low-temperature distance (m)161616161613161619101919
Table 5. Damage of explosion overpressure to buildings and human body [42].
Peak Overpressure (bar)Losses to BuildingsInjury to Persons
0.06895Door and window glass damageFragments cause minor damage
0.1379Causes moderate damage to houses (e.g., doors and windows blown off, roofs severely damaged)Smashed by debris and falling objects
0.2068The collapse of residential structureMay cause serious injury or death
0.3447Most buildings collapsedIncreased probability of death
0.6895Serious damage to reinforced concrete buildingsMost deaths
1.37The reinforced concrete building was toppled downThe mortality rate is close to 100%.
Table 6. Explosion hazard value data.
Parameter−y Direction+y Direction−x Direction
Maximum hazard radius (m)161616
Peak overpressureoverpressure (bar)0.550.490.61
detrimentThe probability of most buildings collapsing and the number of casualties increasing.The probability of most buildings collapsing and the number of casualties increasing.The probability of most buildings collapsing and the number of casualties increasing.
Maximum overpressure in compressor roomoverpressure (bar)0.010.070
detrimentAlmost nothing happened.The windows and doors’ glass were damaged and the fragments caused minor injuries to the personnel.Nothing
Maximum overpressure of hydrogen storage cylinder groupoverpressure (bar)0.310.080
detrimentMost buildings collapsed and the probability of casualties increased.The windows’ and doors’ glass were damaged and the fragments caused minor injuries to the personnel.Nothing
Maximum overpressure of liquid hydrogen tankeroverpressure (bar)00.240.3
detrimentNothingThe collapse of the residential structure and it may result in serious injuries or deaths to the people.Most buildings collapsed and the probability of casualties increased.
Disclaimer/Publisher’s Note: The statements, opinions and data contained in all publications are solely those of the individual author(s) and contributor(s) and not of MDPI and/or the editor(s). MDPI and/or the editor(s) disclaim responsibility for any injury to people or property resulting from any ideas, methods, instructions or products referred to in the content.