Article

Effect of Applied DC Electric Fields on H2–Air Axisymmetric Laminar Co-Flow Diffusion Flames with Low Carbon Impurities

by
Susith D. P. G. Halowitage
1,
Hasith E. Perera
2,
Nicholas M. Elmore
1 and
Fabien Goulay
1,*
1
C. Eugene Bennett Department of Chemistry, West Virginia University, Morgantown, WV 26506, USA
2
Department of Physics and Astronomy, West Virginia University, Morgantown, WV 26501, USA
*
Author to whom correspondence should be addressed.
Hydrogen 2025, 6(2), 38; https://doi.org/10.3390/hydrogen6020038
Submission received: 16 April 2025 / Revised: 13 May 2025 / Accepted: 20 May 2025 / Published: 1 June 2025

Abstract

:
We investigated experimentally the influence of flow conditions and electrode position on a diffusion H2–air flame subjected to an external electric field. We determined the minimum impurity level required to observe changes in flame properties with applied voltage. Flame OH chemiluminescence signals were recorded using a UV-sensitive CCD array as a function of voltage (+10 to −10 kV) applied to a stainless-steel ring electrode placed around the burner nozzle. Changes in chemiluminescence signals are reported as a function of electrode height above the burner, airflow, and fuel composition. Significant changes in OH* distributions were observed for voltages below −5 kV. Under optimum conditions, the height of the chemiluminescence flame decreased by up to 67% at the maximum applied voltage. The flame transitioned from a teardrop shape to a flat, open-tip flame at a voltage corresponding to an inflection point in the flame height–voltage profiles. Increasing the airflow rate shifted the inflection point to more negative values until almost suppressing the effect of the electric field on the flame structure. This study reveals that carbon impurities in hydrogen fuel as low as 10 ppm are sufficient to observe significant effects from external electric fields without changing the underlying neutral chemistry. We also determine the set of parameters that control the amplitude of the structural change.

Graphical Abstract

1. Introduction

With the ever-growing population and concerns about carbon emissions, a change in the paradigm of energy production is required. Such a shift involves moving away from traditional, fossil-fuel-based sources and toward cleaner and more sustainable alternatives. Hydrogen has the unique ability to support the electric grid while providing clean energy to a variety of demands that may not easily be electrified. Its high energy density is an attractive alternative to fossil-based energy for long-distance transport, heat-intensive industries, and chemical production. To be competitive with current energy sources, the cost of producing and utilizing hydrogen must be considerably lowered. The wide gap between today’s capabilities for hydrogen use and those required for a cleaner energy future requires developing new technologies for optimizing energy production.
Hydrogen gas for combustion applications is mostly produced by fossil fuel reforming [1] and does not require the level of purity necessary for the operation of fuel cells. It is likely to always contain carbon impurities due to the high cost associated with on-site gas purification [2]. Although low levels of impurities are unlikely to change the chemistry of the combustion process [3], they will generate a significant amount of charged species, making the use of electrodynamic technologies, already implemented for hydrocarbon fuels, possible. Externally applied DC electric fields have been shown to increase combustion energy release while reducing unwanted emissions [4,5,6,7,8,9,10]. Electric fields are known to affect species’ thermal trajectories by increasing their velocity and influencing the direction of flow fields [11,12,13]. Plasma-assisted combustion technologies also consider the role of transient electric fields on flame features [14,15,16]. Despite the promising advantages of combustion electrodynamic control for energy generation, there are only a few applications of these technologies for hydrogen transformation [17,18]. In addition to leading to higher energy release and leaner fuel conditions, electric fields applied to hydrogen combustion may be used to suppress instabilities and manipulate the flame shape and direction. Such a level of control is valuable in specific applications as micro-combustion or industrial burners, allowing for a more efficient and precise energy delivery.
Hydrogen flame chemistry has been extensively studied, and complete neutral [19,20,21,22,23,24] and ionic [25,26,27,28,29,30,31,32,33,34] chemical schemes are available. The H3O+ cation is expected to be formed mainly by the reaction of OH with two hydrogen atoms [25,31,32,35] as per the following:
OH + H + H ⇌ H3O+ + e.
At the temperature of the flame, however, the equilibrium is not favorable to cation formation [3,25,29,31,35]. For these reasons, electric fields are expected to have small to negligible effects on hydrogen flames in the absence of hydrocarbon impurities [36]. The experimental H3O+ cation’s number density, >109 cm−3 [25,37], which was measured in H2/O2/N2 flames, far exceeds the expected equilibrium abundance; this is mostly due to the presence of trace amounts of hydrocarbons [26]. The impurities generate CH radicals, precursors to CHO+ and H3O+, through reactions Equations (2) and (3) [27,35,38,39,40,41]
CH + O ⇌ CHO+ + e
CHO+ + H2O ⇌ CO + H3O+
without any significant change to the flame properties and neutral species composition [26,35,42]. Experimental studies have shown that adding less than 100 ppm of hydrocarbon impurities to a hydrogen flame can increase the H3O+ number density by up to two orders of magnitude [43], which suggests that even with natural trace amounts of hydrocarbons, electric fields could be used to optimize hydrogen combustion.
In hydrocarbon flames, or hydrogen flames with a low level of impurities, the most abundant positively and negatively charged species are H3O+, CHO+, C2H3O+, C3H3+, OH, C2H, HCO3, CO3, O2, and electrons [44,45,46,47,48,49,50,51,52,53,54]. Most ions are primarily located in the reaction zone, with the H3O+ cation also present in the burned gas region of the flame [46,49,51,53], where ions recombine with electrons [28,33,34,35,38,41].
Under the effect of an electric field, charged species that are present in the flame move toward the opposite-charge electrode, resulting in an ionic motion (ionic wind) [13,27,54,55,56,57]. If the force resulting from the momentum transfer between the charged and neutral species (fi) is competitive with the hydrodynamic flow forces (ff), the electric field will induce changes in flame velocity and shape, neutral species’ number densities, and gas temperature, ultimately altering chemical reaction rates [56,57,58,59]. Fundamental information about ionic winds has been obtained by benchmarking simulation outcomes against experimental data recorded in hydrocarbon flames under the influence of external electric fields [10,13,60,61,62]. Microgravity experiments have also enabled researchers to study ion-driven effects on flames in the absence of buoyancy forces [63,64]. In a recent study, Belhi et al. [13] simulated the ionic wind effect in premixed methane–air flames subjected to a DC electric field. The OH iso-contours obtained from numerical simulations were compared with experimental flame images to illustrate the impact of the electric field on flame shape. The simulations successfully reproduced the characteristic flame tilt toward the cathode, confirming the influence of ionic wind on flame dynamics. Charge transfer reactions that generate large oxygenated anions were found to play a critical role in simulating the flame–electric field interaction. For hydrogen flames, the lowest impurity level required to observe a change in flame properties under the effect of an electric field is likely to depend on the system’s flow conditions and the burner geometry.
The geometry of the burner and electrode system was found to be critical in maximizing the effect of electrical body forces on combustion [11,65,66]. Co-flow laminar diffusion flames coupled with non-ionizing electric fields have been used to benchmark model outcomes against experimental flame height [12,57,67,68,69,70,71,72]. Other approaches have utilized chemiluminescence or planar laser-induced fluorescence to probe species such as CH, OH, and CH2O [73,74,75,76]. The quantitative detection of OH radicals has been widely used in model validations in both diffusion and premixed-type flames [75,76,77,78]. Naturally occurring excited OH radicals (OH*) can be used to characterize flame structure [57,74,75,79,80,81,82] and reaction zones [83,84,85]; they are also good markers of heat release rates [86,87]. In a recent study, Walsh et al. [75] used OH* and CH* profiles to optimize and validate a reduced chemical model including charged species. A full understanding of the role of ionic winds on combustion chemistry requires experimental data across a wide range of burner geometries and fuel compositions.
In this study, we investigate the influence of flow conditions and electrode position on a diffusion H2–air flame with low carbon impurities subjected to an external electric field. We aimed to determine the minimum impurity concentration required to observe electrodynamic effects across a wide range of experimental conditions. The burner was designed to maximize the effect of the electric field on the flame [11,66,80]. We identified the optimal ring-to-nozzle ratio that not only supports a larger flame surface area (i.e., a taller and broader flame without inducing flow oscillations) but also maximizes the flame’s sensitivity to externally applied electric fields. This configuration enables more pronounced and controllable changes in flame structure, which is essential for both experimental diagnostics and practical applications involving electric-field-assisted combustion. Flame OH* chemiluminescence was recorded over a wide range of electric field strengths, electrode positions, and airflow rates. The effects of carbon impurities on the OH* measurements were investigated by adding known amounts of ethylene gas to the H2 fuel. Ultimately, our experiment provides a lower limit on the level of impurities required to observe changes in flame properties under the effect of an electric field. The experimental data are further supported by CHEMKIN modeling to investigate the effect of added impurities on charged species concentrations. The empirical data provided here are a set of observables recorded under well-determined conditions for the validation of models trying to reproduce the effect of an externally applied electric field on combustion flames. To our knowledge, no such models have been applied to H2-flame systems.

2. Experimental Design and Image Analysis

2.1. Experimental Setup

Figure 1 depicts the main components of the experimental setup: gas supply, co-flow burner, ring electrode, high-voltage power supply, and optical diagnostics. Detailed descriptions of each component are provided below.

2.1.1. Co-Flow Burner and Gas System

A co-flow Santoro-type burner [88] with reduced fuel inlet size was designed to generate a stationary atmospheric axisymmetric laminar flame. The fuel nozzle is a 6.44 mm-OD, 4.37 mm-ID 304-grade stainless steel that was machine-tapered over a 3.25 mm length to reach a thickness of 0.25 mm and an ID of 4.37 mm at the plane of exit [89]. The tip of the fuel inlet was held 10 mm above the air inlet [12]. The inner diameter (ID) of each air inlet is a 97.18 mm cylinder concentric with the fuel inlet. A ceramic honeycomb, 110 mm in height with 1.5 mm holes, was placed inside the air inlet to achieve a laminar coaxial airflow around the flame and to minimize disturbances from surrounding air movements. Homogeneous airflow within the tube was achieved by a 30 mm section of packed glass beads (3 mm diameter) between two wire meshes (0.50 mm holes), 160 mm below the honeycomb. Two additional wire meshes were placed between the glass bead section and the ceramic honeycomb to minimize airflow turbulence [90].
The gas supply lines are composed of 304-grade stainless steel tubing with an inner diameter of 4.37 mm. A check valve was mounted in the fuel line to prevent reverse flow. Laboratory-grade compressed air was used as co-flow. The room temperature was set to 25 °C, and humidity was uncontrolled. All experiments were carried out under atmospheric pressure conditions, and all gas flow rates were controlled using digital GM50A-MKS mass flow controllers (MFCs) connected to a combination of a readout unit (247D, MKS) and a web-operated computer interface. The system provided steady gas flow throughout the data collection process. Ultra-high-purity hydrogen gas (Matteson, 99.999%) and high-purity ethylene (Matteson, 99.9%) gas were used as fuels. The air sample (Breathing Air Grade D) has no detectable level of oil contamination. The certified specifications of the hydrogen and air samples are listed in the Supplementary Materials section. Total hydrocarbon impurities (THC) were not detected (<0.1 ppm) in the hydrogen sample, and carbon dioxide concentration was found to be below 100 ppm in the air sample. The experiments are found to be reproducible over several months of data collection, suggesting that external parameters, such as room humidity, have a negligible effect on the OH* flame heights.
Experiments were performed with an H2 flow rate of 500 sccm (standard cubic centimeters per minute) and a typical airflow rate of 25 slm (standard liters per minute), respectively. Data were also collected at 10, 79, and 85 slm. To achieve higher airflow velocities, a smaller-sized air inlet (ID of 42.10 mm) was also used. Using this air inlet, data were collected at 10, 40, 56, and 90 slm airflow rates.
The effects of hydrocarbon impurities on the flame structure were investigated by introducing controlled amounts of ethylene gas (C2H4) into the fuel line. The ion formation mechanism is likely independent of the nature of the hydrocarbon impurities. The C2H4 gas flow rates were controlled by a 10 sccm MFC connected to the H2 fuel line before the nozzle. To prevent reverse flow, a one-way valve was placed before the connection. A long tube (~1 m) line was used to facilitate the proper mixing of gases. The C2H4 gas flow rates were varied by 0.10 sccm increments from 0.00 to 0.50 sccm and by 0.25 sccm increments from 0.50 to 2.00 sccm. Carbon impurities are calculated by taking the ratio of the hydrocarbon standard flow rate to the total fuel standard flow rate (ppm).

2.1.2. Electrode System

We adapted the ring-nozzle electrode configuration from previous studies [66] to maximize the effect of the electric field on flame structure [11,27,91]. The fuel inlet nozzle was connected to the ground (nozzle electrode) during all experiments. The DC high voltage was applied to a stainless-steel ring electrode with a 35.50 mm OD and a 25.50 mm ID. An electrical insulating Ultem polyetherimide (PEI) rod and rubber washers were used to insulate the connections. The flame height was unaffected by the electrode, suggesting that the ring did not affect flow patterns.
The DC voltage signal was generated from a function generator (Tektronix AFG1062, Beaverton, OR, USA) with an amplitude ranging from 1–10 mVp-p. The signal was amplified to a variable DC voltage (0–±10 kV) using a high-speed high-voltage power amplifier (Trek Model 10/10B-HS). The voltage difference between the nozzle and ring electrodes was monitored with a high-voltage probe (Tektronix P6015, Beaverton, OR, USA) connected to an oscilloscope (Tektronix TDS 2024C, Beaverton, OR, USA). The applied voltage was scanned from −10.00 to −4.00 kV with 0.25 kV steps and from −4.00 to +10.00 kV with 1.00 kV steps. We ceased data collection when secondary ionization (arc discharge) occurred [91,92]. The supply voltage was kept in the linear current-voltage regime below the saturation level.
The ring electrode was oriented axisymmetric with the nozzle electrode and mounted on an adjustable XY translation stage with 500 µm precision (Thorlabs-LX20, Newton, NJ, USA) and a Z-axis translational stage (MISUMI-ZLSL150-10, Schaumburg, IL, USA). The electrode height above the burner corresponds to the distance between the nozzle tip and the center of the 5 mm thick ring electrode. When the ring electrode is aligned with the nozzle electrode, the bottom part of the flame is not observable. Placing the ring electrode 4.00 mm below the nozzle allowed us to capture the full flame structure. For convenience, the ring electrode at 4.00 mm below the nozzle is henceforth referred to as 0.00 mm. Data were collected at 0.00, 5.00, 7.50, 10.00, 15.00, and 20.00 mm electrode height above the burner.

2.1.3. Optical System
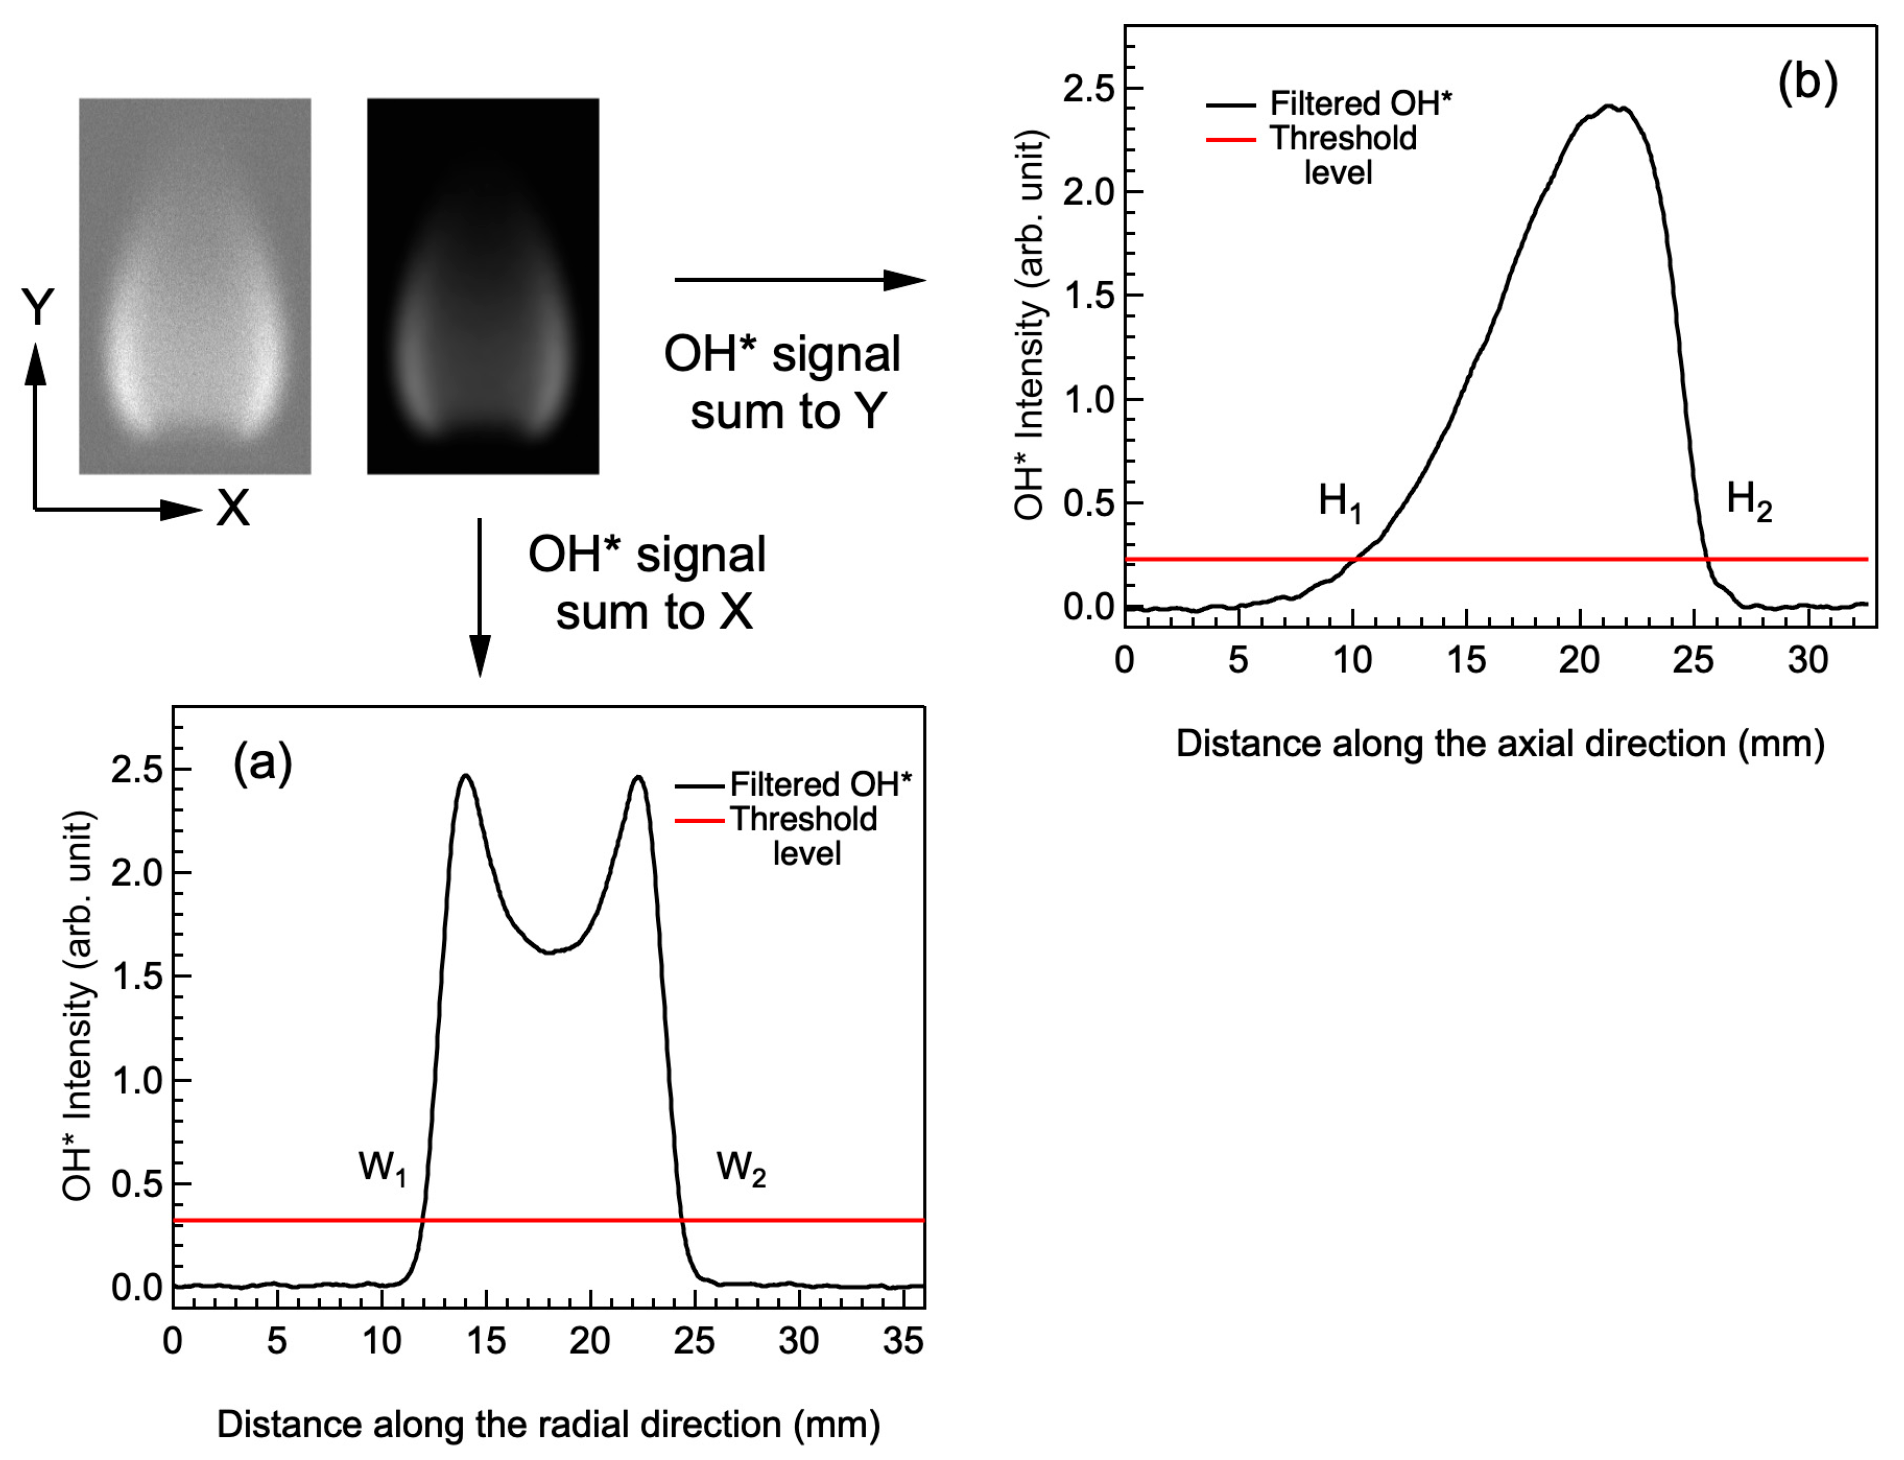
OH* chemiluminescence signals were captured using a pco.edge 4.2 bi UV compact cooled back-illuminated sCMOS (PCO Tech Inc., Wilmington, DE, USA) camera, placed 300 mm from the center of the burner. An optical lens (93 × 93 mm field view) and a 308–310 nm band-pass filter (ASAHI XBPA310, Torrance, CA, USA) were mounted in front of the camera. The camera’s CCD array is composed of 2048 × 2048 pixels (pixel size of 6.5 µm × 6.5 µm) with a ~40% quantum efficiency at 310 nm. The experimental exposure time was fixed to 120 ms, and 20 to 100 images were captured per acquisition. The flame images were saved in an 8-bit TIFF format. The camera has a dark current of 0.2 e pixel−1 s−1, leading to significant noise in the flame images. Image processing and analysis are described in Section 2.2.
Visible flame images were captured using a high dynamic range (HDR) camera with a 12 MP resolution (iPhone 13, Apple, Cupertino, CA, USA). As the images were collected under dark conditions, the brightness level and the contrast level were adjusted to −44 and +100, respectively. The camera was held at the same horizontal level as the nozzle tip. Images were saved in the JPG format, and the image size was adjusted manually to match the OH* images.

2.2. Image Analysis

A collection of 20 to 100 images was recorded and averaged for each experimental condition. Background images were recorded in the absence of flame or external light sources and subtracted from all individual flame images. A Gaussian filter was applied to reduce the noise present in the data. The images in Figure 2 show the OH* intensity map before (left) and after (right) filtering. All flame images in the dataset are normalized relative to the image with no external electric field. This normalization process ensures consistent intensity scaling across all images, allowing for meaningful comparison of flame structure and behavior under different applied electric field conditions.
The OH* flame width was defined by the horizontal distance between the two points for which the radial intensity profile represents 10% of its maximum, as shown in Figure 2a. The flame OH* height was defined similarly, as shown in Figure 2b. The pixel size in both directions was calibrated with an accuracy of 0.01 mm. Performing Abel inversion on the flame images led to no change in flame height and width. All images are reported without Abel inversion.

3. Modeling

3.1. Electrode Modeling

The 3D electric field lines around the burner and ring electrodes were simulated using the Magnetohydrodynamics (MHD) package in ANSYS-Fluent (Release 18.1) [93]. The modeling of the electric field was oversimplified and did not take into consideration local electric fields due to the redistribution of charges in the flame. The field lines are used here to guide our understanding of the experimental findings. A 2D schematic and measurements of the modeled geometry are displayed in Figure S1. The ring electrode and nozzle parts were considered as solid bodies and subtracted from the fluid domain. The boundary conditions were taken from previous studies and adapted to the experimental conditions [58,74,94,95]. A non-uniform quadrilateral mesh of 30,000 nodes (250 × 120 of resolution) was generated, and a medium refined grid was selected to accommodate both result accuracy and computational cost [74,96].
In the simulation, conducting wall boundaries were specified with voltage values. Stainless steel was used as the conducting material (ring and nozzle), and wood was used as the non-conducting material. The electrical conductivity values for these materials were set to their default values in the simulation software (ANSYS-Fluent, Release 18.1). The walls of the ring electrode and nozzle in the fluid domain were specified as −10 kV and 0 kV, respectively. All the other walls were classified as non-conducting walls. The electric field strength (contour plot) and streamline orientations were calculated for different positions of the electrode above the burner. The calculations were performed iteratively until the convergence criteria were met and visualized using the ParaView (version 5.12.0-RC1) open-source software. This ensured that the solution reached a stable and consistent state, free from numerical instabilities or significant errors. A grid independence study was also conducted, demonstrating that the results were not influenced by the mesh size or resolution. Although experimental data were not available for direct comparison, the simulation setup was based on well-established physical principles and realistic material properties. Electric field simulations for comparable systems have demonstrated similar field line behaviors and material interactions, validating the findings of this study [57,95,96,97].

3.2. CHEMKIN Modeling

To further investigate the effect of added ethylene impurities on H3O+ ion concentrations, numerical studies have been carried out using CHEMKIN. The simulations were performed using a 1-D, burner-stabilized, premixed laminar flame model for both H2–O2 and C2H4/H2–O2 flames. The chemical schemes for radical and ionic species were adapted from the San Diego database [98] (57 species and 268 reactions) and Prager et al. [45] (11 charged species and 65 reactions). The input files of the reaction kinetics, transport data, and thermodynamic data were adapted from previous literature without performing a mechanism reduction. The full kinetic, thermodynamic, and transport data files are available in the SI. The H3O+ production and consumption rates are displayed in Figure S2 for a pure hydrogen flame and are similar to profiles found in the literature. The addition of a low amount of impurity does not affect the OH, O, and H profiles (Figure S3).
In contrast to methane–air premixed flames, the simulations indicate that in low-impurity H2–O2 flames [13], the hydronium ion (H3O+) is the dominant positive species, while negative ions have a negligible number density. Figure 3 displays the modeled maximum H3O+ number densities in the reaction zone and post-reaction zone as a function of added ethylene impurities. The corresponding profiles are displayed in Figure S4, and the integrated H3O+ number densities are presented in Table S1. Adding only 1 ppm of ethylene impurities made the H3O+ number density higher in the reaction zone than in the post-reaction zone. The addition of 5 ppm of ethylene increased the number of densities in the reaction zone and post-reaction zone by a factor of 10 and 8, respectively. For ethylene concentrations higher than 100 ppm, H3O+ number densities in the reaction zone were already in the lower limit of the cation number density range found in hydrocarbon flames [46,50,51]. Overall, the H3O+ number density in the reaction zone increased by a factor of 450 from 0 to 250 ppm and by a factor of 5 from 250 to 2000 ppm. The cation number density in the post-reaction zone plateaued for concentrations higher than 500 ppm at an average value of ~3 × 108 cm−3. At the level of impurities expected in the present experiments (~<100 ppm), the H3O+ number density may have already been in the high 108 cm−3 range, close to the lower limit of ion number densities found in hydrocarbon flames. Additional ethylene (up to 2000 ppm) increased the cation number density by less than an order of magnitude.

4. Results and Discussion

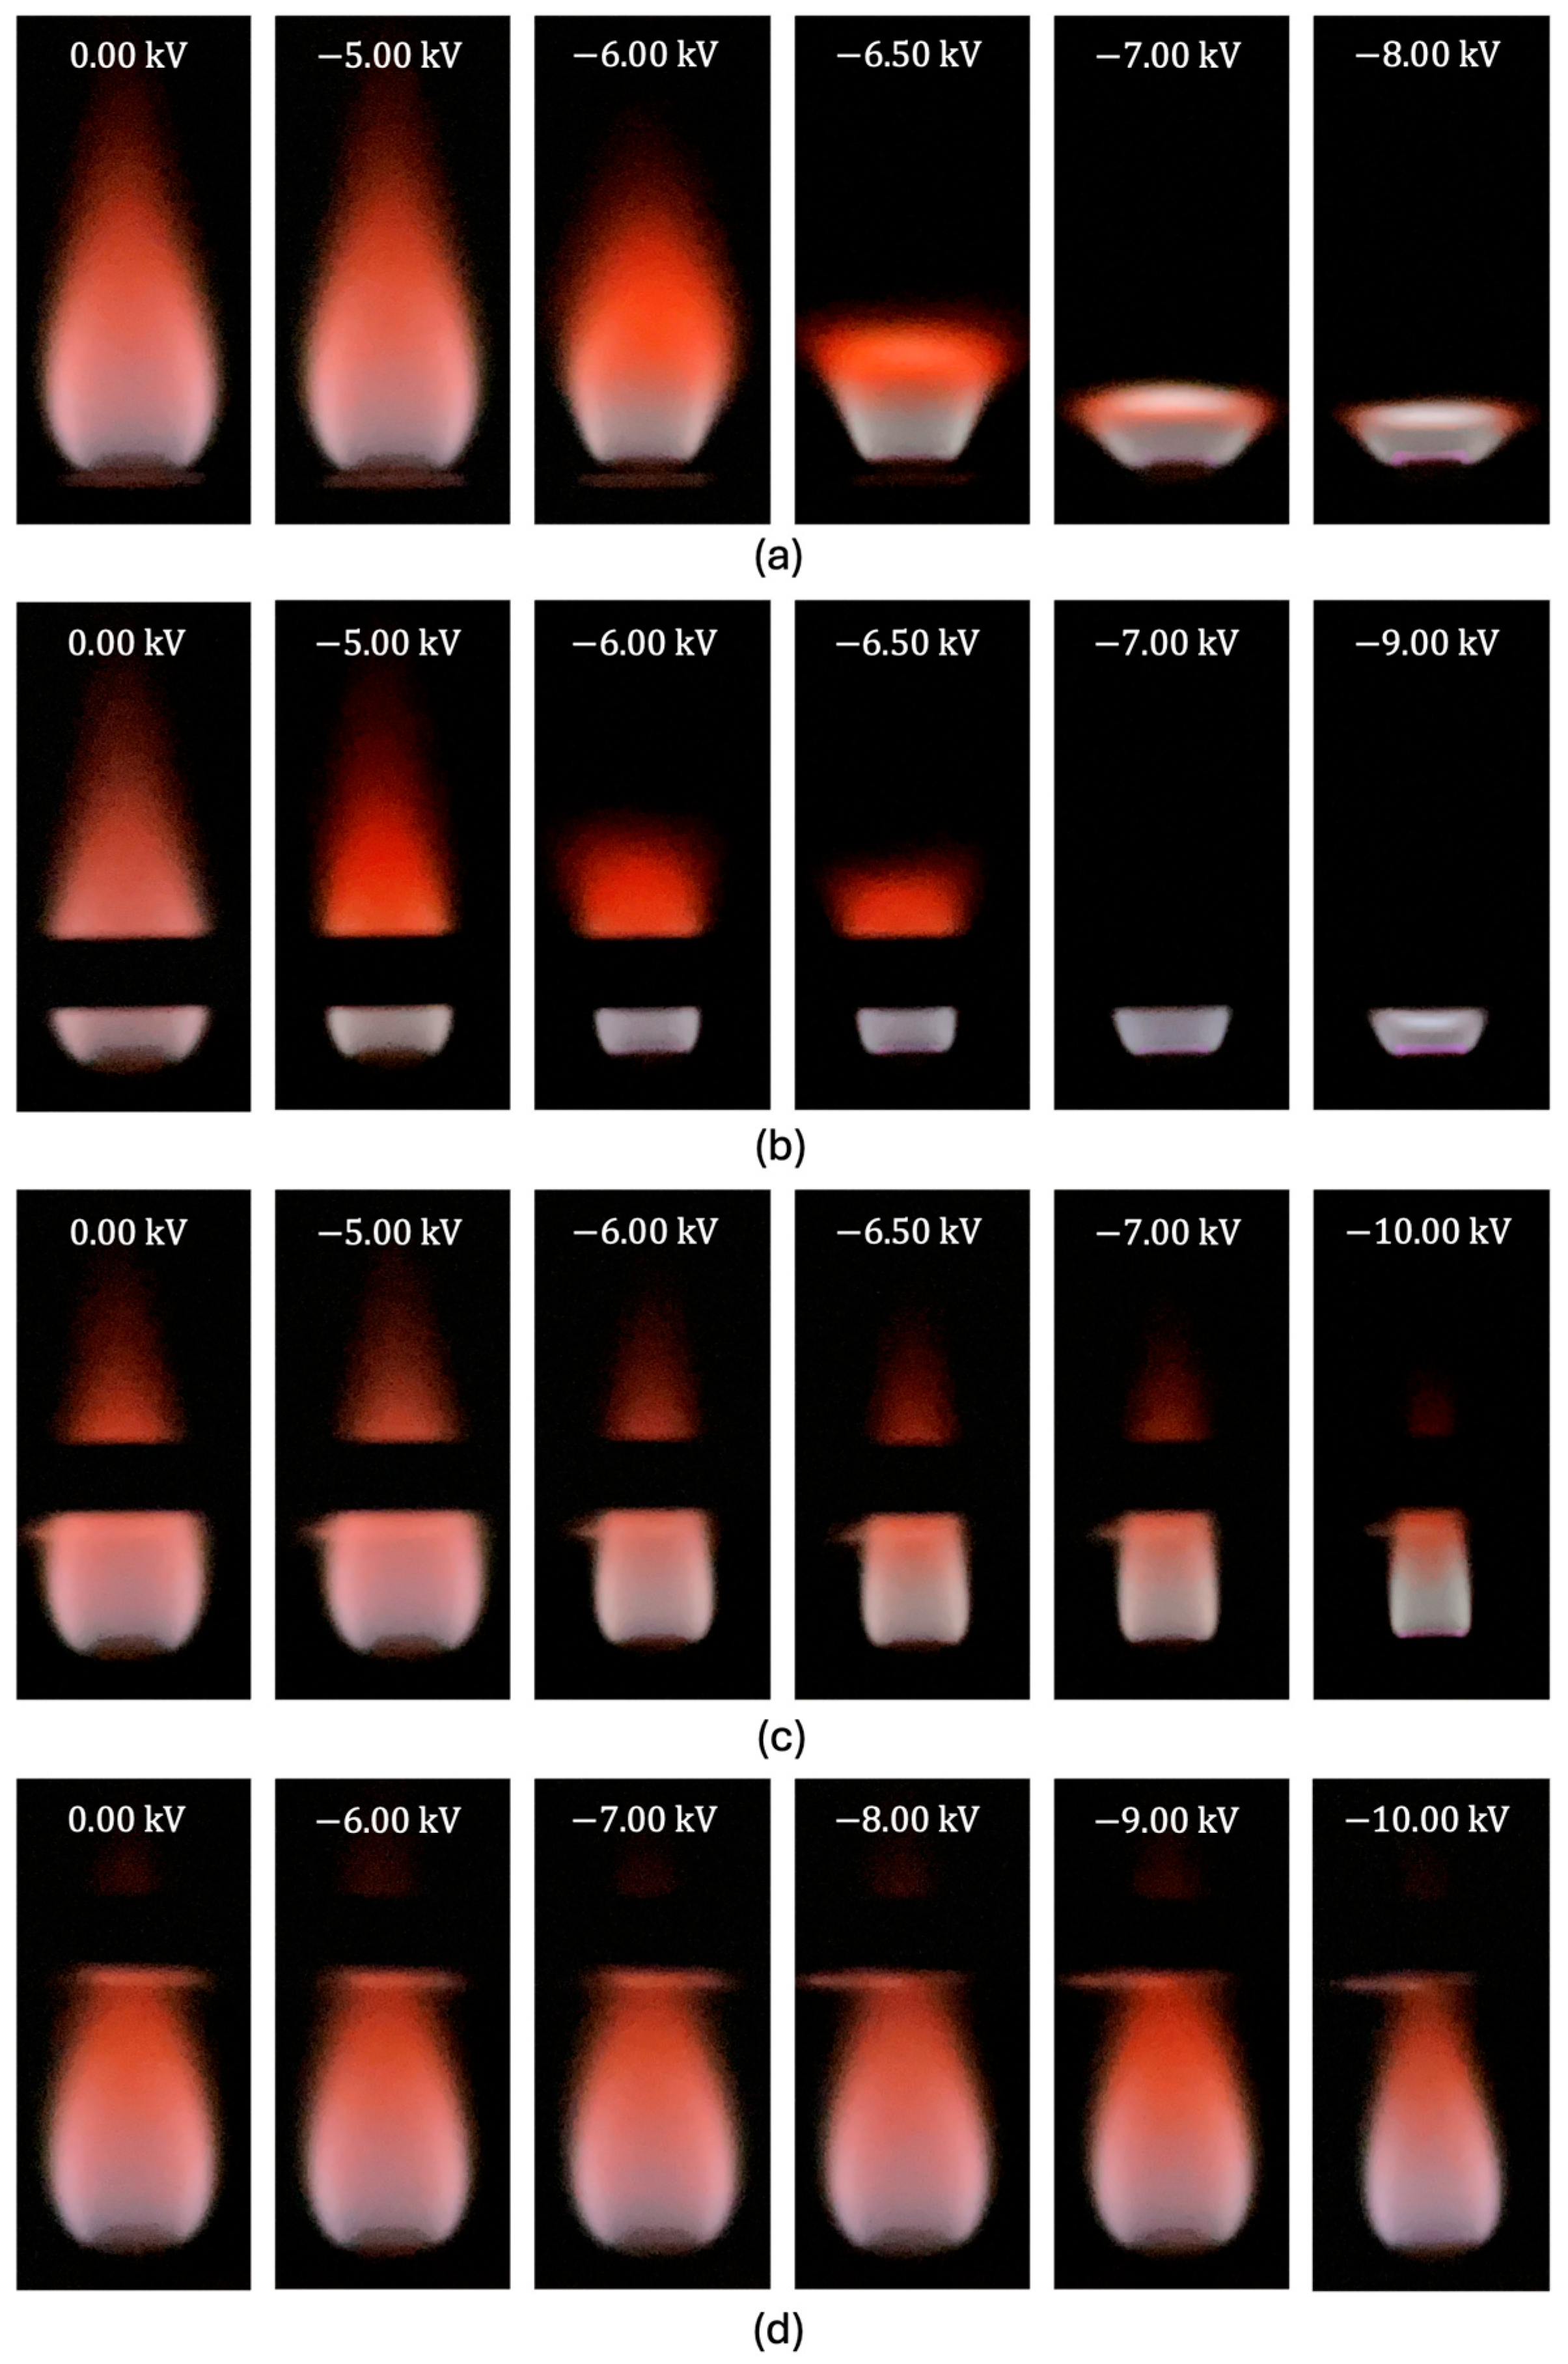
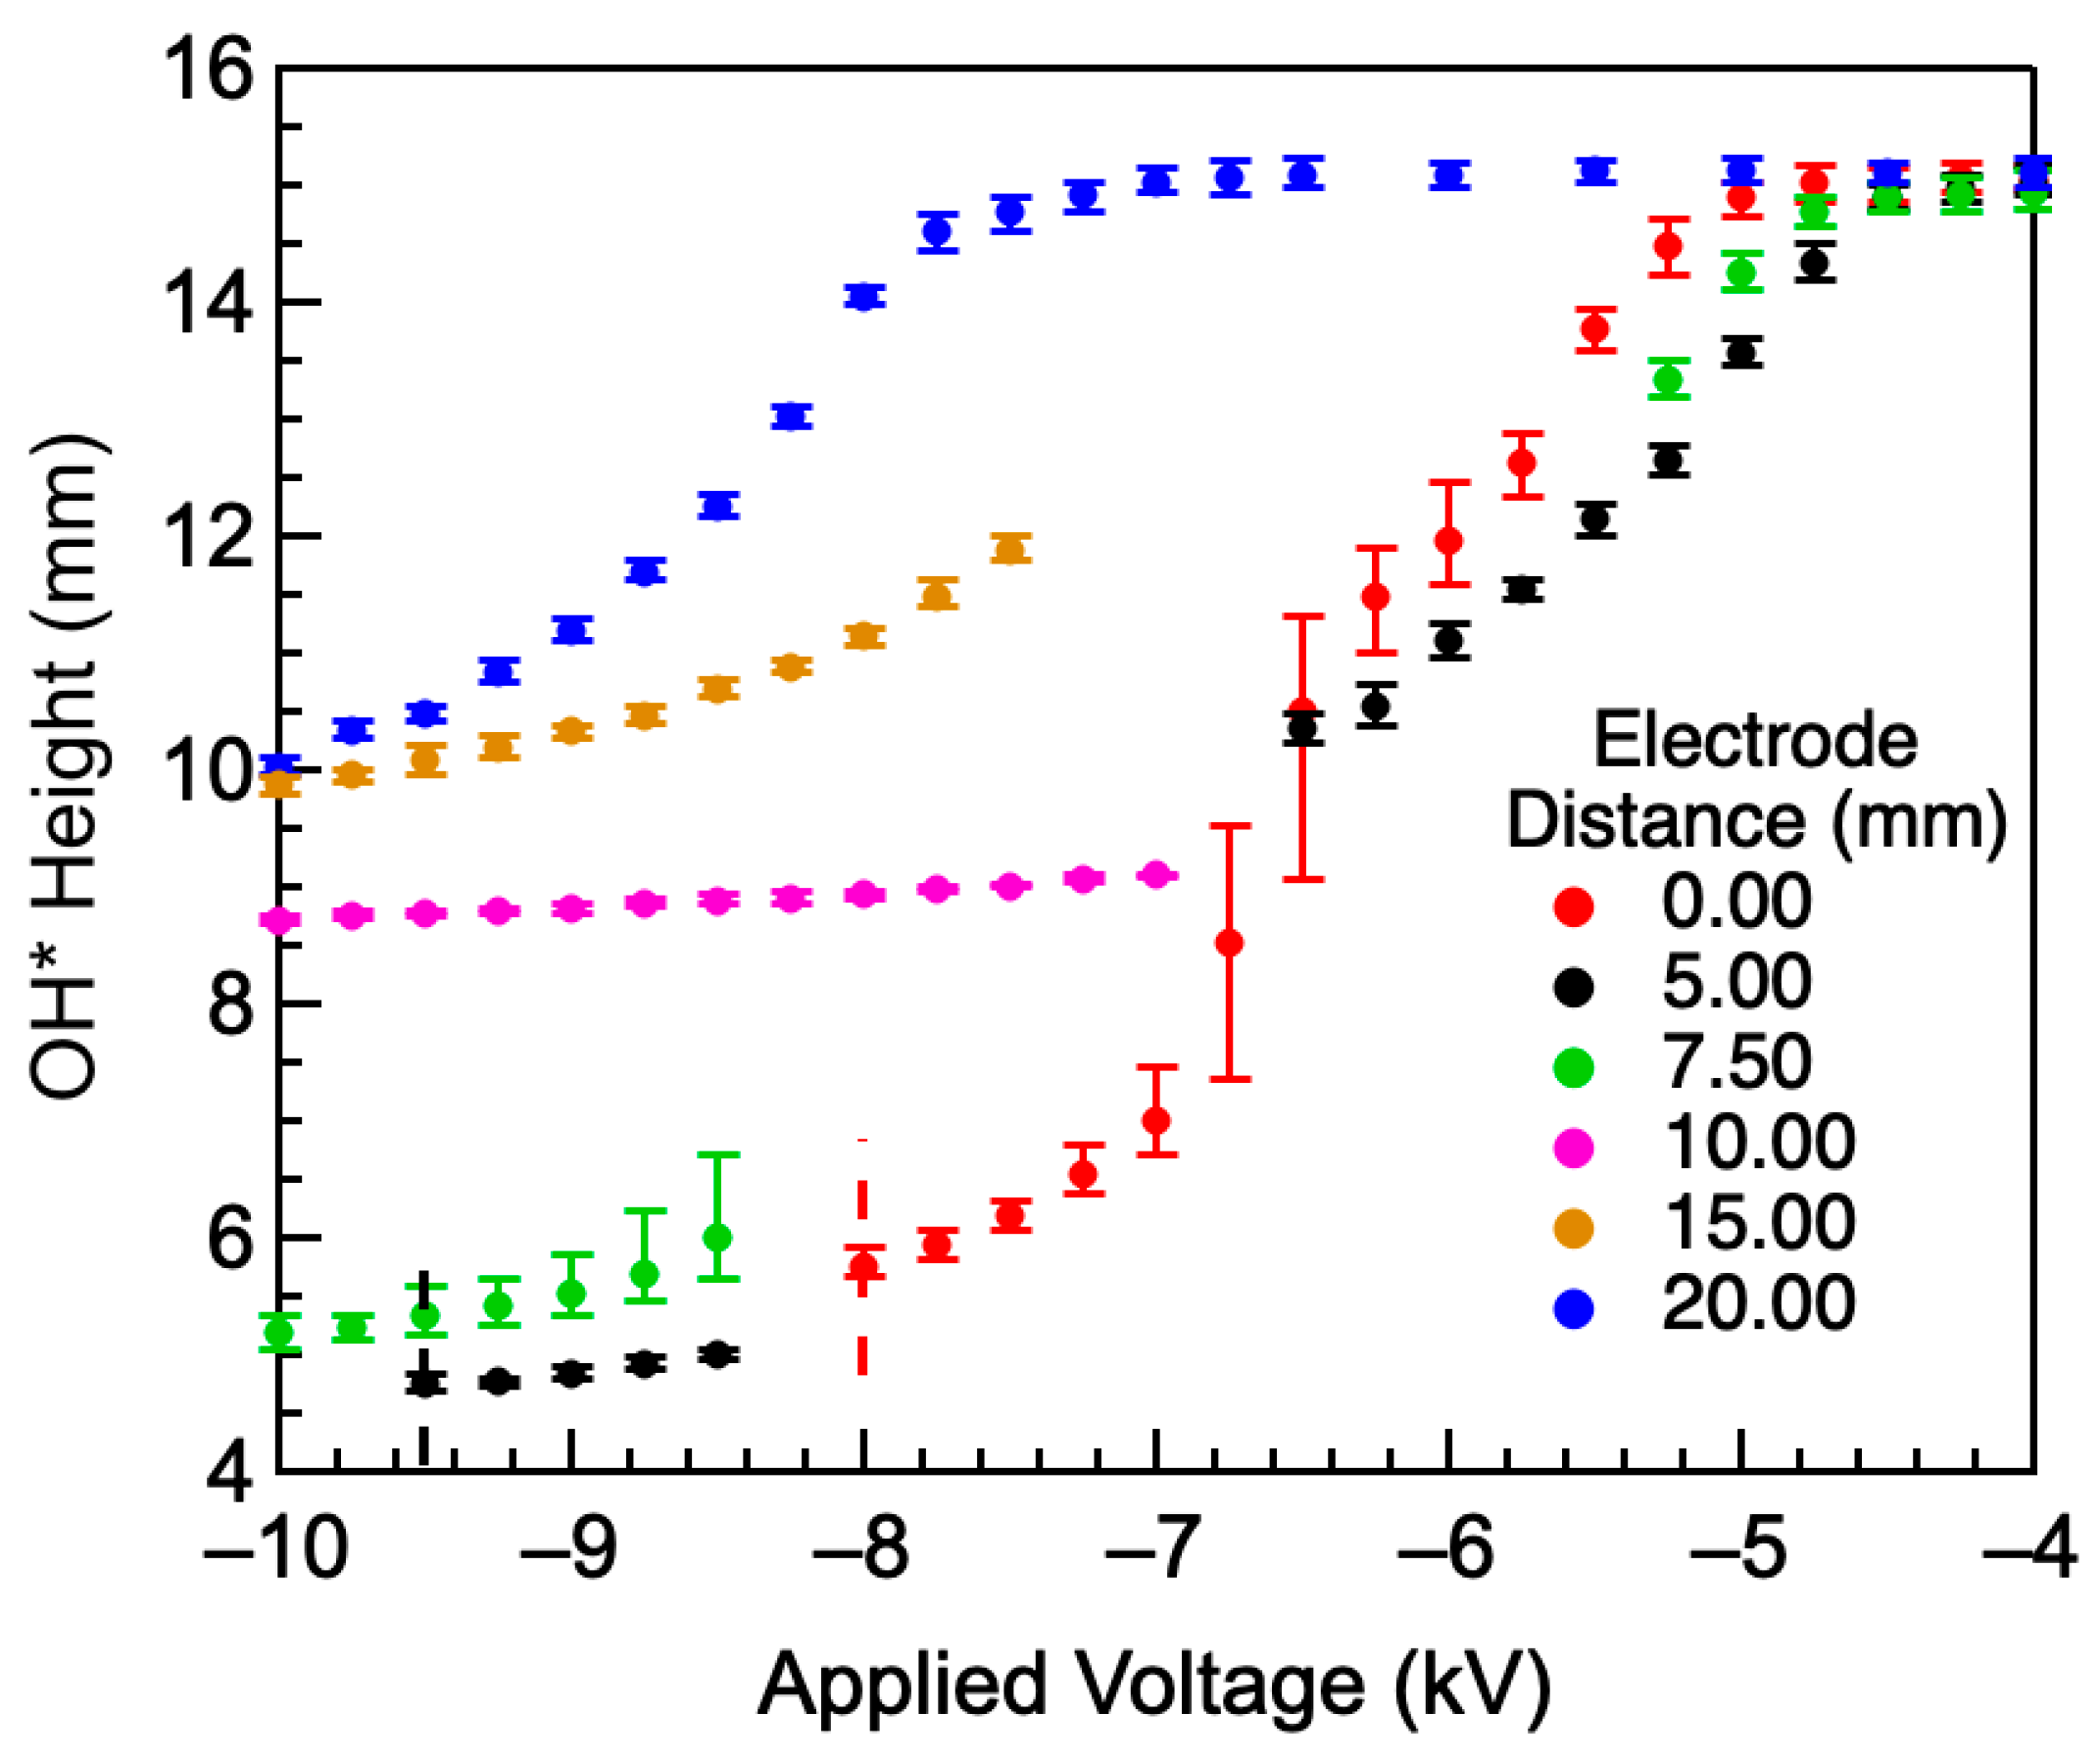
4.1. Effect of Electric Field on OH* Flame Structure

Figure 4 displays the OH* intensity images recorded as a function of voltage in an H2–air flame with standard flow conditions and ring electrodes at (a) 0.00 mm, (b) 5.00 mm, (c) 10.00 mm, and (d) 20.00 mm above the burner nozzle. For each electrode position, the voltage is selected to display the maximum change between the different images. The missing signals in Figure 4b,c are due to the ring electrode hiding the flame emission. The flame had a closed-tip teardrop shape, with the bottom of the flame below the nozzle tip. The areas where the OH* signal intensity is maximum are representative of the reaction zone. At positive voltages and voltages higher than −5kV, there was no significant change in flame structure when the electric field was applied. At more negative voltages, the reaction zone contracted closer to the burner nozzle; the strongest effects were observed when the electrode was closest to the nozzle tip. As the flame contracted, the intensity of the OH* chemiluminescence increased, which is likely due to an increase in radical number density. For the electrode above 10.00 mm, the flame width also tended to decrease with decreasing negative voltage. For an electrode higher than 50.00 mm above the burner, the applied electric field had no observable effect on flame shape, even at the highest applied voltage.
Figure 5 displays the visible images recorded as a function of voltage in an H2–air flame with standard flow conditions and ring electrodes at (a) 0.00 mm, (b) 5.00 mm, (c) 10.00 mm, and (d) 20.00 mm above the burner nozzle. With no external electric field applied, the flame height is the same for all electrode positions, suggesting that the aerodynamic effects of the electrode are not observable. The light-blue visible emission follows a similar trend to the one for OH* emission described above. At high negative voltage and for the electrode below the nozzle exit, the red emission from highly vibrationally excited water molecules [99] was almost extinguished.
Figure 6 displays the OH* height as a function of negative voltage for different positions of the ring electrode above the burner. The data points represent average OH* heights at each voltage, and the error bars represent the minimum and the maximum OH* height values. Missing data points are due to the ring electrode blocking the flame from the camera. The vertical dashed lines for electrodes at 0.00 and 5.00 mm show the voltages for which an arc discharge occurs. No discharges are observed over the applied voltage range for distances above 5.00 mm and voltages below 10 kV. The lack of dependency of the OH* height on electrode position further confirms that any aerodynamic effects of the electrodes on the flame structure are not observable.
The voltage threshold required to observe a change in flame height is defined as the voltage at which the flame height has decreased by 5% of its initial value. The thresholds are displayed in Table 1 as a function of electrode height above the burner, together with the maximum height and width decreases. The voltage threshold values were found to move toward more negative values as the electrode was raised above the burner. At the maximum reachable voltage, the flame height decreased by 67% when the electrode was 5 mm above the nozzle. The height change percent decreased significantly when the electrode was placed above 7.50 mm.
We observed large fluctuations in flame height at 0.00 mm between −6.50 and −7.00 kV. Similar oscillations were observed at 5.00 and 7.50 mm, although part of the flame was hidden by the electrode. This oscillating regime corresponded to a transition into a flat, open-tip flame and an inflection point (sigmoid function) in the height–voltage profiles (Table 1). The voltage of the inflection point was determined by taking the maximum of the first derivative relative to the applied voltage. The error bars represent the range in flame height near the inflection point and are characteristic of the flame oscillations. For the electrode below the nozzle’s exit, the inflection point was observed at −6.75 kV. For the electrode at 20.00 mm above the burner, there was an inflection point at −8.25 kV, although no shape transition was observed. Similar changes are observed for the flame width (Figure S5) and are reported in Table 1. Large error bars were observed for the electrode at 0.00 mm due to the flickering of the flame edge after the transition to a flat open-tip flame.
In Figure 3, the level of impurity expected in the flame (1–100 ppm) suggests a cation number density up to 2 × 108 cm−3. The changes in flame width and height reported in Table 1 result from ionic winds caused by the momentum transfer of impurity-generated H3O+ cations. The smaller change in width observed in Figure S5 is likely due to the smaller electric field gradient along this direction, resulting in smaller ionic wind forces. The maximum electric field effect was observed when the electrode was near or within the reaction zone, where most of the cations are expected to be located. A map of the electric field strength is displayed in Figures S6 and S7. The field lines are likely representative of the ionic wind forces in the flame. In the presence of an electric field, the visible flame appeared to follow the field lines (see Figure S7), resulting in a flat, open-tip flame for the electrode below the nozzle output and a narrower flame for the electrode 10.00 mm above the burner. For higher electrode positions, the electric field still affected the tip of the flame where the ion density was lower, but the flow forces were weaker.
The transition from a teardrop shape to a flat open flame is observed when the electrode is around or below the nozzle. In this case, electrons are accelerated toward the nozzle, increasing the electron density. The high electron density may lead to new ion formation through collisional ionization with the neutrals within the reaction zone. As cations are accelerated toward the ring electrodes, and anions toward the burner electrode, ionic wind forces become greater than the buoyancy forces, leading to a shape change. Further modeling of these phenomena is required to fully understand the shape transition.

4.2. Effect of Airflow Rate on OH* Height

Figure 7 displays the flame height as a function of airflow rate from (a) 10 slm to 85 slm for a Santoro burner (97.18 mm ID air inlet) and (b) 10 slm to 90 slm for a burner with a reduced-size air inlet (ID of 42.00 mm). The air inlet velocity ranges are selected to overlap and show a large change in frame properties. The electrode height above the burner was fixed at 0.00 mm. The corresponding air inlet velocities are displayed in Table 2, along with the voltage thresholds and maximum flame height decreases. Selected OH* and visible images are displayed in Figure S8 of the Supplementary Materials section. The airflow rate was found to affect the natural flame height and to have only a small effect on the initial voltage threshold and minimum flame height. The inflection point shifted toward more negative values as the flow rate increased. At the maximum experimental airflow velocity, the inflection point was not observable, and the flame height changed by only 21% of its initial value, compared to a ~60% change at low inlet airflow velocities. The changes in flame height were due to the competition between the ionic and flow forces. As the air flow was increased, higher ionic forces were required to lead to a change in flame height. For similar voltages, a smaller flow rate led to a larger height change.
For the electrode below and near the reaction zone, as the airflow increased, the threshold for initial change in flame height was unaffected, while the voltage of the inflection point moved to more negative voltages. The initial changes likely took place within the post-reaction zone, where the flow forces were the least affected by the air co-flow. At the inflection point, ionic wind forces likely became dominant compared to the flow forces. An increase in flow forces led to a shift of the inflection point to a more negative voltage.
The data in Figure 6 and Figure 7 show that the change in flame height occurs only below an initial threshold that depends mostly on electrode position. The change in flame size only below ~−5 kV is similar to trends observed in a pre-mixed methane–air flame. The absence of an ionic wind [100] effect at positive voltages could be due to the accumulation of free electrons in the reaction zone, thereby significantly increasing the effective mobility of the negatively charged species, consequently decreasing the local electric field [100].

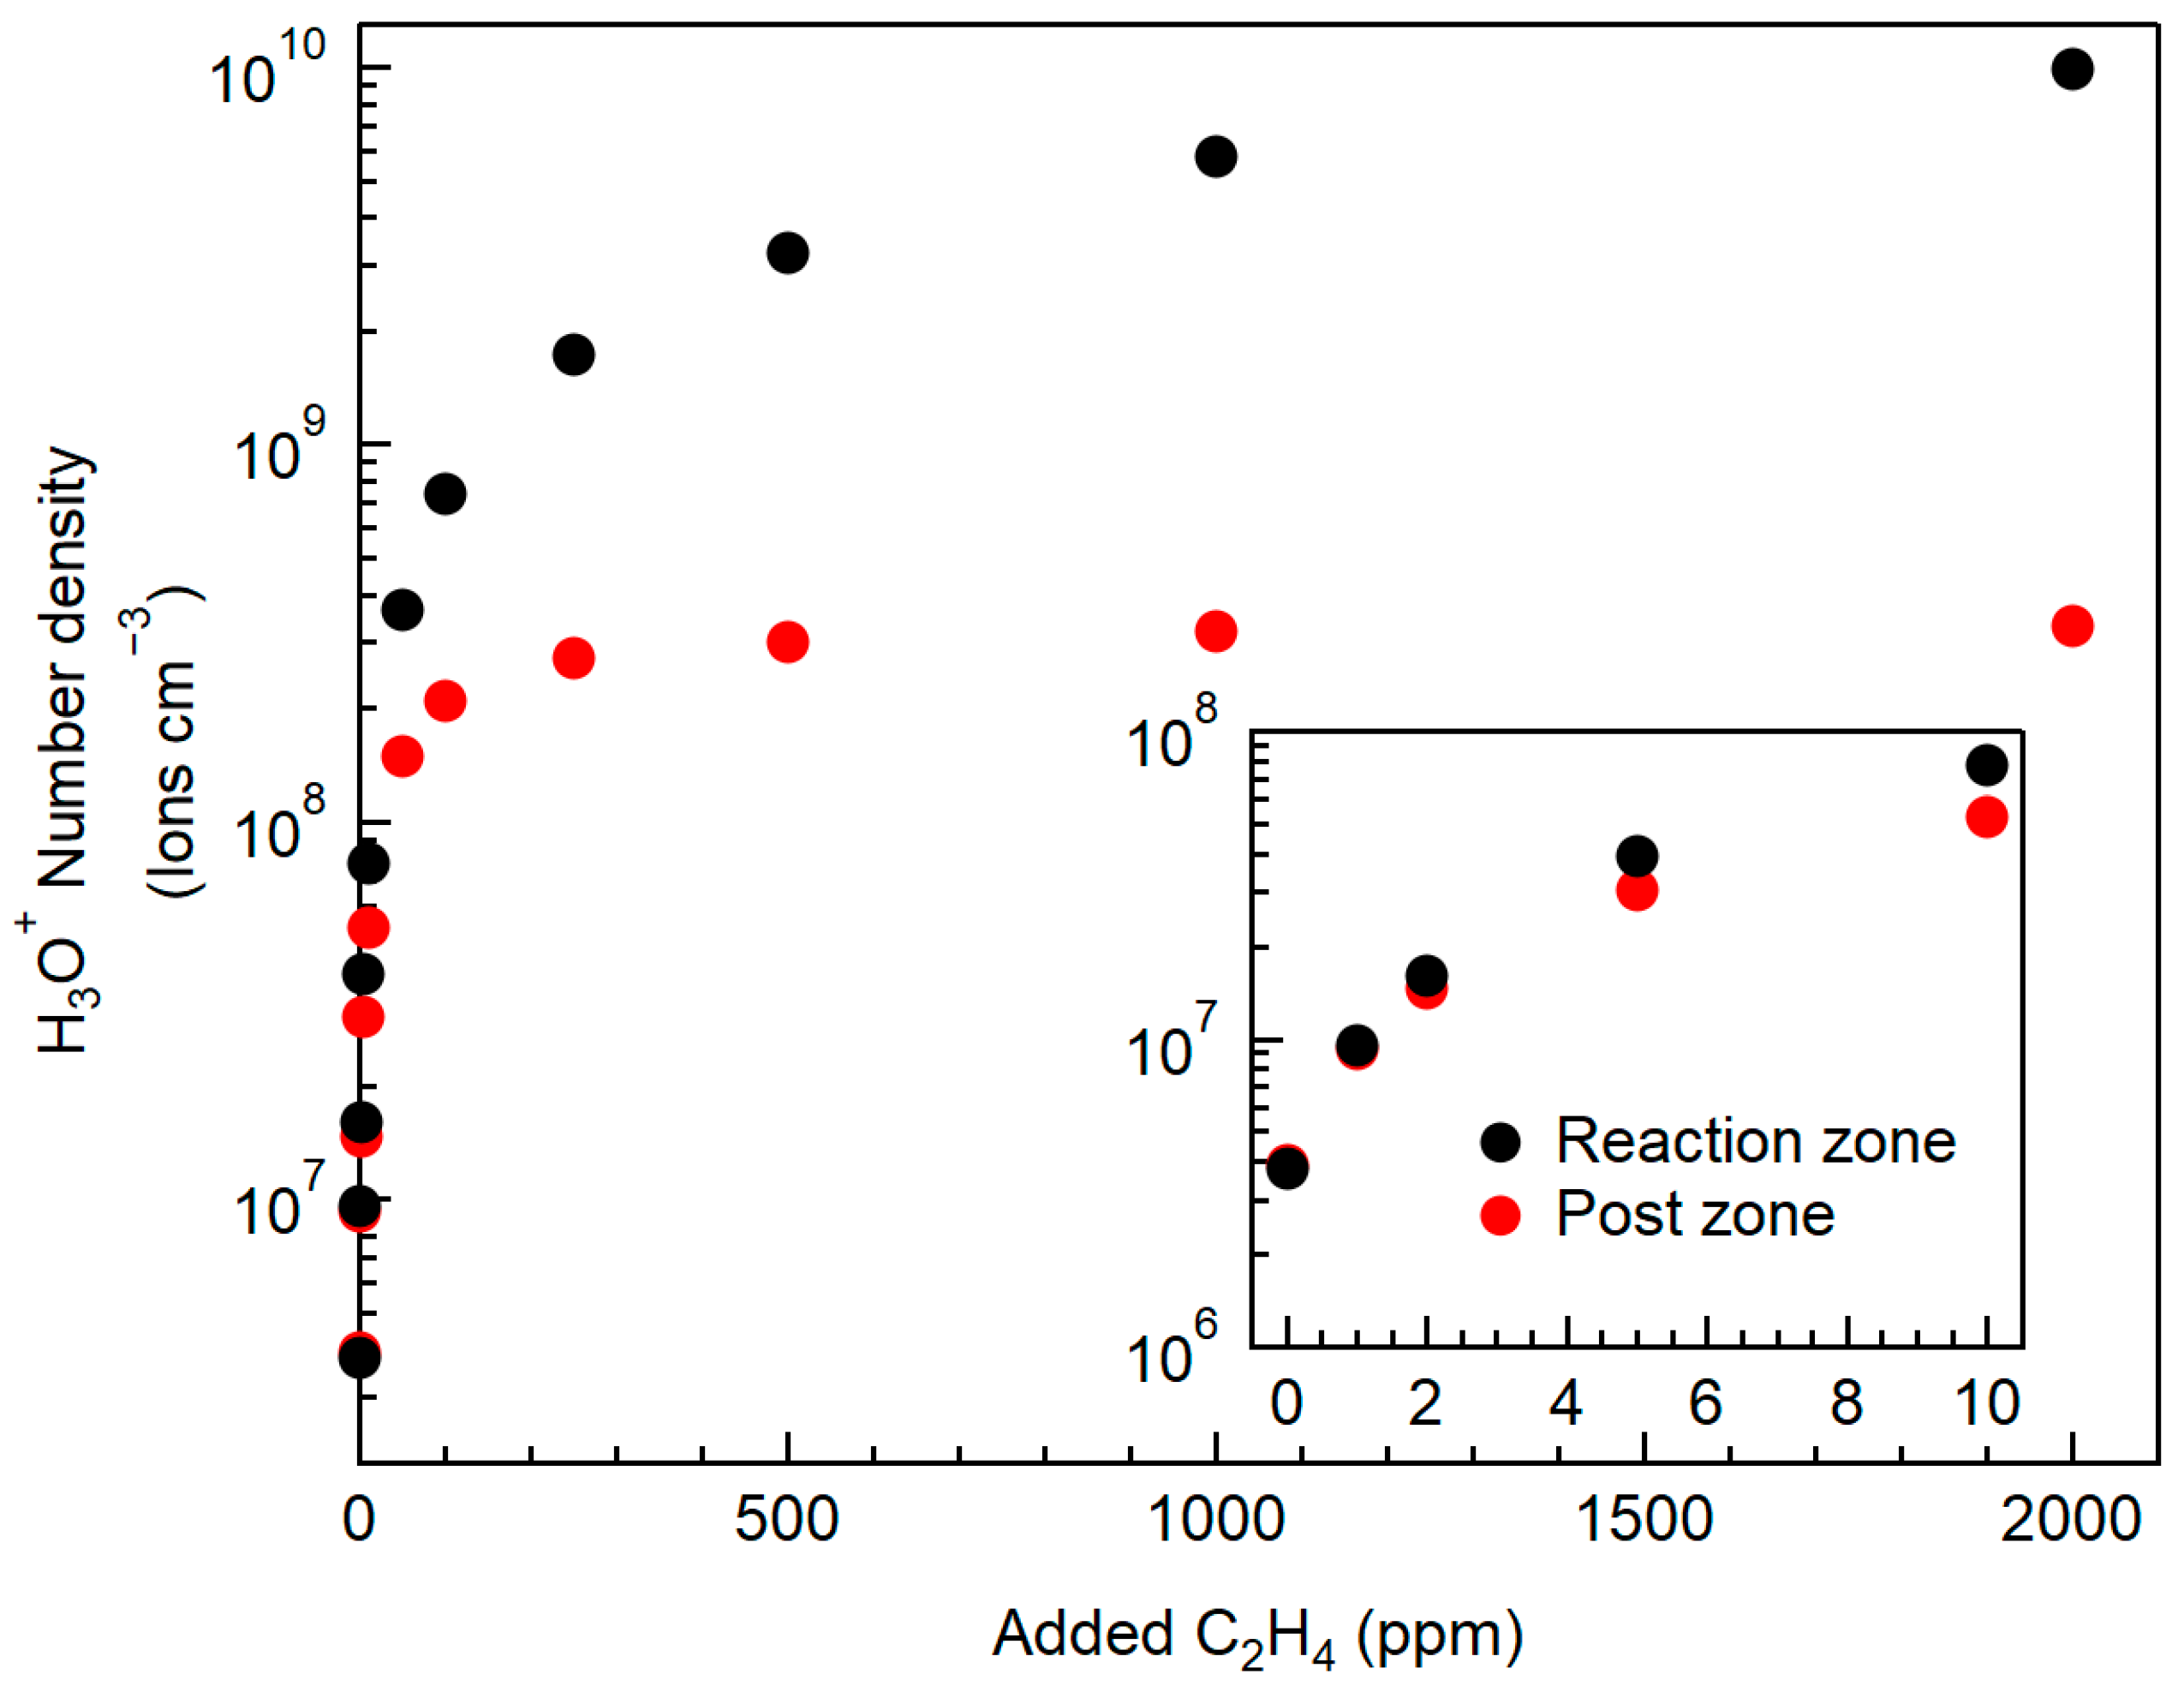
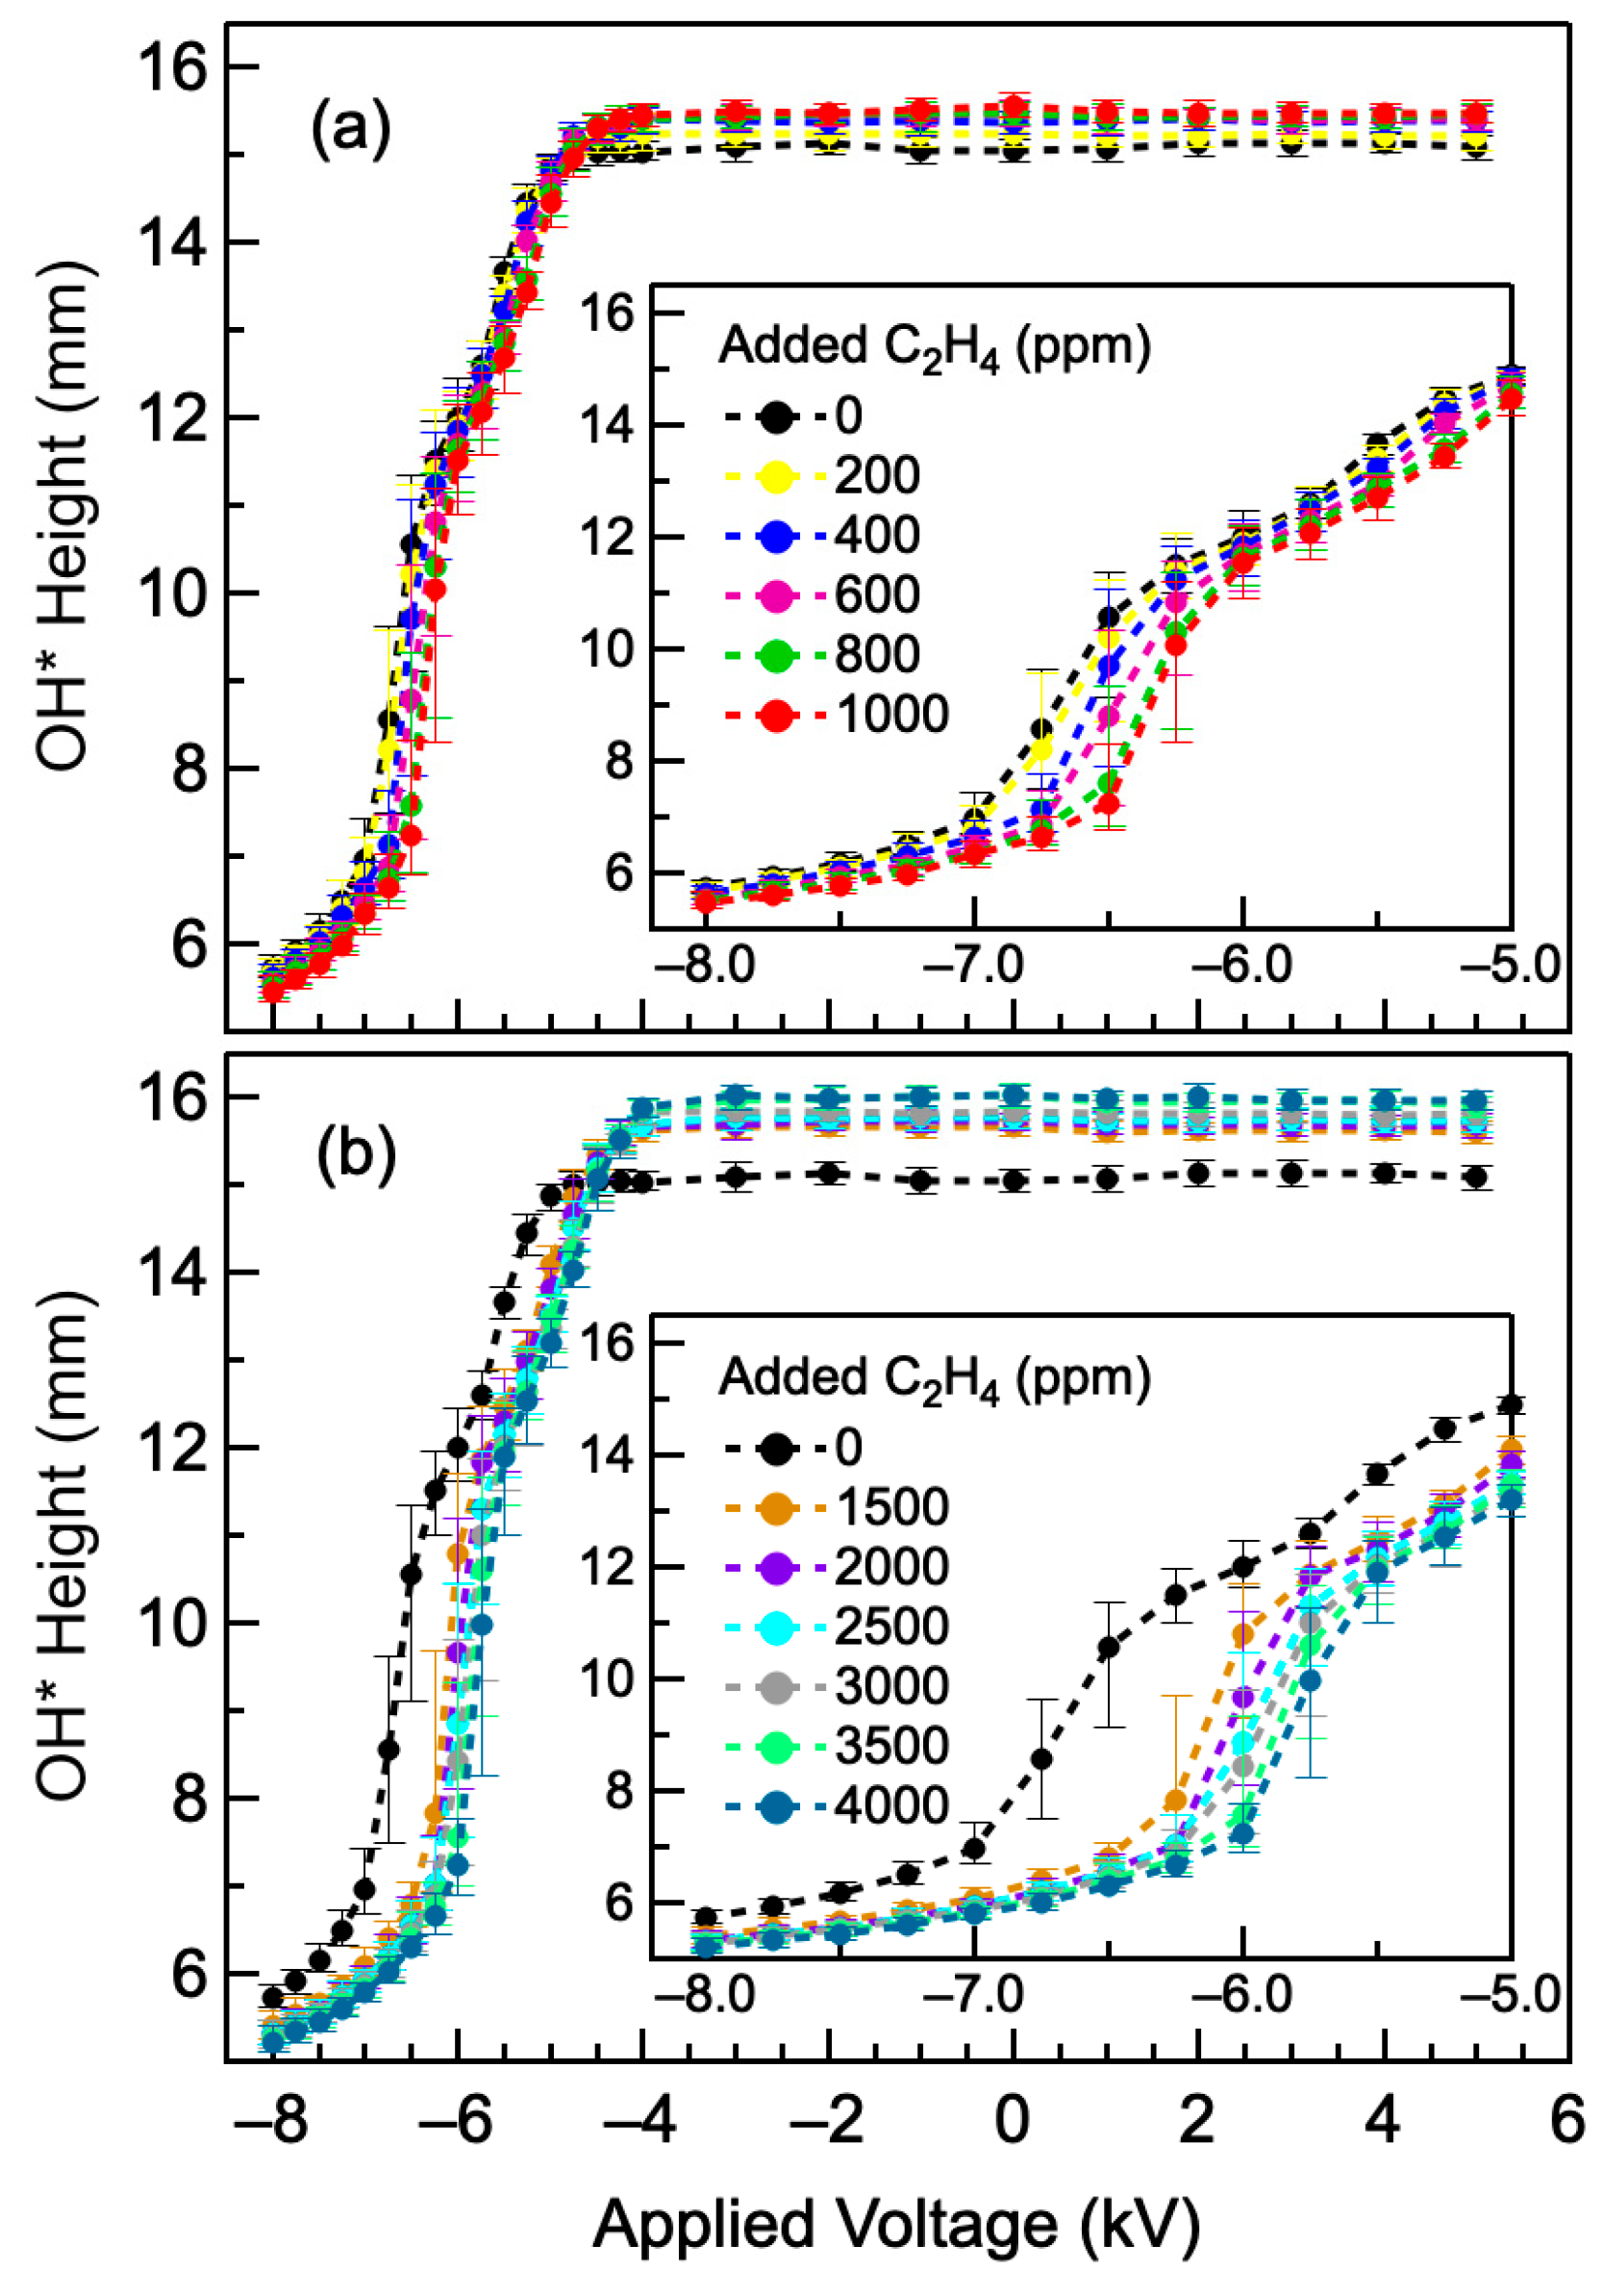
4.3. Effect of Added Hydrocarbon Impurities

Figure 8 displays the OH* flame height as a function of the applied electric field for added ethylene impurities from (a) 200 to 1000 ppm and (b) 1500 to 4000 ppm. The data points represent the average OH* height at each voltage, and the error bars represent the minimum and the maximum OH* height values. Added impurities increased the natural flame height but had a limited effect on the value of the minimum achievable height. The threshold voltage, at which the flame height decreased by 5% of its initial value, shifted from −5.25 kV with no added ethylene to −4.50 kV with 4000 ppm added ethylene. The voltage inflection point, corresponding to a change in flame shape, shifted from −6.75 kV to −5.75 kV over the same ethylene concentration range.
The change in OH height profiles as a function of voltage is consistent with the modeled ion densities displayed in Figure 3. Without adding any impurities to the flame, the ionic winds are sufficient to confine the flame to its smallest possible value. Increasing the ion concentration by adding impurities shifts the inflection point to a higher voltage. The position of the inflection point is characteristic of the balance between the ionic forces and the flow force and depends on the ion density. As the electric field strength increased, the reaction zone appeared to be confined to a smaller volume, likely increasing the charge species number densities. The observed variation in inflection point voltages as impurities are added (Figure S9) is consistent with the trend in H3O+ number density displayed in Figure 3. For voltages well below the inflection point, the flame height became mostly independent of applied voltage, added impurity, electrode height (electrode below 10.00 mm), and airflow rate.

5. Conclusions

We recorded visible and UV flame emissions in an H2–air diffusion flame with a controlled amount of carbon impurities over a wide range of flow conditions. OH chemiluminescence was used to follow the dimensions of the reaction zone under an externally applied electric field at different airflow rates and electrode heights above the burner. We found that the OH* flame height was unaffected by the electric field for applied voltages below −4.75 kV, regardless of flow rate and electrode position. More key findings are summarized below:
  • Hydrocarbon impurities as low as 10 ppm may generate sufficient charge carriers to observe changes in H2–air flame properties under externally applied electric fields. Above 100 ppm, adding more carbon impurities only had a small effect on the flame interaction with the electric field.
  • The dimensions of the reaction zone, as defined by OH* emission, decreased for applied voltages below −5 kV. The OH* flame height decreased up to 67% at the lowest negative voltage. No changes in flame dimensions were observed for positive voltages.
  • The most significant effects were observed when the ring electrode was near or within the reaction zone. Electrodes placed above the reaction zone only affected the flame tip, where the cation number density was low.
  • For an electrode near or within the reaction zone, the flame transitioned from a teardrop shape to a flat flame at a voltage corresponding to an inflection point in the height–voltage profiles. The inflection point was independent of the electrode position within the reaction zone but moved to more negative values as the airflow rate increased. This voltage likely corresponds to an electric field for which ionic forces are equal to flow forces.
  • The minimum achievable flame height depended only upon the electrode height above the burner. Once the cations were confined to a small volume, ionic forces were able to further contract the flame, regardless of flow rate and added impurity concentrations.
Model validations, including impurity-generated ions and ionic winds in hydrogen systems, are now required to support the above empirical observations.

Supplementary Materials

The following supporting information can be downloaded at: https://www.mdpi.com/article/10.3390/hydrogen6020038/s1, Figure S1: Schematic of the system geometry used in Ansys-fluent MHD; Figure S2: Rate of production of H3O+ along the axial direction of the H2–O2 flame; Figure S3: Mole fraction of H, OH, and O along the axial direction of the flame; Figure S4: The H3O+ number density in a H2–O2 flame; Figure S5: OH* flame width profiles as a function of applied voltage; Figure S6: Modeled electric field strength for the ring electrode 10.00 mm above the tip of the nozzle electrode; Figure S7: Superimposed flame images on the modeled electric field lines; Figure S8: OH* and visible flame images of in a reduced air inlet H2–air flame; Table S1: The integrated H3O+ number densities in the reaction zone and post-flame region as a function of added ethylene impurities; Complete CHEMKIN kinetic data; Complete CHEMKIN thermodynamics data; Complete CHEMKIN transport data.

Author Contributions

Conceptualization, F.G.; methodology, F.G. and S.D.P.G.H.; formal analysis, S.D.P.G.H., H.E.P. and N.M.E.; investigation, S.D.P.G.H. and N.M.E.; resources, F.G.; writing—original draft preparation, S.D.P.G.H.; writing—review and editing, F.G.; visualization, S.D.P.G.H.; supervision, F.G.; project administration, F.G.; funding acquisition, F.G. All authors have read and agreed to the published version of the manuscript.

Funding

This research was funded by the Brodie Discovery and Innovation Fund.

Data Availability Statement

The raw data supporting the conclusions of this article will be made available by the authors on request.

Acknowledgments

The authors also thank V’yacheslav Akkerman and Mark Tinsley for help with the burner simulations and image analysis.

Conflicts of Interest

The authors declare no conflicts of interest.

References

  1. Victor, N.; Nichols, C. Future of hydrogen in the U.S. energy sector: MARKAL modeling results. Appl. Energy Combust. Sci. 2024, 18, 10. [Google Scholar] [CrossRef]
  2. Sun, M.J.; Duan, L.Q.; Zhou, Y.F.; Zhang, H.F.; Huang, L.C.; Zheng, N. Study on a novel hydrogen purification approach base on methane steam reforming process with CO-preferential oxidation and CO2 removal. Appl. Energy 2025, 377, 20. [Google Scholar] [CrossRef]
  3. Hayhurst, A.N. Mass spectrometric sampling of flames: How ionic equilibria in flames produce sampling falsifications and “fake” ions, but provide kinetic and thermodynamic data on the reaction occurring. Prog. Energy Combust. Sci. 2022, 88, 56. [Google Scholar] [CrossRef]
  4. Barmina, I.; Purmalis, M.; Valdmanis, R.; Zake, M. Electrodynamic Control of the Combustion Characteristics and Heat Energy Production. Combust. Sci. Technol. 2016, 188, 190–206. [Google Scholar] [CrossRef]
  5. Sánchez-Sanz, M.; Murphy, D.C.; Fernandez-Pello, C. Effect of an external electric field on the propagation velocity of premixed flames. Proc. Combust. Inst. 2015, 35, 3463–3470. [Google Scholar] [CrossRef]
  6. Fang, J.F.; Wu, X.M.; Duan, H.; Li, C.; Gao, Z.Q. Effects of Electric Fields on the Combustion Characteristics of Lean Burn Methane-Air Mixtures. Energies 2015, 8, 2587–2605. [Google Scholar] [CrossRef]
  7. Park, D.G.; Choi, B.C.; Cha, M.S.; Chung, S.H. Soot reduction under dc electric fields in counterflow non-premixed laminar ethylene flames. Combust. Sci. Technol. 2014, 186, 644–656. [Google Scholar] [CrossRef]
  8. Belhi, M.; Domingo, P.; Vervisch, P. Modelling of the effect of DC and AC electric fields on the stability of a lifted diffusion methane/air flame. Combust. Theory Model. 2013, 17, 749–787. [Google Scholar] [CrossRef]
  9. Wang, Y.; Nathan, G.J.; Alwahabi, Z.T.; King, K.D.; Ho, K.; Yao, Q. Effect of a uniform electric field on soot in laminar premixed ethylene/air flames. Combust. Flame 2010, 157, 1308–1315. [Google Scholar] [CrossRef]
  10. van den Boom, J.; Konnov, A.A.; Verhasselt, A.; Kornilov, V.N.; de Goey, L.P.H.; Nijmeijer, H. The effect of a DC electric field on the laminar burning velocity of premixed methane/air flames. Proc. Combust. Inst. 2009, 32, 1237–1244. [Google Scholar] [CrossRef]
  11. Payne, K.G.; Weinberg, F.J. A preliminary investigation of field-induced ion movement in flame gases and its applications. Proc. R. Soc. Lond. A 1959, 250, 316–336. [Google Scholar]
  12. Hu, J.; Rivin, B.; Sher, E. The effect of an electric field on the shape of co-flowing and candle-type methane-air flames. Exp. Therm. Fluid Sci. 2000, 21, 124–133. [Google Scholar] [CrossRef]
  13. Belhi, M.; Lee, B.J.; Cha, M.S.; Im, H.G. Three-dimensional simulation of ionic wind in a laminar premixed Bunsen flame subjected to a transverse DC electric field. Combust. Flame 2019, 202, 90–106. [Google Scholar] [CrossRef]
  14. Ghabi, A.; Boushaki, T.; Bocanegra, P.; Robert, E. Laminar Burning Velocity, Adiabatic Flame Temperature, and Pollutants of Biogas/Air Mixture at Various CO2 Concentrations and Plasma Assist. Combust. Sci. Technol. 2023, 195, 1599–1621. [Google Scholar] [CrossRef]
  15. Ghabi, A.; Darny, T.; Dozias, S.; Bocanegra, P.E.; Pouvesle, J.M.; Sarh, B.; Robert, E.; Boushaki, T. Effects of pulsed gliding arc plasma on non-premixed CH4/CO2-air flame stability. Therm. Sci. Eng. Prog. 2023, 40, 11. [Google Scholar] [CrossRef]
  16. Guan, W.L.; Fu, C.; Chen, J.L.; Liao, Y.H. Effects of electric field waveforms on a lifted non-premixed jet flame. Exp. Therm. Fluid Sci. 2024, 159, 15. [Google Scholar] [CrossRef]
  17. Saridede, E.; Kritikos, E.M.; Giusti, A. Investigation of the effect of electrostatic fields and iron nanoparticles on hydrogen-oxygen combustion. Proc. Combust. Inst. 2024, 40, 105769. [Google Scholar] [CrossRef]
  18. Shahsavari, M.; Konnov, A.A.; Bai, X.S.; Valera-Medina, A.; Li, T.; Jangi, M. Synergistic effects of nanosecond plasma discharge and hydrogen on ammonia combustion. Fuel 2023, 348, 128475. [Google Scholar] [CrossRef]
  19. Law, C.K. Combustion Physics; Springer: Berlin/Heidelberg, Germany, 2010. [Google Scholar]
  20. Burke, M.P.; Chaos, M.; Ju, Y.G.; Dryer, F.L.; Klippenstein, S.J. Comprehensive H2/O2 kinetic model for high-pressure combustion. Int. J. Chem. Kinet. 2012, 44, 444–474. [Google Scholar] [CrossRef]
  21. Li, J.; Zhao, Z.W.; Kazakov, A.; Dryer, F.L. An updated comprehensive kinetic model of hydrogen combustion. Int. J. Chem. Kinet. 2004, 36, 566–575. [Google Scholar] [CrossRef]
  22. Mueller, M.A.; Kim, T.J.; Yetter, R.A.; Dryer, F.L. Flow reactor studies and kinetic modeling of the H2/O2 reaction. Int. J. Chem. Kinet. 1999, 31, 113–125. [Google Scholar] [CrossRef]
  23. Davis, S.G.; Joshi, A.V.; Wang, H.; Egolfopoulos, F. An optimized kinetic model of H2/CO combustion. Proc. Combust. Inst. 2005, 30, 1283–1292. [Google Scholar] [CrossRef]
  24. Sun, H.Y.; Yang, S.I.; Jomaas, G.; Law, C.K. High-pressure laminar flame speeds and kinetic modeling of carbon monoxide/hydrogen combustion. Proc. Combust. Inst. 2007, 31, 439–446. [Google Scholar] [CrossRef]
  25. Knewstubb, P.F.; Sugden, T.M. Mass-spectrometric studies of ionization in flames. 1. the spectrometer and its application to ionization in hydrogen flames. Proc. R. Soc. Lond. A 1960, 255, 520–537. [Google Scholar]
  26. Green, J.A.; Sugden, T.M. Some observations on the mechanism of ionization in flames containing hydrocarbons. Proc. Combust. Inst. 1963, 9, 607–621. [Google Scholar] [CrossRef]
  27. Lawton, J.; Weinberg, F.J. Electrical Aspects of Combustion; Clarendon Press: Oxford, UK, 1969. [Google Scholar]
  28. Hayhurst, A.N.; Telford, N.R. Kinetics of dissociative recombination of free-electrons with hydronium ions in premixed flame. J. Chem. Soc. Faraday 1974, 70, 1999–2010. [Google Scholar] [CrossRef]
  29. Hayhurst, A.N.; Telford, N.R. Proton affinity of water and mechanism and kinetics of production of H3O+ in flames of H2, O2 and N2. J. Chem. Soc. Faraday 1975, 71, 1352–1362. [Google Scholar] [CrossRef]
  30. Goodings, J.M.; Hayhurst, A.N. Kinetics of electron-attachment to oxygen and water in flames. Nature 1979, 281, 204–206. [Google Scholar] [CrossRef]
  31. Axford, S.D.T.; Hayhurst, A.N. Ionization in premixed fuel-lean flames of H2, O2 and N2. 1. naturally-occurring positive-ions. J. Chem. Soc. Faraday 1995, 91, 827–833. [Google Scholar] [CrossRef]
  32. Axford, S.D.T.; Hayhurst, A.N. Ionization in premixed fuel-lean flames of H2, O2 and N2. 2. naturally-occurring positive-ions. J. Chem. Soc. Faraday 1995, 91, 835–841. [Google Scholar] [CrossRef]
  33. Butler, C.J.; Hayhurst, A.N. Kinetics of dissociative recombination of H3O+ ions with free electrons in premixed flames. J. Chem. Soc. Faraday 1996, 92, 707–714. [Google Scholar] [CrossRef]
  34. Goodings, J.M.; Guo, J.Z.; Hayhurst, A.N.; Taylor, S.G. Current-voltage characteristics in a flame plasma: Analysis for positive and negative ions, with applications. Int. J. Mass Spectrom. Ion. Proc. 2001, 206, 137–151. [Google Scholar] [CrossRef]
  35. Calcote, H.F. Ions in Flames. In Ion-Molecule Reactions; Springer: Berlin/Heidelberg, Germany, 1972; pp. 673–706. [Google Scholar]
  36. Zhang, M.; Wang, J.H.; Chang, M.; Huang, Z.H. Turbulent flame topology and the wrinkled structure characteristics of high pressure syngas flames up to 1.0 MPa. Int. J. Hydrogen Energy 2019, 44, 15973–15984. [Google Scholar] [CrossRef]
  37. Hayhurst, A.N.; Telford, N.R. Charge exchange reactions of H3O+ with metals in flame. Trans. Faraday Soc. 1970, 66, 2784–2793. [Google Scholar] [CrossRef]
  38. Jones, H.R.N.; Hayhurst, A.N. Measurements of the concentrations of positive and negative ions along premixed fuel-rich flames of methane and oxygen. Combust. Flame 2016, 166, 86–97. [Google Scholar] [CrossRef]
  39. Sugden, T.M. Excited species in flames. Annu. Rev. Phys. Chem. 1962, 13, 369–390. [Google Scholar] [CrossRef]
  40. Calcote, H.F. Mechanisms for the formation of ions in flames. Combust. Flame 1957, 1, 385–403. [Google Scholar] [CrossRef]
  41. Casey, T.A. Electric Field Effects in Combustion with Non-Thermal Plasma. Doctoral Dissertation, University of California, Berkeley, CA, USA, 2016. [Google Scholar]
  42. Bascombe, K.N.; Green, J.A.; Sugden, T.M. The Ionization Produced by Addition of Acetylene to a Hydrogen-Oxygen-Nitrogen Flame. In Advances in Mass Spectrometry; Elsevier: Amsterdam, The Netherlands, 1963; pp. 66–86. [Google Scholar]
  43. Knyazkov, D.A.; Gerasimov, I.E.; Shmakov, A.G.; Bolshova, T.A.; Paletsky, A.A. Positively charged species in premixed flames fuelled by H2/CO mixture: Experimental and numerical study. In Proceedings of the COMPHYSCHEM’20-21, Adelaide, Australia, 27–31 July 2020. [Google Scholar]
  44. Fialkov, A.B. Investigations on ions in flames. Prog. Energy Combust. Sci. 1997, 23, 399–528. [Google Scholar] [CrossRef]
  45. Prager, J.; Riedel, U.; Warnatz, J. Modeling ion chemistry and charged species diffusion in lean methane-oxygen flames. Proc. Combust. Inst. 2007, 31, 1129–1137. [Google Scholar] [CrossRef]
  46. Rodrigues, J.M.; Agneray, A.; Jaffrézic, X.; Bellenoue, M.; Labuda, S.; Leys, C.; Chernukho, A.P.; Migoun, A.N.; Cenian, A.; Savel’ev, A.M.; et al. Evolution of charged species in propane/air flames: Mass-spectrometric analysis and modelling. Plasma Sources Sci. Technol. 2007, 16, 161–172. [Google Scholar] [CrossRef]
  47. Knyazkov, D.A.; Cherepanov, A.V.; Kiselev, V.G.; Gerasimov, I.E.; Kasper, T.; Shmakov, A.G. Experimental and kinetic modeling study of the positive ions in premixed ethylene flames over a range of equivalence ratios. Proc. Combust. Inst. 2023, 39, 1753–1761. [Google Scholar] [CrossRef]
  48. Hayhurst, A.; Kittelson, D. The positive and negative ions in oxy-acetylene flames. Combust. Flame 1978, 31, 37–51. [Google Scholar] [CrossRef]
  49. Goodings, J.M.; Bohme, D.K.; Ng, C.W. Detailed ion chemistry in methane-oxygen flames. 1. positive-ions. Combust. Flame 1979, 36, 27–43. [Google Scholar] [CrossRef]
  50. Goodings, J.M.; Bohme, D.K.; Ng, C.W. Detailed ion chemistry in methane-oxygen flames. 2. negative-ions. Combust. Flame 1979, 36, 45–62. [Google Scholar] [CrossRef]
  51. Axford, S.D.T.; Hayhurst, A.N. Mass spectrometric sampling of negative ions from flames of hydrogen and oxygen: The kinetics of electron attachment and detachment in hot mixtures of H2O, O2, OH and HO2. Proc. R. Soc. A-Math. Phys. Eng. Sci. 1996, 452, 1007–1033. [Google Scholar]
  52. Axford, S.D.T.; Hayhurst, A.N. The stabilities of the gas-phase ions CO3 and HCO3, together with the kinetics of both their production and removal in O2-rich flames of H2 + O2 + N2. Proc. R. Soc. A-Math. Phys. Eng. Sci. 1996, 452, 1035–1054. [Google Scholar]
  53. Calcote, H.F. Ion and electron profiles in flames. Symp. Int. Combust. 1963, 9, 622–637. [Google Scholar] [CrossRef]
  54. Belhi, M.; Domingo, P.; Vervisch, P. Direct numerical simulation of the effect of an electric field on flame stability. Combust. Flame 2010, 157, 2286–2297. [Google Scholar] [CrossRef]
  55. Liu, H.C.; Cai, W.W. Recent progress in electric-field assisted combustion: A brief review. Front. Energy 2022, 16, 883–899. [Google Scholar] [CrossRef]
  56. Park, D.G.; Chung, S.H.; Cha, M.S. Bidirectional ionic wind in nonpremixed counterflow flames with DC electric fields. Combust. Flame 2016, 168, 138–146. [Google Scholar] [CrossRef]
  57. Xia, H.; Wang, J.H.; Ju, R.Y.; Li, Y.M.; Mu, H.B.; Huang, Z.H. Effect of Ionic Wind Induced by DC Electric Field on Biogas/Air Turbulent Premixed Flame Structure. Combust. Sci. Technol. 2023, 195, 294–312. [Google Scholar] [CrossRef]
  58. Yamashita, K.; Karnani, S.; Dunn-Rankin, D. Numerical prediction of ion current from a small methane jet flame. Combust. Flame 2009, 156, 1227–1233. [Google Scholar] [CrossRef]
  59. Di Renzo, M.; Urzay, J.; De Palma, P.; de Tullio, M.D.; Pascazio, G. The effects of incident electric fields on counterflow diffusion flames. Combust. Flame 2018, 193, 177–191. [Google Scholar] [CrossRef]
  60. Seo, B.H.; Kim, K.T.; Sapkal, N.P.; Chung, S.H. Effect of AC Electric Field on Decreasing Liftoff Height in Laminar Lifted Jet Flames. J. Korean Soc. Combust. 2017, 22, 17–22. [Google Scholar]
  61. Xiong, Y.; Park, D.G.; Lee, B.J.; Chung, S.H.; Cha, M.S. DC field response of one-dimensional flames using an ionized layer model. Combust. Flame 2016, 163, 317–325. [Google Scholar] [CrossRef]
  62. Pedersen, T.; Brown, R. Simulation of electric field effects in premixed methane flames. Combust. Flame 1993, 94, 433–448. [Google Scholar] [CrossRef]
  63. Dunn-Rankin, D.; Weinberg, F.J. Using large electric fields to control transport in microgravity. In Interdisciplinary Transport Phenomena in the Space Sciences; Sadhal, S.S., Ed.; Annals of the New York Academy of Sciences; Wiley-Blackwell: Malden, MA, USA, 2006; Volume 1077, pp. 570–584. [Google Scholar]
  64. Chien, Y.C.; Stocker, D.P.; Hegde, U.G.; Dunn-Rankin, D. Electric-field effects on methane coflow flames aboard the international space station (ISS): ACME E-FIELD flames. Combust. Flame 2022, 246, 11. [Google Scholar] [CrossRef]
  65. Xiong, Y.; Lacoste, D.A.; Chung, S.H.; Cha, M.S. Effects of DC Electric Fields on Flickering and Acoustic Oscillations of an M-shape Premixed Flame. Flow Turbul. Combust. 2022, 109, 459–475. [Google Scholar] [CrossRef]
  66. Kuhl, J.; Seeger, T.; Zigan, L.; Will, S.; Leipertz, A. On the effect of ionic wind on structure and temperature of laminar premixed flames influenced by electric fields. Combust. Flame 2017, 176, 391–399. [Google Scholar] [CrossRef]
  67. Cha, M.S.; Lee, S.M.; Kim, K.T.; Chung, S.H. Soot suppression by nonthermal plasma in coflow jet diffusion flames using a dielectric barrier discharge. Combust. Flame 2005, 141, 438–447. [Google Scholar] [CrossRef]
  68. Weng, W.G.; Kamikawa, D.; Fukuda, Y.; Hasemi, Y.; Kagiya, K. Study on flame height of merged flame from multiple fire sources. Combust. Sci. Technol. 2004, 176, 2105–2123. [Google Scholar] [CrossRef]
  69. Hamins, A.; Konishi, K.; Borthwick, P.; Kashiwagi, T. Global properties of gaseous pool fires. Proc. Combust. Inst. 1996, 26, 1429–1436. [Google Scholar] [CrossRef]
  70. Mikofski, M.A.; Williams, T.C.; Shaddix, C.R.; Blevins, L.G. Flame height measurement of laminar inverse diffusion flames. Combust. Flame 2006, 146, 63–72. [Google Scholar] [CrossRef]
  71. Luo, Y.L.; Jiang, Z.W.; Gan, Y.H.; Liang, J.L.; Ao, W. Evaporation and combustion characteristics of an ethanol fuel droplet in a DC electric field. J. Energy Inst. 2021, 98, 216–222. [Google Scholar] [CrossRef]
  72. He, L.; Guo, Q.H.; Gong, Y.; Wang, F.C.; Yu, G.S. Investigation of OH* chemiluminescence and heat release in laminar methane-oxygen co-flow diffusion flames. Combust. Flame 2019, 201, 12–22. [Google Scholar] [CrossRef]
  73. Li, Z.S.; Li, B.; Sun, Z.W.; Bai, X.S.; Aldén, M. Turbulence and combustion interaction: High resolution local flame front structure visualization using simultaneous single-shot PLIF imaging of CH, OH, and CH2O in a piloted premixed jet flame. Combust. Flame 2010, 157, 1087–1096. [Google Scholar] [CrossRef]
  74. Liu, Y.; Tan, J.G.; Wan, M.G.; Zhang, L.; Yao, X. Quantitative Measurement of OH* and CH* Chemiluminescence in Jet Diffusion Flames. ACS Omega 2020, 5, 15922–15930. [Google Scholar] [CrossRef]
  75. Walsh, K.T.; Long, M.; Tanoff, M.A.; Smooke, M.D. Experimental and computational study of CH, CH*, and OH* in an axisymmetric laminar diffusion flame. Proc. Combust. Inst. 1998, 27, 615–623. [Google Scholar] [CrossRef]
  76. López-Cámara, C.F.; Saggese, C.; Pitz, W.J.; Shao, X.; Imc, H.G.; Dunn-Rankin, D. Reduced chemical kinetic model for CH4-air non-premixed flames including excited and charged species. Combust. Flame 2023, 253, 14. [Google Scholar] [CrossRef]
  77. Higgins, B.; McQuay, M.Q.; Lacas, F.; Rolon, J.C.; Darabiha, N.; Candel, S. Systematic measurements of OH chemiluminescence for fuel-lean, high-pressure, premixed, laminar flames. Fuel 2001, 80, 67–74. [Google Scholar] [CrossRef]
  78. Xie, F.; Zhou, Y.; Song, X.D.; Bai, Y.H.; Wu, R.M.; Yao, M.; Yu, G.S. Investigation of OH* chemiluminescence with lift-off characteristic in methane-oxygen inverse diffusion flame. Int. J. Hydrogen Energy 2021, 46, 1461–1472. [Google Scholar] [CrossRef]
  79. Zheng, Y.T.; Weller, L.; Hochgreb, S. Instantaneous flame front identification by Mie scattering vs. OH PLIF in low turbulence Bunsen flame. Exp. Fluids 2022, 63, 16. [Google Scholar] [CrossRef]
  80. Xiong, Y.; Cha, M.S.; Chung, S.H. AC electric field induced vortex in laminar coflow diffusion flames. Proc. Combust Inst. 2015, 35, 3513–3520. [Google Scholar] [CrossRef]
  81. Zhao, M.M.; Buttsworth, D.; Choudhury, R. Experimental and numerical study of OH* chemiluminescence in hydrogen diffusion flames. Combust. Flame 2018, 197, 369–377. [Google Scholar] [CrossRef]
  82. Kwak, S.; Choi, J.; Ahn, M.; Yoon, Y. Effects of hydrogen addition on the forced response of H2/CH4 flames in a dual-nozzle swirl-stabilized combustor. Int. J. Hydrogen Energy 2022, 47, 28139–28151. [Google Scholar] [CrossRef]
  83. Altendorfner, F.; Kuhl, J.; Zigan, L.; Leipertz, A. Study of the influence of electric fields on flames using planar LIF and PIV techniques. Proc. Combust. Inst. 2011, 33, 3195–3201. [Google Scholar] [CrossRef]
  84. Cessou, A.; Varea, E.; Criner, K.; Godard, G.; Vervisch, P. Simultaneous measurements of OH, mixture fraction and velocity fields to investigate flame stabilization enhancement by electric field. Exp. Fluids 2012, 52, 905–917. [Google Scholar] [CrossRef]
  85. Kojima, J.; Ikeda, Y.; Nakajima, T. Basic aspects of OH(A), CH(A), and C2(d) chemiluminescence in the reaction zone of laminar methane-air premixed flames. Combust. Flame 2005, 140, 34–45. [Google Scholar] [CrossRef]
  86. Ayoolan, B.O.; Balachandran, R.; Frank, J.H.; Mastorakos, E.; Kaminski, C.F. Spatially resolved heat release rate measurements in turbulent premixed flames. Combust. Flame 2006, 144, 1–16. [Google Scholar] [CrossRef]
  87. Paul, P.H.; Najm, H.N. Planar laser-induced fluorescence imaging of flame heat release rate. Proc. Combust. Inst. 1998, 27, 43–50. [Google Scholar] [CrossRef]
  88. Santoro, R.J.; Semerjian, H.G.; Dobbins, R.A. Soot particle measurements in diffusion flames. Combust. Flame 1983, 51, 203–218. [Google Scholar] [CrossRef]
  89. Park, J.; Son, J.; Butterworth, T.D.; Cha, M.S. Electric fields in a counterflow nonpremixed flame: Measurement and simulation. Sci. Rep. 2023, 13, 14. [Google Scholar] [CrossRef] [PubMed]
  90. Abboud, J.; Schobing, J.; Legros, G.; Matynia, A.; Bonnety, J.; Tschamber, V.; Brillard, A.; Leyssens, G.; Da Costa, P. Impacts of ester’s carbon chain length and concentration on sooting propensities and soot oxidative reactivity: Application to Diesel and Biodiesel surrogates. Fuel 2018, 222, 586–598. [Google Scholar] [CrossRef]
  91. Lacoste, D.A.; Xiong, Y.; Moeck, J.P.; Chung, S.H.; Roberts, W.L.; Cha, M.S. Transfer functions of laminar premixed flames subjected to forcing by acoustic waves, AC electric fields, and non-thermal plasma discharges. Proc. Combust. Inst. 2017, 36, 4183–4192. [Google Scholar] [CrossRef]
  92. Simeni, M.S.; Tang, Y.; Hung, Y.C.; Eckert, Z.; Frederickson, K.; Adamovich, I.V. Electric field in Ns pulse and AC electric discharges in a hydrogen diffusion flame. Combust. Flame 2018, 197, 254–264. [Google Scholar] [CrossRef]
  93. ANSYS. ANSYS FLUENT; ANSYS, Inc.: Canonsburg, PA, USA, 2011. [Google Scholar]
  94. Sayed-Kassem, A.; Elorf, A.; Gillon, P.; Idir, M.; Sarh, B.; Gilard, V. Numerical modelling to study the effect of DC electric field on a laminar ethylene diffusion flame. Int. Commun. Heat Mass Transf. 2021, 122, 13. [Google Scholar] [CrossRef]
  95. Luo, Y.L.; Gan, Y.H.; Xu, J.L.; Yan, Y.Y.; Shi, Y.L. Effects of electric field intensity and frequency of AC electric field on the small-scale ethanol diffusion flame behaviors. Appl. Therm. Eng. 2017, 115, 1330–1336. [Google Scholar] [CrossRef]
  96. Zhao, S.; Liu, B.Y.; Zhao, B.; Li, T.W.; Shu, Q. Numerical Simulation of Ethanol Air Diffusion Flame Quenching under Transverse AC Electric Field. Fire 2022, 5, 196. [Google Scholar] [CrossRef]
  97. Sakhrieh, A.; Lins, G.; Dinkelacker, F.; Hammer, T.; Leipertz, A.; Branston, D.W. The influence of pressure on the control of premixed turbulent flames using an electric field. Combust. Flame 2005, 143, 313–322. [Google Scholar] [CrossRef]
  98. Chemical-Kinetic Mechanisms for Combustion Applications, San Diego Mechanism Web Page, Mechanical and Aerospace Engineering (Combustion Research), University of California at San Diego. Available online: http://combustion.ucsd.edu (accessed on 1 June 2024).
  99. Schefer, R.W.; Kulatilaka, W.D.; Patterson, B.D.; Settersten, T.B. Visible emission of hydrogen flames. Combust. Flame 2009, 156, 1234–1241. [Google Scholar] [CrossRef]
  100. Vinogradov, J.; Sher, E.; Rutkevich, I.; Mond, M. Voltage-current characteristics of a flame-assisted unipolar corona. Combust. Flame 2001, 127, 2041–2050. [Google Scholar] [CrossRef]
Figure 1. Schematic of the experimental setup for investigating the effect of externally applied electric fields on the OH* chemiluminescence in an H2–air diffusion flame. The insert is a schematic of the burner design.
Hydrogen 06 00038 g001
Figure 2. OH* intensity images before (left) and after (right) filtering. The OH* signal intensity was then integrated along (a) the radial direction and (b) the axial direction of the flame. The horizontal lines represent the threshold levels used for measuring the flame dimensions.
Hydrogen 06 00038 g002
Figure 3. Modeled H3O+ number density in the post-flame region (red markers) and reaction zone (black markers) of a H2–air flame with added ethylene impurities. The insert is a zoom over the 0–10 ppm impurity range.
Hydrogen 06 00038 g003
Figure 4. Normalized OH* signal intensities at various voltages applied to the ring electrode placed at (a) 0.00 mm, (b) 5.00 mm, (c) 10.00 mm, and (d) 20.00 mm above the burner nozzle, without added ethylene impurities.
Hydrogen 06 00038 g004
Figure 5. Visible flame images at (a) 0.00 mm, (b) 5.00 mm, (c) 10.00 mm, and (d) 20.00 mm electrode height above the burner, without added ethylene impurities.
Hydrogen 06 00038 g005
Figure 6. OH* flame height profiles as a function of applied voltage for various electrode heights above the burner (0.00, 5.00, 7.50, 10.00, 15.00, and 20.00 mm), without added ethylene impurities. The error bars represent the minimum and maximum measured OH* heights.
Hydrogen 06 00038 g006
Figure 7. OH* flame height profiles as a function of applied voltage in (a) a Santoro burner (97.18 mm ID air inlet) and (b) a reduced air inlet burner (ID of 42.00 mm), without added ethylene impurities. The electrode height above the burner was fixed at 0.00 mm. The H2 flow rate was set to 500 sccm for both burners.
Hydrogen 06 00038 g007
Figure 8. OH* flame height profiles as a function of applied voltage for (a) 0–1000 ppm and (b) 1500–4000 ppm of added ethylene. The electrode height above the burner was fixed at 0.00 mm.
Hydrogen 06 00038 g008
Table 1. Maximum OH* flame height and width decrease (maximum voltage) and characteristic voltages for several electrode heights above the burner.
Electrode Distance (mm)Maximum % DecreaseInitial Threshold (kV)Inflection Point (kV)
OH* HeightOH* Width
0.0062 (−8.00 kV)17 (−8.00 kV)−5.25−6.75
5.0067 (−9.50 kV)-−4.75-
7.5065 (−10.00 kV)-−5.00-
10.0042 (−10.00 kV)39 (−10.00 kV)--
15.0035 (−10.00 kV)30 (−10.00 kV)--
20.0033 (−10.00 kV)26 (−10.00 kV)−7.75−8.25
* The values inside the brackets represent the applied voltages.
Table 2. Maximum OH* flame height decrease and characteristic voltages for several airflow rates/velocities.
AirflowInitial Threshold (kV)Inflection Point (kV)Maximum % Decrease in
OH* Height
Rate (slm)Velocity (cm s−1)
102.44−5.25−6.7563(−8.00)
256.10−5.25−6.7562(−8.00)
7919.34−5.50−7.2560(−8.50)
8520.72−5.50−7.5061(−9.00)
10 *13.37−5.00−6.5062(−8.00)
40 *53.01−5.50−8.0060(−9.25)
56 *75.72−5.75−8.7552(−10.00)
90 *121.16−6.2521(−10.00)
* Reduced air inlet size burner (ID of 42.00 mm).
Disclaimer/Publisher’s Note: The statements, opinions and data contained in all publications are solely those of the individual author(s) and contributor(s) and not of MDPI and/or the editor(s). MDPI and/or the editor(s) disclaim responsibility for any injury to people or property resulting from any ideas, methods, instructions or products referred to in the content.

