Abstract
The hydrogen (H2) economy is seen as a crucial pathway for decarbonizing the energy system, with green H2—i.e., obtained from water electrolysis supplied by renewable energy—playing a key role as an energy carrier in this transition. The growing interest in H2 comes from its versatility, which means that H2 can serve as a raw material or energy source, and various technologies allow it to be produced from a wide range of resources. Environmental impacts of H2 production have primarily focused on greenhouse gas (GHG) emissions, despite other environmental aspects being equally relevant in the context of a sustainable energy transition. In this context, Life Cycle Assessment (LCA) studies of H2 supply chains have become more common. This paper aims to compile and analyze discrepancies and convergences among recent reported values from 42 scientific studies related to different H2 production pathways. Technologies related to H2 transportation, storage and use were not investigated in this study. Three environmental indicators were considered: Global Warming Potential (GWP), Energy Performance (EP), and Water Consumption (WF), from an LCA perspective. The review showed that H2 based on wind, photovoltaic and biomass energy sources are a promising option since it provides lower GWP, and higher EP compared to conventional fossil H2 pathways. However, WF can be higher for H2 derived from biomass. LCA boundaries and methodological choices have a great influence on the environmental indicators assessed in this paper which leads to great variability in WF results as well as GWP variation due credits given to avoid GHG emissions in upstream process. In the case of EI, the inclusion of energy embodied in renewable energy systems demonstrates great influence of upstream phase for electrolytic H2 based on wind and photovoltaic electricity.
1. Introduction
The rapid growth of cities and populations led to a 38% increase in energy demands between 2000 and 2013 [1], raising concerns about our ongoing reliance on fossil fuels and the alarming rise in the Earth’s temperature; it is necessary to maintain the global temperature within 1.5 °C of pre-industrial temperatures [2,3]. Local governments worldwide have pointed out energy security as a critical issue in ensuring a clean and reliable energy supply. In this context, a sustainable energy transition—driven by the increased use of renewable materials and the development of more efficient, sustainable processes—is therefore essential [4,5].
As concerns about climate change and energy security continue to grow [6], the development of renewable energy systems has become a key strategy [7]. The harmful effects of fossil fuel combustion on both the environment and human health highlight the urgent need to transition to a renewable energy system that reduces our dependence on fossil fuels. To meet greenhouse gas (GHG) emissions reduction targets, it is estimated that by 2050, renewable energy must account for at least 12% of total energy consumption—six times the current global demand [8]. In addition, many regions are experiencing water scarcity due to climate issues [9]. Given that the energy sector relies heavily on the availability of water resources, assessing water availability and scarcity for energy sources is crucial [10].
Greenhouse gas emissions from human activities have been the primary driver of climate change since the mid-20th century. These emissions, primarily from the use of fossil fuels in electricity generation, industry, and heating, are the main contributors to changes in climate dynamics, as over 80% of global energy needs are met by fossil fuels, including oil, coal, and natural gas [11]. In 2020, GHG emissions from energy systems accounted for 73.3% of total global emissions [12]. It is clear, therefore, that the energy sector is the largest contributor to the increase in GHGs in the atmosphere [13]. Therefore, reducing them is a global priority [14]. In this sense, developing renewable energy systems is essential for shifting away from a fossil fuel-dependent economy and toward cleaner energy sources with lower environmental impacts [15].
According to the International Renewable Energy Agency (IRENA), renewable energy generation will play a crucial role in achieving GHG reductions by 2050, contributing to 41% of the total reduction, while energy efficiency initiatives will account for 40% of decarbonization efforts [16]. With global energy needs projected to grow by 48% over the next 20 years due to population growth [17], the focus on alternative, clean, and renewable energy sources is intensifying [1].
In this context, H2 could play a key role in transforming the current energy system [1]. Low-emission H2 is expected to significantly contribute to decarbonizing energy systems, especially in hard-to-abate sectors, e.g., in cement production [18]. The H2 energy system has the potential to reshape the energy landscape by driving market growth through competitive pricing, improved quality, enhanced energy security, and advancements in renewable energy technologies [19,20]. H2 has been identified as a powerful catalyst for advancing toward a carbon-neutral society, thanks to its diverse applications and the fact that its combustion produces only water as a by-product [21,22].
According to Hren et al. [23], H2 usage can be categorized into three main areas: first, it is used as a reagent in hydrogenation processes, accounting for nearly 65% of H2 consumption in the production of chemicals like ammonia, methanol, hydrochloric acid, hydrogen peroxide, and others; second, H2 is applied to oil refining, petrochemical production, fertilizer hydrogenation, and metallurgical processes, making up 25% of use cases; and finally, the remaining 10% of the global H2 supply is used as an oxygen removal agent, in internal combustion engines, and as a cooling refrigerant in electricity generation and weather balloons. As for current H2 applications, only a small proportion is used for energy purposes—over 90% of H2 is used for traditional industrial purposes [24,25].
Currently, most H2 is produced from fossil fuels, e.g., natural gas and coal, through steam reforming and gasification processes, which account for 60% and 20% of global H2 production, respectively [26]. By contrast, low-emission H2 makes up less than 1% of global production [26]. This underscores the need to develop and scale up clean H2 production systems, alongside enhancing the infrastructure for storage, transportation, and final applications.
Depending on the resources and technologies used for H2 production, it can be categorized as grey, green, or blue energy [27,28,29]. Grey H2 is produced from fossil fuels (natural gas or coal) through steam methane reforming (SMR) and coal gasification (CG) [27]. SMR it’s a well-established, cost-effective method, but it comes with significant environmental concerns due to high GHG emissions [30,31]. Blue H2 is produced from fossil fuels with the addition of carbon capture and storage (CCS), while green H2 comes from renewable sources such as wind and solar energy [32].
H2 systems are particularly beneficial when integrated with renewable energy systems. H2 can be converted into electricity, making it a highly versatile energy carrier [33]. It serves as a clean fuel for vehicles, offering an environmentally friendly alternative to conventional fossil fuels and significantly reducing GHG emissions [23]. Furthermore, H2 plays a key role in stabilizing renewable energy systems by storing and releasing energy. This capability helps smooth out the variability of renewable energy sources, ensuring energy security, adaptability, and stability in these systems [11].
As the development of renewable H2 systems accelerates, assessing the potential environmental impacts of these systems has become crucial. Scientific studies have examined the environmental performance of H2 systems, focusing on indicators such as GHG emissions [30,34,35], water footprint (WF) [36,37,38], water scarcity footprint (WSF) [36,39], and energy efficiency [40]. However, hydrogen-based energy systems are often evaluated solely from a GHG emissions perspective, as the main motivation for promoting H2 is its potential to decarbonize the economy [41,42], thus neglecting the relationship between GWP, energy performance, and WF.
In this sense, this paper aims to contribute to the ongoing discussion on H2 sustainability by considering factors such as water usage and energy requirements alongside GHG emissions assessments. The interdependence analysis of such indicators, evaluating trade-offs, discrepancies, and convergences, is fundamental to guaranteeing the sustainability of the H2 economy.
The analysis was based on reported values from Life Cycle Assessment (LCA) studies. Assessing resource consumption from an LCA perspective provides a comprehensive understanding of the environmental impacts associated with the H2 production chain [43]. The next section presents an overview of typical production systems for H2 (conventional and promising ones).
2. General Overview of H2 Production Pathways
As concern about climate issues and energy security increases, H2 has been pointed out as a viable option for accelerating the transition toward sustainable energy. H2 stands out due to its high energy storage capacity, making it a viable solution for balancing energy supply and demand [44]. H2, when combined with renewable energy systems, offers an effective way of balancing energy production and demand by generating H2 during periods of excess electricity, which can then be stored for later use [11]. This approach ensures greater reliability and flexibility in electrical systems [45]. In addition, low-carbon H2 can help to achieve the decarbonization of the economy and reduce resource consumption, such as water and fuels [10,46].
At the industrial level, H2 can be produced using two main methods: thermochemical and electrolytic. Each method uses different energy sources [31]. While interest in producing H2 from renewable sources is growing, only a small fraction—just 1%—is currently produced using clean energy [25]. Various renewable methods for production exist but the most common focus is on converting electricity into the desired energy resource, a process known as Power-to-X, where X represents the specific energy type or application [47]. For example, the Power-to-Gas method involves converting electricity into gaseous fuels like H2 or synthetic fuels such as ammonia, methane, and aviation fuel. Additionally, Power-to-Power refers to converting the chemical energy in H2 back into electricity [8,22].
Figure 1 presents the main stages typically considered in life cycle assessments of hydrogen production pathways, which can be based on renewable (see green boxes) or non-renewable (see grey boxes) resources. The energy efficiency related to the hydrogen technology conversion were based on [48,49,50,51].
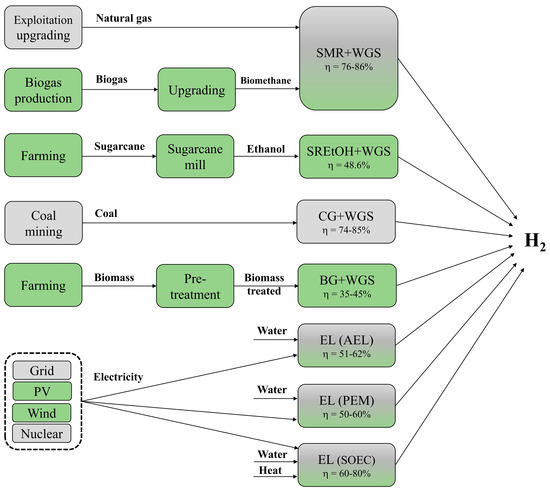
Figure 1.
Main stages typically assumed for life cycle assessments of hydrogen production pathways. Green and Grey boxes indicate processes mainly based on renewable resources or non-renewable resources, respectively; AEL: Alkaline Electrolysis; BG: Biomass Gasification; CG: Coal Gasification; EL: Water electrolysis; PEM: Proton Exchange Membrane; PV: photovoltaic system; SMR: Steam Methane Reforming; SOEC: Solid Oxide Electrolysis; SREtOH: Steam Reforming of Ethanol; WGS: Water-Gas-Shift process.
- Steam Reforming Process
As mentioned above, steam reforming of natural gas (SMR) is the most common and developed technique for producing H2. In SMR, natural gas, and other hydrocarbons are converted into synthesis gas through an endothermic process involving two main reactions: steam reforming and the water–gas shift reaction [23].
In the reformer unit, treated natural gas reacts with water to produce syngas, a gaseous mixture of H2, CO, and CO2. The CO in the syngas reacts with water in an exothermic water–gas shift (WGS) reaction, increasing the H2 concentration and improving the overall efficiency of SMR [23,52,53]. To enhance the purity of the H2 and remove other gases, the H2 is directed to a pressure swing adsorption (PSA) unit, which separates it from CO2, achieving H2 purity levels of up to 99.95% [5,23,54]. Syngas, the precursor to H2, can also be generated from renewable resources such as ethanol (EtOH), sugars [22], and biomethane. Typical natural gas reforming is shown as follows:
CH4 + H2O → CO + 3H2
CO + H2O → CO2 + H2
In this context, steam reforming can use ethanol (SREtOH) as both a raw material and an energy source for H2 generation [55]. EtOH reacts with steam to produce syngas, and any remaining CO in the syngas is converted into CO2 and more H2 through the WGS reaction [46,50]. The equation below is the general reaction to EtOH reforming:
C2H5OH + 3H2O → 2CO2 + 6H2
CO + H2O → CO2 + H2
Several advantages exist for using EtOH as a feedstock for H2 synthesis. These include (i) diverse biomass sources: EtOH can be produced from a variety of biomass sources [56]; (ii) a high H2 content: EtOH has a high hydrogen-to-carbon ratio (3) [57]; (iii) an extensive distribution network: an extensive distribution network for EtOH already exists; and (iv) convenient storage and low toxicity: EtOH is easily stored and has low toxicity [50]. Furthermore, converting EtOH to H2 eliminates the need for the purification and dehydration steps required for certain ethanol applications, such as blending with gasoline. These processes can consume up to three-quarters of the energy used in EtOH production [50].
In addition to climate concerns, increases in solid waste generation constitute a significant challenge. Poor waste management practices negatively impact public health and contribute to soil and water pollution [3]. Using waste for energy provides a solution to both waste management issues and GHG emissions, which account for about 5% of global emissions [58].
Converting waste into biogas, which is made up of methane (50–80%) and carbon dioxide (20–50%) with other trace gases [59], is one method for producing H2 through steam reforming. Biogas can be derived from various waste sources, including organic waste, agricultural waste, landfill sites, and sewage treatment waste, as a byproduct of anaerobic digestion. Biogas serves as a viable alternative to fossil natural gas and results from the anaerobic breakdown of organic matter under specific conditions of temperature, acidity, and humidity. The process of generating H2 from biogas is similar to that from natural gas, though it requires additional purification and treatment steps for biogas purification [60,61]. The equation below is a demonstration of the biomethane reforming process (SRBiogas):
CH4 + H2O → CO + 3H2
- Coal Gasification Process
Coal gasification (CG) is a widely used technology for producing inexpensive and efficient H2. In this process, coal reacts with oxygen in low concentrations, combined with steam, under high temperatures and pressure to produce syngas [46]. The gasification method has gained interest because it can employ both renewable and non-renewable materials [62]. The CO present in syngas can be converted to improve process efficiency through the WGS reaction, which increases the H2 production rate [63]. Efficiency ranges between 74 and 85% [59]. Typical CG processes are shown below:
C + H2O → CO + H2
CO + H2O → CO2 + H2
Gasification can apply any carbon-based material such as coal, car tires, sewage sludge, sawdust, wood, and plastic waste [64]. Gasification may produce other substances alongside H2 (CO, CH4, H2S, NH3, HCl, HCN, ash, and tar), with purification steps becoming necessary to enhance the purity of the gas.
Biomass can be employed for H2 generation through the gasification process. Biomass is broken down at high temperatures in a low-oxygen atmosphere [48]. A typical reaction for biomass gasification (BG) is the following:
Tar can be produced concurrently with the production of H2 [48].
- Electrolysis Process
In addition to the thermochemical methods mentioned above, electrochemical methods that use water and electricity to produce H2 are also noteworthy. These methods can reduce GHG emissions by nearly 90% compared to traditional fossil fuel-based methods [58]. Electrolysis (EL), an electrochemical method, involves converting electricity into H2 by splitting water into H2 and O2 molecules when an electrical current is passed through water [18,65]. An ion-separating membrane is placed in the water to facilitate the separation of H2 gas produced at the cathode from O2 produced at the anode [66]. Efficiency ranges between 60 and 80% [67]. The equations below present the reactions that occur in the electrolysis process:
Currently, three main commercial methods for producing H2 through electrochemistry are in use: alkaline electrolysis (AEL), which leads the H2 market and has been in development for several years [68]; solid oxide electrolysis (SOEC), which operates at high temperatures to break down water molecules without requiring significant electricity [22]; and proton exchange membrane (PEM) electrolysis, which offers greater operational flexibility and the ability to handle variable loads, making it ideal for systems that rely on intermittent energy sources [18]. Table 1 presents the main differences between electrolysis technologies.

Table 1.
Comparison of key water electrolysis technologies.
A key consideration in EL systems is the potential market for the O2 produced alongside H2, which can yield approximately 8.0 kg of O2 for every kg of H2. This O2 has applications across various sectors, including steel, pulp and paper, chemical, healthcare, and ozonation-based water treatments. However, with the expected increase in EL systems, the market for generated O2 may become insufficient [69].
The growing capacity of renewable energy sources like wind and solar is driven by lower costs and increasing demand, leading to reduced costs in the renewable sector [2]. EL systems powered by photovoltaic (PV) and wind energy offer several advantages, e.g., high purity (which eliminates the need for extra cleaning steps) and can also reduce the costs of generating electricity or H2 by using excess energy produced by these sources, which can be stored as H2 for later use [70].
3. Life Cycle Assessment Review
This section presents the results of the literature review, comparing the findings from authors with existing articles, reports, and documents. The review includes peer-reviewed academic articles related to the LCA of H2 production collected from database search engines such as Scopus, Web of Science and ResearchGate websites with key search terms including “hydrogen life cycle assessment”, “hydrogen water footprint”, “energy balance of hydrogen”, “steam reforming of hydrogen”, “carbon intensity of hydrogen pathways”, and “hydrogen and energy transition”. It was conducted an exploration taken 2012 as cutoff year for the selected papers, however, most of the paper was published between 2018 and 2024 (76%). It was selected 42 studies. The exclusion criteria for paper were based on whether the study was relevant to the search requirements, and whether it included an estimation of the selected environmental indicators. Papers that analyzed environmental impacts associated with storage, transportation and use of H2 were not considered in this analysis. Additionally, database searching has returned some studies that explore social and economic aspects of H2 production by using LCA approach, however, those studies were not analyzed.
The pressing issue of product and process sustainability has sparked the creation of a multitude of methodologies aimed at assessing the environmental impact of products prominently featuring LCA, which identifies and scrutinizes potential environmental aspects and impacts across the full life span of a product or service [71]. The LCA serves as a powerful tool to shape and oversee public policies, proving invaluable in the industrial sector by enhancing decision-making, fostering the development and selection of indicators for environmental performance monitoring, and guiding the discovery of alternatives or pathways that significantly mitigate negative impacts or resource depletion, and also facilitating comparisons of processes to pinpoint the option with the least environmental footprint [72]. A LCA study comprises four critical stages: the definition of its objective and scope, the inventory analysis, the impact assessment, and the interpretation phase [73].
LCA outcomes can help assess the impacts of producing and using a product or service; compare methods to aid in selecting the optimal approach; identify critical stages to reduce impacts throughout the production process; and guide planning and decision-making [74]. Some methodological choices influence LCA results. In this sense, this paper, wherever possible, identifies the key parameters, such as the system boundaries, functional units, and allocation methods from the selected papers and provides a broader discussion.
In LCA analysis, there are several methods to estimate the WF of a product, either based on water resources consumption (referred to as the Water Footprint Assessment, WFA) [75] or on the environmental impacts resulting from water consumption [76]. The first approach focuses on the volumetric water demand for producing goods and services; while the second, mostly based on the Available Water Remaining (AWARE) method, is an environmental impact indicator that estimates the Water Scarcity Footprint (WSF). WSF is defined as the amount of available water per area after human and ecosystem needs are met [77]. The WSF indicator proposed by Hoekstra [75] assess three different types of water: blue water (which refers to fresh surface or groundwater), green water (which accounts for precipitation that does not run off or the volume of water that is stored in the soil) and grey water (which is defined as the volume of freshwater that is required to assimilate the load of pollutants) [75]. AWARE is recommended by the Life Cycle Initiative of the UN Environment Programme (UNEP) for calculating water scarcity [78]. This method considers both human and ecosystem water deprivation, assuming that the less water remaining per area, the more users in that area will experience freshwater shortages [79].
In LCA studies, the energy demand of a product serves as a broad indicator for evaluating primary energy consumption throughout its entire life cycle [80]. Cumulative Energy Demand (CED) is a valuable metric for assessing the energy required in the extraction, manufacturing, operation, and final disposal of resources throughout its lifetime [81]. However, CED should be considered alongside other environmental indicators, such as global warming potential (GWP), due to its interrelationship with these factors [66,82]. An indicator derived from CED is the Energy Return on Investment (EROI), which measures the energy profitability of an energy system [83]. EROI represents the ratio of useful energy produced by an energy system over its lifetime compared to the energy invested or consumed during its operation [53,84,85]. EROI is useful for evaluating energy performance and assessing the environmental impact of the energy system [83]. To achieve consistency in our findings, the current study meticulously extracted data pertaining to fossil energy consumption associated with H2 production from each analyzed research effort, thereby facilitating the estimation of the correlation between the energy yield encapsulated in 1.0 kg of H2 (based on the LHV H2) and the fossil energy consumption across the entire life cycle, or alternatively, derived from the fossil CED. This correlation has been designated as an energy indicator (EI) within the scope of this analysis. Investigations that involved energy contributions from renewable sources, such as wind and solar, in their calculations of the total CED have been discussed with an emphasis on the fact that only the fossil component was utilized for the computation of the EI in this study.
Therefore, determining the sustainability of H2 requires evaluating the resources and methods used for its production [74], along with other environmental factors and GHG emissions. The potential environmental impacts of the H2 production chain can be assessed using the LCA [68,70]. As interest in H2 as an energy resource grows, research employing LCA is increasingly supporting decision-making about the best methods and resources for its production [11].
3.1. Carbon Footprint
Regarding the GHG emissions along the life cycle of H2, Figure 2 shows the distribution of GWP for SMR, CG, EL, and biomass routes (SRBio, SREtOH, and BG) for H2 production. For more information about the system boundaries and geography of the H2 system, see Table A1.
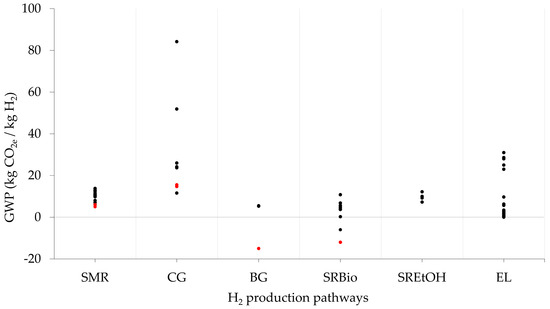
Figure 2.
GWP of H2 production systems, mass relative. SMR: steam methane reforming; CG: coal gasification; SREtOH: steam reforming of ethanol; SRBiogas: steam reforming of biogas; BG: biomass gasification; EL: water electrolysis. Red points indicate technologies with CCS.
In order to compare the GWP of H2 systems with traditional fossil fuels, Figure 3 shows that H2 can reduce GHG emissions when renewable energy is used or when CCS technologies are coupled with fossil-based H2. However, depending on the electricity source used for feeding electrolysis systems, the GWP of those routes can be higher than traditional-based fossil fuels. The GWP ranges from 63 gCO2e/MJ of natural gas to 88 CO2e/MJ of fossil diesel, according to [86]. Routes based on biomass can deliver lower GHG emissions than conventional fuels when H2 is produced from waste.
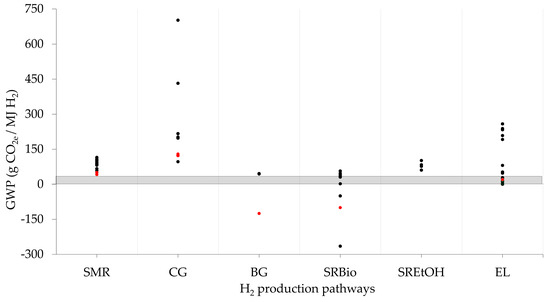
Figure 3.
GWP of H2 production systems, energy parity SMR. Red points indicate technologies with CCS.
SMR is often used as a benchmark for comparing other methods, as it is the conventional technique for H2 production, and renewable alternatives provide a pathway to transitioning away from fossil fuels. According to the studies reviewed, the GWP of the SMR method averages 11.4 kg CO2e/kg H2. For fossil pathways, emissions from the H2 production phase are a key contributor to the GWP observed for the SMR and CG. However, in Figure 4, it can be seen that pathways that employed CCS technologies, such as upstream processes, are the main contributors to GWP [87,88]. For routes based on biomass, contribution analysis depends on the boundaries of LCA studies. Credits can be given for upstream processes, i.e., biomass growth and landfill gas recovery [89,90]. In the case of EL systems, it is evident that upstream electricity generation drives the GWP contribution.
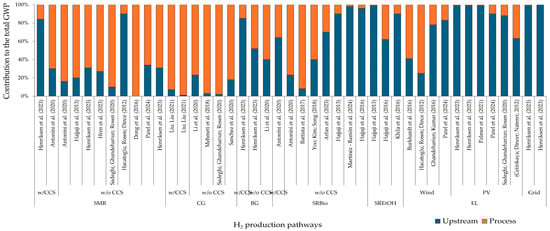
Figure 4.
Contribution analysis for GWP. H2 production with CCS is referred to as “w/CCS”, and an H2 system without CCS is referred to as “w/o CCS”.
Valente, Iribarren, and Dufuour [34] analyzed the GWP of SMR using the LCA approach, considering scenarios with efficiency improvements and a higher share of renewable energy in the electricity grid for 2030 and 2050. However, the study found that the GWP remained at around 10.0 kg CO2e/kg H2 by 2050. Similarly, Sadeghi, Ghandehariun, and Rosen [91] used LCA to estimate a GWP of 10.3 kg CO2e/kg H2 with 90% GHG emissions coming from natural gas consumption during its operation, and only 1% was attributed to the plant’s construction and manufacturing.
In another study, Hren et al. [23] estimated a GWP of 7.0 kg CO2e/kg H2 for the SMR method, noting that the operational phase contributed to 70% of total GHG emissions. Heat integration was considered in the reforming phase by the authors. They also pointed out that the compression stage could increase emissions by up to 0.64 kg CO2e/kg H2 for gaseous compression (up to 700 bar) and 3.0 kg CO2e/kg H2 liquefied processes. Finally, Patel et al. [92] reported a GWP of 12.4 kg CO2e/kg H2 for the SMR method, considering the extraction and transportation of the natural gas by pipeline to the SMR facility, with the operation contributing around 66%, and natural gas transportation and extraction accounting for 25% of the GWP due to the leaks considered by the authors.
Studies on CG pathways show that they tend to have the highest GWP values. However, technologies that apply CCS can significantly reduce GHG emissions. For instance, Li et al. [40] reported a GWP of 52 kg CO2e/kg H2, with the operation phase being the largest contributor, accounting for about 60% of emissions. Similarly, Refs. [46,91,93] noted that the coal gasification phase could account for up to 90% of emissions.
By crediting the surplus electricity produced in the CG process, Sadeghi, Ghandehariun, and Rosen [91] estimated a decrease of 20% in the GWP (10 kg CO2e/kg H2) which is associated with a net positive electricity generation for the CG pathway.
In particular, CCS could be more beneficial for the CG method, as it has a higher proportion of CO2 available for capture compared to SMR, potentially leading to a 75% reduction in emissions [66]. The capture rate of direct emissions in the H2 production stage can reach values of 60–90% for the CG process [88]. The authors compared two pathways for H2 production with CCS technology: deep coal and underground coal gasification (the distinction between deep coal and surface coal revolves around methods of extraction and the geological conditions under which they are found). They found that GHG emissions can be reduced by half, reaching GWP values of 14 kg CO2e/kg H2.
For the processes based on biomass, GWP can vary from −32 up to 12 kg CO2e/kg H2 depending on the energy feedstock employed for H2 generation, as well as the LCA boundaries and credits given for upstream processes. For instance, for routes based on EtOH, the average GWP was estimated to be 8.0 kg CO2e/kg H2. Hajjaji et al. [90] found a GWP of 9.2 kg CO2e/kg H2 for SREtOH from wheat grains, noting that 54% of the GWP came from wheat production due to fertilizer application activities and 45% came from the ethanol distillery due to the use of natural gas for heating purposes. Since animal feed is produced alongside ethanol, the authors expanded the system boundaries to offset the production of conventional animal feed. Khila et al. [94] reported a GWP of 7.26 kg CO2e/kg H2 for beet ethanol, with 51% of GHG emissions attributed to the electricity used by the plant and 38% to the ethanol distillery. By contrast, Siddiqui and Dincer [95] reported a GWP of 12.2 kg CO2e/kg H2 for SREtOH derived from corn under North American conditions.
On the other hand, technologies that use biogas for H2 production via steam reforming can have GWP values ranging from −32.0 to 3.9 kg CO2e/kg H2. Wijayasekera [3] reported a negative GWP of −32 kg CO2e/kg H2. This negative value is attributed to the credit for biogas, as emissions that would have occurred if the waste had been sent to landfills are offset. Battista et al. [89] found a GWP of 6.5 kg CO2e/kg H2 (0.6 kg CO2e/Nm3 H2) for SRBiogas from agro-industrial waste anaerobic digestion. The authors argued that this is the best method for biogas production due to its high CH4/CO2 ratio and the potential use of digestate as a biofertilizer. In a Well-to-Wheel assessment of H2 production from landfill gas (LFG) in South Korea, Yoo, Kim, and Song [96] estimated a GWP of 3.9 kg CO2e/kg H2. The upstream process received credit since GHG emissions from flaring were offset when biogas was produced from LFG. The total credit amounted to 68.2 kg CO2e/GJ H2 linked to LFG recovery. The negative of −4.8 kg CO2e/kg H2 found by Antonini et al. [97] was due to the net carbon balance considered if the digestate was applied as a fertilizer and CO2 was sequestered in the soil. Martínez-Ramón et al. [98] found a GWP of 10.8 kg CO2e/kg H2 for H2 produced from biogas derived from anaerobic digestion of organic waste. They pointed out that biogas production is the main contributor to GWP result, accounting for more than 90% of total GWP, due to biogas leakage, set at 3% of generated biogas.
The EL process is recognized as a renewable and potential way of producing low-carbon H2 [65]. However, as previously mentioned, the source of electricity significantly impacts GHG emissions throughout the life cycle of electrolytic H2. If electricity is sourced from the grid, it can result in high emissions, especially when a substantial share of fossil fuels is used for electricity generation. Hren et al. [23] found a GWP of 23.0 kg CO2e/kg H2 based on the average EU electricity mix in 2020, which included 44% fossil fuels. High GHG emissions was reported by Siddique and Dincer [95] whom found a GWP of 28.6 for US fossil grid mix (34% coal power, 32% natural gas and only a small percentage of renewable sources, 7%). Mio et al. [99] reported a GWP of 4.3 kg CO2e/kg H2 for alkaline electrolysis powered by PV energy and a fully renewable energy mix (45% hydro, 19% PV, and 15% wind). For electrolysis powered by PV and wind energy, most GHG emissions arise from the production of PV panels and wind turbines, accounts for 90% and 83%, respectively [92].
3.2. Water Consumption
Electrochemical and thermochemical processes both use water for H2 production as feedstock and for steam generation and cooling purposes. In the context of H2 energy systems, a study highlighted concerns about water availability [100]. The study analyzed the pressure on water resources that could arise from establishing an H2-based energy economy in 135 countries. The results showed that only nine countries would need to increase their freshwater extraction by more than 10% to support an electrolytic H2 energy system.
Several studies have analyzed the WF and WSF of H2 production systems (Figure 5). Since different methods and indicators were used, the results are not directly comparable. The methods applied for each study are listed in Table A2.
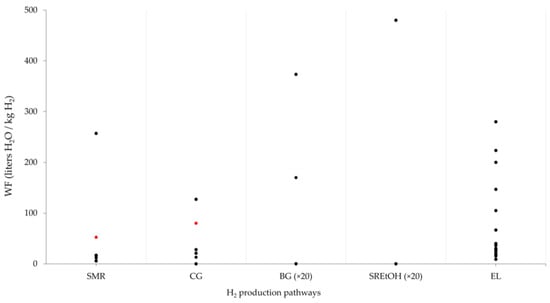
Figure 5.
WF of H2 production systems. SMR: steam methane reforming; CG: coal gasification; BIO (SREtOH, SRBiogas, biogas gasification); EL: water electrolysis. Red points indicate studies that include blue, green, and grey water. Values of WF for BG and SREtOH should be multiplied by 20 times.
Even so, all H2 production methods require water, either directly or for cooling purposes [38]. For processes that rely on biomass for energy, most water use occurs during the growth or production of biomass [10,37,87]. The EL method uses water directly to split the water molecules into H2 and also for cooling. The source of electricity powering the electrolyzer has a significant impact on water use in this method. Processes using PV and wind energy consume less water compared to those using grid electricity [41,46,87]. For PV and wind systems, most of the water is used in manufacturing equipment (Figure 6). In the case of biomass routes, WF is influenced by water consumption in feedstock crop cultivation. For fossil fuel pathways, WF relies on steam generation and the water consumed in natural gas and coal processing.
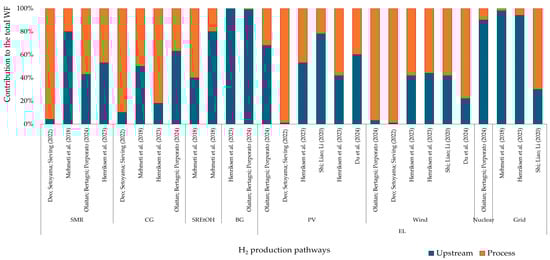
Figure 6.
Contribution analysis for WF.
Deo, Setoyama, and Sieving [101] estimated the WF over the life cycle of seven H2 production routes. They found that renewable resource-based routes, such as EL powered by wind and PV energy, consume less water (about 25%) than conventional routes like CG and SMR. The process phase constitutes more than 90% of the overall WF in these pathways, which is attributable to the exclusion of water in the production of electricity.
Biomass crop cultivation can result in the highest WF compared to traditional methods like SMR [102]. For instance, sugarcane production for SREtOH leads to significant WF due to the water required for crop cultivation.
Cui et al. [37] investigated the WF associated with H2 production from biomass and coal. They found that the WF for the wheat straw-based route reached 9400 L H2O/kg H2 over its life cycle, which is in stark contrast to the fossil fuel route, which consumes only 130 L H2O/kg H2. They highlighted that water use for biomass cultivation accounts for around 99% of the total WF, whereas only 4.15% comes from coal production. The authors considered both green and blue water essential for the agricultural phase of biomass, along with the indirect WF from fertilizers, electricity, and fuels. They emphasized that improving fertilizer application efficiency and soil fertility could significantly reduce WF during the agricultural phase. In coal-based H2 production, WF is mainly driven by electricity usage, which accounts for more than 50% of the total indirect water consumption.
Shi, Liao, and Li [41] found a WF of 130.0, 40.0, and 20.0 L H2O/kg H2 for electrolysis powered by the Australian grid, PV, and wind systems, respectively. WF during the life cycle of PV and wind systems is mainly attributed to equipment production. By applying a WSF index, the same study estimated a WSF due to H2 production of 3000 L H2O/kg H2; this also resulted in 1000 and 500 for the Australian grid mix, PV, and wind electrolysis, respectively.
A study conducted by Mehmeti et al. [46] quantified the WSF using the AWARE indicator, which found a key trade-off between WSF and GWP: routes with a high WSF impact generally tend to have a lower GWP. In terms of WF, they found that the WSF followed the same pattern as the WF. They concluded that water scarcity is strongly influenced by the electricity source used in the studied routes, emphasizing the importance of combining technologies for both fuel and electricity production when assessing the water scarcity index.
An LCA analysis of eleven H2 production pathways was carried out by Henriksen et al. [87]. They estimated that WF ranged from 7 to 55 L H2O/kg H2 for fossil resource-based routes and from 530 to 3400 L H2O/kg H2 for biomass-based routes. BG with CCS technology showed the highest WF among the pathways analyzed due to water consumed for irrigation purposes. Their analysis considered only surface and groundwater consumption, excluding the green (or rain) water used in biomass cultivation routes. They pointed out that it is important to note that although the cooling system operates as a closed loop, make-up water is still necessary to compensate for losses, such as blowdown losses and evaporation from cooling towers. Thus, the make-up water flow aligns with the calculated water consumption.
In EL processes, the electricity source is crucial for accurately estimating both GWP and WF. Olaitan, Bertagni, and Porporato [10] estimated the WF of EL powered by renewable energy compared to fossil resources using the Water Footprint Network [75]. They comprehensively evaluated the blue, grey, and green water used for generating the primary energy resource, as well as the water needed for process and operational uses (including feedstock and cooling water). For biomass-based routes, the WF could rise as high as 7000 L H2O/kg H2 due to the inclusion of green water. Their findings showed that, while the WF across different routes can vary significantly, those using renewable resources (wind, PV) consistently demonstrate a lower WF compared to the H2 produced from SMR and CGR, even when carbon capture and storage are applied.
In the same way, by considering blue (irrigation) and green (precipitation) water needs for biomass crop cultivation, Cui et al. [37] estimated a high WF for H2 derived from wheat gasification. Values of WF can reach 9300 L H2O/kg H2 when electricity required for the pyrolysis of biomass is derived from biomass or hydroelectricity. In general, the authors found that the biomass cultivation phase is a large consumer of water in H2 production—99%.
The WF for SREtOH under Brazilian conditions was estimated to be 9600 L H2O/kg H2 for H2 produced from sugarcane ethanol reforming [102]. Most of the water consumption is associated with green water consumed at sugarcane crop cultivation. The same study employed WFA to estimate the WF of SMR. It was found that a WF of 257 L H2O/kg H2 is associated with hydrogen flow and exhaust gases.
Water availability issues can be a limiting factor for H2 production since it is expected that about 40% of the production capacity for low-carbon electrolytic H2 will be located in regions facing water scarcity [26]. However, a study by Tonelli et al. [103] concluded that the water required for a hypothetical volume of green H2 production (400 Mt/year by 2050) would account for less than 3% of the total water consumption for agriculture, industry, and municipalities.
3.3. Energy Performance
Multiple studies (Figure 7) have highlighted the substantial use of fossil resources in renewable H2 systems throughout their life cycle, indicating that even green H2 production relies on fossil fuels to some extent [3,49,99,104,105]. As a result, assessing the performance of the energy system has become crucial, with the goal of reducing dependence on fossil fuels while improving energy delivery. For more information about CED estimation, see Table A3.
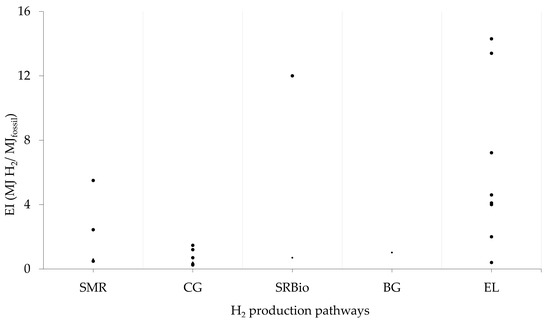
Figure 7.
Energy performance of H2 production systems. SMR: steam methane reforming; CG: coal gasification; Bio (SREtOH, SRBiogas, and biogas gasification); EL: water electrolysis. The energy indicator (EI) was estimated by the authors based on a low heat value (LHV) of H2 (EI = LHV H2/CEDfossil).
The main goal of an energy system is to convert energy efficiently, and one way to measure this efficiency is through the “Cumulative Energy Demand” (CED), which measures the energy consumed by a production system during its life cycle. Energy systems face a twofold challenge: they must reduce GHG emissions while increasing energy output. In this context, assessing the energy performance (EP) of H2 systems is essential. Several studies that have evaluated the efficiency of H2 production systems using the LCA approach demonstrated that AEL systems consume higher fossil energy in the upstream process, mainly for electricity generation and energy consumed for equipment manufacturing [18,80,82]. In the case of biomass routes, studies have shown that upstream processes associated with biomass crop cultivation have a great influence on the EP of H2 systems [40,50,105].
A study conducted by Liu et al. [106] estimated fossil energy consumption for deep CG, traditional (surface) CG, and SMR. They found that deep CG had a life cycle fossil energy consumption of 350 MJ/kg H2 (EI 0.34), while CG and SMR consumed 450 MJ/kg H2 (0.27) and 250 MJ/kg H2 (0.48), respectively. Their findings indicated that deep CG could reduce both coal and oil consumption compared to the traditional coal gasification process.
The comparison of the fossil primary energy use in H2 generation by deep CG and the traditional CG process, Liu and Liu [88] showed that the first one required 61.2% of the energy of the traditional method. Fossil primary energy consumption was reported as being 100 MJ/kg H2 (EI 1.2) for the deep method and 162 MJ/kg H2 (EI 0.74) for CG.
The EROI for EL using PV and grid energy (100% renewable), as well as for SMR, was estimated to be 13.4, 14.3, and 5.48 for the PV EL, grid energy, and SMR processes, respectively [99]. According to the authors, the higher EROI for AEL compared to the SMR process is due to the high EROI of the fuels in the energy mix used for the AEL system.
A CED of 163.7 MJ/kg H2 was found for H2 production from biogas derived from the anaerobic digestion of cattle manure and corn silage (with digestate applied to the field). This value is lower than the estimated 185.1 MJ/kg H2 (EI 0.65) for the SMR route but much higher than the CED (8.8–54.5 MJ/kg H2) reported for electrolysis systems [105]. The authors conclude that, from an energy perspective, the system is unsustainable due to the high natural gas consumption required to achieve the necessary temperature for the reforming process (with 20% of the total energy coming from biomethane and 80% from natural gas).
A high fossil energy consumption was examined by Burkhard et al. [80], which estimated a total CED (including construction, operation, and decommissioning) of 34.3 MJ/kg H2 (EI 4.4 for wind energy-based electrolysis operation), with 82% of the CED attributed to fossil energy use along the life cycle of the H2 system. The kinetic energy of wind was not included in the CED estimation.
An EI of 4.6 for H2 produced through AEL powered by PV energy was reported by Palmer et al. [18]. They found that the PV modules have the largest impact, followed by the balance of system components (frames, hardware). The desalination facility has a minimal contribution in terms of built-in and consumed energy. It is important to note that the system’s lifespan is a key factor for this indicator—plants with shorter lifespans tend to yield a lower EI. The cited paper considered solar energy for CED estimation.
Dufour et al. [82] evaluated fossil resource consumption through CED for electrolytic routes powered by PV, wind, and grid energy (with only 14% of the energy being renewable). For wind power, a CED of 28 MJ/kg H2 (EI 4.3) was reported; 62 (EI 1.9) was reported for PV; and 341 (EI 0.4) was reported for grid-based electrolysis. These figures clearly show that the grid-based system, with its high reliance on fossil energy, constitutes the most detrimental scenario due to the significant presence of non-renewable resources in the electricity mix.
A comprehensive study regarding EROI was conducted by Mio et al. [53], also including the energy input required for system construction and maintenance beyond its operation. In general, they found that electrolysis-based methods (particularly those combining PV energy with a 100% grid energy source) exhibit a 66% superior EI compared to SMR technology. This is largely due to the higher EI values of renewable energy resources compared to natural gas, which is a key input in the H2 production process via SMR. It is important to note that renewable solar energy was included in their estimation.
Battista et al. [89] found an EI of 8.4 (4.5 MJ/Nm³ H2) for SRBiogas from agro-industrial waste anaerobic digestion. The authors considered fossil energy consumption over the lifetime of plant operation. The contribution analysis showed that biogas reforming and partial oxidations have the most significative contribution in energy consumption (more than 85%) followed by biogas purification process. Li et al. [40] estimated a fossil consumption of 117 MJ/kg H2 (EI 1.02) for BG pathway. It was reported that straw production and straw transportation stage contribute to 50% of total energy consumption.
In the cradle-to-grave analysis, Hajjaji et al. [49] assessed the environmental impacts of H2 derived from an anaerobic digestion plant (which uses farm waste, cheese whey, maize silage, and fodder beet for biogas production). By crediting the digestate application in the field (displacing mineral fertilizers), the authors estimated a CED of 4.97 MJ/kg H2 for producing 1.0 kg of H2, of which 84% is non-renewable energy. Without credits given for digestate use as a fertilizer and the credits for the recycling of plant equipment, the EI is estimated to be 12 MJ H2/MJ of fossil energy.
Despite the variety of resources and technologies for H2 production, its use faces significant energy inefficiencies throughout the supply chain. When it is used in fuel cells, only 29% of the total energy invested is converted into useful energy [45]. For applications that burn H2, the overall efficiency is much lower, with considerable energy losses occurring during transportation and distribution and in other stages of the supply chain. H2 burned in internal combustion engines (gas turbines) has low overall efficiency—around 21 to 26% [45]. This low efficiency is due to hydrogen’s low volumetric energy density.
Additionally, the infrastructure required for storing and transporting H2 can lead to significant energy consumption. The main methods for storing and transporting H2 involve both its gaseous and liquid states. Compressing H2 to pressures ranging from 300 to 700 bar requires substantial energy and results in a gravimetric density of less than 40 kg/m3. The energy spent on the compression process can account for 13–18% of the LHV of the stored H2, exceeding 2.21 kWh/kg H2. On the other hand, liquefying H2 requires energy for both compression and cooling to 20.15 K, which can consume up to 45% of the LHV of H2, through which it achieves a gravimetric density of 70.8 kg/m3 [84,107]. In this sense, evaluating energy consumption across the entire life cycle of H2 systems is essential.
4. General Discussion
As already pointed out, indicators based on the life cycle perspective are highly sensitive to methodology issues, such as system boundaries and environmental assessment methods, or how eventual co-products are handled [108]. As such, a direct comparison of the figures (see Figure 1, Figure 3 and Figure 5) is not reasonable since different studies for the same H2 pathway could be carried out by different assumptions. On the other hand, some convergences and trade-offs can be highlighted:
EL-based pathways, so promising and desired in the energy transition context [34], were reported in the highest number of studies (21), and their results presented a relevant variation in all criteria (carbon, water, and energy). The GWP values for EL routes are strongly influenced by the energy sources employed for electricity generation. Electrolyzers supplied by power grids may have higher GHG emissions than H2 derived from fossil fuels [82,87,95] since high energy consumption for electrolysis is combined with the presence of fossil energy in the power grid. In contrast, EL-based pathways from renewable energy could lead to low GWP and present the highest values for EIs. This latter point indicates that H2 based on renewable energy systems can deliver high performance, i.e., producing more renewable energy than fossil energy consumed over the entire life cycle of H2 systems. However, when electricity used for electrolyzer feeding is produced from a mix of fossil fuels, EI can return values lower than SMR or CG pathways.
The better performance of biomass-based H2 on GWP, in comparison with SMR, depends on the credits obtained from avoided landfill methane emissions (for waste feedstock) or co-product displacement [3,97]. It is important to mention that biogenic carbon on biomass-based routes is not accounted for. However, because methane emissions are 28 times more potent than CO2, any methane leaks during the upgrading of biogas can still influence the total emissions of SRBiogas.
The promising values of EL-based pathways on GWP and EI do not perform similarly on WF indicators, which are also influenced by the upstream process (see the high variability in Figure 4). This is particularly important for nuclear energy [10] and grids based on fossil fuels [46] or hydroelectricity [41]. PV and wind consume much less water for electricity generation compared to thermal power plants. Biomass-based routes may have the highest WF among the pathways analyzed.
In turn, according to Henriksen et al. [87], biomass-based routes face a clear trade-off between reducing GWP and the WF needed for biomass cultivation. The inclusion of the green water component increases the WF for the SREtOH and BG routes [37,102]. Also, the blue water required for the irrigation for biomass crop cultivation increases the WF of H2 [87].
The energy sector and water availability are closely linked, making it important to consider this relationship when evaluating energy production, as both water quality and quantity can significantly affect energy supply [38]. The energy industry consumes large amounts of water at various stages, from sourcing energy to generating electricity. In this sense, droughts, exacerbated by climate change, pose a significant threat to the energy supply system. As such, the water issue has become a key consideration in planning H2 plants, and it is essential to include water availability indicators in H2 LCA studies.
However, given that around 70% of planned electrolytic H2 production for 2030 will be located within 100 km of the coast, this presents an ideal opportunity to use seawater through desalination. The cost of desalination plants is relatively low, accounting for less than 2% of H2 production costs, with seawater reverse osmosis requiring around 3–6 kWh/m3 of water [10,26]. In addition, water usage in electrolysis systems powered by wind and PV technologies could be reduced by treating and recycling the wastewater produced during the manufacturing of system components [103].
From a hydrological balance perspective, it is important to note that electrolytic H2 should not be considered a major consumer of water resources. This is because green H2 when oxidized (either through combustion or in a fuel cell), releases an amount of water equal to what was used in the electrolysis process. As a result, the water generated as a by-product of the H2 reaction is released into the atmosphere as water vapour or condensate, which can then be recovered in liquid form. This creates a balance, leading to a neutral impact on water use and availability in green H2 production [109].
Despite the expected technical differences on the H2 pathways—such as yields, inputs, and utilities—it is recognized that methodological assumptions can lead relevant discrepancies on the results. In that sense, the WF values presented the highest variation, especially in EL (9.0–280.0 l H2O/kg H2) and biomass-based pathways (2.2–9600 L H2O/kg H2). In turn, the GWP indicator could achieve negative values with biomass-based routes due to credits accounting. In other hand, GWP of EL can be higher than traditional fossil-based pathways due to the composition of grid’s electricity. In the case of SRM, the introduction of CCS technology or heat integration in the H2 production plant can reduce the overall GHG emissions for this route. Finally, the EL based pathways also reported a high variation (0.4–14 MJ/MJ) in energy intensity (EI) indicators, compared to the narrow range related to CG (0.25–1.47 MJ/MJ) or SMR (5.5–0.48 MJ/MJ). This large variation for EL system can be attributed to renewability of electricity supply system. In the case of SMR, the range values of EI depend on the use [99] or credit given for heat produced in steam reforming process.
In the bold comparison of the three indicators showcased in this analysis (GWP, EI, and WF), it became clear that H2 production pathways that utilize renewable energy sources exhibit a significantly better environmental profile than traditional pathways reliant on fossil fuels. Nevertheless, it is imperative to guarantee that the electrolysis-based pathways of the grid are exclusively powered by renewable sources, as EL pathways that draw electricity from a blend of fossil fuels can lead to elevated GWP, WF, and diminished energy returns, underscoring a more detrimental environmental impact than conventional fossil-dependent routes. H2 generated from biomass stands to gain enormously from the energetic application of agricultural and urban waste, not only aiding in the reduction of GHG emissions but also fostering a circular economy that elevates materials once deemed worthless.
5. Conclusions
The increasing demand for energy and good environmental issues have driven initiatives to create sustainable energy solutions. In this scenario, H2 is recognized as a key energy carrier and is emerging as a strong alternative among new energy options.
This study focused on three key aspects for evaluating the environmental performance of H2 production systems as an energy carrier: carbon, water, and energy. To achieve this, 37 scientific studies (2012–2024), considering these aspects from the life cycle perspective, were evaluated. It is worth noting that none of these studies addressed the three aspects simultaneously. Conventional pathways for hydrogen production were considered (steam methane reform, SMR; coal gasification, CG), as well as promising/desired ones, such as water electrolysis (EL), steam reforming of ethanol (SREtOH) or biogas (SRBio), and biomass gasification (BG).
From an LCA approach, this research points out that renewable H2 does have some negative environmental effects throughout its life cycle. An EL system that uses grid electricity for electrolyzers suggests that GHG emissions and WF could exceed those of traditional methods like SMR and CG, depending on the grid’s electricity based on hydraulic energy potential or fossil fuels.
In turn, waste-based H2 pathways (landfill biogas, pig manure, waste corn crops, and cattle manure) may lead to negative GHG emissions since they are assigned to the biomass producer, leading to eventual credits gained by co-product displacement or the CCS system [97]. However, due to the GWP of methane, any methane leaks during the upgrading of biogas can still influence the total emissions of SRBio.
Overall, it was found that renewable-based (PV and wind) routes can help reduce GHG emissions, improve energy performance and decrease WF compared to SMR and CGR routes due to lower water consumption for electricity generation compared to fossil resources. However, WF remains a significant challenge for biomass renewable initiatives, particularly in regions where H2 plants face droughts and water scarcity. In addition, biogas derived from biomass waste reuse as energy feedstock can help to mitigate the impacts of water scarcity while simultaneously providing a sustainable source of H2 production.
Future studies could explore the interdependence of these three environmental indicators. Regions with abundant renewable energy may still face challenges related to water availability and/or low-quality water. In this sense, regional LCA studies could be conducted to assess the nexus between the indicators reviewed in this paper for H2 production systems. Additionally, harmonized LCA studies can be considered to avoid comparing different systems boundaries as well as methodological choices such as system expansion, function unit, allocation of co-products.
Author Contributions
Conceptualization, D.P.M.d.S. and R.S.C.; writing—original draft preparation, D.P.M.d.S. and R.S.C.; writing—review and editing, D.P.M.d.S. and R.S.C. All authors have read and agreed to the published version of the manuscript.
Funding
This research was funded by Institutional Human Resources Training Program of the National Petroleum, Natural Gas and Biofuels Agency grant number PRH-ANP no. 46.1.
Data Availability Statement
Not applicable.
Acknowledgments
The authors would like to thank the Institutional Human Resources Training Program of the National Petroleum, Natural Gas and Biofuels Agency (PRH-ANP no. 46.1) for granting a master’s degree to Douglas Peterson Munis da Silva. Additionally, we express our appreciation to the Deutsche Gesellschaft für Internationale Zusammenarbeit (GIZ) for the Project UNIFEI/GIZ/FAPEPE: “Green Hydrogen Cluster CH2V” (“Centro de Hidrogênio Verde CH2V” in Portuguese) and the Center for Environmental Quality Studies (CEQUAM).
Conflicts of Interest
The authors declare no conflicts of interest.
Abbreviations
| AD | Anaerobic Digestion |
| AEL | Alkaline Electrolysis |
| AWARE | Available Water Remaining |
| BG | Biomass Gasification Reforming |
| BP | Biomass Pyrolysis |
| CCS | Carbon Capture and Storage |
| CED | Cumulative Energy Demand |
| CG | Coal Gasification |
| EL | Electrolysis |
| EI | Energy Indicator |
| EROI | Energy Return on Investment |
| EtOH | Ethanol |
| GHG | Greenhouse gas |
| GWP | Global Warming Potential |
| HHV | High Heat Value |
| LCA | Life Cycle Assessment |
| LFG | Landfill Gas |
| LHV | Low Heat Value |
| PEM | Proton-Exchange Membrane |
| PV | Photovoltaic |
| SMR | Steam Methane Reforming |
| SOEC | Solid Oxide Electrolyzer Cell |
| SRBio | Steam Reforming of Biomethane |
| SREtOH | Steam Reforming of Ethanol |
| WF | Water Footprint |
| WFA | Water Footprint Assessment |
| WFN | Water Footprint Network |
| WGS | Water Gas Shift |
| WSF | Water Scarcity Footprint |
Appendix A
Table A1.
GWP of H2 production.
Table A1.
GWP of H2 production.
| Route | GWP (kg CO2e/kg H2) | Location of the Study | Observations | Boundaries | Ref. |
|---|---|---|---|---|---|
| SMR | 11.2 | - | - | Cradle-to-gate | [90] |
| 11.9 | - | - | Not specified | [110] | |
| 13.8 | - | - | Well-to-pump | [95] | |
| 9.8 | - | - | Cradle-to-use | [111] | |
| 10.8 | Europe | - | Cradle-to-gate | [97] | |
| 10.2 | - | - | Cradle-to-grave | [91] | |
| 10.4 | - | - | Cradle-to-gate | [87] | |
| 7 | - | - | Cradle-to-gate | [23] | |
| 12.6 | - | - | Cradle-to-gate | [99] | |
| 8.0 | - | - | Well-to-pump | [112] | |
| 12.3 | Finland | - | Cradle-to-gate | [92] | |
| CGR | 23.7 | - | - | Well-to-pump | [95] |
| 11.59 | Iran | - | Cradle-to-grave | [91] | |
| 24.2 | - | - | Cradle-to-grave | [46] | |
| 26 | - | - | Cradle-to-gate | [66] | |
| 51.86 | - | - | Cradle-to-distribution | [40] | |
| 84.2 | - | - | Not specified | [93] | |
| 14.74 | - | - | Cradle-to-gate | [88] | |
| SRBiogas | 9.2 | Swedish | Wheat grains EtOH | Cradle-to-gate | [90] |
| 6.8 | - | - | Cradle-to-gate | [49] | |
| 7.27 | Tunisian | Sugar beet EtOH | Cradle-to-gate | [94] | |
| 10.8 | - | AD of organic waste | Cradle-to-gate | [98] | |
| 0.25 | Germany | Biogas supply | Cradle-to-gate | [89] | |
| 12.2 | USA | Corn EtOH | Well-to-pump | [95] | |
| −4.8 | Europe | AD of waste | Cradle-to-gate | [97] | |
| 4 | - | Waste corn crops and pig manure | Cradle-to-distribution | [23] | |
| 5.6 | - | AD manure, cheese whey, maize silage and fodder beet | Cradle-to-gate | [49] | |
| 10 | USA | Biomass collection | Well-to-pump | [95] | |
| 3.9 | Republic of Korea | Landfill gas | Well-to-wheel | [96] | |
| 2.13 | Sweden | Mostly food waste | Cradle-to-gate | [113] | |
| −31.8 | - | Residues from landfill bioreactor | Cradle-to-gate | [3] | |
| EL | 23 | Italy | AEL Grid mix | Cradle-to-gate | [99] |
| 28.01 | - | AEL Grid 80% fossil | Cradle-to-gate | [82] | |
| 6.3 | Brazil | Grid | Cradle-to-gate | [114] | |
| 28.6 | USA | Grid | Well-to-pump | [95] | |
| 31 | USA | PEM Grid | Cradle-to-gate | [87] | |
| 23 | Union Europe | Grid 2019 | Cradle-to-distribution | [23] | |
| 5.7 | - | AEL PV | Cradle-to-gate | [82] | |
| 2.0 | Canada | PV | Cradle-to-grave | [6] | |
| 0.37 | - | PV | Not specified | [110] | |
| 3.1 | Iran | PV AEL | Cradle-to-grave | [91] | |
| 2.8 | - | PEM PV | Cradle-to-gate | [87] | |
| 0.5 | Switzerland | AEL PV | Cradle-to-gate | [66] | |
| 2.5 | Finland | PEM PV | Cradle-to-gate | [92] | |
| 2.5 | Australia | AEL PV | Cradle-to-gate | [18] | |
| 1.9 | Germany | Wind | Cradle-to-grave | [80] | |
| 0.7 | Canada | Wind | Cradle-to-distribution | [115] | |
| 9.7 | - | Wind | Cradle-to-gate | [23] | |
| 0.4 | Europe | AEL Wind | Well-to-tank | [66] | |
| 3.4 | - | Wind | Cradle-to-gate | [82] | |
| 0.9 | Canada | Wind | Cradle-to-gate | [6] | |
| 0.0325 | - | Wind | Not specified | [110] | |
| 1.8 | - | PEM Wind | Cradle-to-gate | [87] | |
| 0.6 | Finland | PEM Wind | Cradle-to-gate | [92] |
Table A2.
WF and WSF of H2 production.
Table A2.
WF and WSF of H2 production.
| Route | Location of the Study | Observations | Method | WF L H2O/kg H2 | WSF m³ H2O/kg H2 | Ref. |
|---|---|---|---|---|---|---|
| SMR | USA | - | LCA | 15.8 | - | [101] |
| USA | - | LCA | 11.7 | - | [116] | |
| - | AWARE | 5.77 | 247.5 | [46] | ||
| - | WFN | 52.4 | - | [10] | ||
| Brazil | - | LCA | 257 | - | [102] | |
| CG | USA | - | LCA | 20.8 | - | [101] |
| - | AWARE | 13.1 | 570.2 | [46] | ||
| USA | - | LCA | 28 | - | [87] | |
| - | WFN | 80 | - | [10] | ||
| China | - | LCA | 127.2 | - | [37] | |
| SREtOH | Maize ethanol | AWARE | 2.24 | 91.61 | [46] | |
| Wheat ethanol | 3.87 | 149.4 | [46] | |||
| Brazil | Sugarcane ethanol | LCA | 9600 | - | [102] | |
| BG | Waste corn crop | AWARE | 4.94 | 212.4 | [46] | |
| USA | - | LCA | 532 | [87] | ||
| - | WFN | 7467 | [10] | |||
| BP | China | Wheat straw biomass | LCA | 9332.40 | - | [37] |
| EL | PV | WFN | 29 | - | [10] | |
| Wind | 9.2 | - | [10] | |||
| Nuclear | 105 | - | [10] | |||
| USA | PV/PEM | LCA | 15.5 | - | [101] | |
| USA | Wind/PEM | LCA | 15.5 | - | [101] | |
| Grid not specified/PEM | AWARE | 223.4 | 9604.30 | [46] | ||
| Grid not specified /SOEC | AWARE | 146.8 | 6312.30 | [46] | ||
| Wind/SOEC | AWARE | 9 | 379.3 | [46] | ||
| Wind/PEM | AWARE | 16.40 | 629.8 | [46] | ||
| USA | Grid/PEM | LCA | 280 | - | [87] | |
| USA | PV/PEM | LCA | 40 | - | [87] | |
| USA | Wind/PEM | LCA | 26 | - | [87] | |
| USA | Grid/PEM | LCA | 220 | - | [87] | |
| USA | PV/SOEC | LCA | 26 | - | [87] | |
| USA | Wind/SOEC | LCA | 25 | - | [87] | |
| Australia | Grid/PEM | AWARE | 200 | 3.0 | [41] | |
| Australia | PV/PEM | AWARE | 40 | 1.0 | [41] | |
| Australia | Wind/PEM | AWARE | 20 | 0.4 | [41] | |
| China | PV/AEL | AWARE | 66.6 | 915 | [36] | |
| China | Wind/AEL | AWARE | 36.4 | 1700 | [36] | |
| USA | Wind/AEL | LCA | 30.2 | - | [116] | |
| USA | PV/AEL | LCA | 30.2 | - | [116] |
Table A3.
Cumulative Energy Demand and Energy Indicator (EI) of H2 production.
Table A3.
Cumulative Energy Demand and Energy Indicator (EI) of H2 production.
| Technology | CED (MJ/kg H2) | EI | References |
|---|---|---|---|
| SMR | 216 | 0.6 * | [66] |
| - | 2.44 | [53] | |
| - | 5.5 | [99] | |
| CG | 300 | 0.4 * | [66] |
| 162 | 0.7 * | [88] | |
| 100 | 1.2 | [88] | |
| - | 1.47 | [53] | |
| 450 | 0.25 * | [106] | |
| 350 | 0.3 * | [106] | |
| SRBiogas | 164 | 0.7 * | [105] |
| - | 12.0 | [50] | |
| BG | 117.4 | 1.02 | [40] |
| EL PV | 60 | 2.0 * | [66] |
| - | 4.6 | [18] | |
| - | 7.22 | [53] | |
| 62 | 2.0 * | [82] | |
| - | 13.4 | [99] | |
| 30 | 4.0 * | [66] | |
| 34 | 4.1 * | [80] | |
| EL Grid EU | 341 | 0.4 * | [82] |
| EL Grid (45% NG and 20% Hydro) | - | 14.3 | [99] |
* Estimated by the authors based on LHV H2 (EI = LHV H2/CEDfossil).
References
- Da Silva Veras, T.; Mozer, T.S.; Da Costa Rubim Messeder Dos Santos, D.; Da Silva César, A. Hydrogen: Trends, Production and Characterization of the Main Process Worldwide. Int. J. Hydrogen Energy 2017, 42, 2018–2033. [Google Scholar] [CrossRef]
- Aravindan, M.; Kumar, P.G. Hydrogen towards Sustainable Transition: A Review of Production, Economic, Environmental Impact and Scaling Factors. Results Eng. 2023, 20, 101456. [Google Scholar] [CrossRef]
- Wijayasekera, S.C.; Hewage, K.; Hettiaratchi, P.; Siddiqui, O.; Razi, F.; Pokhrel, D.; Sadiq, R. Sustainability of Waste-to-Hydrogen Conversion Pathways: A Life Cycle Thinking-Based Assessment. Energy Convers. Manag. 2022, 270, 116218. [Google Scholar] [CrossRef]
- Moura, C.H.S.; Silveira, J.L.; Lamas, W.D.Q. Dynamic Production, Storage, and Use of Renewable Hydrogen: A Technical-Economic-Environmental Analysis in the Public Transport System in São Paulo State, Brazil. Int. J. Hydrogen Energy 2020, 45, 31585–31598. [Google Scholar] [CrossRef]
- Prato-Garcia, D.; Robayo-Avendaño, A.; Vasquez-Medrano, R. Hydrogen from Natural Gas and Biogas: Building Bridges for a Sustainable Transition to a Green Economy. Gas Sci. Eng. 2023, 111, 204918. [Google Scholar] [CrossRef]
- Cetinkaya, E.; Dincer, I.; Naterer, G.F. Life Cycle Assessment of Various Hydrogen Production Methods. Int. J. Hydrogen Energy 2012, 37, 2071–2080. [Google Scholar] [CrossRef]
- Zhang, M.; Yang, X. The Regulatory Perspectives to China’s Emerging Hydrogen Economy: Characteristics, Challenges, and Solutions. Sustainability 2022, 14, 9700. [Google Scholar] [CrossRef]
- Hassan, Q.; Abdulateef, A.M.; Hafedh, S.A.; Al-samari, A.; Abdulateef, J.; Sameen, A.Z.; Salman, H.M.; Al-Jiboory, A.K.; Wieteska, S.; Jaszczur, M. Renewable Energy-to-Green Hydrogen: A Review of Main Resources Routes, Processes and Evaluation. Int. J. Hydrogen Energy 2023, 48, 17383–17408. [Google Scholar] [CrossRef]
- Mir, B.A.; Nurdiawati, A.; Al-Ghamdi, S.G. Assessing the Environmental Impact of Freshwater Use in LCA: Established Practices and Current Methods. Environ. Sci. Water Res. Technol. 2025, 11, 196–221. [Google Scholar] [CrossRef]
- Olaitan, D.; Bertagni, M.; Porporato, A. The Water Footprint of Hydrogen Production. Sci. Total Environ. 2024, 927, 172384. [Google Scholar] [CrossRef]
- Gandiglio, M.; Marocco, P.; Bianco, I.; Lovera, D.; Blengini, G.A.; Santarelli, M. Life Cycle Assessment of a Renewable Energy System with Hydrogen-Battery Storage for a Remote off-Grid Community. Int. J. Hydrogen Energy 2022, 47, 32822–32834. [Google Scholar] [CrossRef]
- Ritchie, H.; Roser, M.; Rosado, P. CO2 and Greenhouse Gas Emissions. Published Online at OurWorldInData.Org. 2024. Available online: https://ourworldindata.org/co2-and-greenhouse-gas-emissions (accessed on 24 April 2025).
- Empresa de Pesquisa Energética (EPE) Balanço Energético Nacional 2023: Ano Base 2022. 2023. Available online: https://www.epe.gov.br/pt/publicacoes-dados-abertos/publicacoes/balanco-energetico-nacional-ben (accessed on 24 April 2025).
- Wedy, G.; Amaral, W.; Pimentel, C. The Carbon Market and Its Regulation in Brazil; Sabin Center for Climate Change Law, Columbia Law School: New York, NY, USA, 2022; Available online: https://scholarship.law.columbia.edu/cgi/viewcontent.cgi?article=1194&context=sabin_climate_change (accessed on 24 April 2025).
- de Andrade Santos, J.A.F.; De Jong, P.; Alves Da Costa, C.; Torres, E.A. Combining Wind and Solar Energy Sources: Potential for Hybrid Power Generation in Brazil. Util. Policy 2020, 67, 101084. [Google Scholar] [CrossRef]
- IRENA. Hydrogen from Renewable Power: Technology Outlook for the Energy Transition; IRENA: Abu Dhabi, United Arab Emirates, 2018. [Google Scholar]
- Chelvam, K.; Hanafiah, M.M.; Woon, K.S.; Ali, K.A. A Review on the Environmental Performance of Various Hydrogen Production Technologies: An Approach towards Hydrogen Economy. Energy Rep. 2024, 11, 369–383. [Google Scholar] [CrossRef]
- Palmer, G.; Roberts, A.; Hoadley, A.; Dargaville, R.; Honnery, D. Life-Cycle Greenhouse Gas Emissions and Net Energy Assessment of Large-Scale Hydrogen Production via Electrolysis and Solar PV. Energy Environ. Sci. 2021, 14, 5113–5131. [Google Scholar] [CrossRef]
- Arvesen, A.; Hertwich, E.G. Environmental Implications of Large-Scale Adoption of Wind Power: A Scenario-Based Life Cycle Assessment. Environ. Res. Lett. 2011, 6, 045102. [Google Scholar] [CrossRef]
- Oliveira, R.C.D. Panorama do Hidrogênio no Brasil. 2022. Available online: https://repositorio.ipea.gov.br/handle/11058/11291 (accessed on 24 April 2025).
- dos Santos, K.G.; Eckert, C.T.; De Rossi, E.; Bariccatti, R.A.; Frigo, E.P.; Lindino, C.A.; Alves, H.J. Hydrogen Production in the Electrolysis of Water in Brazil, a Review. Renew. Sustain. Energy Rev. 2017, 68, 563–571. [Google Scholar] [CrossRef]
- Yue, M.; Lambert, H.; Pahon, E.; Roche, R.; Jemei, S.; Hissel, D. Hydrogen Energy Systems: A Critical Review of Technologies, Applications, Trends and Challenges. Renew. Sustain. Energy Rev. 2021, 146, 111180. [Google Scholar] [CrossRef]
- Hren, R.; Vujanović, A.; Van Fan, Y.; Klemeš, J.J.; Krajnc, D.; Čuček, L. Hydrogen Production, Storage and Transport for Renewable Energy and Chemicals: An Environmental Footprint Assessment. Renew. Sustain. Energy Rev. 2023, 173, 113113. [Google Scholar] [CrossRef]
- IEA. The Future of Hydrogen, 2019; IEA: Singapore, 2024. [Google Scholar]
- Nadaleti, W.C.; Borges dos Santos, G.; Lourenço, V.A. The Potential and Economic Viability of Hydrogen Production from the Use of Hydroelectric and Wind Farms Surplus Energy in Brazil: A National and Pioneering Analysis. Int. J. Hydrogen Energy 2020, 45, 1373–1384. [Google Scholar] [CrossRef]
- IEA. Global Hydrogen Review 2024; IEA: Singapore, 2024. [Google Scholar]
- Ajanovic, A.; Sayer, M.; Haas, R. The Economics and the Environmental Benignity of Different Colors of Hydrogen. Int. J. Hydrogen Energy 2022, 47, 24136–24154. [Google Scholar] [CrossRef]
- Chew, Y.E.; Cheng, X.H.; Loy, A.C.M.; How, B.S.; Andiappan, V. Beyond the Colours of Hydrogen: Opportunities for Process Systems Engineering in Hydrogen Economy. Process Integr. Optim. Sustain. 2023, 7, 941–950. [Google Scholar] [CrossRef]
- Incer-Valverde, J.; Korayem, A.; Tsatsaronis, G.; Morosuk, T. “Colors” of Hydrogen: Definitions and Carbon Intensity. Energy Convers. Manag. 2023, 291, 117294. [Google Scholar] [CrossRef]
- Rojas, J.; Zhai, S.; Sun, E.; Haribal, V.; Marin-Quiros, S.; Sarkar, A.; Gupta, R.; Cargnello, M.; Chueh, W.; Majumdar, A. Technoeconomics and Carbon Footprint of Hydrogen Production. Int. J. Hydrogen Energy 2023, 49 Pt D, 59–74. [Google Scholar] [CrossRef]
- Zhang, L.; Jia, C.; Bai, F.; Wang, W.; An, S.; Zhao, K.; Li, Z.; Li, J.; Sun, H. A Comprehensive Review of the Promising Clean Energy Carrier: Hydrogen Production, Transportation, Storage, and Utilization (HPTSU) Technologies. Fuel 2024, 355, 129455. [Google Scholar] [CrossRef]
- Osman, A.I.; Mehta, N.; Elgarahy, A.M.; Hefny, M.; Al-Hinai, A.; Al-Muhtaseb, A.H.; Rooney, D.W. Hydrogen Production, Storage, Utilisation and Environmental Impacts: A Review. Environ. Chem. Lett. 2022, 20, 153–188. [Google Scholar] [CrossRef]
- Ergin Şahin, M. A Photovoltaic Powered Electrolysis Converter System with Maximum Power Point Tracking Control. Int. J. Hydrogen Energy 2020, 45, 9293–9304. [Google Scholar] [CrossRef]
- Valente, A.; Iribarren, D.; Dufour, J. Prospective Carbon Footprint Comparison of Hydrogen Options. Sci. Total Environ. 2020, 728, 138212. [Google Scholar] [CrossRef]
- Weidner, T.; Tulus, V.; Guillén-Gosálbez, G. Environmental Sustainability Assessment of Large-Scale Hydrogen Production Using Prospective Life Cycle Analysis. Int. J. Hydrogen Energy 2023, 48, 8310–8327. [Google Scholar] [CrossRef]
- Du, L.; Yang, Y.; Bai, X.; Xu, S.; Lin, L.; Liu, M. Water Scarcity Footprint and Water Saving Potential for Large-Scale Green Hydrogen Generation: Evidence from Coal-to-Hydrogen Substitution in China. Sci. Total Environ. 2024, 940, 173589. [Google Scholar] [CrossRef]
- Cui, P.; Yao, D.; Ma, Z.; Shen, Y.; Liu, X.; Li, K.; Zhu, Z.; Liu, Z.; Gao, J.; Wang, Y.; et al. Life Cycle Water Footprint Comparison of Biomass-to-Hydrogen and Coal-to-Hydrogen Processes. Sci. Total Environ. 2021, 773, 145056. [Google Scholar] [CrossRef]
- IRENA. Bluerisk Water for Hydrogen Production; IRENA: Abu Dhabi, United Arab Emirates, 2023. [Google Scholar]
- Simoes, S.G.; Catarino, J.; Picado, A.; Lopes, T.F.; Di Berardino, S.; Amorim, F.; Gírio, F.; Rangel, C.M.; Ponce De Leão, T. Water Availability and Water Usage Solutions for Electrolysis in Hydrogen Production. J. Clean. Prod. 2021, 315, 128124. [Google Scholar] [CrossRef]
- Li, G.; Cui, P.; Wang, Y.; Liu, Z.; Zhu, Z.; Yang, S. Life Cycle Energy Consumption and GHG Emissions of Biomass-to-Hydrogen Process in Comparison with Coal-to-Hydrogen Process. Energy 2020, 191, 116588. [Google Scholar] [CrossRef]
- Shi, X.; Liao, X.; Li, Y. Quantification of Fresh Water Consumption and Scarcity Footprints of Hydrogen from Water Electrolysis: A Methodology Framework. Renew. Energy 2020, 154, 786–796. [Google Scholar] [CrossRef]
- Lee, U.; Xu, H.; Daystar, J.; Elgowainy, A.; Wang, M. AWARE-US: Quantifying Water Stress Impacts of Energy Systems in the United States. Sci. Total Environ. 2019, 648, 1313–1322. [Google Scholar] [CrossRef] [PubMed]
- Bhandari, R.; Trudewind, C.A.; Zapp, P. Life Cycle Assessment of Hydrogen Production via Electrolysis—A Review. J. Clean. Prod. 2014, 85, 151–163. [Google Scholar] [CrossRef]
- Nikolaidis, P.; Poullikkas, A. A Comparative Overview of Hydrogen Production Processes. Renew. Sustain. Energy Rev. 2017, 67, 597–611. [Google Scholar] [CrossRef]
- Brandon, N.P.; Kurban, Z. Clean Energy and the Hydrogen Economy. Phil. Trans. R. Soc. A 2017, 375, 20160400. [Google Scholar] [CrossRef]
- Mehmeti, A.; Angelis-Dimakis, A.; Arampatzis, G.; McPhail, S.J.; Ulgiati, S. Life Cycle Assessment and Water Footprint of Hydrogen Production Methods: From Conventional to Emerging Technologies. Environments 2018, 5, 24. [Google Scholar] [CrossRef]
- GIZ. Panorama dos Desafios do Hidrogênio Verde no Brasil; GIZ: Brasília, Brazil, 2021. [Google Scholar]
- Ghasemi, A.; Nikafshan Rad, H.; Akrami, M. Biomass-to-Green Hydrogen: A Review of Techno-Economic-Enviro Assessment of Various Production Methods. Hydrogen 2024, 5, 474–493. [Google Scholar] [CrossRef]
- Hajjaji, N.; Martinez, S.; Trably, E.; Steyer, J.P.; Helias, A. Life Cycle Assessment of Hydrogen Production from Biogas Reforming. Int. J. Hydrogen Energy 2016, 41, 6064–6075. [Google Scholar] [CrossRef]
- Hajjaji, N.; Khila, Z.; Baccar, I.; Pons, M.-N. A Thermo-Environmental Study of Hydrogen Production from the Steam Reforming of Bioethanol. J. Energy Storage 2016, 7, 204–219. [Google Scholar] [CrossRef]
- Shaya, N.; Glöser-Chahoud, S. A Review of Life Cycle Assessment (LCA) Studies for Hydrogen Production Technologies through Water Electrolysis: Recent Advances. Energies 2024, 17, 3968. [Google Scholar] [CrossRef]
- Ji, M.; Wang, J. Review and Comparison of Various Hydrogen Production Methods Based on Costs and Life Cycle Impact Assessment Indicators. Int. J. Hydrogen Energy 2021, 46, 38612–38635. [Google Scholar] [CrossRef]
- Mio, A.; Barbera, E.; Pavan, A.M.; Danielis, R.; Bertucco, A.; Fermeglia, M. Analysis of the Energetic, Economic, and Environmental Performance of Hydrogen Utilization for Port Logistic Activities. Appl. Energy 2023, 347, 121431. [Google Scholar] [CrossRef]
- Luk, H.T.; Lei, H.M.; Ng, W.Y.; Ju, Y.; Lam, K.F. Techno-Economic Analysis of Distributed Hydrogen Production from Natural Gas. Chin. J. Chem. Eng. 2012, 20, 489–496. [Google Scholar] [CrossRef]
- Department of Energy. Argonne National Laboratory Guidelines to Determine Well-to-Gate Greenhouse Gas (GHG) Emissions of Hydrogen Production Pathways Using 45VH2-GREET 2023; Department of Energy: Washington, DC, USA, 2023. [Google Scholar]
- Palanisamy, A.; Soundarrajan, N.; Ramasamy, G. Analysis on Production of Bioethanol for Hydrogen Generation. Environ. Sci. Pollut. Res. 2021, 28, 63690–63705. [Google Scholar] [CrossRef]
- Llorca, J.; Corberán, V.C.; Divins, N.J.; Fraile, R.O.; Taboada, E. Hydrogen from Bioethanol. In Renewable Hydrogen Technologies; Elsevier: Rio de Janeiro, Brazil, 2013; pp. 135–169. ISBN 978-0-444-56352-1. [Google Scholar]
- Cho, H.H.; Strezov, V.; Evans, T.J. A Review on Global Warming Potential, Challenges and Opportunities of Renewable Hydrogen Production Technologies. Sustain. Mater. Technol. 2023, 35, e00567. [Google Scholar] [CrossRef]
- Hammi, Z.; Labjar, N.; Dalimi, M.; El Hamdouni, Y.; Lotfi, E.M.; El Hajjaji, S. Green Hydrogen: A Holistic Review Covering Life Cycle Assessment, Environmental Impacts, and Color Analysis. Int. J. Hydrogen Energy 2024, 80, 1030–1045. [Google Scholar] [CrossRef]
- Borole, A.P.; Greig, A.L. Life-Cycle Assessment and Systems Analysis of Hydrogen Production. In Biohydrogen; Elsevier: Amsterdam, The Netherlands, 2019. [Google Scholar]
- Lo Basso, G.; Pastore, L.M.; Mojtahed, A.; De Santoli, L. From Landfill to Hydrogen: Techno-Economic Analysis of Hybridized Hydrogen Production Systems Integrating Biogas Reforming and Power-to-Gas Technologies. Int. J. Hydrogen Energy 2023, 48, 37607–37624. [Google Scholar] [CrossRef]
- Maniscalco, M.P.; Longo, S.; Cellura, M.; Miccichè, G.; Ferraro, M. Critical Review of Life Cycle Assessment of Hydrogen Production Pathways. Environments 2024, 11, 108. [Google Scholar] [CrossRef]
- Busch, P.; Kendall, A.; Lipman, T. A Systematic Review of Life Cycle Greenhouse Gas Intensity Values for Hydrogen Production Pathways. Renew. Sustain. Energy Rev. 2023, 184, 113588. [Google Scholar] [CrossRef]
- Midilli, A.; Kucuk, H.; Topal, M.E.; Akbulut, U.; Dincer, I. A Comprehensive Review on Hydrogen Production from Coal Gasification: Challenges and Opportunities. Int. J. Hydrogen Energy 2021, 46, 25385–25412. [Google Scholar] [CrossRef]
- Chi, J.; Yu, H. Water Electrolysis Based on Renewable Energy for Hydrogen Production. Chin. J. Catal. 2018, 39, 390–394. [Google Scholar] [CrossRef]
- Simons, A.; Bauer, C. Life Cycle Assessment of Hydrogen Production the Swiss Competence Center for Heat and Electricity Storage View Project. In Transition to Hydrogen; Cambridge University Press: New York, NY, USA, 2011. [Google Scholar] [CrossRef]
- Chang, S.H.; Rajuli, M.F. An Overview of Pure Hydrogen Production via Electrolysis and Hydrolysis. Int. J. Hydrogen Energy 2024, 84. [Google Scholar] [CrossRef]
- Zhang, J.; Ling, B.; He, Y.; Zhu, Y.; Wang, Z. Life Cycle Assessment of Three Types of Hydrogen Production Methods Using Solar Energy. Int. J. Hydrogen Energy 2022, 47, 14158–14168. [Google Scholar] [CrossRef]
- Nicita, A.; Maggio, G.; Andaloro, A.P.F.; Squadrito, G. Green Hydrogen as Feedstock: Financial Analysis of a Photovoltaic-Powered Electrolysis Plant. Int. J. Hydrogen Energy 2020, 45, 11395–11408. [Google Scholar] [CrossRef]
- Terlouw, T.; Bauer, C.; McKenna, R.; Mazzotti, M. Large-Scale Hydrogen Production via Water Electrolysis: A Techno-Economic and Environmental Assessment. Energy Environ. Sci. 2022, 15, 3583–3602. [Google Scholar] [CrossRef]
- Von Der Assen, N.; Jung, J.; Bardow, A. Life-Cycle Assessment of Carbon Dioxide Capture and Utilization: Avoiding the Pitfalls. Energy Environ. Sci. 2013, 6, 2721–2734. [Google Scholar] [CrossRef]
- Godskesen, B.; Meron, N.; Rygaard, M. LCA of Drinking Water Supply. In Life Cycle Assessment; Springer International Publishing: Cham, Switzerland, 2018; pp. 835–860. ISBN 978-3-319-56475-3. [Google Scholar]
- ISO 14040; Environmental Management—Life Cycle Assessment—Principles and Framework. ISO: Geneva, Switzerland, 2006. Available online: https://www.iso.org/standard/37456.html (accessed on 24 April 2025).
- Valente, A.; Iribarren, D.; Candelaresi, D.; Spazzafumo, G.; Dufour, J. Using Harmonised Life-Cycle Indicators to Explore the Role of Hydrogen in the Environmental Performance of Fuel Cell Electric Vehicles. Int. J. Hydrogen Energy 2020, 45, 25758–25765. [Google Scholar] [CrossRef]
- Hoekstra, A.Y.; Chapagain, A.K.; Aldaya, M.M.; Mekonnen, M.M. The Water Footprint Assessment Manual, 1st ed.; Routledge: Oxfordshire, UK, 2012; ISBN 978-1-136-53852-0. [Google Scholar]
- Boulay, A.-M.; Bare, J.; Benini, L.; Berger, M.; Lathuillière, M.J.; Manzardo, A.; Margni, M.; Motoshita, M.; Núñez, M.; Pastor, A.V.; et al. The WULCA Consensus Characterization Model for Water Scarcity Footprints: Assessing Impacts of Water Consumption Based on Available Water Remaining (AWARE). Int J Life Cycle Assess 2018, 23, 368–378. [Google Scholar] [CrossRef]
- García-Herrero, L.; Gibin, D.; Damiani, M.; Sanyé-Mengual, E.; Sala, S. What Is the Water Footprint of EU Food Consumption? A Comparison of Water Footprint Assessment Methods. J. Clean. Prod. 2023, 415, 137807. [Google Scholar] [CrossRef]
- Boulay, A.-M.; Lenoir, L. Sub-National Regionalisation of the AWARE Indicator for Water Scarcity Footprint Calculations. Ecol. Indic. 2020, 111, 106017. [Google Scholar] [CrossRef]
- Ansorge, L.; Beránková, T. LCA Water Footprint Aware Characterization Factor Based on Local Specific Conditions. Eur. J. Sustain. Dev. 2017, 6, 13–20. [Google Scholar] [CrossRef]
- Burkhardt, J.; Patyk, A.; Tanguy, P.; Retzke, C. Hydrogen Mobility from Wind Energy—A Life Cycle Assessment Focusing on the Fuel Supply. Appl. Energy 2016, 181, 54–64. [Google Scholar] [CrossRef]
- Huijbregts, M.A.J.; Hellweg, S.; Frischknecht, R.; Hendriks, H.W.M.; Hungerbühler, K.; Hendriks, A.J. Cumulative Energy Demand As Predictor for the Environmental Burden of Commodity Production. Environ. Sci. Technol. 2010, 44, 2189–2196. [Google Scholar] [CrossRef]
- Dufour, J.; Serrano, D.P.; Gálvez, J.L.; González, A.; Soria, E.; Fierro, J.L.G. Life Cycle Assessment of Alternatives for Hydrogen Production from Renewable and Fossil Sources. Int. J. Hydrogen Energy 2012, 37, 1173–1183. [Google Scholar] [CrossRef]
- Murphy, D.J.; Raugei, M.; Carbajales-Dale, M.; Rubio Estrada, B. Energy Return on Investment of Major Energy Carriers: Review and Harmonization. Sustainability 2022, 14, 7098. [Google Scholar] [CrossRef]
- Aba, M.M.; Sauer, I.L.; Amado, N.B. Comparative Review of Hydrogen and Electricity as Energy Carriers for the Energy Transition. Int. J. Hydrogen Energy 2024, 57, 660–678. [Google Scholar] [CrossRef]
- Zhang, X.; Schwarze, M.; Schomäcker, R.; Van De Krol, R.; Abdi, F.F. Life Cycle Net Energy Assessment of Sustainable H2 Production and Hydrogenation of Chemicals in a Coupled Photoelectrochemical Device. Nat. Commun. 2023, 14, 991. [Google Scholar] [CrossRef]
- Raboni, M.; Viotti, P.; Capodaglio, A.G. A Comprehensive Analysis of the Current and Future Role of Biofuels for Transport in the European Union (EU). Rev. Ambiente Água 2015, 10, 9–21. [Google Scholar] [CrossRef]
- Henriksen, M.S.; Matthews, H.S.; White, J.; Walsh, L.; Grol, E.; Jamieson, M.; Skone, T.J. Tradeoffs in Life Cycle Water Use and Greenhouse Gas Emissions of Hydrogen Production Pathways. Int. J. Hydrogen Energy 2023, S0360319923040363. [Google Scholar] [CrossRef]
- Liu, H.; Liu, S. Life Cycle Energy Consumption and GHG Emissions of Hydrogen Production from Underground Coal Gasification in Comparison with Surface Coal Gasification. Int. J. Hydrogen Energy 2021, 46, 9630–9643. [Google Scholar] [CrossRef]
- Battista, F.; Montenegro Camacho, Y.S.; Hernández, S.; Bensaid, S.; Herrmann, A.; Krause, H.; Trimis, D.; Fino, D. LCA Evaluation for the Hydrogen Production from Biogas through the Innovative BioRobur Project Concept. Int. J. Hydrogen Energy 2017, 42, 14030–14043. [Google Scholar] [CrossRef]
- Hajjaji, N.; Pons, M.N.; Renaudin, V.; Houas, A. Comparative Life Cycle Assessment of Eight Alternatives for Hydrogen Production from Renewable and Fossil Feedstock. J. Clean. Prod. 2013, 44, 177–189. [Google Scholar] [CrossRef]
- Sadeghi, S.; Ghandehariun, S.; Rosen, M.A. Comparative Economic and Life Cycle Assessment of Solar-Based Hydrogen Production for Oil and Gas Industries. Energy 2020, 208, 118347. [Google Scholar] [CrossRef]
- Patel, G.H.; Havukainen, J.; Horttanainen, M.; Soukka, R.; Tuomaala, M. Climate Change Performance of Hydrogen Production Based on Life Cycle Assessment. Green Chem. 2024, 26, 992–1006. [Google Scholar] [CrossRef]
- Sanchez, A.; Ayala, O.R.; Hernandez-Sanchez, P.; Valdez-Vazquez, I.; De León-Rodríguez, A. An Environment-Economic Analysis of Hydrogen Production Using Advanced Biorefineries and Its Comparison with Conventional Technologies. Int. J. Hydrogen Energy 2020, 45, 27994–28006. [Google Scholar] [CrossRef]
- Khila, Z.; Baccar, I.; Jemel, I.; Houas, A.; Hajjaji, N. Energetic, Exergetic and Environmental Life Cycle Assessment Analyses as Tools for Optimization of Hydrogen Production by Autothermal Reforming of Bioethanol. Int. J. Hydrogen Energy 2016, 41, 17723–17739. [Google Scholar] [CrossRef]
- Siddiqui, O.; Dincer, I. A Well to Pump Life Cycle Environmental Impact Assessment of Some Hydrogen Production Routes. Int. J. Hydrogen Energy 2019, 44, 5773–5786. [Google Scholar] [CrossRef]
- Yoo, E.; Kim, M.; Song, H.H. Well-to-Wheel Analysis of Hydrogen Fuel-Cell Electric Vehicle in Korea. Int. J. Hydrogen Energy 2018, 43, 19267–19278. [Google Scholar] [CrossRef]
- Antonini, C.; Treyer, K.; Streb, A.; van der Spek, M.; Bauer, C.; Mazzotti, M. Hydrogen Production from Natural Gas and Biomethane with Carbon Capture and Storage—A Techno-Environmental Analysis. Sustain. Energy Fuels 2020, 4, 2967–2986. [Google Scholar] [CrossRef]
- Martínez-Ramón, N.; Romay, M.; Iribarren, D.; Dufour, J. Life-Cycle Assessment of Hydrogen Produced through Chemical Looping Dry Reforming of Biogas. Int. J. Hydrogen Energy 2024, 78, 373–381. [Google Scholar] [CrossRef]
- Mio, A.; Barbera, E.; Massi Pavan, A.; Bertucco, A.; Fermeglia, M. Sustainability Analysis of Hydrogen Production Processes. Int. J. Hydrogen Energy 2024, 54, 540–553. [Google Scholar] [CrossRef]
- WEF. Will a Transition to a Hydrogen Economy Affect Water Security? The World Economic Forum: Davos-Klosters, Switzerland, 2022. [Google Scholar]
- Deo, M.; Setoyama, E.; Sieving, J. Hydrogen Electricty Generation and Water Consumption 2022. In Generation and Water Consumption; Hydrogen Europe: Brussels, Belgium, 2022. [Google Scholar]
- De Souza, T.A.Z.; Rocha, D.H.D.; Julio, A.A.V.; Coronado, C.J.R.; Silveira, J.L.; Silva, R.J.; Palacio, J.C.E. Exergoenvironmental Assessment of Hydrogen Water Footprint via Steam Reforming in Brazil. J. Clean. Prod. 2021, 311, 127577. [Google Scholar] [CrossRef]
- Tonelli, D.; Rosa, L.; Gabrielli, P.; Caldeira, K.; Parente, A.; Contino, F. Global Land and Water Limitsto Electrolytic Hydrogen Production Using Wind and Solar Resources. Res. Sq. 2023, preprint. [Google Scholar] [CrossRef]
- Tripathi, A.K.; Subramanian, K.A. Comparative Life Cycle Energy and GHG Emissions Assessment of Green Hydrogen Production with Different Electrolysers and Solar Photovoltaics System. In Proceedings of the 2022 IEEE North Karnataka Subsection Flagship International Conference (NKCon), Vijaypur, India, 20–21 November 2022; pp. 1–9. [Google Scholar] [CrossRef]
- Cvetković, S.M.; Radoičić, T.K.; Kijevčanin, M.; Novaković, J.G. Life Cycle Energy Assessment of Biohydrogen Production via Biogas Steam Reforming: Case Study of Biogas Plant on a Farm in Serbia. Int. J. Hydrogen Energy 2021, 46, 14130–14137. [Google Scholar] [CrossRef]
- Liu, H.; Guo, W.; Fan, Z.; Huang, F.; Liu, S. Comparative Life Cycle Energy, Water Consumption and Carbon Emissions Analysis of Deep in-Situ Gasification Based Coal-to-Hydrogen with Carbon Capture and Alternative Routes. J. Clean. Prod. 2023, 426, 139129. [Google Scholar] [CrossRef]
- de Castro, N.; Braga, S.L.; Pradelle, F.; Chaves, A.C.; Chantre, C. A Economia do Hidrogênio: Transição, Descarbonização e Oportunidades para o Brasil; T&B Petroleum/Press Office: Rio de Janeiro, Brazil, 2023. [Google Scholar]
- Capaz, R.S.; Posada, J.A.; Osseweijer, P.; Seabra, J.E.A. The Carbon Footprint of Alternative Jet Fuels Produced in Brazil: Exploring Different Approaches. Resour. Conserv. Recycl. 2021, 166, 105260. [Google Scholar] [CrossRef]
- Newborough, M.; Cooley, G. Green Hydrogen: Water Use Implications and Opportunities. Fuel Cells Bull. 2021, 2021, 12–15. [Google Scholar] [CrossRef]
- Suleman, F.; Dincer, I.; Agelin-Chaab, M. Comparative Impact Assessment Study of Various Hydrogen Production Methods in Terms of Emissions. Int. J. Hydrogen Energy 2016, 41, 8364–8375. [Google Scholar] [CrossRef]
- Hacatoglu, K.; Rosen, M.A.; Dincer, I. Comparative Life Cycle Assessment of Hydrogen and Other Selected Fuels. Int. J. Hydrogen Energy 2012, 37, 9933–9940. [Google Scholar] [CrossRef]
- Dong, J.; Liu, X.; Xu, X.; Zhang, S. Comparative Life Cycle Assessment of Hydrogen Pathways from Fossil Sources in China: LCA Analysis of Hydrogen Pathways from Fossil Sources in China. Int. J. Energy Res. 2016, 40, 2105–2116. [Google Scholar] [CrossRef]
- Arfan, M.; Eriksson, O.; Wang, Z.; Soam, S. Life Cycle Assessment and Life Cycle Costing of Hydrogen Production from Biowaste and Biomass in Sweden. Energy Convers. Manag. 2023, 291, 117262. [Google Scholar] [CrossRef]
- Santana, J.C.C.; Machado, P.G.; Nascimento, C.A.O.D.; Ribeiro, C.D.O. Economic and Environmental Assessment of Hydrogen Production from Brazilian Energy Grid. Energies 2023, 16, 3769. [Google Scholar] [CrossRef]
- Ghandehariun, S.; Kumar, A. Life Cycle Assessment of Wind-Based Hydrogen Production in Western Canada. Int. J. Hydrogen Energy 2016, 41, 9696–9704. [Google Scholar] [CrossRef]
- Lampert, D.; Cai, H.; Wang, Z.; Wu, M.; Han, J.; Dunn, J.; Sullivan, J.; Elgowainy, A.; Wang, M. Development of a LCI of Water Consumption Associated with the Production of Transportation Fuels; United States Department of Energy: Washington, DC, USA, 2015. [Google Scholar]
Disclaimer/Publisher’s Note: The statements, opinions and data contained in all publications are solely those of the individual author(s) and contributor(s) and not of MDPI and/or the editor(s). MDPI and/or the editor(s) disclaim responsibility for any injury to people or property resulting from any ideas, methods, instructions or products referred to in the content. |
© 2025 by the authors. Licensee MDPI, Basel, Switzerland. This article is an open access article distributed under the terms and conditions of the Creative Commons Attribution (CC BY) license (https://creativecommons.org/licenses/by/4.0/).