


Mitigating Hydrogen Risks in Light-Water Nuclear Reactors: A CFD Simulation of the Distribution and Concentration


Abstract
:1. Introduction
2. Materials and Methods
2.1. Grids and Parameters for Calculations
Containment Model and Grid Systems
2.2. Numerical Modeling and Governing Equations
2.2.1. Turbulence Models
2.2.2. Standard k − ϵ Turbulence Model (LES)
2.2.3. RANS k − ϵ Model
2.2.4. Governing Equations
2.2.5. Energy Equation
2.2.6. Dome Temperature and Pressure Monitoring
3. Results
3.1. Numerical Results
3.2. Gas Behavior and Hydrogen Explosion Risk
3.3. Detailed Comparison of the Results
4. Conclusions
Author Contributions
Funding
Data Availability Statement
Acknowledgments
Conflicts of Interest
Abbreviations
| NPP | Nuclear Power Plant |
| PWR | Pressurized Water Reactor |
| TMI-2 | Three Mile Island 2 |
| SA | Severe Accident |
| LOCA | Loss of Coolant Accident |
| CFDs | Computational Fluid Dynamics |
| MCCI | Molten Core–Concrete Interaction |
| SARNET2 | Severe Accident Research Network of Excellence 2 |
| IRSN | Institute for Radiological Protection and Nuclear Safety |
| RCS | Reactor Coolant System |
| WWER | Water–Water Energetic Reactor |
| BWR | Boiling Water Reactor |
| MAAP4 | Modular Accident Analysis Program |
| RBMK | Reactor Bolshoy Moshchnosty Kanalny |
References
- Micaelli, J.-C.; Haste, T.; Van Dorsselaere, J.-P.; Bonnet, J.-M.; Meyer, L.; Beraha, D.; Annunziato, A.; Chaumont, B.; Adroguer, B.; Sehgal, R.; et al. SARNET: A European Cooperative Effort on LWR Severe Accident Research. Rev. Générale Nucléaire 2006, 1, 128–135. [Google Scholar] [CrossRef]
- Al-Khawaja, A.; Park, H. Numerical study of natural circulation flow in reactor coolant system during a severe accident. Ann. Nucl. Energy 2014, 67, 290–297. [Google Scholar]
- Qin, H.; Fang, Y.; Wang, C.; Tian, W.; Qiu, S.; Su, G.; Deng, J. Numerical investigation on heat transfer characteristics of helium-xenon gas mixture. Int. J. Energy Res. 2021, 45, 11745–11758. [Google Scholar] [CrossRef]
- Benhamadouche, S. On the use of (U)RANS and LES approaches for turbulent incompressible single phase flows in nuclear engineering applications. Nucl. Eng. Des. 2017, 312, 2–11. [Google Scholar] [CrossRef]
- Xiong, J.; Yang, Y.; Cheng, X. CFD application to hydrogen risk analysis and PAR qualification. Sci. Technol. Nucl. Install. 2009, 2009, 213981. [Google Scholar] [CrossRef]
- Zhou, G.; Yi, X.Y. Development of nuclear power simulation technologies. Yuanzineng Kexue Jishu/Atomic Energy Sci. Technol. 2006, 40, 23. [Google Scholar]
- Reinecke, E.A.; Takenaka, K.; Ono, H.; Kita, T.; Taniguchi, M.; Nishihata, Y.; Hino, R.; Tanaka, H. Performance tests of catalysts for the safe conversion of hydrogen inside the nuclear waste containers in Fukushima Daiichi. Int. J. Hydrogen Energy 2021, 46, 12511–12521. [Google Scholar] [CrossRef]
- Raman, R.K.; Iyer, K.N.; Ravva, S.R. CFD studies of hydrogen mitigation by recombiner using correlations of reaction rates obtained from detailed mechanism. Nucl. Eng. Des. 2020, 360, 110528. [Google Scholar] [CrossRef]
- Yung, T.Y.; Lu, W.F.; Tsai, K.C.; Chuang, C.H.; Chen, P.T. Oxidation Behavior Characterization of Zircaloy-4 Cladding with Different Hydrogen Concentrations at 500–800 °C in an Ambient Atmosphere. Materials 2022, 15, 2997. [Google Scholar] [CrossRef]
- Serrano, C.; Jimenez, G.; Molina, M.d.C.; López-Alonso, E.; Justo, D.; Zuriaga, J.V.; González, M. Proposed methodology for Passive Autocatalytic Recombiner sizing and location for a BWR Mark-III reactor containment building. Ann. Nucl. Energy 2016, 94, 589–602. [Google Scholar] [CrossRef]
- Heitsch, M.; Huhtanen, R.; Téchy, Z.; Fry, C.; Kostka, P.; Niemi, J.; Schramm, B. CFD evaluation of hydrogen risk mitigation measures in a VVER-440/213 containment. Nucl. Eng. Des. 2010, 240, 385–396. [Google Scholar] [CrossRef]
- Matsuda, K.; Tanaka, N.; Majima, H. Dissolution Behavior of Hrdrogen Gas In Aqueous Solutions Containing Strong Electrolytes-2. Studies on The Gaseous Reduction of Metals From Aqueous Solutions. J Min Metall Inst Jpn. 1978, 94, 1079. [Google Scholar]
- Wang, F.; Zhao, M.; Zou, Z.; Deng, J.; Zhang, H.; Zhang, M.; Qin, H. Code Validation and Application of Hy-drogen Mitigation by Passive Autocatalytic Recombiner in Small Modular Reactor. Nuclear Engineering and Design 2022, 396, 111882. [Google Scholar] [CrossRef]
- Hoyes, J.R.; Ivings, M.J. CFD modelling of hydrogen stratification in enclosures: Model validation and application to PAR performance. Nucl. Eng. Des. 2016, 310, 142–153. [Google Scholar] [CrossRef]
- Kelm, S.; Kampili, M.; Liu, X.; George, A.; Schumacher, D.; Druska, C.; Struth, S.; Kuhr, A.; Ramacher, L.; Allelein, H.J.; et al. The tailored CFD package ‘containmentFOAM’ for analysis of containment atmosphere mixing, H2/CO mitigation and aerosol transport. Fluids 2021, 6, 100. [Google Scholar] [CrossRef]
- Chang, H.J.; Zhao, R.C.; Du, W.F.; Sun, L.L.; Zhou, S.; Wang, Y.Z. Passive contaiment cooling system thermal-hydraulic test reserch for Chinese large passive nuclear power plant development. In Proceedings of the 17th International Topical Meeting on Nuclear Reactor Thermal Hydraulics, NURETH 2017, Xi’an, China, 3–8 September 2017; Volume 2017. [Google Scholar]
- Liu, F.; Sun, Z.; Ding, M.; Bian, H. Research progress of hydrogen behaviors in nuclear power plant containment under severe accident conditions. Int. J. Hydrogen Energy 2021, 46, 36477–36502. [Google Scholar] [CrossRef]
- Ding, P.; Chen, M.; Li, W.; Liu, Y.; Wang, B. CFD simulations in the nuclear containment using the des turbulence models. Nucl. Eng. Des. 2015, 287, 1–10. [Google Scholar] [CrossRef]
- Xiao, J.; Breitung, W.; Kuznetsov, M.; Zhang, H.; Travis, J.R.; Redlinger, R.; Jordan, T. GASFLOW-MPI: A new 3-D parallel all-speed CFD code for turbulent dispersion and combustion simulations: Part I: Models, verification and validation. Int. J. Hydrogen Energy 2017, 42, 8346–8368. [Google Scholar] [CrossRef]
- Chen, Y.H.; Li, T.; Xue, D.L. Research and application of nuclear power plant in-service inspection information management platform. E3S Web Conf. 2021, 257, 01056. [Google Scholar] [CrossRef]
- Jin, S.; Li, X.B.; Gong, J.X. Probabilistic performance evaluation of nuclear containment structure subjected to severe accidents. Gongcheng Lixue/Engineering Mech. 2021, 38, 103–112. [Google Scholar] [CrossRef]
- Gardner, L.; Liang, Z.; Clouthier, T.; MacCoy, R. A large-scale study on the effect of ambient conditions on hydrogen recombiner-induced ignition. Int. J. Hydrogen Energy 2021, 46, 12594–12604. [Google Scholar] [CrossRef]
- Orszulik, M.; Fic, A.; Bury, T. CFD Modeling of Passive Autocatalytic Recombiners. Nukleonika 2015, 60, 347–353. [Google Scholar] [CrossRef]
- Riera, J.E.; Martínez-Val, A.; Muñoz-Cobo, M.A.; Gallego-Marcos, J.M.M.-A. Hydrogen transport in containment buildings during severe accidents: A lumped-parameter model. Nucl. Eng. Des. 2014, 1–10. [Google Scholar]
- Hristov, H.V.; Preuß, J.; Buchholz, S.; Schaffrath, A. Validation work for the containment cooling condenser with the system code Athlet within the frame of the German Easy Project. In Proceedings of the 17th International Topical Meeting on Nuclear Reactor Thermal Hydraulics, NURETH 2017, Xi’an, China, 3–8 September 2017; Volume 2017. [Google Scholar]


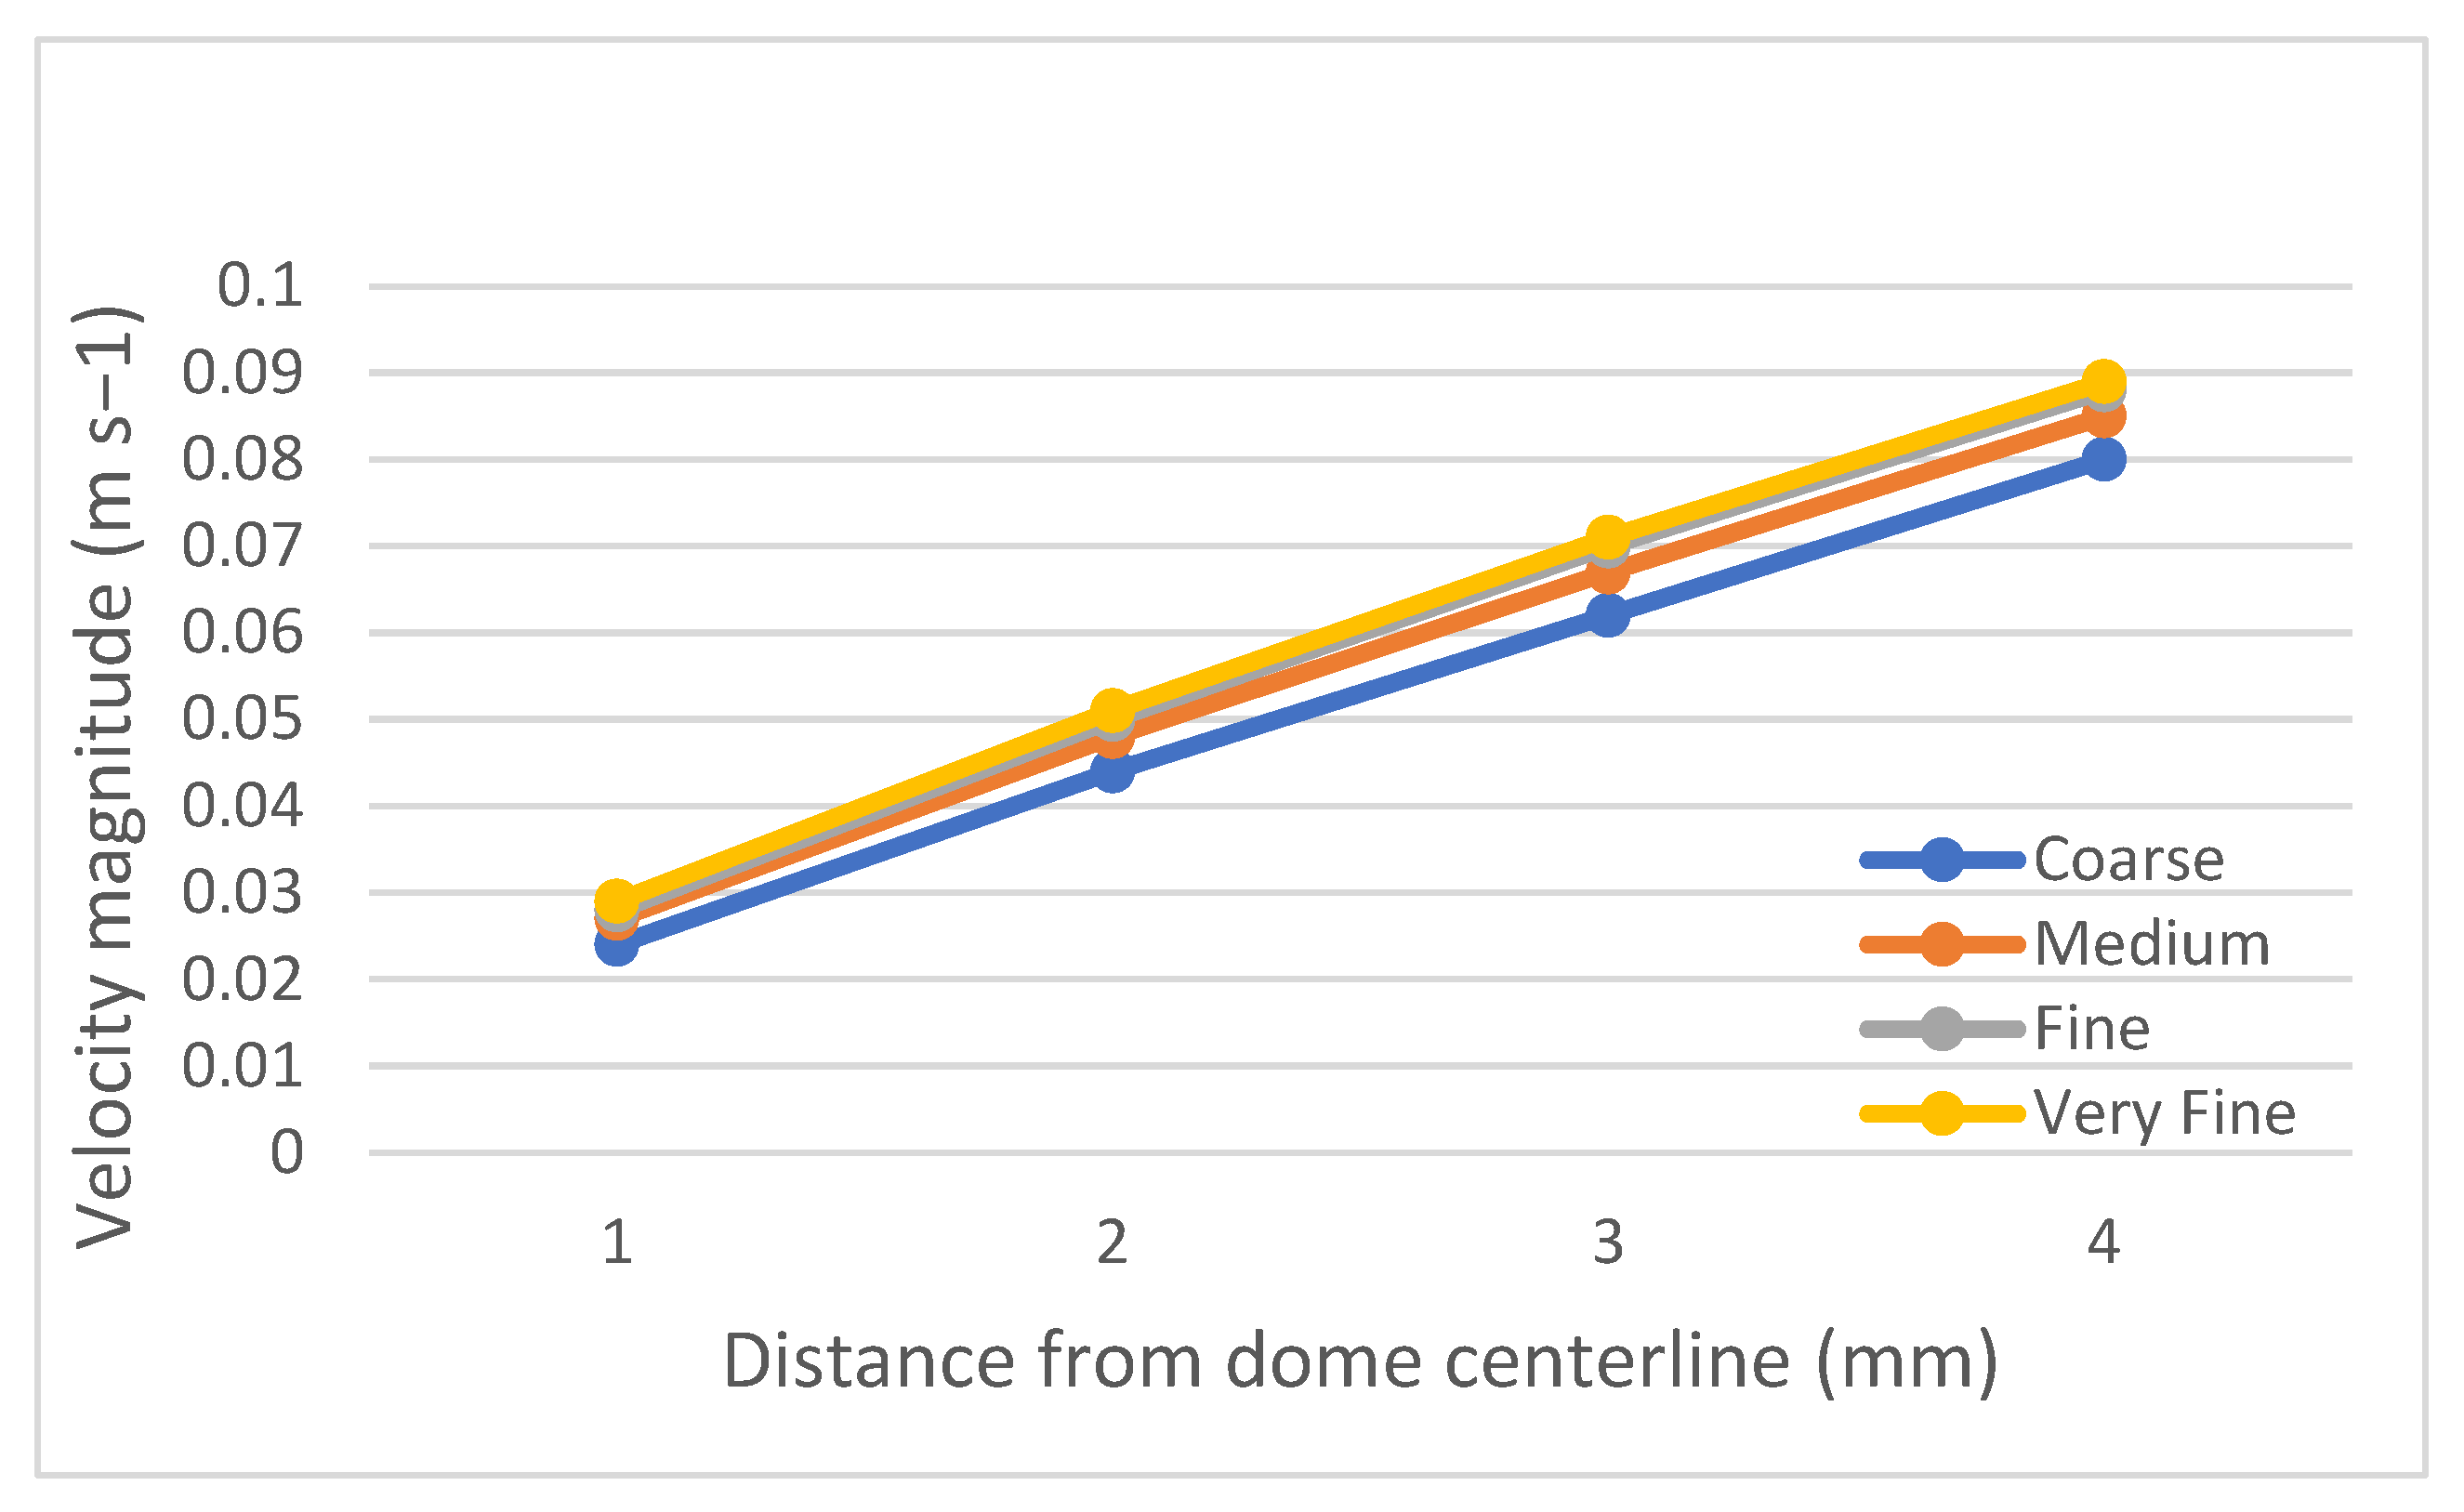
| Mesh Level | Number of Cells | Velocity at r = 0.02 m (m/s) | Velocity at r = 0.04 m (m/s) | Velocity at r = 0.06 m (m/s) | Velocity at r = 0.08 m (m/s) |
|---|---|---|---|---|---|
| Coarse | 961,437 | 0.024 | 0.044 | 0.062 | 0.08 |
| Medium | 100,000 | 0.027 | 0.048 | 0.067 | 0.085 |
| Fine | 1,400,000 | 0.028 | 0.05 | 0.07 | 0.088 |
| Very Fine | 1,600,000 | 0.029 | 0.051 | 0.071 | 0.089 |
| Ambient Initial Pressure (bar) | Delta Pressure (bar) | Final Pressure (bar) | Mass (kg) | Initial Volume (m3) | Compressed Volume (m3) | Hydrogen | |
|---|---|---|---|---|---|---|---|
| With Recombiner | 101,325 | 10,911 | 112,236 | 89.19 | 49,162 | 44,382.73 | 9.72% |
| Without Recombiner | 101,325 | 22,017 | 123,342 | 278.66 | 49,162 | 40,386.40 | 17.85% |
Disclaimer/Publisher’s Note: The statements, opinions and data contained in all publications are solely those of the individual author(s) and contributor(s) and not of MDPI and/or the editor(s). MDPI and/or the editor(s) disclaim responsibility for any injury to people or property resulting from any ideas, methods, instructions or products referred to in the content. |
© 2023 by the authors. Licensee MDPI, Basel, Switzerland. This article is an open access article distributed under the terms and conditions of the Creative Commons Attribution (CC BY) license (https://creativecommons.org/licenses/by/4.0/).
Share and Cite
Amponsah, J.; Archibong-Eso, A. Mitigating Hydrogen Risks in Light-Water Nuclear Reactors: A CFD Simulation of the Distribution and Concentration. Hydrogen 2023, 4, 709-725. https://doi.org/10.3390/hydrogen4040045
Amponsah J, Archibong-Eso A. Mitigating Hydrogen Risks in Light-Water Nuclear Reactors: A CFD Simulation of the Distribution and Concentration. Hydrogen. 2023; 4(4):709-725. https://doi.org/10.3390/hydrogen4040045
Chicago/Turabian StyleAmponsah, Joseph, and Archibong Archibong-Eso. 2023. "Mitigating Hydrogen Risks in Light-Water Nuclear Reactors: A CFD Simulation of the Distribution and Concentration" Hydrogen 4, no. 4: 709-725. https://doi.org/10.3390/hydrogen4040045
APA StyleAmponsah, J., & Archibong-Eso, A. (2023). Mitigating Hydrogen Risks in Light-Water Nuclear Reactors: A CFD Simulation of the Distribution and Concentration. Hydrogen, 4(4), 709-725. https://doi.org/10.3390/hydrogen4040045