Article

Experimental and Simulation Study on Coproduction of Hydrogen and Carbon Nanomaterials by Catalytic Decomposition of Methane-Hydrogen Mixtures

by
Ekaterina V. Shelepova
,
Tatyana A. Maksimova
,
Yury I. Bauman
,
Ilya V. Mishakov
and
Aleksey A. Vedyagin
*
Boreskov Institute of Catalysis, pr. Ac. Lavrentieva 5, 630090 Novosibirsk, Russia
*
Author to whom correspondence should be addressed.
Hydrogen 2022, 3(4), 450-462; https://doi.org/10.3390/hydrogen3040028
Submission received: 17 October 2022 / Revised: 7 November 2022 / Accepted: 9 November 2022 / Published: 12 November 2022

Abstract

:
Among all hydrocarbons, the methane molecule contains the highest amount of hydrogen with respect to carbon. Therefore, the catalytic decomposition of methane is considered as an efficient approach to produce hydrogen along with nanostructured carbon product. On the other hand, the presence of hydrogen in the composition of the initial gas mixture is required for the stable operation of the catalyst. In present work, the experiments on the catalytic decomposition of methane–hydrogen mixture were performed in a flow-through quartz reactor equipped with McBain balances under atmospheric pressure. The catalyst NiO-CuO/Al2O3 was prepared by the mechanochemical activation technique. The maximum carbon yield of 34.9 g/gcat was obtained after 2 h of experiment at 610 °C. An excess of hydrogen in the reaction mixture provided the long-term activity of the nickel–copper catalyst. The durability tests ongoing for 6 h within a temperature range of 525–600 °C showed no noticeable deactivation of the catalyst. Two kinetic models, D1a and M1a, were proposed for the studied decomposition of the methane–hydrogen mixture over the nickel–copper catalyst. The kinetic constants for these models were determined by means of mathematical modelling.

1. Introduction

In recent decades, global hydrogen production rises up continuously due to its growing demand which comes from various uses such as refining, chemicals, iron and steel, transport, and electricity generation [1]. Hydrogen technologies are considered to be key components to industry and transport decarbonization [2,3,4]. At the same time, the existing hydrogen production technologies are associated with a number of hardship and disadvantages. Thus, one of the most widely used approaches is steam reforming of natural gas [5,6,7]. In general, this process is characterized by a relatively low hydrogen yield and a poor quality of the produced hydrogen, which requires an additional treatment and purification from sulfurous gas and CO2. The thermal pyrolysis of methane is an alternative approach to producing hydrogen without the CO2 formation. On the other hand, being realized without a catalyst, this process requires high temperatures (800–900 °C), which makes it energy-intensive. Another issue complicating the worldwide adoption of the methane pyrolysis for the hydrogen production in industry is the undefined application area of the amorphous (non-structured) carbon, which appears as a by-side product.
Contrary, in case of the catalytic pyrolysis of methane, the yield of the target product increases significantly due to the use of various catalysts. The temperature of the process can be noticeably lowered as well. For instance, the use of metallic or carbon-based catalysts allows decreasing the reaction temperature down to 600 °C and even below [8,9]. Thereby, it is not surprising that many research papers are devoted to the search for the optimal composition of the catalysts and for the appropriate process conditions to decompose methane [10,11,12]. As is known, such metals as iron, cobalt, and nickel possess activity in catalytic chemical vapor deposition of hydrocarbons with the formation of nanostructured carbon. Therefore, the catalysts based on these metals are applied for the catalytic pyrolysis of methane as well [13,14]. The Ni-containing systems are effective already at temperatures about 550 °C [15], while the Fe-based catalysts begin to work at noticeably higher temperatures [16]. The introduction of a small amount of copper into the composition of Ni-containing catalysts improves their activity, stability and durability [17,18]. The dispersion of the metallic particles is another important issue defining their catalytic performance. Thus, Shen and Lua have reported that hydrogen can be efficiently produced from methane over the dispersed Ni and Ni-Cu particles supported on carbon nanotubes (CNT) [19]. The productivity of such catalysts depends on the exact catalyst’s composition and the reaction temperature. It was found that the Ni78Cu22/CNT sample exhibits the stable methane conversion at a level of 80% at 700 °C.
It is important to note that besides hydrogen, the second product of the catalytic pyrolysis of methane over the mentioned metals is nanostructured carbon of given morphology and structure [20,21]. Such carbon is considered as a valuable product, which is attractive for the improvement of physicochemical characteristics of various composite materials, including composites based on cement stone, concrete, different kinds of polymers, lubricants, etc. [22,23,24,25,26]. Therefore, the carbon nanomaterials, including carbon nanofibers (CNF), produced via the catalytic pyrolysis of hydrocarbon sources are highly demanded for their application in material sciences.
As is known, the mathematical modelling is a useful technique which allows shortening of the time required to study different chemical processes. Recently, we have reported the simulation results on hydrogen production via dehydrogenation of alkanes in a catalytic membrane reactor [27,28]. For the process of decomposition of methane-containing mixtures, there is a lack of reported results. Thus, just a few papers devoted to mathematical modelling of the isothermal reactor with both the fixed-bed and moving-bed catalysts were published by Zavarukhin and Kuvshinov [29,30]. Thereby, the study of the process of catalytic pyrolysis of methane-containing mixtures involving the use of mathematical modeling methods is an actual and important task for the development of catalytic technologies for the production of hydrogen and nanostructured carbon.
In order to model any process in the chemical reactor correctly, a reliable kinetic model is required first. In a number of published papers, the process of catalytic methane decomposition is studied, aiming to determine the stage reaction mechanism [31] or to obtain the kinetic model of the process [32,33]. The kinetic models for the decomposition of methane or methane–hydrogen mixtures are reported in the literature for various Ni-based catalysts [33,34,35,36,37]. These models differ in the detailed mechanisms of the reaction as well as in the choice of the limiting stage. For instance, Borghei et al. [33] proposed different kinetic models based on the mechanisms of the dissociative (D1a) and molecular (M1a) adsorption of methane.
Therefore, this work is devoted to mathematical modeling of the process of catalytic decomposition of methane–hydrogen mixture and is mainly aimed at choosing from existing kinetic models the ones that will most adequately describe experimental data. The efficiency of the nickel–copper catalyst in the process was investigated in a real-time mode using the reactor with McBain balances. Both kinetic models, D1a and M1a, were applied to simulate the process, and the kinetic constants were determined by comparing the calculated and experimental data for the first time. In the future, after verification of this mathematical model, including the obtained kinetic constants, the optimal conditions of the process will be determined, which will make it possible to scale up this process using the mathematical modeling approach.

2. Materials and Methods

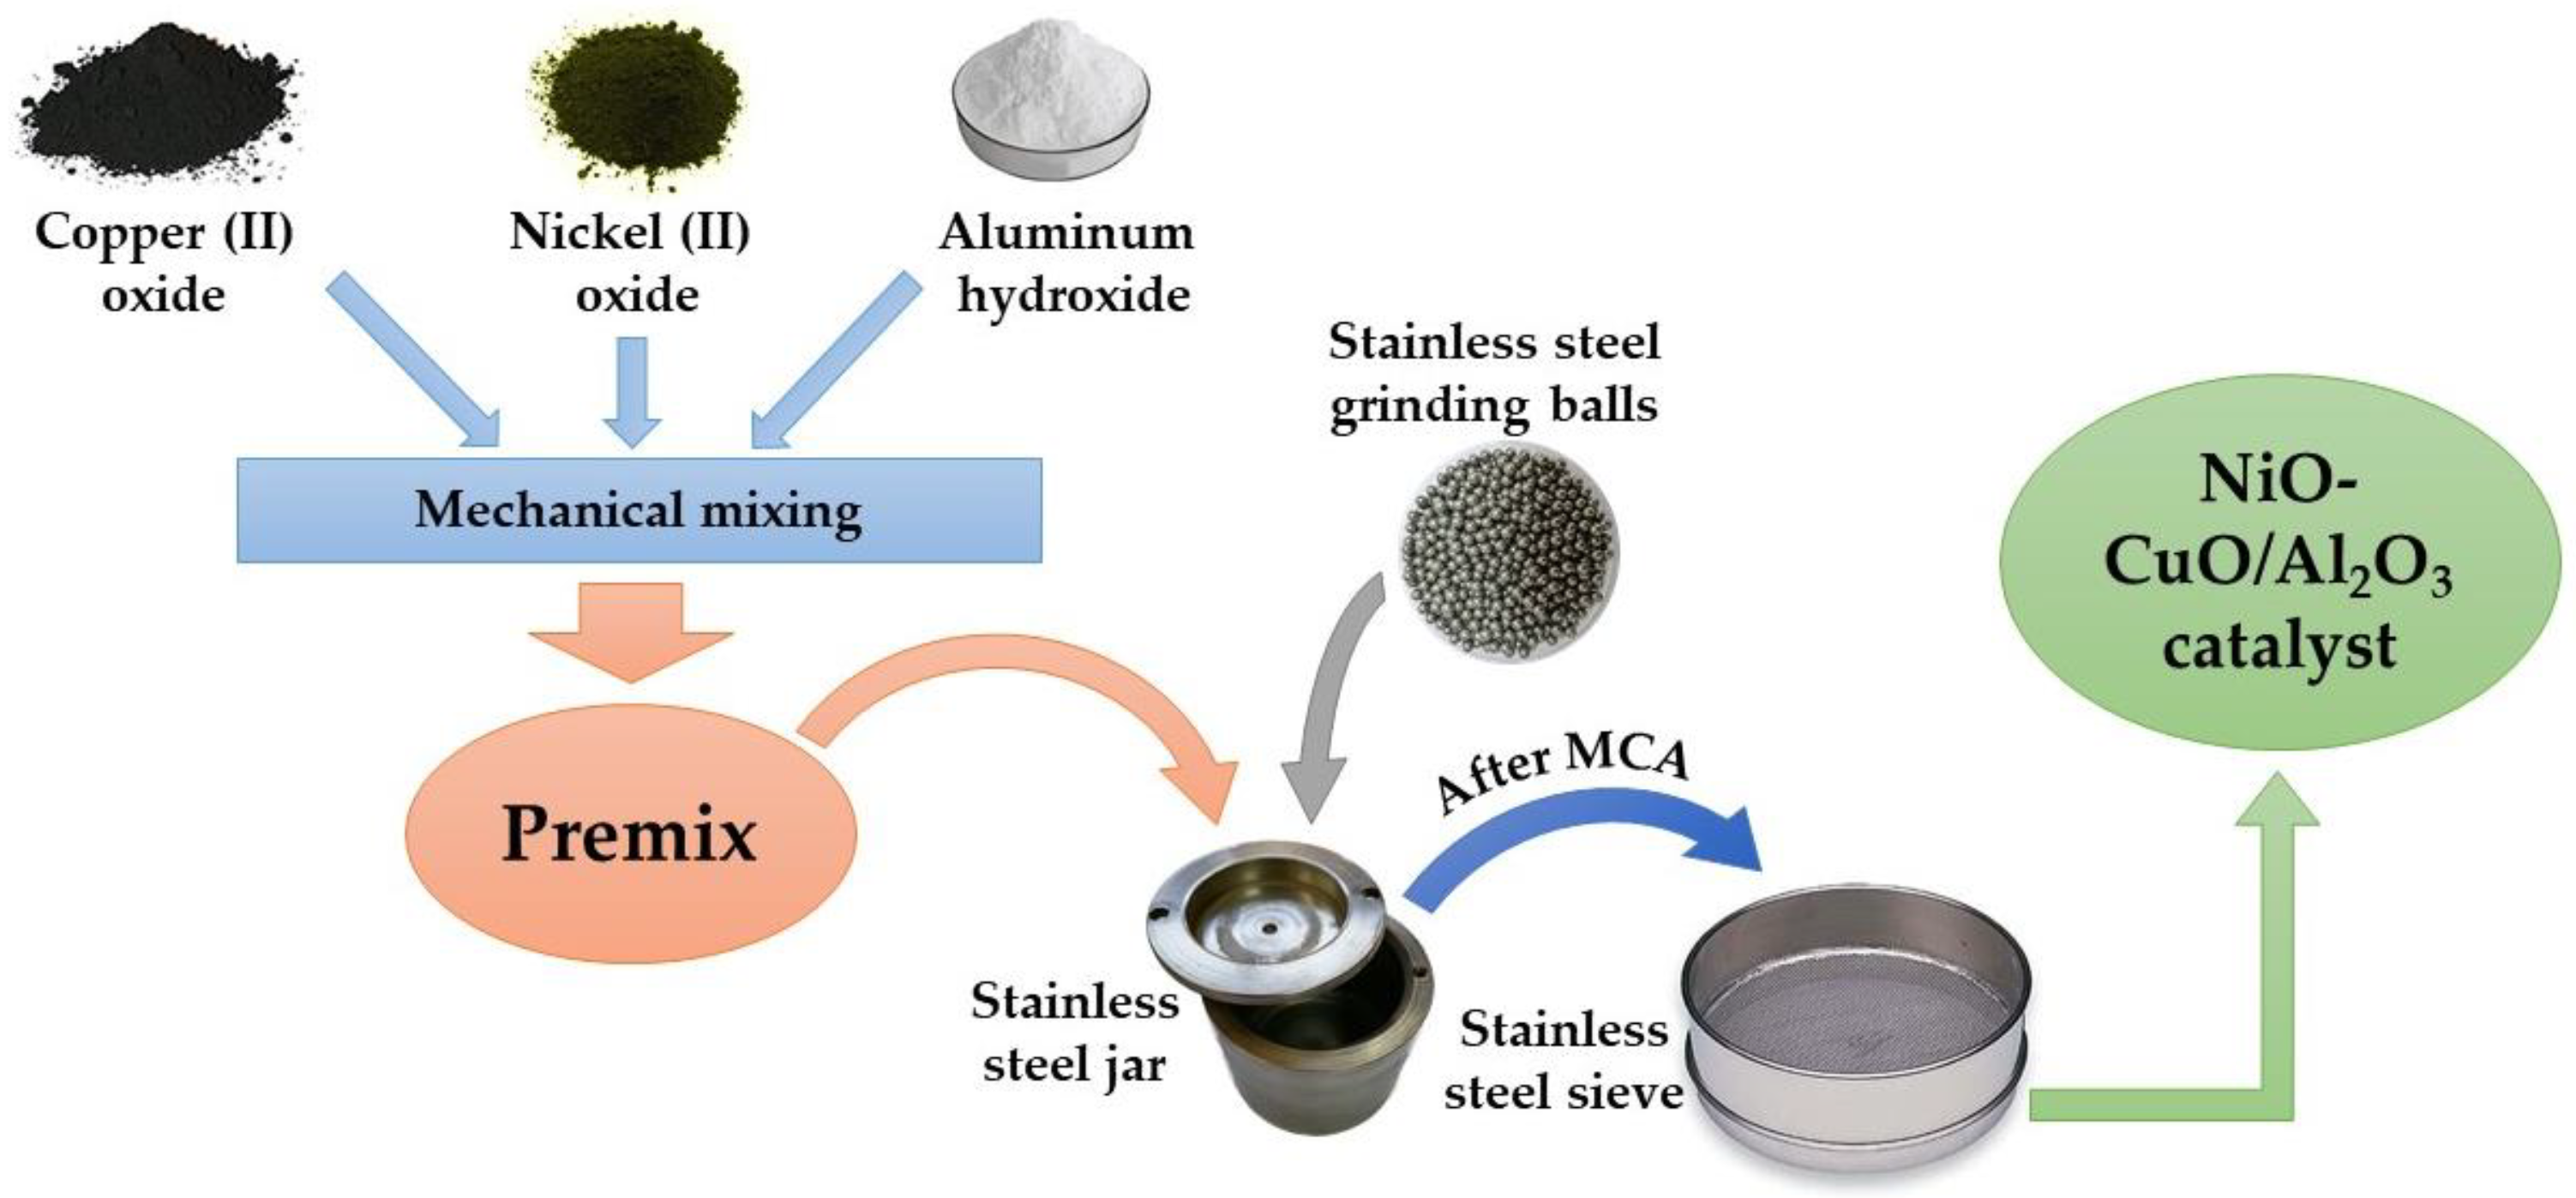
2.1. Synthesis of the Catalyst

The NiO-CuO/Al2O3 catalyst was prepared by the mechanochemical activation (MCA) method using a planetary mill “Activator 2S” (LLC Activator, Novosibirsk, Russia). The schematic diagram of the catalyst preparation approach is shown in Figure 1. Initially, the premix was prepared by mixing the powders of nickel (II) oxide (pure grade, SpectrChem, Moscow, Russia), copper (II) oxide (reagent grade, LLC “Ural Plant of Chemical Reagents”, Upper Pyshma, Russia), and aluminum hydroxide (Microintech, Yekaterinburg, Russia). The Ni/Cu atomic ratio was 85/15. The content of the structural promotor (with regard to Al2O3) was ~5%. Then, a specimen of the premix (20 g) was loaded into stainless steel jars (250 mL in volume) along with grinding balls (200 g; stainless steel; 5 mm in diameter). Note that the jars were cooled with water to avoid overheating. An industrial frequency inverter VF-S15 (Toshiba Schneider Inverter Corp., Nagoya, Japan) was used to set the rotation frequency of the jars (1856 rpm) and the platform (956 rpm). The estimated acceleration of the grinding balls was 628 m/s2 (64 G). After 30 min of activation, the NiO-CuO/Al2O3 catalyst was unloaded from the jars in air and separated from the grinding balls using a sieve.

2.2. Kinetic Studies on Decomposition of Methane–Hydrogen Mixture

The kinetics of the process of catalytic decomposition of methane–hydrogen mixture over NiO-CuO/Al2O3 catalyst was studied under atmospheric pressure using a flow-through quartz reactor equipped with McBain balances. The principal scheme of the experimental setup is shown in Figure 2. The use of this reactor allows registering the deposition (accumulation) of the carbon product in a real-time mode. A specimen of the catalyst (1.9, 2.9 or 10 mg) was loaded into a basket made of foamed quartz (Figure 2a, position 5). The basket was placed inside the reactor (Figure 2a, position 2) using a quartz thread and a calibrated quartz spring (Figure 2a, position 4). The reactor was fed with an argon flow. The furnace (Figure 2a, position 3) was heated up to 550 °C over 30 min, and the reactor was purged with the argon–hydrogen mixture (5.5 L/h of Ar; 3.6 L/h of H2) for 5 min to reduce the catalyst. Then, the temperature of the furnace was set to the required value. When the reactor was heated, it was fed with a reaction mixture (pure methane or methane–hydrogen mixture, as further specified). The weight gain of the sample was monitored every 2 min for the first 15 min and every 5 min later on. The duration of the experiments was varied from 1 to 7 h. Finally, the sample with accumulated carbon was cooled down to room temperature in an argon flow, unloaded and weighed. Then, the carbon yield (CY) in grams per gram of catalyst (g/gcat) was calculated as follows:
C Y = m ( p r o d ) m   ( c a t ) m   ( c a t ) ,
where m(prod) is a weight of unloaded product, g; m(cat) is a loading of the initial catalyst sample, g.

2.3. Characterization of the Samples

X-ray diffraction (XRD) analysis of the catalyst was performed using a Thermo ARL X’tra (Thermo Fisher Scientifics, Basel, Switzerland) diffractometer equipped with a Mythen2R-1D (Dectris AG, Baden, Switzerland) detector. The XRD patterns were registered using a CuKα (λ = 1.5418 Å) radiation in a 2θ angle range from 10 to 90° at a recording rate of 2°/min.
The morphology of the as-prepared catalyst and the carbon nanomaterials was examined by scanning electron microscope (SEM) on a JSM-6460 microscope (JEOL Ltd., Tokyo, Japan) at magnifications from 8× to 300,000×.
The high-resolution transmission electron microscopy (HR TEM) images were obtained using a JEM-2010CX microscope (JEOL Ltd., Tokyo, Japan) working at an accelerating voltage of 100 kV with a line resolution of 1.4 Å.
The textural characteristics of the carbon nanomaterials were determined by low-temperature nitrogen adsorption/desorption (Brunauer–Emmett–Teller (BET) method). The adsorption/desorption isotherms were recorded at 77 K using an automated analyzer ASAP-2400 (Micromeritics, Norcross, GA, USA). The preliminary degassing of the samples was carried out at 250 °C for 6 h.

3. Mathematical Modelling of the Process

3.1. Mathematical Model of the Reactor

The mathematical modelling was performed considering the following assumptions:
  • The volume of the reaction mixture is constant;
  • Any changes in the volume of the reaction mixture caused by the reaction are negligible;
  • An ideal mixing mode is realized in the reaction zone.
The inverse task, which is the search of kinetic constants, was solved by the matching method based on the coincidence of the calculated and experimental data obtained during two-hour experiments. Since the catalyst exhibits stability during two-hour experiments, the deactivation of the catalyst was not taken into account in mathematical modeling at this stage of the research.
The non-stationary mathematical model has the following form [38]:
V mix dC i dt = ν i r   ×   V cat + G   ( C 0 i   C i ) ;     i = CH 4 , H 2 ,
V mix d C C dt = ν C r   ×   V cat .
Initial conditions: t = 0: Ci = Ci,in; i = CH4, H2; CC = 0.
To solve this equation system, a COMSOL Multiphysics® package, version 5.4 (COMSOL AB, Stockholm, Sweden) was applied.

3.2. Kinetic Model of the Process

The preliminary estimation of the existing kinetic models for decomposition of methane–hydrogen mixtures over nickel–copper catalyst, described by Borghei et al. [33], allows choosing two models for the current research. The D1a model based on the dissociative adsorption of methane is described by the following Equation [33]:
D 1 a :   r = ( k +   ×   P CH 4     k / K r   ×   P 2 H 2 ) / ( 1 + P 3 / 2 H 2 / K r ) 2 .
The reaction rate equation for the M1a kinetic model based on the molecular adsorption of methane is as follows [33]:
M 1 a :   r = ( k +   ×   P CH 4     k / K r   ×   P 2 H 2 ) / ( 1 + P 2 H 2 / K r ) 2 ,
where k+ and k are obtained using the Arrhenius Euations [39]: k+ = k 0 + × exp(− E a + /RT); k = k 0 × exp(− E a /RT).
By solving the inverse task, the activation energy values E a + and E a , as well as the constants k 0 + and k 0 providing the best fitting of the experimental points were obtained. In order to calculate the Kr constant, which is Kr = k 0 r × exp(−Ear/RT), the values Ear = 91.2 kJ/mol and k0r = 5.088 × 10⁵ atm3/2 were used.

4. Results and Discussions

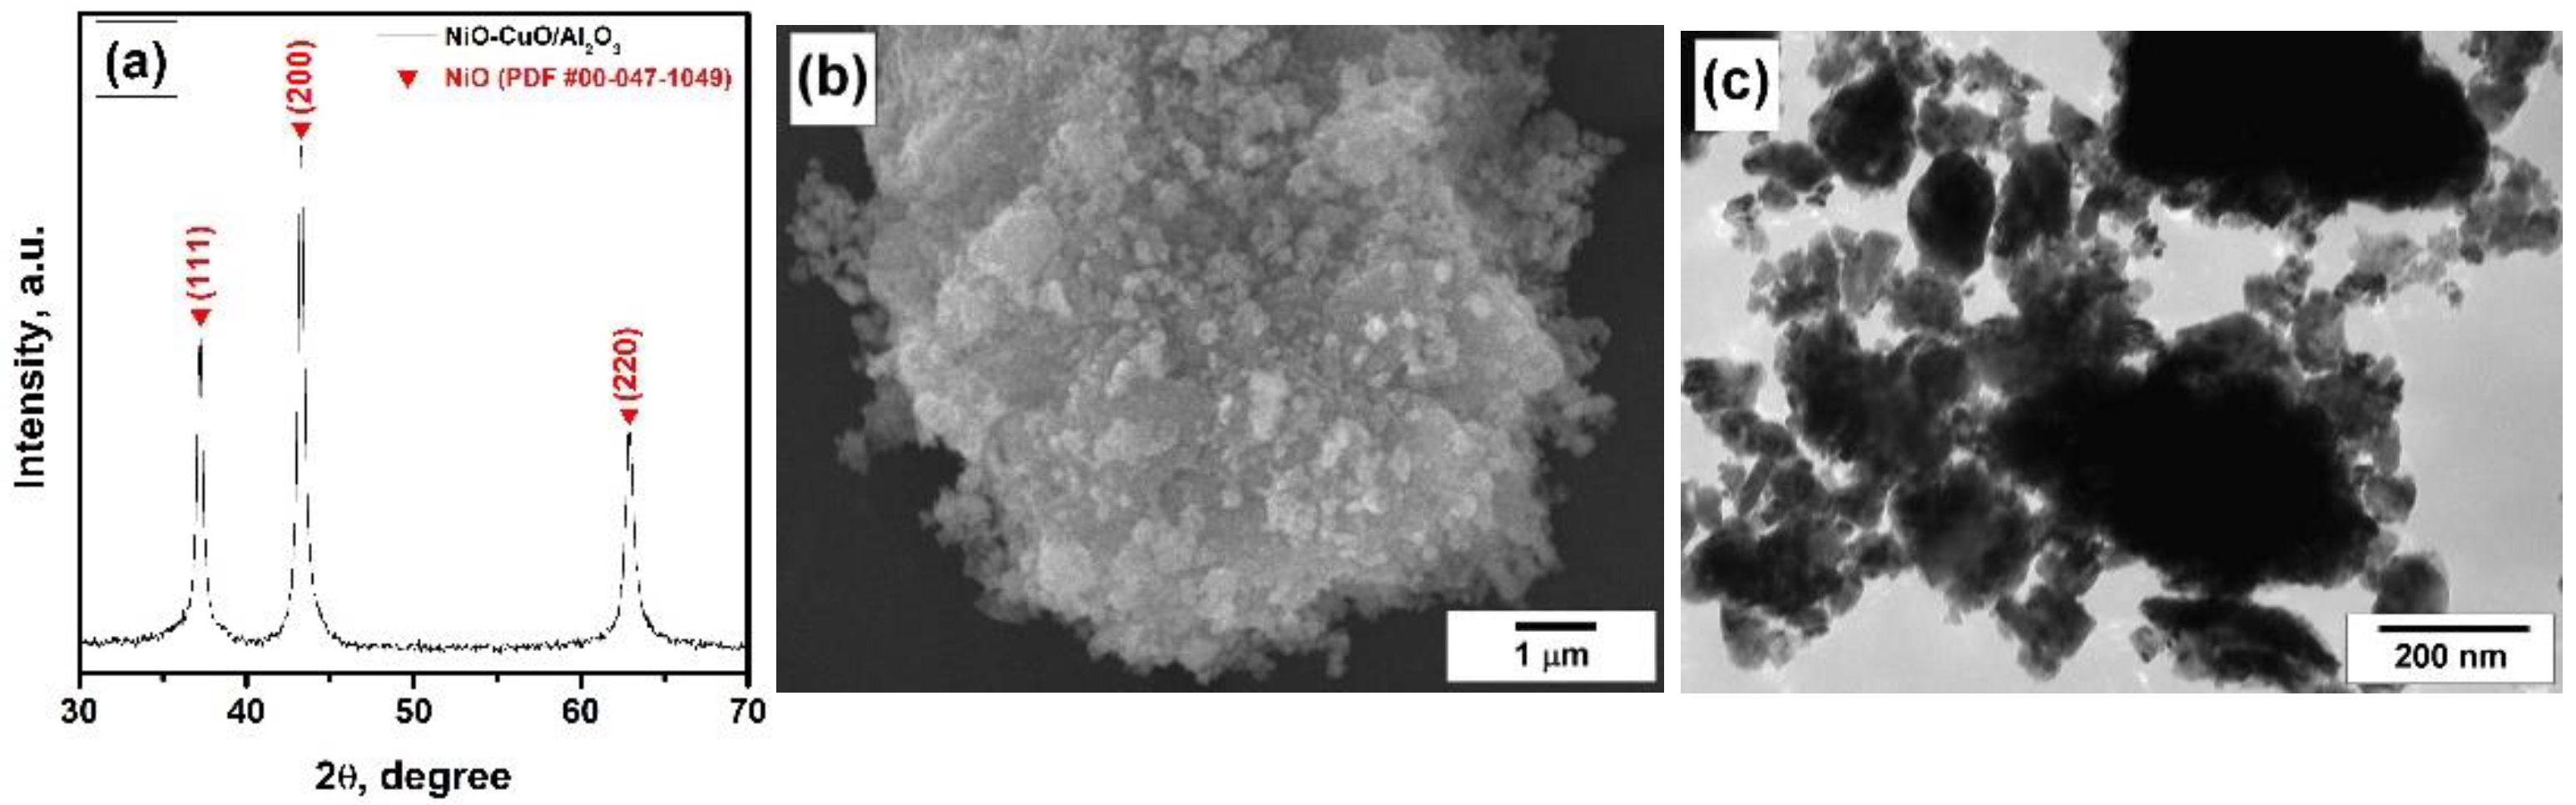
4.1. Characterization of the Catalyst

The prepared NiO-CuO/Al2O3 catalyst was characterized by XRD, SEM and TEM methods. The obtained results are presented in Figure 3. As follows from XRD data (Figure 3a), the sample is represented by the NiO phase (Fm3m, PDF #00-047-1049) only. No copper-containing phases were found that indicate the presence of copper in a roentgen-amorphous state. As for alumina phase, the low level of its content (5%) makes it almost impossible to detect the traces of Al2O3 by XRD. For nickel oxide, the lattice parameter was found to be a = 4.1783(3) Å, which is close to the literature data (a = 4.177 Å). The coherent-scattering region is estimated to be ~270 Å. Figure 3b,c shows the SEM and TEM images of the catalyst, correspondingly. As seen, the material is represented by agglomerated particles of irregular shape and few microns in size, which are composed of primary particles of tens of nm in size.

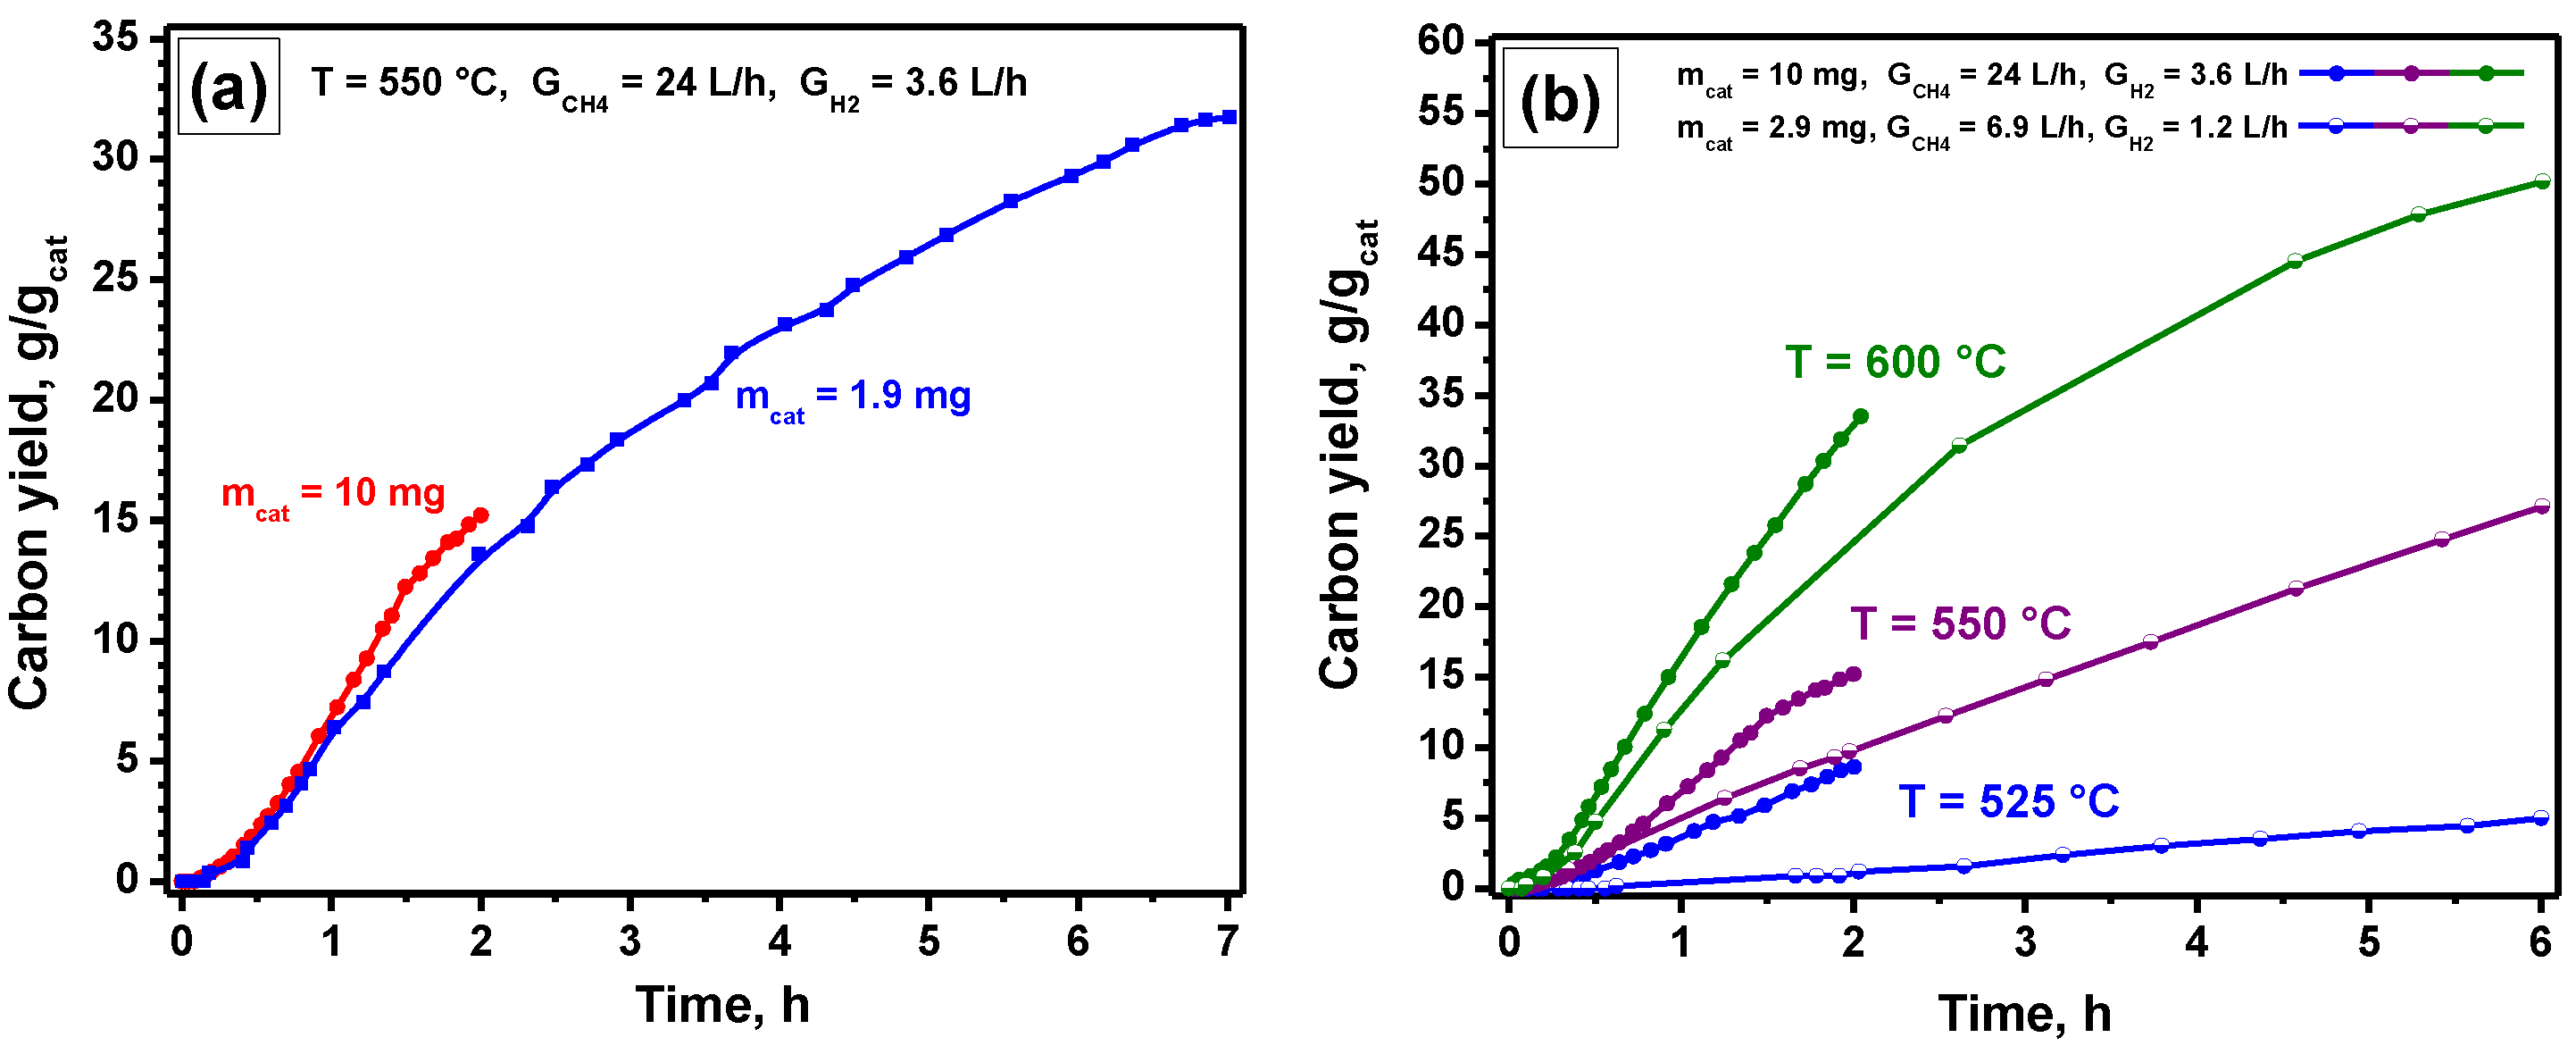
4.2. Kinetic Features of the Decomposition of Methane–Hydrogen Mixture

In general, the catalytic pyrolysis of the methane–hydrogen mixture can be presented by the following reaction scheme:
CH 4 + nH 2   c a t . ,   T C ( CNF ) + ( n + 2 ) H 2 ,
where C(CNF) is a carbon product deposited in the form of carbon nanofibers.
As long as the catalyst composition is not varied within the present study, just two parameters, the temperature and the hydrogen presence, should be analyzed in detail. Therefore, to study the effects of these parameters on the kinetics of the process, the following conditions have been used: the specimen of the catalyst was 10 mg; the methane flow rate was 24 L/h, and the hydrogen flow rate was 0 or 3.6 L/h. In the durability tests, the specimen of the catalyst was decreased to 2.9 or 1.9 mg, which is reasoned by the higher amount of produced carbon nanomaterial and the volume limitation of the quartz basket.

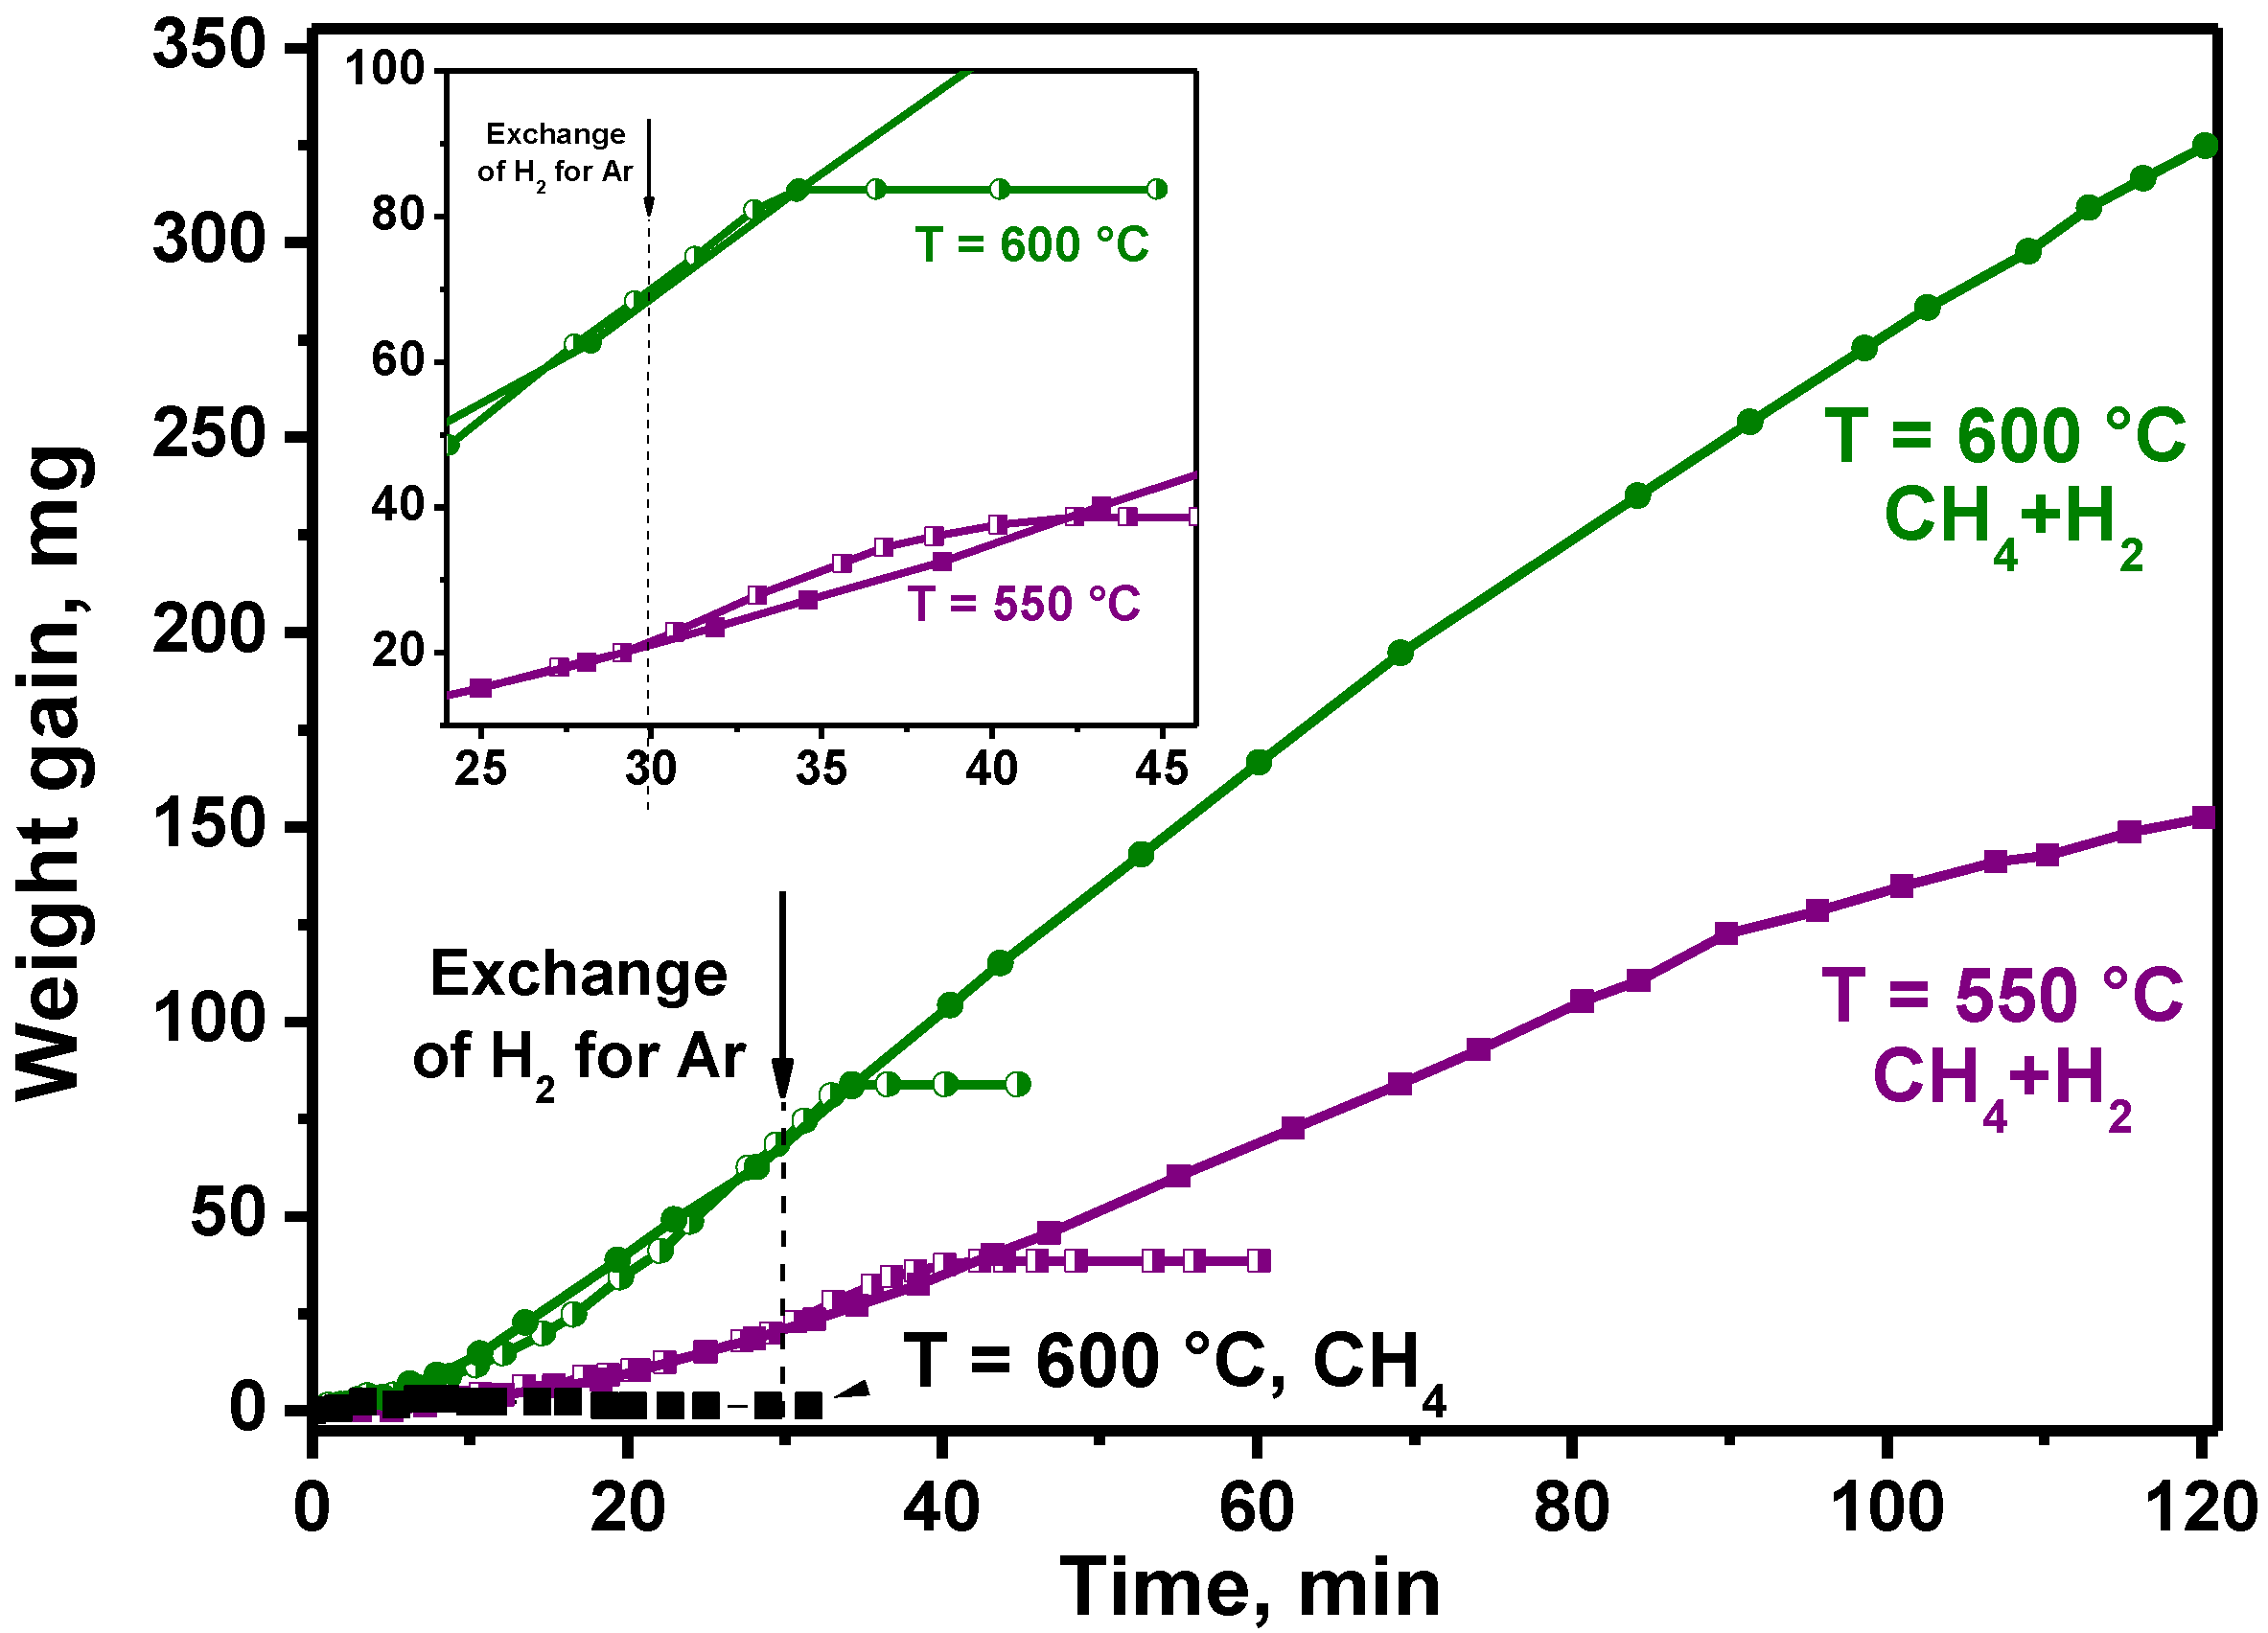
4.2.1. Effect of the Hydrogen Presence

One of the main reasons leading to deactivation of the catalyst is the blockage of its surface and catalytically active sites by amorphous carbon. Therefore, in order to keep the catalyst in an active state, an addition of hydrogen into the reaction mixture is practiced. Hydrogen interacts with the forming amorphous carbon, thus cleaning the catalyst’s surface from these undesirable deposits. The effect of the hydrogen presence in the reaction mixture is demonstrated in Figure 4. In the case of decomposition of pure methane at 600 °C, a rapid deactivation of the NiO-CuO/Al2O3 catalyst is observed (Figure 4). The addition of hydrogen into the mixture provides the stable operation of the catalyst during the considered period of the experiment (2 h). It is important to note that the amount of hydrogen released due to the methane decomposition is not enough to stabilize the activity of the catalyst. Thus, when the hydrogen flow was exchanged for an argon flow after 30 min of reaction, the deposition of carbon stopped practically immediately, indicating the deactivation of the catalyst (Figure 4). Thereby, it is evident that an excess of hydrogen in the reaction mixture is required for the stable operation of the NiO-CuO/Al2O3 catalyst, and the use of methane–hydrogen mixtures is preferable in terms of efficient catalytic pyrolysis of methane.
It is worth noting that the temperature affects both the kinetics of methane decomposition and the process of the catalyst deactivation. As seen, the rate of carbon accumulation at the decomposition of methane–hydrogen mixture increases with the temperature increase. This effect will be discussed in detail in the next section. The exchange of hydrogen for argon in the composition of the reaction mixture leads to the catalyst deactivation in both cases. However, the deactivation at 600 °C takes place already after less than 5 min (Figure 4, inset). At 550 °C, the catalyst shows even slightly higher activity for the first 10 min without hydrogen if compared with that with hydrogen and only then tends to deactivation. Such an increase in activity can be explained by the reaction equilibrium, since hydrogen is one of the products for the methane decomposition reaction (5).

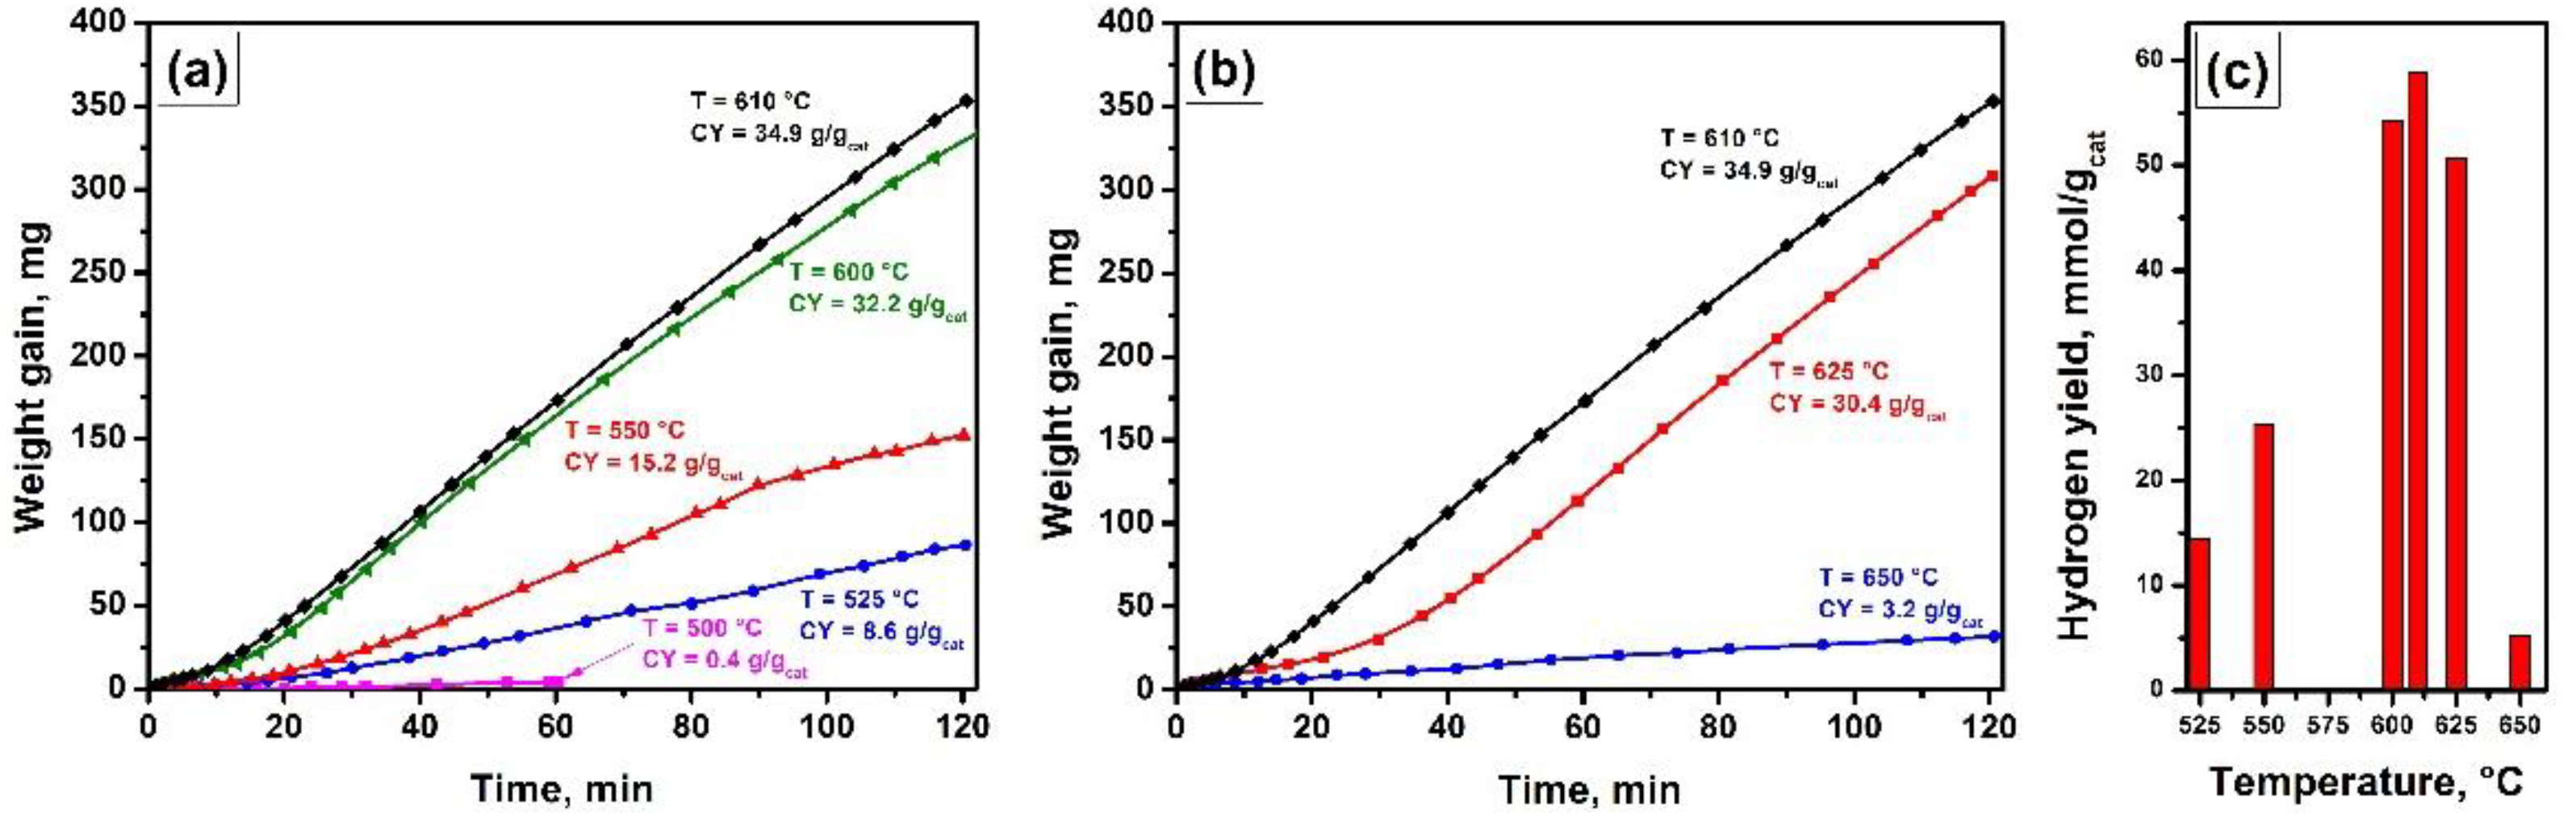
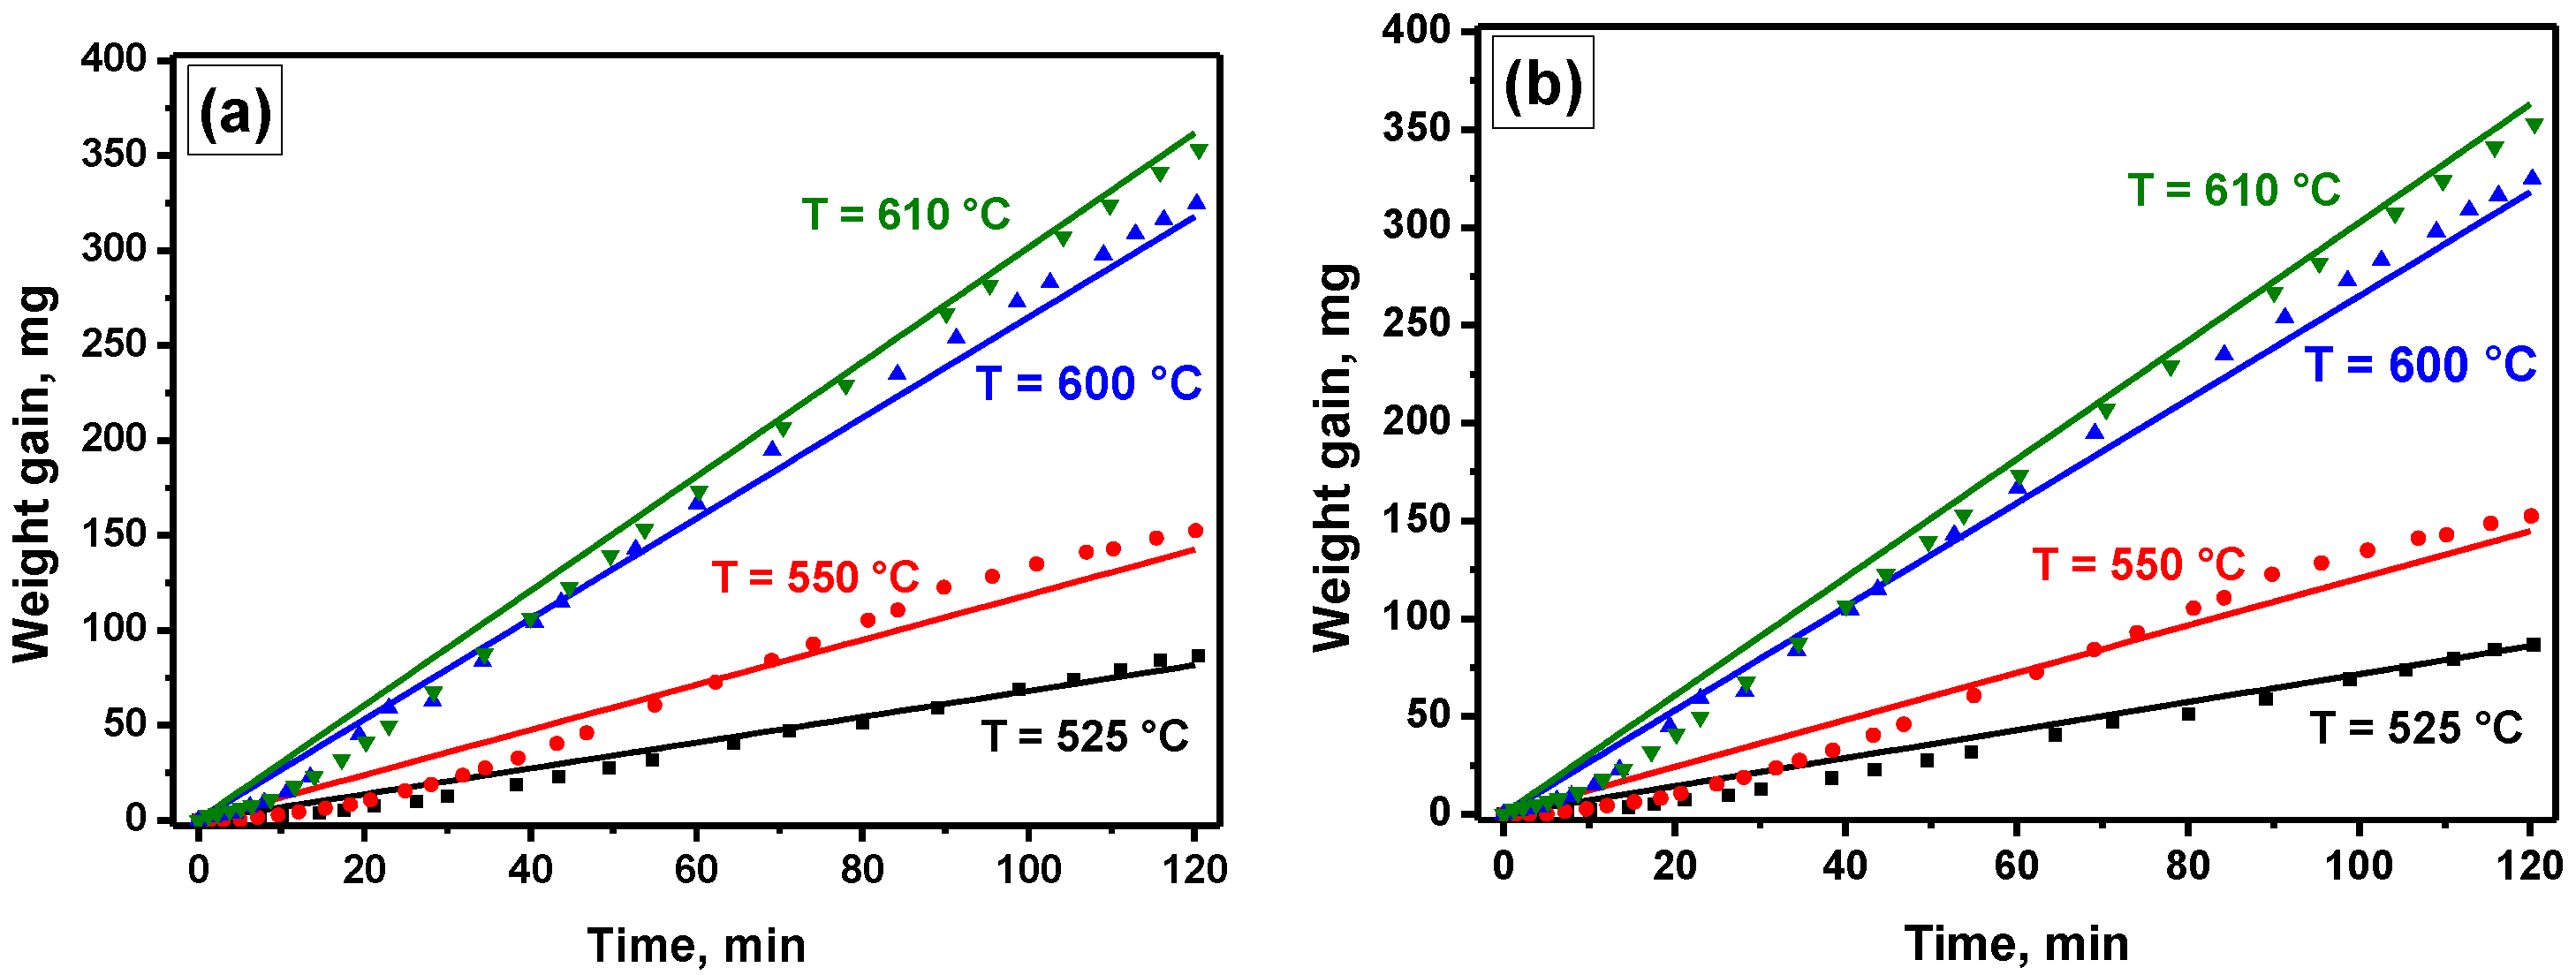
4.2.2. Effect of the Temperature

A series of experiments on the catalytic pyrolysis of methane–hydrogen mixture at different reaction temperatures was performed in order to find an optimal temperature. The two-hour experimental curves including the values of carbon yield are compared in Figure 5a,b. The noticeable accumulation of the carbon product due to the decomposition of methane–hydrogen mixture is observed starting from 525 °C (Figure 5a). At this temperature, the carbon yield reaches the value of 8.6 g/gcat. A further increase in temperature increases the carbon yield as well. The maximum value of 34.9 g/gcat is observed for the temperature of 610 °C. Then, above this value, an opposite temperature effect is well seen (Figure 5b). Thus, the methane decomposition rate decreases rapidly, and the carbon yield falls down from 30.4 g/gcat at 625 °C to 3.2 g/gcat at 650 °C. Expectedly, the hydrogen yield values show the similar trend within the studied temperature range (Figure 5c).

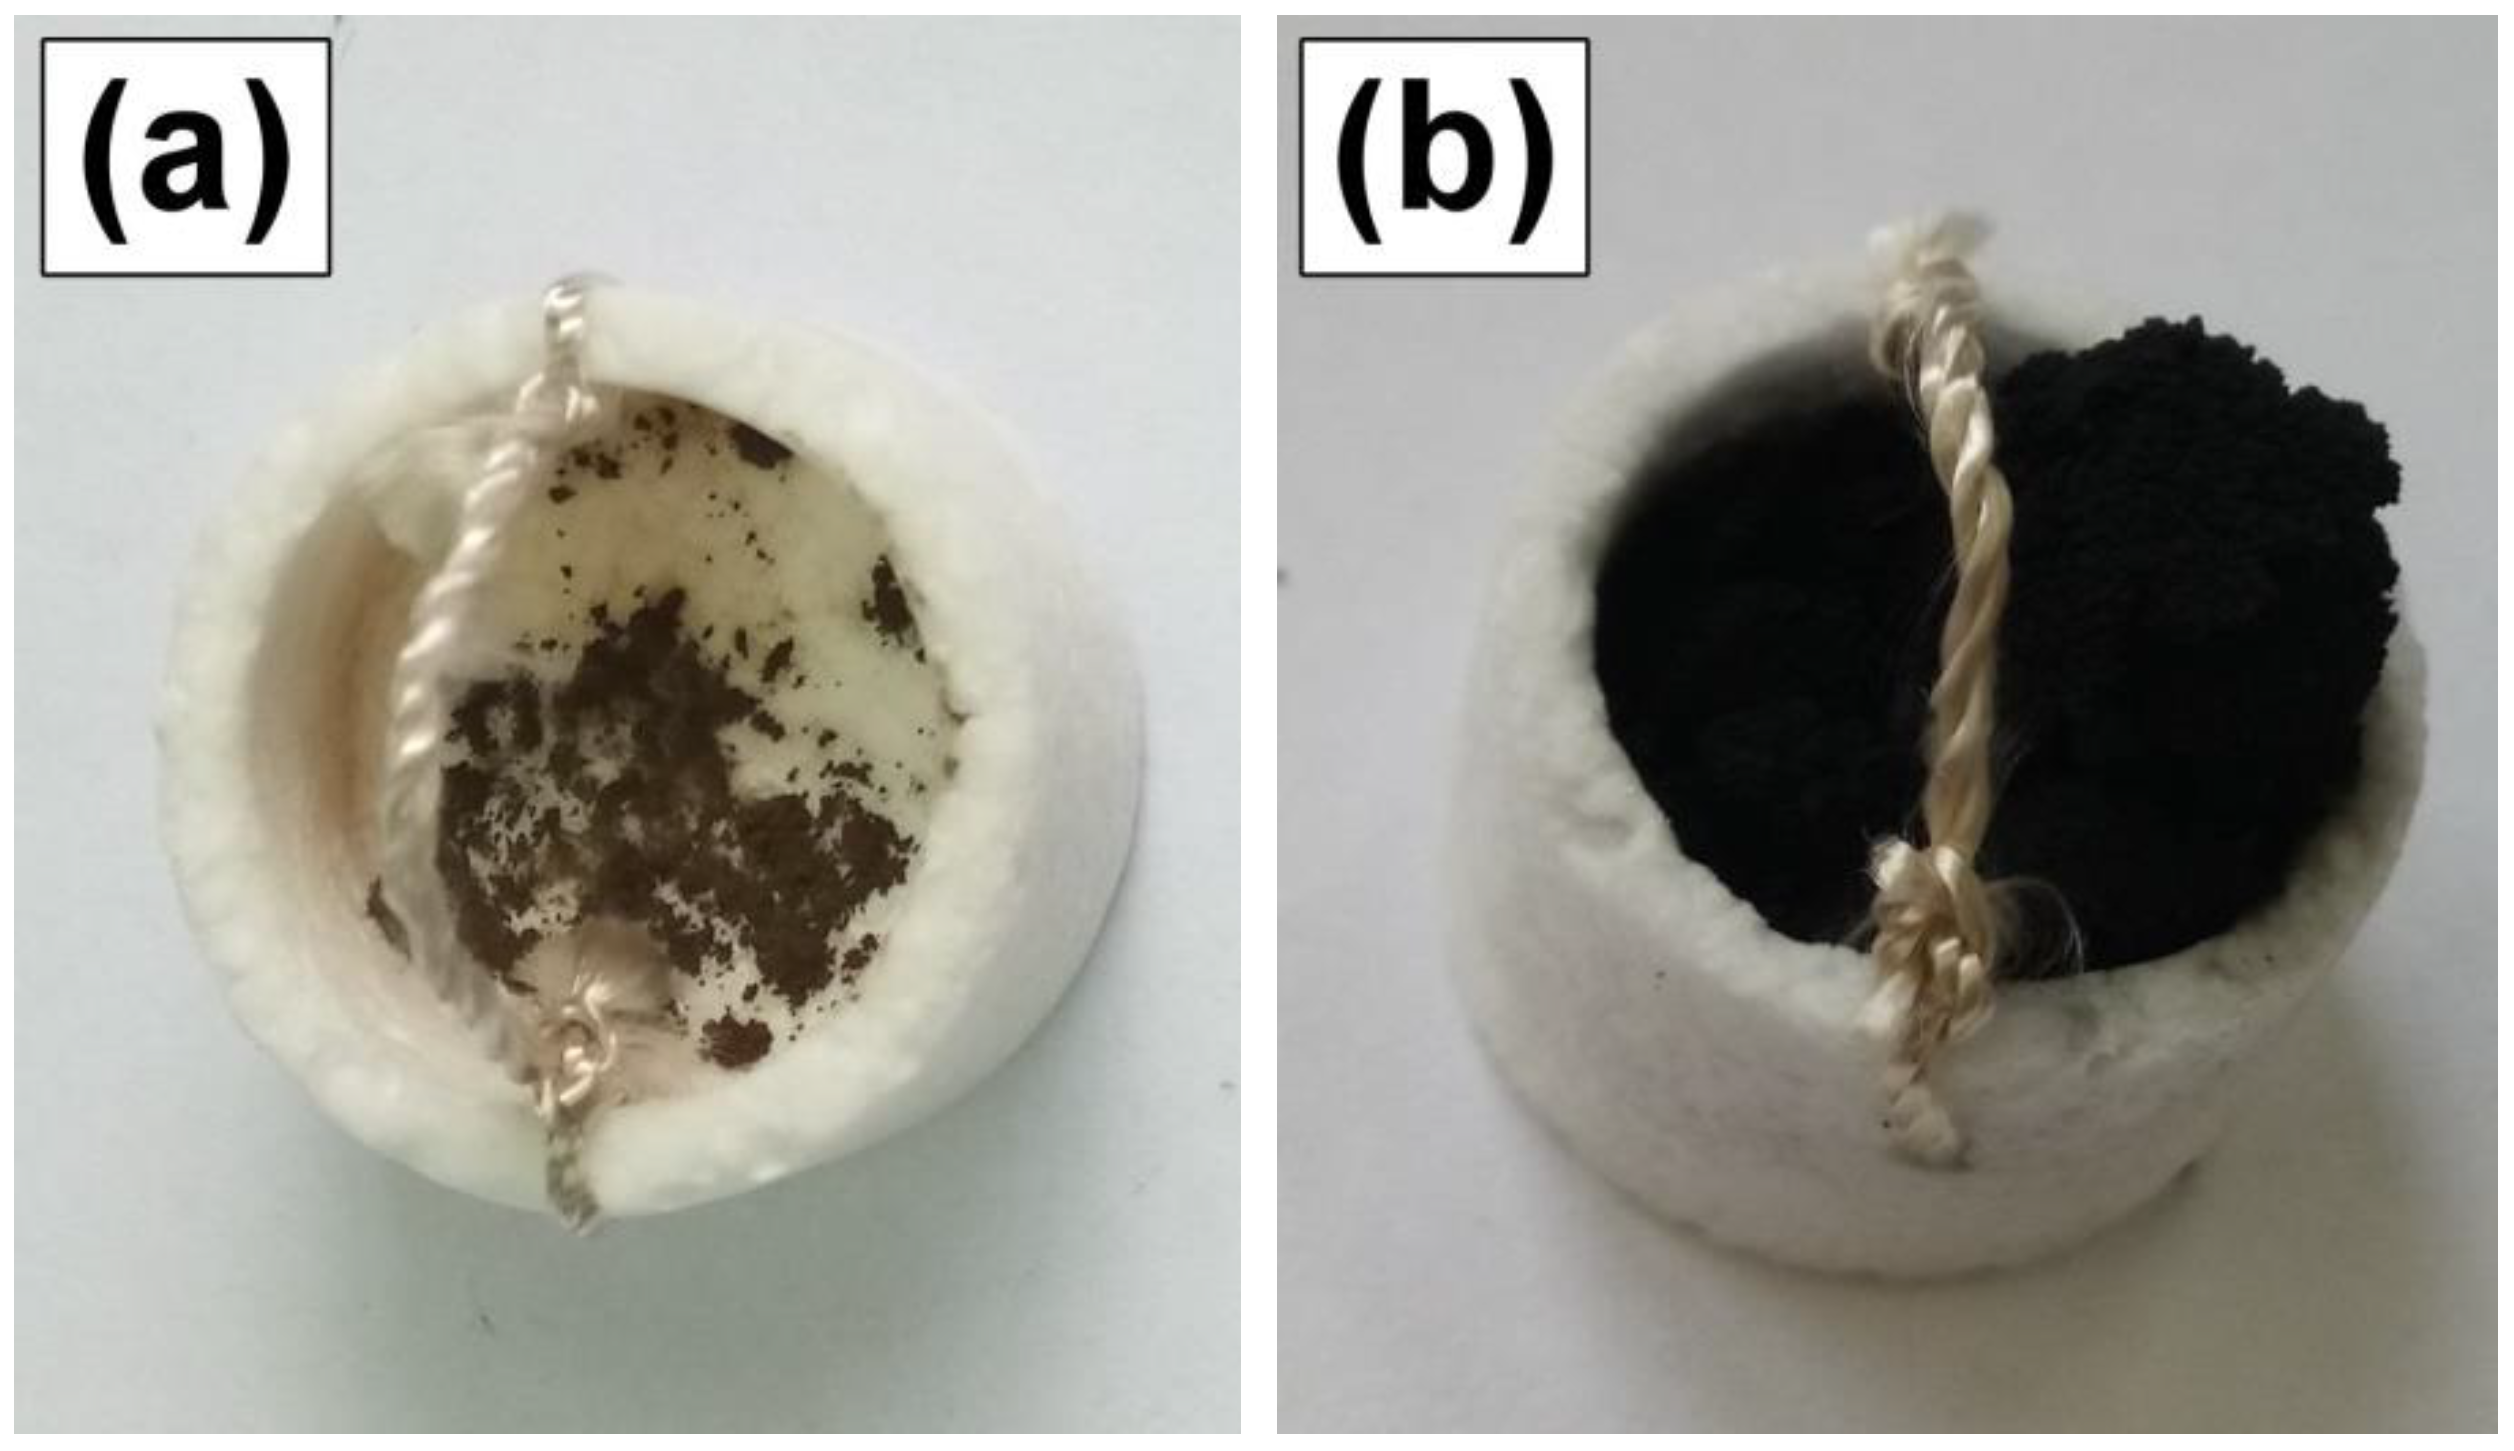
4.2.3. Studying the Stability of the Catalyst

The stability of the catalyst operation was examined in prolonged experiments. The conditions were as follows. In the 7 h test, the loading of the catalyst was decreased to 1.9 mg, while the gas flow rates remained the same (GCH4 = 24 L/h, GH2 = 3.6 L/h). The temperature was 550 °C. In the 6 h test, the larger amount of the catalyst was used (2.9 mg). In order to keep the contact time (τ = Vcat/G) constant, the gas flow rate decreased to the values GCH4 = 6.9 L/h and GH2 = 1.2 L/h. The process was studied at 525, 550 and 600 °C.
The effect of the catalyst loading is shown in Figure 6a. As seen, a decrease in the catalyst loading of five times does not change the specific carbon yield after 2 h of experiment noticeably. The kinetic curves are practically coincident with each other. This observation can be explained by the fact that a decrease in the catalyst amount at the constant gas flow rates proportionally increases the methane load on the catalyst (GCH4/mcat) as well. Therefore, the same amount of methane is being converted over the catalyst. It should be also noted that no catalyst deactivation is observed during the 7 h experiment for the catalyst specimen of 1.9 mg.
Figure 6b compares the kinetic curves for the case when the contact time and the methane load on the catalyst were constant. For all three studied temperatures, a decrease in the catalyst loading affects the kinetics and decreases the carbon yield values. Thus, the carbon yield value diminishes from 33.5 to 25.7 g/gcat at 600 °C, from 15.2 to 9.6 g/gcat at 550 °C, and from 8.6 to 1.3 g/gcat at 525 °C. The 6 h experiments also show no deactivation of the catalyst.

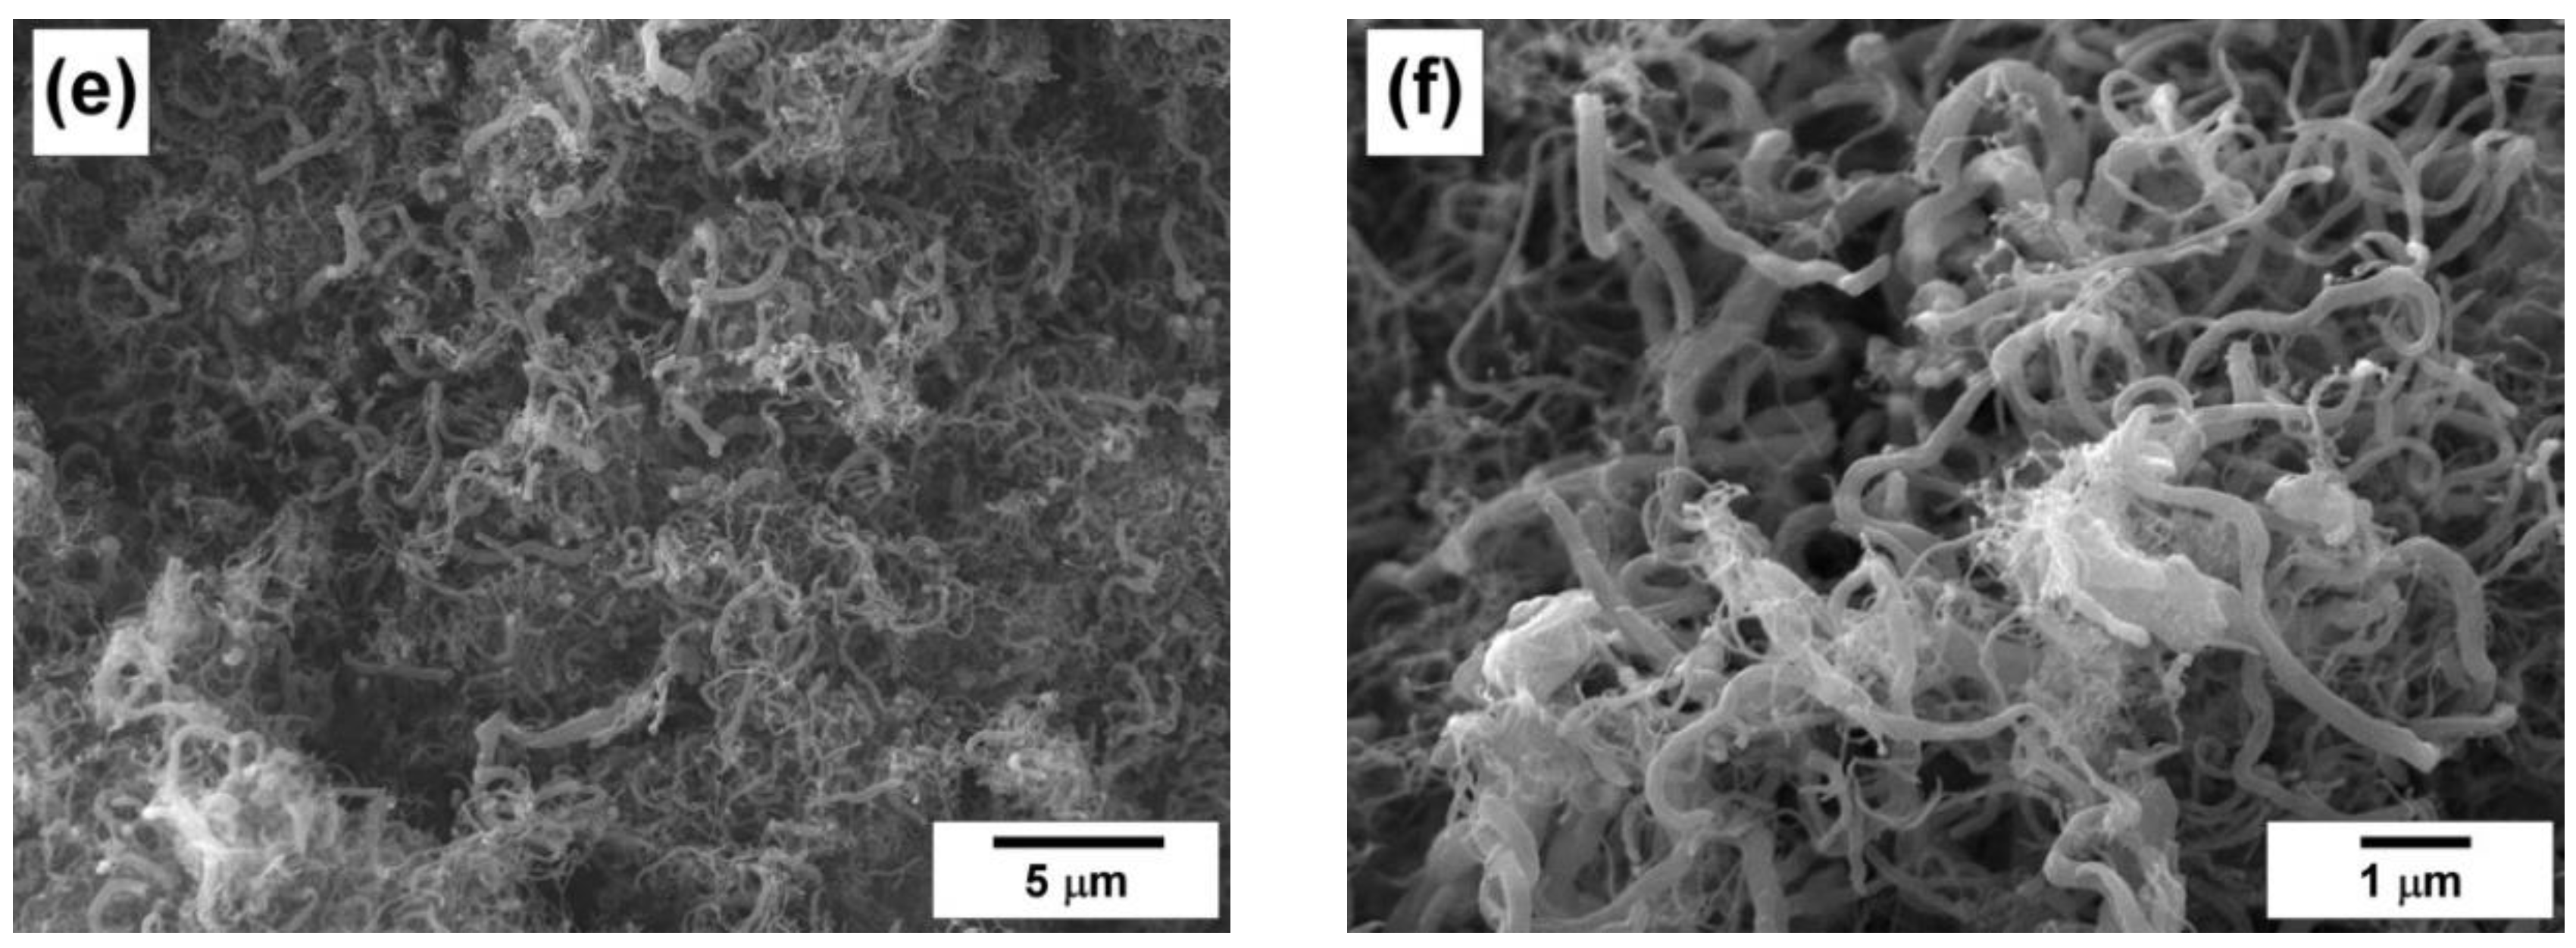
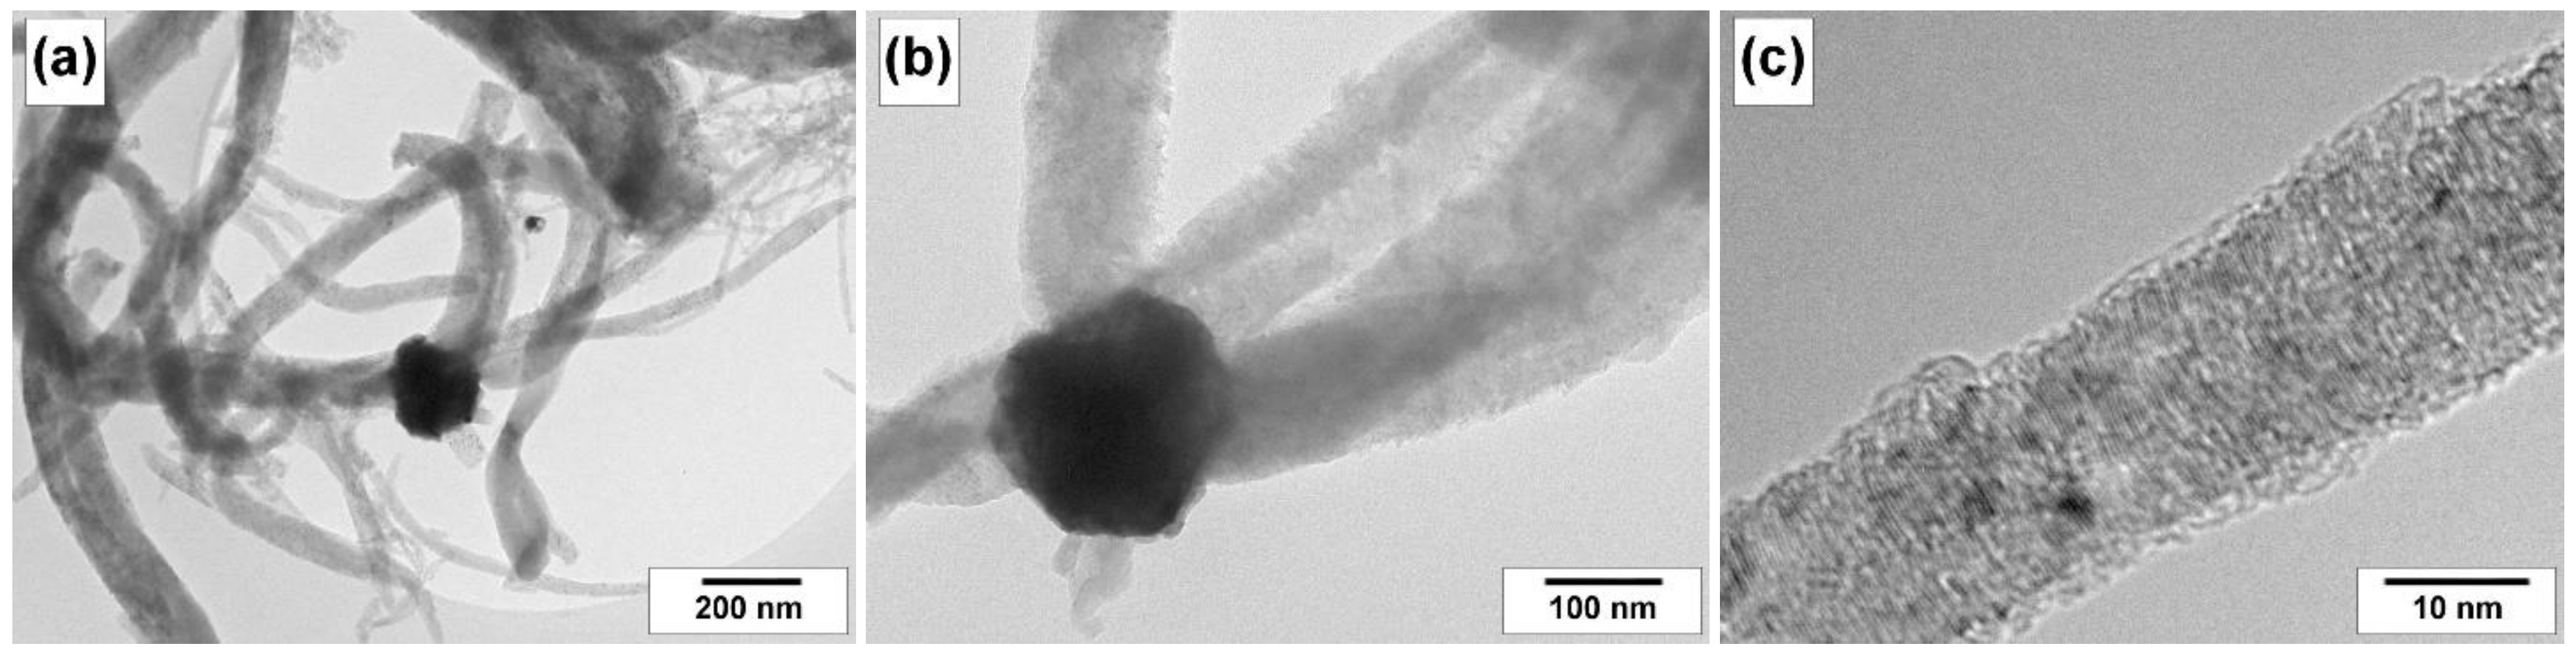
4.3. Characterization of the Carbon Product

As mentioned above, the studying of the methane decomposition process with the formation of carbon product is limited by the volume of the quartz basket used as a sample holder. The photograph of this basket is shown in Figure 7a. During the experiment, the basket is being filled up with the carbon product, which occupies all the available volume (Figure 7b). An analysis of the morphology and the secondary structure of the carbon product was performed using the electron microscopic methods. Figure 8 presents a set of SEM images for the carbon samples obtained via the decomposition of methane–hydrogen mixture at 550, 600 and 625 °C. As seen, regardless of the temperature, the product is represented by carbon filaments of various lengths. These filaments possess the bimodal structure composed of thin (20–100 nm in diameter) and thick (150–350 nm in diameter) fibers. Such a structure indicates that initially the two types of catalyst particles exist. The appearance of the coarse particles can be connected with the reduction stage, which results in such processes as migration, redistribution and agglomeration of nickel and copper oxides.
The primary structure of the carbon filaments was revealed by the TEM method. As shown in Figure 9, the carbon nanofibers are well-packed ones and belong to a stacked (or “pile of plates”) structural type, which is typical of Ni-catalysts modified with Cu [40]. As seen from Table 1, the produced carbon nanomaterial contains 3–7 wt% of the initial catalyst used for the decomposition of the CH4/H2 mixture. The content of the mineral residue (i.e., purity of carbon in CNF product) is determined by the productivity of catalyst (or carbon yield, CY). Characterization of the obtained CNF samples by low-temperature nitrogen adsorption allows estimating their specific surface area (SSA) and pore volume (Vpore). The results of BET measurements are also presented in Table 1. It was found that the SSA and Vpore values lie within ranges of 120–174 m2/g and 0.16–0.19 cm3/g, correspondingly.

4.4. Estimation of the Kinetic Parameters

As noticed above, a reliable kinetic model is needed for the mathematical modelling of any process. Here, two kinetic models for the decomposition of methane–hydrogen mixture over nickel–copper catalyst were chosen and used [33]. The input parameters applied for the modelling are summarized in Table 2. The simulation results were compared with the experimental points obtained at 525, 550, 600 and 610 °C. This comparison is presented in Figure 10. The mathematical modelling using the D1a kinetic model provides an appropriate coincidence of theory with experiment (Figure 10a) at the following values of the parameters: E a + = 53 kJ/mol; k 0 + = 41 × 104 mol/(mcat3·s·atm); E a = 17 kJ/mol; k 0 = 35 × 102 mol/(mcat3·s·atm1/2). The M1a kinetic model (Figure 10b) fits the experimental points at the following values: E a + = 63 kJ/mol; k 0 + = 14.5 × 10⁵ mol/(mcat3·s·atm); E a = 20 kJ/mol; k 0 = 35 × 102 mol/(mcat3·s·atm1/2).
Thereby, at the current stage of study, it can be concluded that both the applied models appropriately describe the experimental data on the catalytic decomposition of methane–hydrogen mixture over the nickel–copper catalyst. The selected kinetic parameters for the models D1a and M1a provide an acceptable fitting of the experimental points. The further study will be focused on verification of these models and on choosing the most precise model.

5. Conclusions

In present work, the efficiency of the catalytic decomposition of methane–hydrogen mixture over the NiO-CuO/Al2O3 catalyst was studied. It was shown that the presence of an excess of hydrogen in the composition of the reaction mixture is necessary to provide the long-term activity and the stable operation of the catalyst. The temperature of the process affects noticeably the kinetics of the process. A temperature range of 600–625 °C is shown to be an optimum in terms of the higher methane decomposition rate and the higher carbon yield. Within this range, the latter exceeds 30 g/gcat. According to the results of electron microscopic characterization, carbon filaments of different length and diameter represent thus obtained carbon product. The product possesses the developed specific surface area (120–170 m2/g) along with relatively low porosity (0.16–0.18 cm3/g). The simulation of this process performed using the two kinetic models, D1a and M1a, allows defining the kinetic constants, which provide an appropriate fitting of the experimental points. Being verified, the kinetic models along with the defined constants can be applied for the mathematical modelling of the process of catalytic decomposition of methane–hydrogen mixture in order to optimize the process parameters.

Author Contributions

Conceptualization, I.V.M. and A.A.V.; methodology, I.V.M. and A.A.V.; investigation, E.V.S., Y.I.B. and T.A.M.; writing—original draft preparation, E.V.S., Y.I.B. and T.A.M.; writing—review and editing, I.V.M. and A.A.V.; funding acquisition, I.V.M. and A.A.V. All authors have read and agreed to the published version of the manuscript.

Funding

This work was supported by the Ministry of Science and Higher Education of the Russian Federation [project No. AAAA-A21-121011390054-1]. The modelling of the kinetics was performed under the support of the National Technology Initiative Center of Excellence “Hydrogen as the Basis for Low-Carbon Economy”.

Institutional Review Board Statement

Not applicable.

Informed Consent Statement

Not applicable.

Data Availability Statement

Data is contained within the article.

Acknowledgments

Characterization of the samples was performed using the equipment of the Center of Collective Use “National Center of Catalysts Research”.

Conflicts of Interest

The authors declare no conflict of interest. The funders had no role in the design of the study; in the collection, analyses, or interpretation of data; in the writing of the manuscript; or in the decision to publish the results.

Nomenclature

Ciconcentration of the i-th component, mol/m3
Gflow rate of the gas mixture, L/h
mcatweight of the catalyst, mg
rrate of the reaction, mol/mcat3·s
ttime, h
Vcatvolume of the catalyst, m3
Vmixvolume of the gas mixture inside the reactor, m3
νstoichiometric coefficient
Pipartial pressure of the i-th component, atm
k+rate constant of the direct reaction, mol/(mcat3·s·atm)
krate constant of the reverse reaction, mol/(mcat3·s·atm1/2)

References

  1. Da Rosa, A.V.; Ordóñez, J.C. Hydrogen production. In Fundamentals of Renewable Energy Processes; Academic Press: Cambridge, MA, USA, 2022; pp. 419–470. [Google Scholar] [CrossRef]
  2. Falcone, P.M.; Hiete, M.; Sapio, A. Hydrogen economy and sustainable development goals: Review and policy insights. Curr. Opin. Green Sustain. Chem. 2021, 31, 100506. [Google Scholar] [CrossRef]
  3. Espegren, K.; Damman, S.; Pisciella, P.; Graabak, I.; Tomasgard, A. The role of hydrogen in the transition from a petroleum economy to a low-carbon society. Int. J. Hydrogen Energ. 2021, 46, 23125–23138. [Google Scholar] [CrossRef]
  4. Oliveira, A.M.; Beswick, R.R.; Yan, Y. A green hydrogen economy for a renewable energy society. Curr. Opin. Chem. Eng. 2021, 33, 100701. [Google Scholar] [CrossRef]
  5. Franchi, G.; Capocelli, M.; De Falco, M.; Piemonte, V.; Barba, D. Hydrogen production via steam reforming: A critical analysis of MR and RMM technologies. Membranes 2020, 10, 10. [Google Scholar] [CrossRef] [PubMed] [Green Version]
  6. Cao, Y.; Zhang, H.; Liu, X.; Jiang, Q.; Hong, H. A strategy of mid-temperature natural gas based chemical looping reforming for hydrogen production. Int. J. Hydrogen Energ. 2022, 47, 12052–12066. [Google Scholar] [CrossRef]
  7. Pashchenko, D. Natural gas reforming in thermochemical waste-heat recuperation systems: A review. Energy 2022, 251, 123854. [Google Scholar] [CrossRef]
  8. Amin, A.M.; Croiset, E.; Epling, W. Review of methane catalytic cracking for hydrogen production. Int. J. Hydrogen Energ. 2011, 36, 2904–2935. [Google Scholar] [CrossRef]
  9. Abbas, H.F.; Wan Daud, W.M.A. Hydrogen production by methane decomposition: A review. Int. J. Hydrogen Energ. 2010, 35, 1160–1190. [Google Scholar] [CrossRef]
  10. Tezel, E.; Figen, H.E.; Baykara, S.Z. Hydrogen production by methane decomposition using bimetallic Ni–Fe catalysts. Int. J. Hydrogen Energ. 2019, 44, 9930–9940. [Google Scholar] [CrossRef]
  11. Silva, R.R.C.M.; Oliveira, H.A.; Guarino, A.C.P.F.; Toledo, B.B.; Moura, M.B.T.; Oliveira, B.T.M.; Passos, F.B. Effect of support on methane decomposition for hydrogen production over cobalt catalysts. Int. J. Hydrogen Energy 2016, 41, 6763–6772. [Google Scholar] [CrossRef]
  12. Chesnokov, V.V.; Chichkan, A.S. Production of hydrogen by methane catalytic decomposition over Ni–Cu–Fe/Al2O3 catalyst. Int. J. Hydrogen Energ. 2009, 34, 2979–2985. [Google Scholar] [CrossRef]
  13. Ping, D.; Wang, C.; Dong, X.; Dong, Y. Co-production of hydrogen and carbon nanotubes on nickel foam via methane catalytic decomposition. Appl. Surf. Sci. 2016, 369, 299–307. [Google Scholar] [CrossRef]
  14. Fakeeha, A.H.; Ibrahim, A.A.; Khan, W.U.; Seshan, K.; Al Otaibi, R.L.; Al-Fatesh, A.S. Hydrogen production via catalytic methane decomposition over alumina supported iron catalyst. Arab. J. Chem. 2018, 11, 405–414. [Google Scholar] [CrossRef] [Green Version]
  15. Villacampa, J.I.; Royo, C.; Romeo, E.; Montoya, J.A.; Del Angel, P.; Monzón, A. Catalytic decomposition of methane over Ni-Al2O3 coprecipitated catalysts: Reaction and regeneration studies. Appl. Catal. A-Gen. 2003, 252, 363–383. [Google Scholar] [CrossRef]
  16. Cazaña, F.; Latorre, N.; Tarifa, P.; Royo, C.J.; Sebastián, V.; Romeo, E.; Centeno, M.A.; Monzón, A. Performance of AISI 316L-stainless steel foams towards the formation of graphene related nanomaterials by catalytic decomposition of methane at high temperature. Catal. Today 2022, 383, 236–246. [Google Scholar] [CrossRef]
  17. Dussault, L.; Dupin, J.C.; Guimon, C.; Monthioux, M.; Latorre, N.; Ubieto, T.; Romeo, E.; Royo, C.; Monzón, A. Development of Ni–Cu–Mg–Al catalysts for the synthesis of carbon nanofibers by catalytic decomposition of methane. J. Catal. 2007, 251, 223–232. [Google Scholar] [CrossRef]
  18. Cazaña, F.; Latorre, N.; Tarifa, P.; Labarta, J.; Romeo, E.; Monzón, A. Synthesis of graphenic nanomaterials by decomposition of methane on a Ni-Cu/biomorphic carbon catalyst. Kinetic and characterization results. Catal. Today 2018, 299, 67–79. [Google Scholar] [CrossRef] [Green Version]
  19. Shen, Y.; Lua, A.C. Synthesis of Ni and Ni–Cu supported on carbon nanotubes for hydrogen and carbon production by catalytic decomposition of methane. Appl. Catal. B-Environ. 2015, 164, 61–69. [Google Scholar] [CrossRef]
  20. Vedyagin, A.A.; Mishakov, I.V.; Korneev, D.V.; Bauman, Y.I.; Nalivaiko, A.Y.; Gromov, A.A. Selected aspects of hydrogen production via catalytic decomposition of hydrocarbons. Hydrogen 2021, 2, 122–133. [Google Scholar] [CrossRef]
  21. Mishakov, I.V.; Bauman, Y.I.; Streltsov, I.A.; Korneev, D.V.; Vinokurova, O.B.; Vedyagin, A.A. The regularities of the formation of carbon nanostructures from hydrocarbons based on the composition of the reaction mixture. Resour. Effic. Technol. 2016, 2, 61–67. [Google Scholar] [CrossRef] [Green Version]
  22. Wang, S.; Tan, K.H. Flexural performance of reinforced carbon nanofibers enhanced lightweight cementitious composite (CNF-LCC) beams. Eng. Struct. 2021, 238, 112221. [Google Scholar] [CrossRef]
  23. Wang, L.; Aslani, F. Development of self-sensing cementitious composites incorporating CNF and hybrid CNF/CF. Construct. Build. Mater. 2021, 273, 121659. [Google Scholar] [CrossRef]
  24. Petukhova, E.S.; Fedorov, A.L.; Bauman, Y.I.; Zdanovich, A.A.; Mishakov, I.V.; Matsko, M.A. Reinforcing of polyethylene with carbon nanofibers: An approach to improve CNF distribution via pre-coating of CNF surface by PE. J. Phys. Conf. Series 2021, 1889, 022089. [Google Scholar] [CrossRef]
  25. Nanni, F.; Travaglia, P.; Valentini, M. Effect of carbon nanofibres dispersion on the microwave absorbing properties of CNF/epoxy composites. Compos. Sci. Technol. 2009, 69, 485–490. [Google Scholar] [CrossRef]
  26. He, S.; Yang, E.-H. Strategic strengthening of the interfacial transition zone (ITZ) between microfiber and cement paste matrix with carbon nanofibers (CNFs). Cement Concrete Compos. 2021, 119, 104019. [Google Scholar] [CrossRef]
  27. Shelepova, E.V.; Vedyagin, A.A.; Mishakov, I.V.; Noskov, A.S. Simulation of hydrogen and propylene coproduction in catalytic membrane reactor. Int. J. Hydrogen Energ. 2015, 40, 3592–3598. [Google Scholar] [CrossRef]
  28. Shelepova, E.V.; Vedyagin, A.A. Theoretical prediction of the efficiency of hydrogen production via alkane dehydrogenation in catalytic membrane reactor. Hydrogen 2021, 2, 362–376. [Google Scholar] [CrossRef]
  29. Zavarukhin, S.G.; Kuvshinov, G.G. Mathematic modeling of the process of production of nanofibrous carbon from methane in an isothermal reactor with a fixed bed of the Ni–Al2O3 catalyst. Chem. Eng. J. 2006, 120, 139–147. [Google Scholar] [CrossRef]
  30. Zavarukhin, S.G.; Kuvshinov, G.G. Mathematical modeling of the continuous process for synthesis of nanofibrous carbon in a moving catalyst bed reactor with recirculating gas flow. Chem. Eng. J. 2008, 137, 681–685. [Google Scholar] [CrossRef]
  31. Chen, Q.; Lua, A.C. Kinetic reaction and deactivation studies on thermocatalytic decomposition of methane by electroless nickel plating catalyst. Chem. Eng. J. 2020, 389, 124366. [Google Scholar] [CrossRef]
  32. Zhang, Y.; Smith, K.J. A kinetic model of CH4 decomposition and filamentous carbon formation on supported Co catalysts. J. Catal. 2005, 231, 354–364. [Google Scholar] [CrossRef]
  33. Borghei, M.; Karimzadeh, R.; Rashidi, A.; Izadi, N. Kinetics of methane decomposition to COx-free hydrogen and carbon nanofiber over Ni–Cu/MgO catalyst. Int. J. Hydrogen Energ. 2010, 35, 9479–9488. [Google Scholar] [CrossRef]
  34. Zavarukhin, S.G.; Kuvshinov, G.G. The kinetic model of formation of nanofibrous carbon from CH4–H2 mixture over a high-loaded nickel catalyst with consideration for the catalyst deactivation. Appl. Catal. A-Gen. 2004, 272, 219–227. [Google Scholar] [CrossRef]
  35. Wang, H.Y.; Lua, A.C. Deactivation and kinetic studies of unsupported Ni and Ni–Co–Cu alloy catalysts used for hydrogen production by methane decomposition. Chem. Eng. J. 2014, 243, 79–91. [Google Scholar] [CrossRef]
  36. Demicheli, M.C.; Ponzi, E.N.; Ferretti, O.A.; Yeramian, A.A. Kinetics of carbon formation from CH4-H2 mixtures on nickel-alumina catalyst. Chem. Eng. J. 1991, 46, 129–136. [Google Scholar] [CrossRef]
  37. Alstrup, I.; Tavares, M.T. Kinetics of carbon formation from CH4 + H2 on silica-supported nickel and Ni-Cu catalysts. J. Catal. 1993, 139, 513–524. [Google Scholar] [CrossRef] [Green Version]
  38. Bird, R.B.; Stewart, W.E.; Lightfoot, E.N. Transport Phenomena, 2nd ed.; John Wiley & Sons, Inc.: New York, NY, USA, 2006; 928p. [Google Scholar]
  39. Salmi, T.O.; Mikkola, J.-P.; Warna, J.P. Chemical Reaction Engineering and Reactor Technology, 1st ed.; CRC Press: Boca Raton, FL, USA, 2010; 644p. [Google Scholar] [CrossRef]
  40. Chesnokov, V.V.; Buyanov, R.A. The formation of carbon filaments upon decomposition of hydrocarbons catalysed by iron subgroup metals and their alloys. Russ. Chem. Rev. 2000, 69, 623–638. [Google Scholar] [CrossRef]
Figure 1. Schematic diagram of the catalyst preparation approach.
Hydrogen 03 00028 g001
Figure 2. Schematic drawing of the setup applied for the kinetic studies (a) and exterior view of the reactor (b): (1)–vessels with gases; (2)–flow-through quartz reactor; (3)–furnace; (4)–quartz spring; (5)–quartz basket with the sample.
Hydrogen 03 00028 g002
Figure 3. XRD pattern (a), SEM (b) and TEM (c) images of the catalyst prepared by the mechanochemical activation method.
Hydrogen 03 00028 g003
Figure 4. Effect of the presence of hydrogen in the reaction mixture (mcat = 10 mg, GCH4 = 24 L/h, GH2 = 0 or 3.6 L/h). The inset shows an enlarged area of the main plot.
Hydrogen 03 00028 g004
Figure 5. Carbon accumulation during the methane decomposition in the presence of hydrogen at varied temperatures (mcat = 10 mg, GCH4 = 24 L/h, GH2 = 3.6 L/h): (a) in a range of 500–610 °C; (b) in a range of 610–650 °C. The corresponding values of carbon yield (CY) are shown below the temperature values. Hydrogen yield for the studied temperatures (c).
Hydrogen 03 00028 g005
Figure 6. Carbon yield during the decomposition of methane–hydrogen mixture: (a) comparison of the catalyst loading; (b) comparison of the catalyst loading and the gas flow rates at different temperatures.
Hydrogen 03 00028 g006
Figure 7. Photographs of the quartz basket: (a) with the initial catalyst; (b) with the carbon product, after 2 h experiment at 625 °C.
Hydrogen 03 00028 g007
Figure 8. SEM images of the carbon nanofibers obtained via the decomposition of the methane–hydrogen mixture at (a,b) 550 °C; (c,d) 600 °C; (e,f) 625 °C.
Hydrogen 03 00028 g008aHydrogen 03 00028 g008b
Figure 9. TEM images of the carbon nanofibers obtained via the decomposition of methane–hydrogen mixture at 625 °C. The magnification is (a) 25,000×; (b) 50,000×; (c) 600,000×.
Hydrogen 03 00028 g009
Figure 10. Kinetic modelling of the carbon deposition at various temperatures: (a) model D1a; (b) model M1a. Experimental data are shown by symbols, while modelling results are presented by solid lines.
Hydrogen 03 00028 g010
Table 1. Textural characteristics (specific surface area, SSA, and pore volume, Vpore) and the content of residual catalyst (CRC) for CNF samples obtained via decomposition of CH4/H2 mixture over NiO-CuO/Al2O3 catalyst at 550, 600 and 625 °C.
#Temperature, °CCY, g/gcatSSA, m2/gVpore, cm3/gCRC, wt%
155015.21740.166.74
260032.21470.193.33
362530.11200.183.56
Table 2. The input parameters of the mathematical model.
ParameterValueParameterValue
Weight of the catalyst (mcat), mg10CH4 input concentration (CCH4,in), mol/m338.7
Time (t), h2H2 input concentration (CH2,in), mol/m3 5.79
Methane flow rate (GCH4), L/h24Volume of the gas mixture (Vmix), m30.245 × 10−3
Hydrogen flow rate (GH2), L/h3.6Volume of the catalyst (Vcat), m37.3 × 10−9
Publisher’s Note: MDPI stays neutral with regard to jurisdictional claims in published maps and institutional affiliations.

