1. Introduction
In the case of unscheduled hydrogen release or release through a thermally activated pressure relief device (TPRD) from high-pressure equipment or storage facility, a highly turbulent jet is formed. The delayed ignition of the hydrogen jet generates an overpressure that could harm people and damage civil structures and other property, e.g., those located near hydrogen-powered vehicles. Experiments showed that, for example, the delayed ignition of a hydrogen jet through a 10 mm orifice from 65 MPa storage generated a deflagration overpressure of 20 kPa at a distance of 4 m from the release point [
1]. This overpressure is above the serious injury threshold of 16.5 kPa [
2].
Several experimental studies have been carried out on the delayed ignition of under-expanded hydrogen jets. In 2007, Takeno et al. [
1] performed a study of the effect of leakage diameter and ignition delay time on the generated blast wave overpressure. The flame propagation velocity reported in these experiments achieved 978 m/s that indicates a fast deflagration regime. Larger release diameters demonstrated a stronger effect of ignition delay time due to significant variations in release conditions and flow turbulence levels [
1]. The authors observed that blast wave overpressure increased with the increase of release diameter in the range 0.5–10.0 mm [
1]. These experiments were performed at storage pressures up to 65 MPa. In 2011, Royle and Willoughby [
3] performed a series of experiments at lower storage pressure of 20 MPa with nozzle diameters in the range 1.5–9.5 mm. Overpressure in the test with the smallest 1.5 mm orifice diameter with 400 ms ignition delay was not recordable by pressure transducers. Similar to Takeno et al. [
1], they observed that measured overpressure at 1.5 m from the jet axis was increasing with the release orifice diameter, rising from 2.1 kPa to 5.4 kPa (both above the slight injury threshold of 1.35 kPa [
2]) for release diameter 3.2 mm and 9.4 mm, respectively. The experimental studies demonstrated that ignition delay time significantly affects the blast wave overpressure. In the initial phase of release, the jet is not yet established, i.e., it is an unsteady jet with considerable variation of hydrogen concentration in space and time. The experiments conducted at storage pressure 20 MPa and ignition delay varying from 400 ms to 2000 ms at a location 2 m from the release point on the jet axis led to overpressures, respectively, 3.7 kPa and 9.5 kPa [
3]. The highest overpressure of 19.4 kPa in these experiments with comparatively low storage pressure of 20 MPa (compared to storage pressure at hydrogen refuelling stations up to 100 MPa) was achieved at 600 ms ignition delay. In 2014, Grune and colleagues [
4] studied the delayed ignition of hydrogen jets from a 4 mm orifice at initial storage pressure of 20 MPa. The overpressure recorded at 80 cm from the nozzle along the jet axis and 50 cm perpendicularly to the jet axis was 18 kPa for a comparatively short 25 ms delay, whereas it decreased to 8 kPa for delays longer than 70 ms. In 2015, Daubech with co-authors [
5] reported results of experiments with comparatively low storage pressure of only 4 MPa but a comparatively large release orifice diameter of 12 mm. At a distance of 2 m downstream of the ignition point along the jet axis and 0.2 m below the jet axis (distance between the horizontal jet axis and ground was 1.5 m), the highest overpressure was 8 kPa. The maximum recorded flame propagation velocity in these tests was 280 m/s.
The experiments mentioned above were performed for hydrogen releases at ambient temperature. Experimental data are also available for hydrogen releases at cryogenic temperatures. In 2012, Friedrich et al. [
6] investigated the stability and propagation of flame for cryogenic hydrogen releases with temperature in the range 35–65 K and pressure at the release pipe up to 3.5 MPa from nozzles of diameter 0.5–1.0 mm. The authors measured the sound levels produced by the steady-state unignited jets, the ignition process and during the established jet fire. It was found that ignited jets produced a sound level of about 100 dB (A), which is approximately 10 dB (A) higher than unignited jets. During the ignition phase, peaks of 110 dB (A) were reached for the tests with a release diameter of 1 mm. It was concluded by the authors that the measured sound level was not sufficient to pose health hazards at distances as close as 1.2 m from the release point for a short-term exposure for the studied conditions. On the other hand, the produced noise could be a useful means to identify the presence of hydrogen jet fire and its location. It should be underlined that sound levels were measured in tests with comparatively small nozzle diameters 0.5–1.0 mm and pressures below 3.5 MPa. Indeed, the ignition and follow-up explosion of liquid hydrogen releases could produce extreme overpressures, as witnessed in [
7]. In one test, as the cryogenic hydrogen-air cloud above the “spill” was ignited, it burnt back to the release source and “frozen” products on the ground below. Then a secondary strong explosion took place, which appeared to emanate from the “frozen” products formed by liquid hydrogen and condensed oxygen of the air. The role of wind in this particular test should be still investigated further as it is possible that the wind facilitated the selective enrichment of liquid hydrogen mostly by liquid oxygen rather than nitrogen, which has a lower condensation temperature. An extensive experimental campaign of about 300 tests on ignition of hydrogen releases at ambient and cryogenic temperature was performed by Friedrich et al. [
8] within the European project PRESLHY “Pre-normative research for safe use of liquid hydrogen”. This series of experiments confirmed that when the cryogenic hydrogen jet is ignited, a strong explosion with the formation of a spherical blast wave may occur. The produced overpressure increases with nozzle diameter, whereas the generated maximum pressure load is not significantly affected by the hydrogen storage temperature. Measurements showed that for a jet fire with nozzle diameter 2 mm and initial storage pressure 10 MPa, the decrease of initial storage temperature from ambient to cryogenic (80 K) led to an increase in local maximum combustion temperature from the range 540–1100 K to the range 710–1330 K. As a consequence, the corresponding maximum heat flux increased from 85 kW/m
2 to 177 kW/m
2 in the central part of the jet fire. Experimentalists considered that the reason of such a difference is due to a more than the twice higher mass flow rate at cryogenic temperature and also a four times larger hydrogen inventory [
9].
In 2017, Jallais et al. [
10] proposed a model for predicting overpressure hazards from delayed ignition of a jet. The model assumes that the mass contributing to the deflagration is that in the cloud with a concentration of hydrogen in the air within the range of 10–75% by volume. The authors related the TNO Multi-Energy (TNO ME) strength index to the hydrogen mass flow rate and different values were recommended depending on hydrogen concentration at ignition point for only six experimental tests available in the literature. However, the study did not include a comparison between the model predictions of blast wave overpressure and the experimental measurements to assess the predictive capability of the model. Authors in [
11] expanded the relation of TNO ME strength index to hydrogen jets with storage pressure and mass flow rate up to 40 MPa and 8 kg/s, respectively. In 2019, Bauwens and Dorofeev [
12] assumed that a fraction of the hydrogen jet premixture transits to detonation and this defines the blast wave overpressure after delayed ignition of a jet. This fraction was determined by using the constraints on the critical number of detonation cells fitting within the volume of mixture able to detonate and the critical concentration gradient for the survival of a detonation wave. The fraction of the jet participating in the detonation was increasing with release rates. Unfortunately, this model was compared to only two experiments described in the study [
13]. The applicability of the discussed two models to cryogenic temperature hydrogen jets is yet to be demonstrated.
Computational studies on the delayed ignition of turbulent hydrogen jets were performed in [
5,
14,
15]. Authors in [
14] modelled experiments in [
5] demonstrating that a 3D RANS approach instead of an axisymmetric 2D model is needed in CFD simulations to capture accurately the dispersion and explosion dynamics of the jets. Authors in [
15] used a LES approach to simulate the transient flame evolution following the delayed ignition of the hydrogen jet. While computational modelling can be a powerful tool to model complex scenarios and initial conditions, it may result in time expensive evaluations. Validated engineering tools and correlations are currently needed to obtain an immediate and accurate estimation of damage in case of the delayed ignition of turbulent jets for hydrogen safety engineering.
The experimental studies showed that the blast wave overpressure strongly depends on release conditions, i.e., pressure and orifice diameter, and ignition parameters, i.e., delay time and location. The experimental studies themselves are limited in number for selected conditions and thus unable to predict conservative (maximum possible) blast wave overpressure for arbitrary conditions of the delayed ignition of a hydrogen under-expanded jet.
This study aims at developing an engineering correlation for predicting the maximum blast wave overpressure generated by the delayed ignition of a free hydrogen under-expanded jet for any hydrogen storage pressure, temperature and release diameter. The correlation was built using the similitude analysis and data of 78 experiments performed at storage pressure in the range 0.5–65.0 MPa and release diameter from 0.5 mm to 52.5 mm. The applicability domain of the correlation includes hydrogen releases at cryogenic temperatures down to 80 K.
3. The Similitude Analysis
The main two parameters affecting the overpressure produced by delayed ignition of hydrogen under-expanded jets are identified as hydrogen storage pressure and release nozzle diameter. The increase of either parameter increases the volume of the fast-burning turbulent hydrogen-air mixture in the jet and thus the overpressure in the blast wave. The first step in the analysis is the consideration of the effect of storage conditions. It is reasonable to assume, following experimental observations, that deflagration overpressure grows with storage pressure,
(Pa), as the storage pressure increases the diameter of the notional nozzle exit (and thus the size of the fast-burning mixture in the jet). The notional nozzle exit diameter is proportional to square root from the storage pressure
[
17]. Thus, the first dimensionless parameter is taken as
, where
is the ambient pressure (Pa).
The acoustic theory states that for spherical symmetry the overpressure generated by expanding sphere, i.e., spherical “piston” moving without acceleration/deceleration, is proportional to the square of the velocity of the “piston”. Therefore, it is apparent to assume that only the most fast-burning fraction of hydrogen-air mixture in the jet will define the maximum overpressure in the blast wave. The contribution of hydrogen combustion to maximum pressure beyond this concentration range can be neglected. This assumption is in line with the conclusions of the study [
18], where it was observed that only a small fraction of a non-uniform hydrogen-air mixture with burning velocity within the narrow range of 95–100% of the maximum value of burning velocity within a vented enclosure defines the maximum vented deflagration overpressure.
Let us define the zone of hydrogen concentrations in the flammable hydrogen–air mixture in the jet that would have the maximum velocity of expanding gas. The effect of laminar burning velocity,
(m/s), combustion products expansion coefficient,
(
-), the Karlovitz’s turbulence generated by the flame itself,
(
-), and the preferential diffusion phenomenon in turbulent flames, i.e., the leading point concept flame acceleration,
(
-) and flow turbulence,
(
-), can be accounted for in the calculation of the “piston” velocity,
(m/s), using data [
19]:
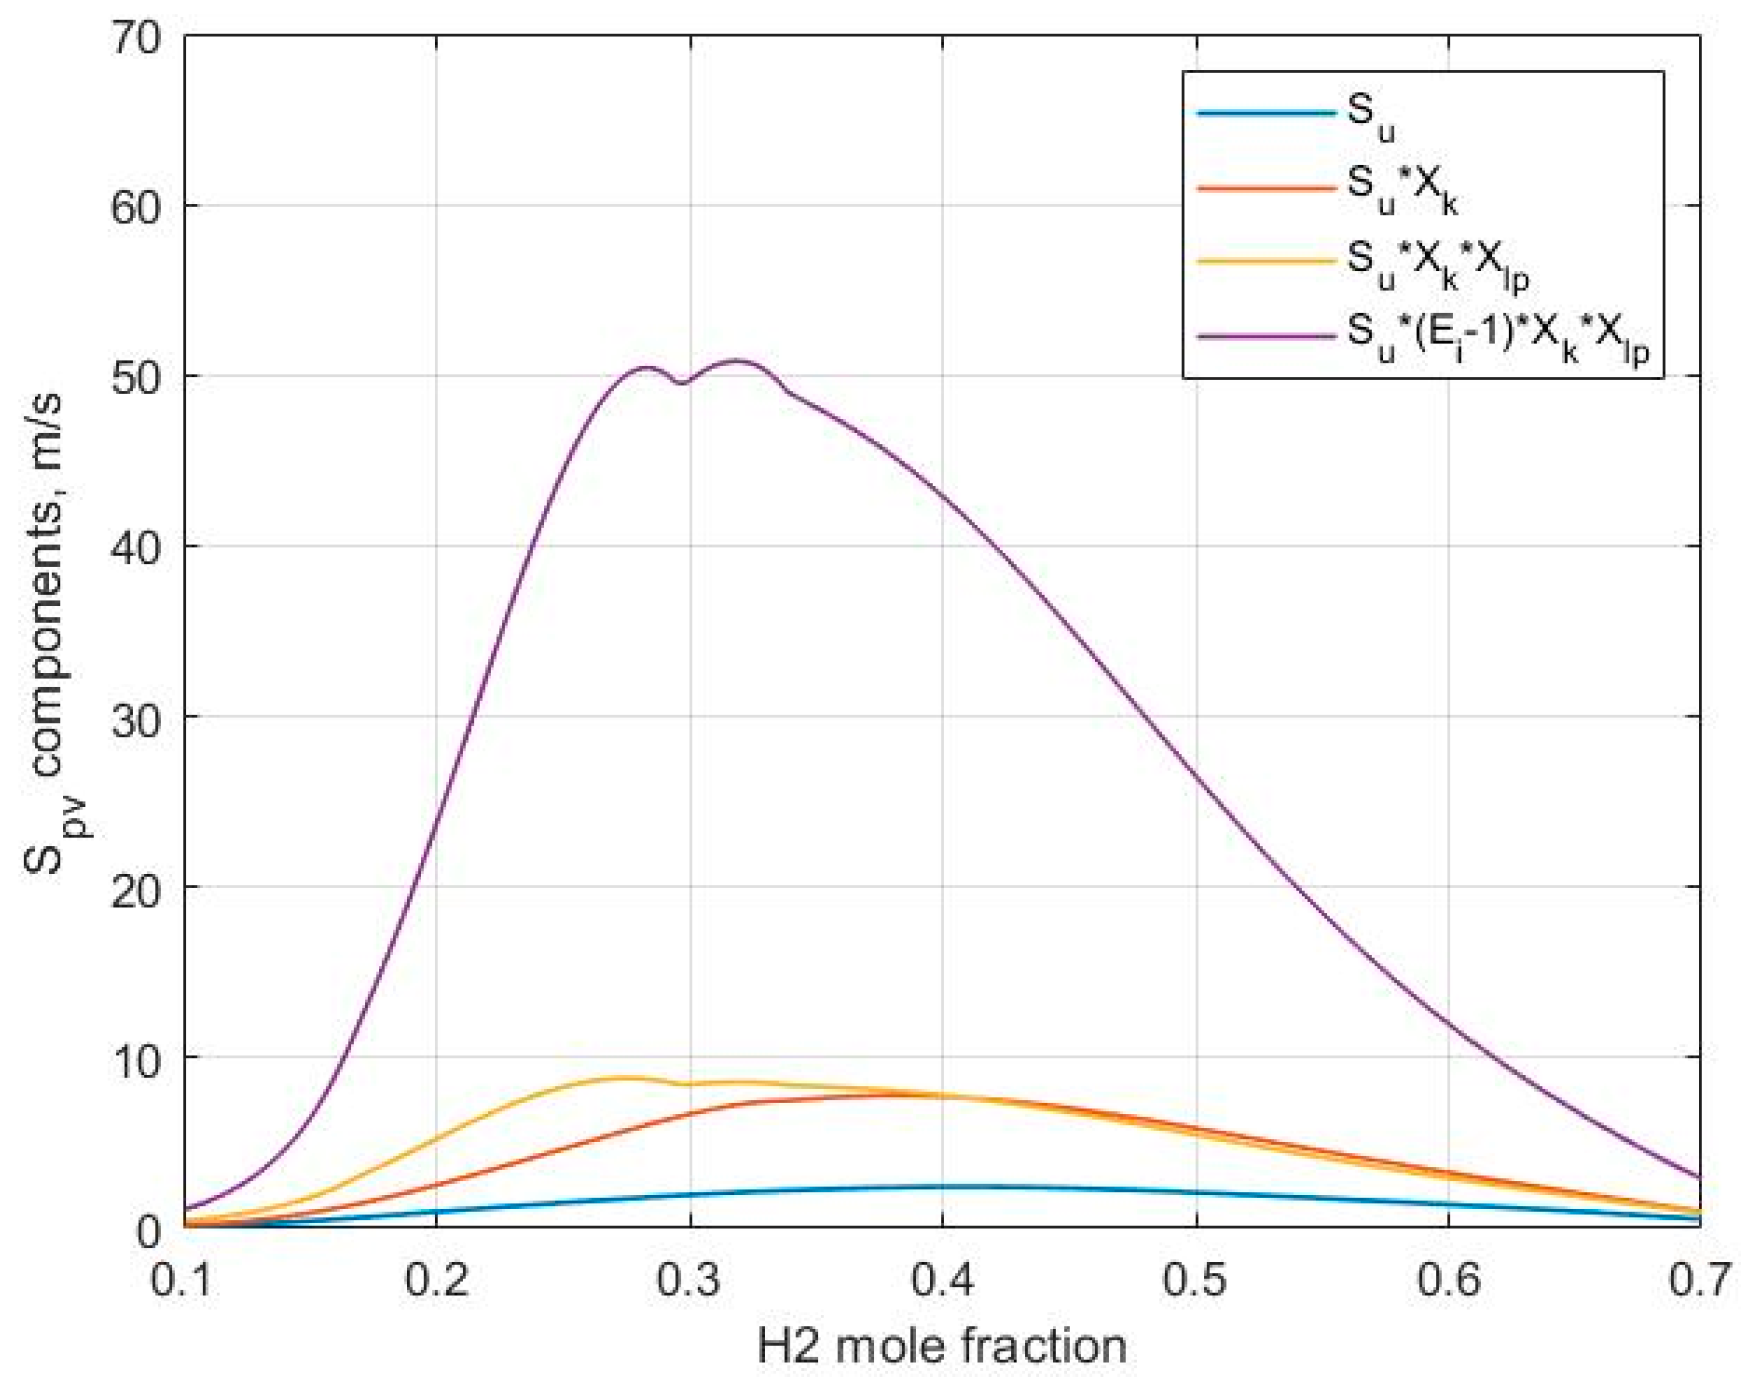
Figure 2 shows four components of the “piston” velocity,
, as the functions of hydrogen mole fraction in the mixture with air. The theoretical maximum value of
is assumed in highly turbulent conditions of an under-expanded jet. It is not trivial to estimate the effect of flow turbulence,
, for arbitrary release and ignition conditions as it could vary with a scenario. Yet, the contribution of the flow turbulence,
, can be assessed using Yakhot’s transcendental equation for premixed turbulent combustion, derived from the renormalization group theory [
20]:
, where
is the fluctuating velocity component (m/s) and
is the turbulent burning velocity (m/s),
. The
term is dependent on the jet fluctuating velocity, which in turn is proportional to the jet velocity. The velocity decay along the jet axis is determined by properties at the release nozzle, which are dependent on the storage pressure considered in the first dimensionless parameter
. However, the flow turbulence is also dependent on case conditions, such as the ignition delay and release system, e.g., ignition at initial stage of release or ignition in quasi steady-state jet conditions, ignition location and energy, etc. Thus, it is not possible to accurately estimate the parameter
as only function of hydrogen mole fraction for arbitrary release and ignition conditions, and this parameter will not be included in the analysis focusing on the estimation of maximum
as the only function of hydrogen concentration in the jet.
Figure 2 shows the “piston” velocity components defined by Equation (1), with the exclusion of
as per explanation above, as functions of hydrogen mole fraction in the mixture with air. The maximum velocity of the “piston”, which defines the maximum generated pressure in the blast wave according to the acoustic theory, reaches its maximum for a near-stoichiometric mixture of 25–35% of hydrogen by volume with the centre assumed at location of 30% mixture.
The location on the jet axis corresponding to 30% by volume of hydrogen in air (
) is taken in our model as a centre of the fast-burning turbulent hydrogen-air mixture that will deflagrate and generate blast wave propagating outwards. The location of this centre can be calculated using the similarity law for momentum-dominated under-expanded jets [
17]:
where
and
are the densities of hydrogen at the real nozzle exit and the surrounding air (
),
is the mass (not volumetric!) hydrogen concentration in the stoichiometric mixture with air and
is the real (not notional!) nozzle exit diameter (
m). The distance between the centre of the 25–35% flammable cloud, i.e., location of 30% mixture, and the pressure sensor in the experiments or “target” (human or structure) location in incident is denoted here as
(
m). The experiments demonstrated that the overpressure in the blast wave depends on the release diameter [
1,
3]. Apparently, the blast wave overpressure decreases with the increase of distance from the jet. Therefore, the second dimensionless parameter is defined as the ratio of the orifice diameter,
, to the distance
as
. The two dimensionless parameters can be combined, following the similitude analysis rules, into one dimensionless number:
Thus, the dimensionless overpressure in the deflagration blast wave,
, can be represented as a function of the dimensionless parameter in Equation (3):
The derived conservative correlation is calibrated against experimental data on overpressure measurements and conditions in the next section, including optimisation against different values of powers m and n.
4. The Correlation Calibration
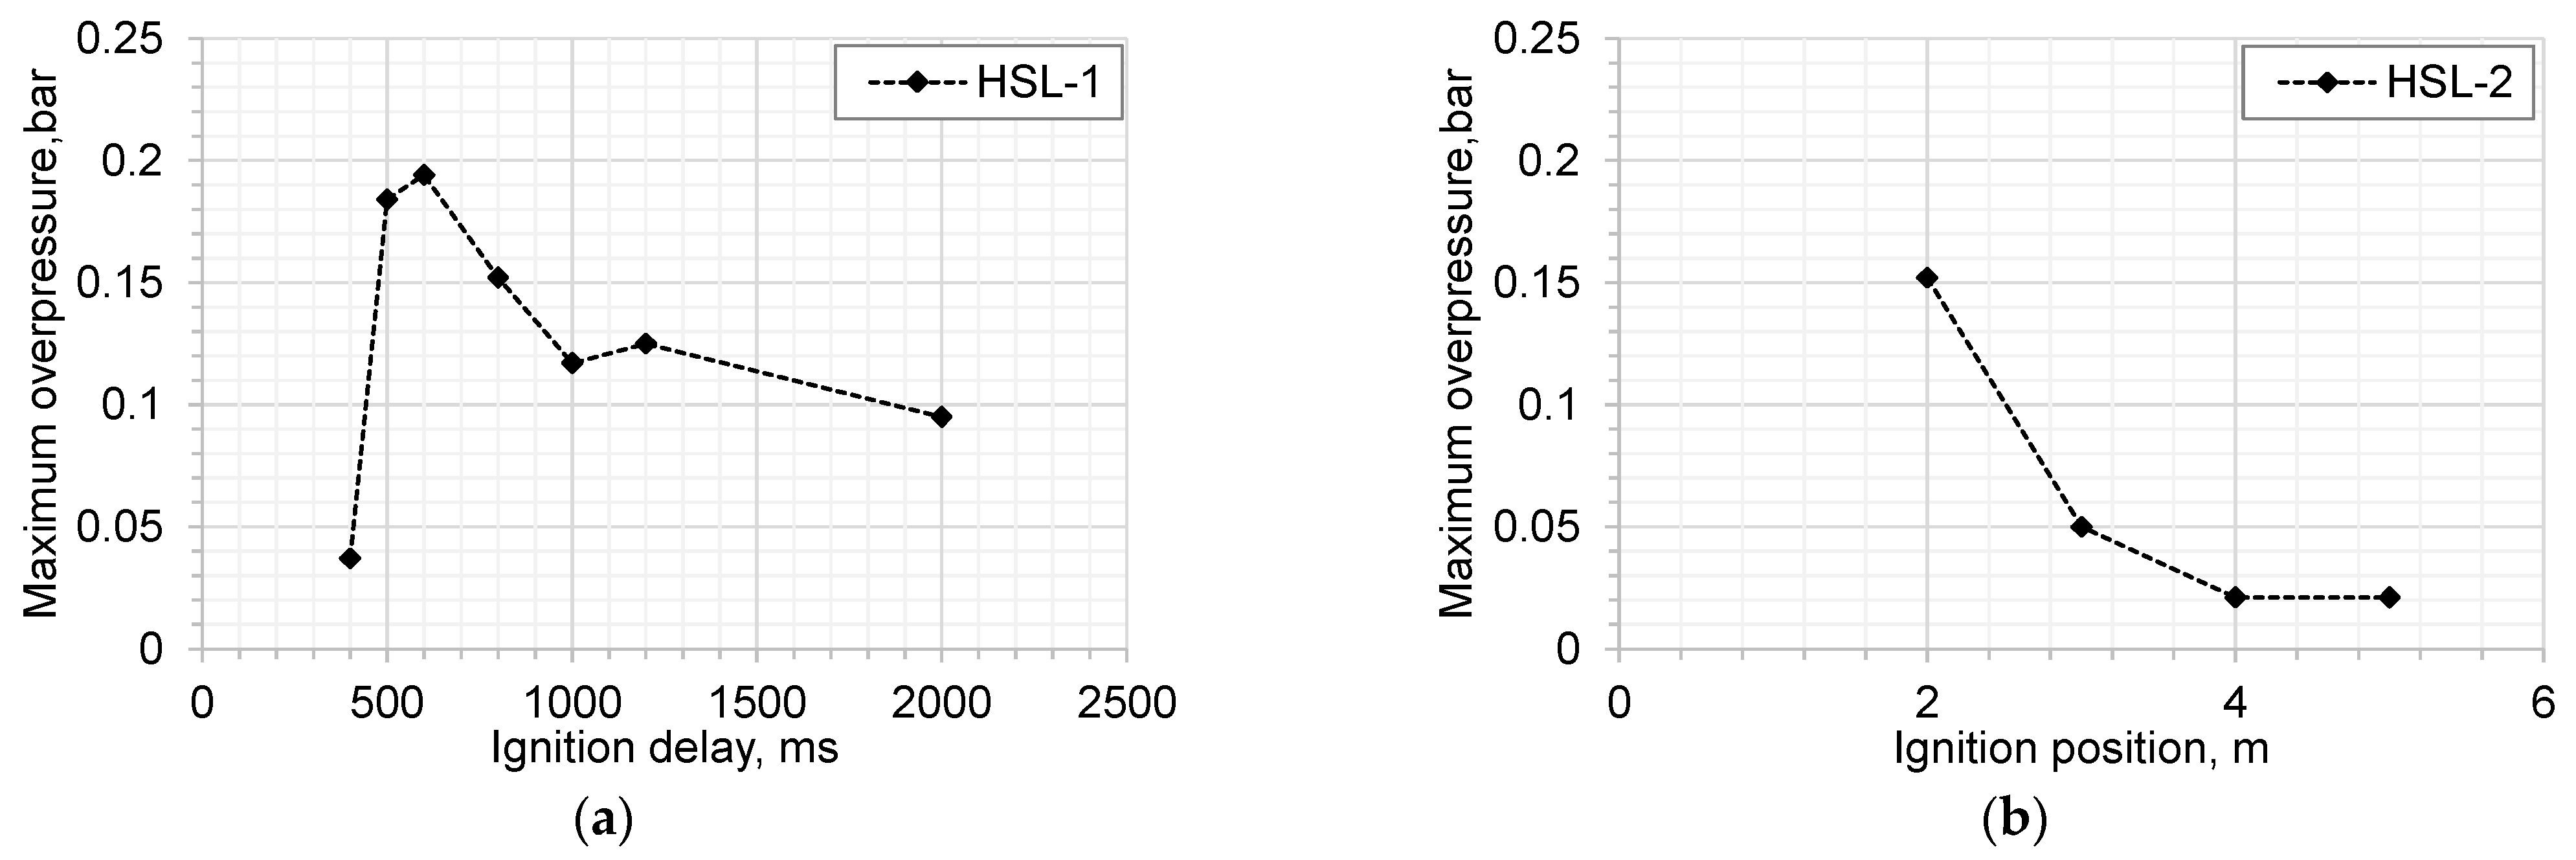
The generated blast wave pressure is strongly affected by the ignition source location and ignition delay after the start of release. The ignition location can be in the hydrogen-rich or hydrogen-lean part of the jet affecting flame propagation regime, i.e., combustion process, and thus generated overpressure. The ignition delay determines whether the ignition of the hydrogen jet takes place at the initial highly turbulent unsteady stage of the jet or later in a well-established jet at conditions of reduced with time turbulence due to the reduction of pressure during equipment blowdown. As an example, HSL-1 tests recorded overpressures that grow from a minimum of 3.7 kPa for an ignition delay of 400 ms (when the flammable envelope just reaches the ignition source location) to a maximum of 19.4 kPa for an ignition delay of 600 ms (when ignition happened in the area of near-stoichiometric mixture), see
Figure 1a. The further increase of the ignition delay led to a decrease in recorded overpressure, down to 9.5 kPa for an ignition delay of 2 s.
The dimensionless parameters in Equation (4) are defined by the storage pressure, release nozzle exit diameter and the target location. Consequently, a scattering of experimental dimensionless overpressure, , is expected for the same storage pressure and release nozzle diameter (determining the abscissa in the following figures) but different ignition parameters, i.e., ignition delay and location. This study aims at the derivation of an experimentally based conservative correlation for determining the maximum overpressure that can be generated by delayed ignition of a hydrogen jet for arbitrary ignition conditions. Therefore, only the maximum overpressure ratio measured in the experiments with the same release conditions but different ignition parameters are used to build the conservative correlation. This is the case for the experimental series HSL-1 and 2, PS-1 to PS-5, PRESLHY-6, 7, 8C and 4C. Experimental series NEDO-1: GE7A, GE7B and GE8 were performed with the same release conditions. Among these, only tests in series NEDO-1:GE8 will be shown as they had the largest number of pressure sensors and recorded the highest overpressure. It should be underlined that the maximum recorded pressure in a particular experiment is not necessary the maximum theoretical value that can be achieved only if the “proper” selection of ignition location and delay in that experiment could be carried out.
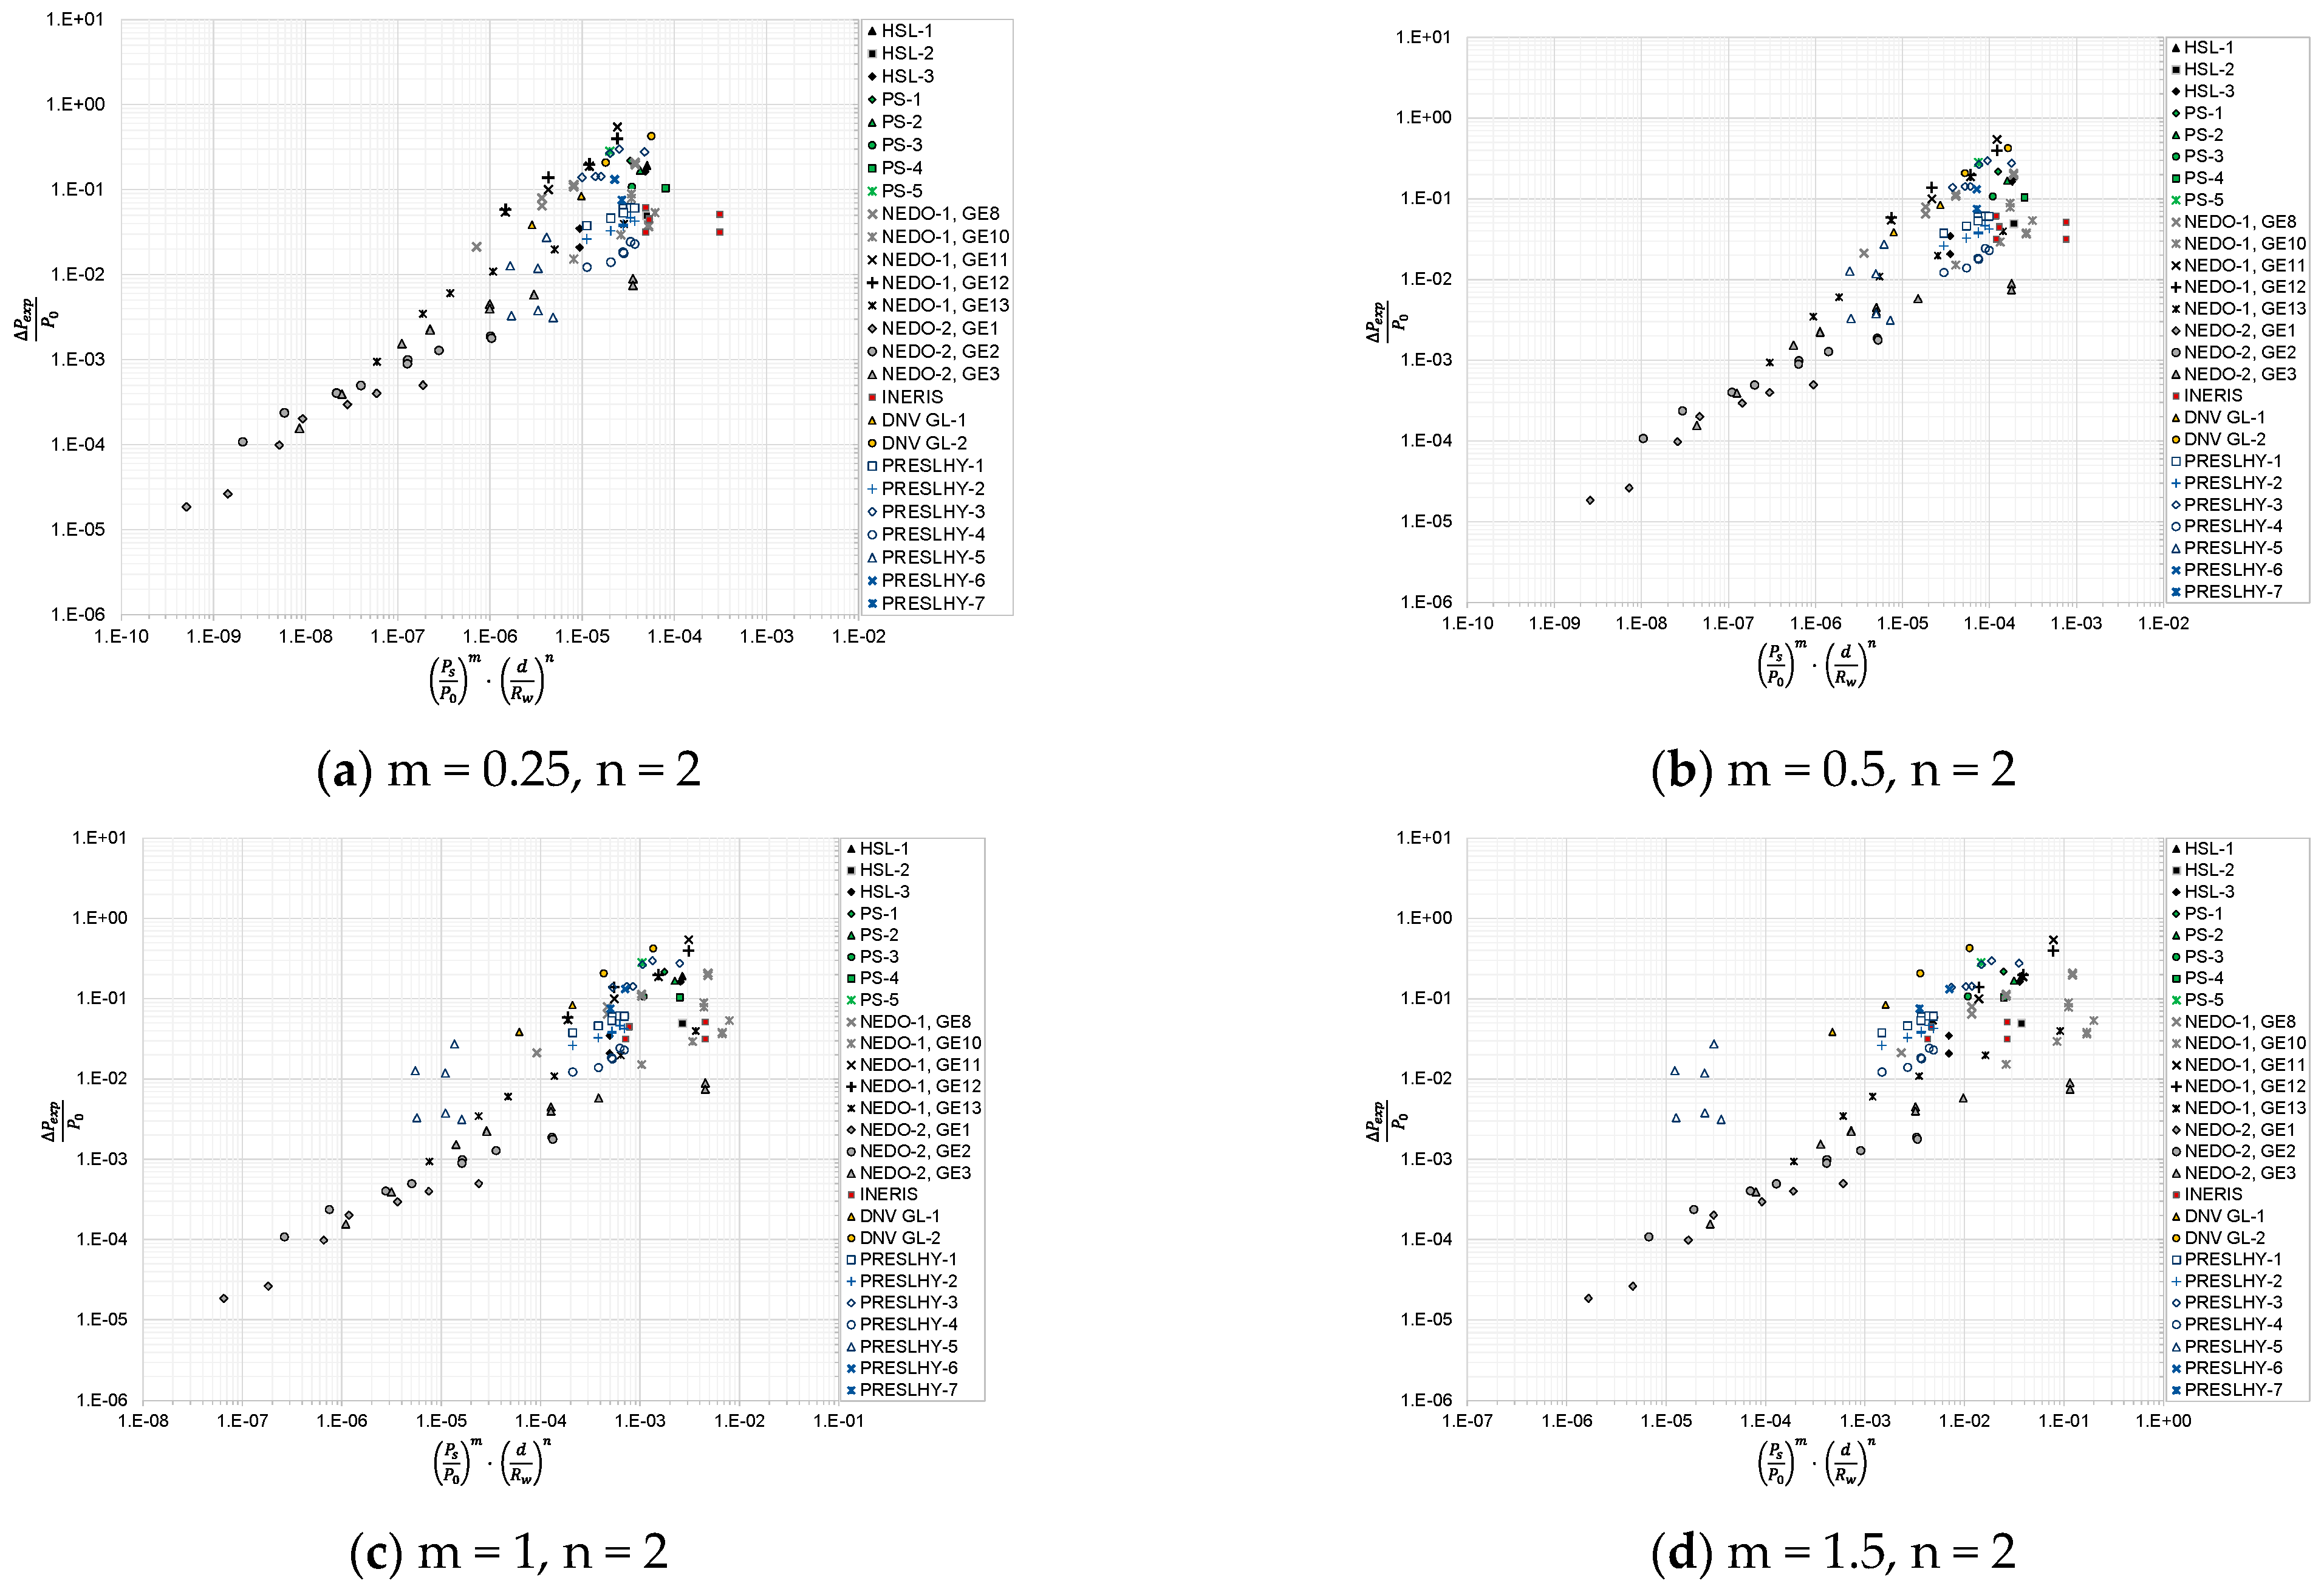
Experimental data are used to calibrate the correlation presented by Equation (4) by varying the power
m of the dimensionless parameter
in the range 0.25–1.50 and the power
n of the dimensionless parameter
in the range 1–3. The correlation of the blast wave overpressure with storage pressure is first investigated by varying the power
m. Let us compare the effect of changing power
m = 0.25, to
m = 0.5,
m = 1 and
m = 1.5 for the preserved value of
n = 2, which is the average value for the range of
n to be assessed.
Figure 3 shows the resulting scatter of the dimensionless experimentally measured overpressures against the dimensionless parameter. It should be noted that scales in
Figure 3a–d are different to better visualise the distribution of plotted data. It can be observed that power
m = 1 and
m = 2 (at fixed
n = 2) poorly represents the correlation for tests with low storage pressure (PRESLHY-5, pressure 0.5 MPa) and the plotted data have a larger scattering along the abscissa, diverging from the near-linear distribution observed for
m = 0.25 and
m = 0.5. The power of
m = 0.5 provides a minimum scatter of the dataset with a better fitting of data points on the regression line compared to
m = 0.25 (+65% relative improvement). This observation agrees with the proportionality of notional nozzle diameter and thus the volume of the fast-burning mixture, to
. The value
m = 0.5 is then applied for the formulation of the correlation to estimate the blast wave overpressure following the delayed ignition of a turbulent under-expanded hydrogen jet.
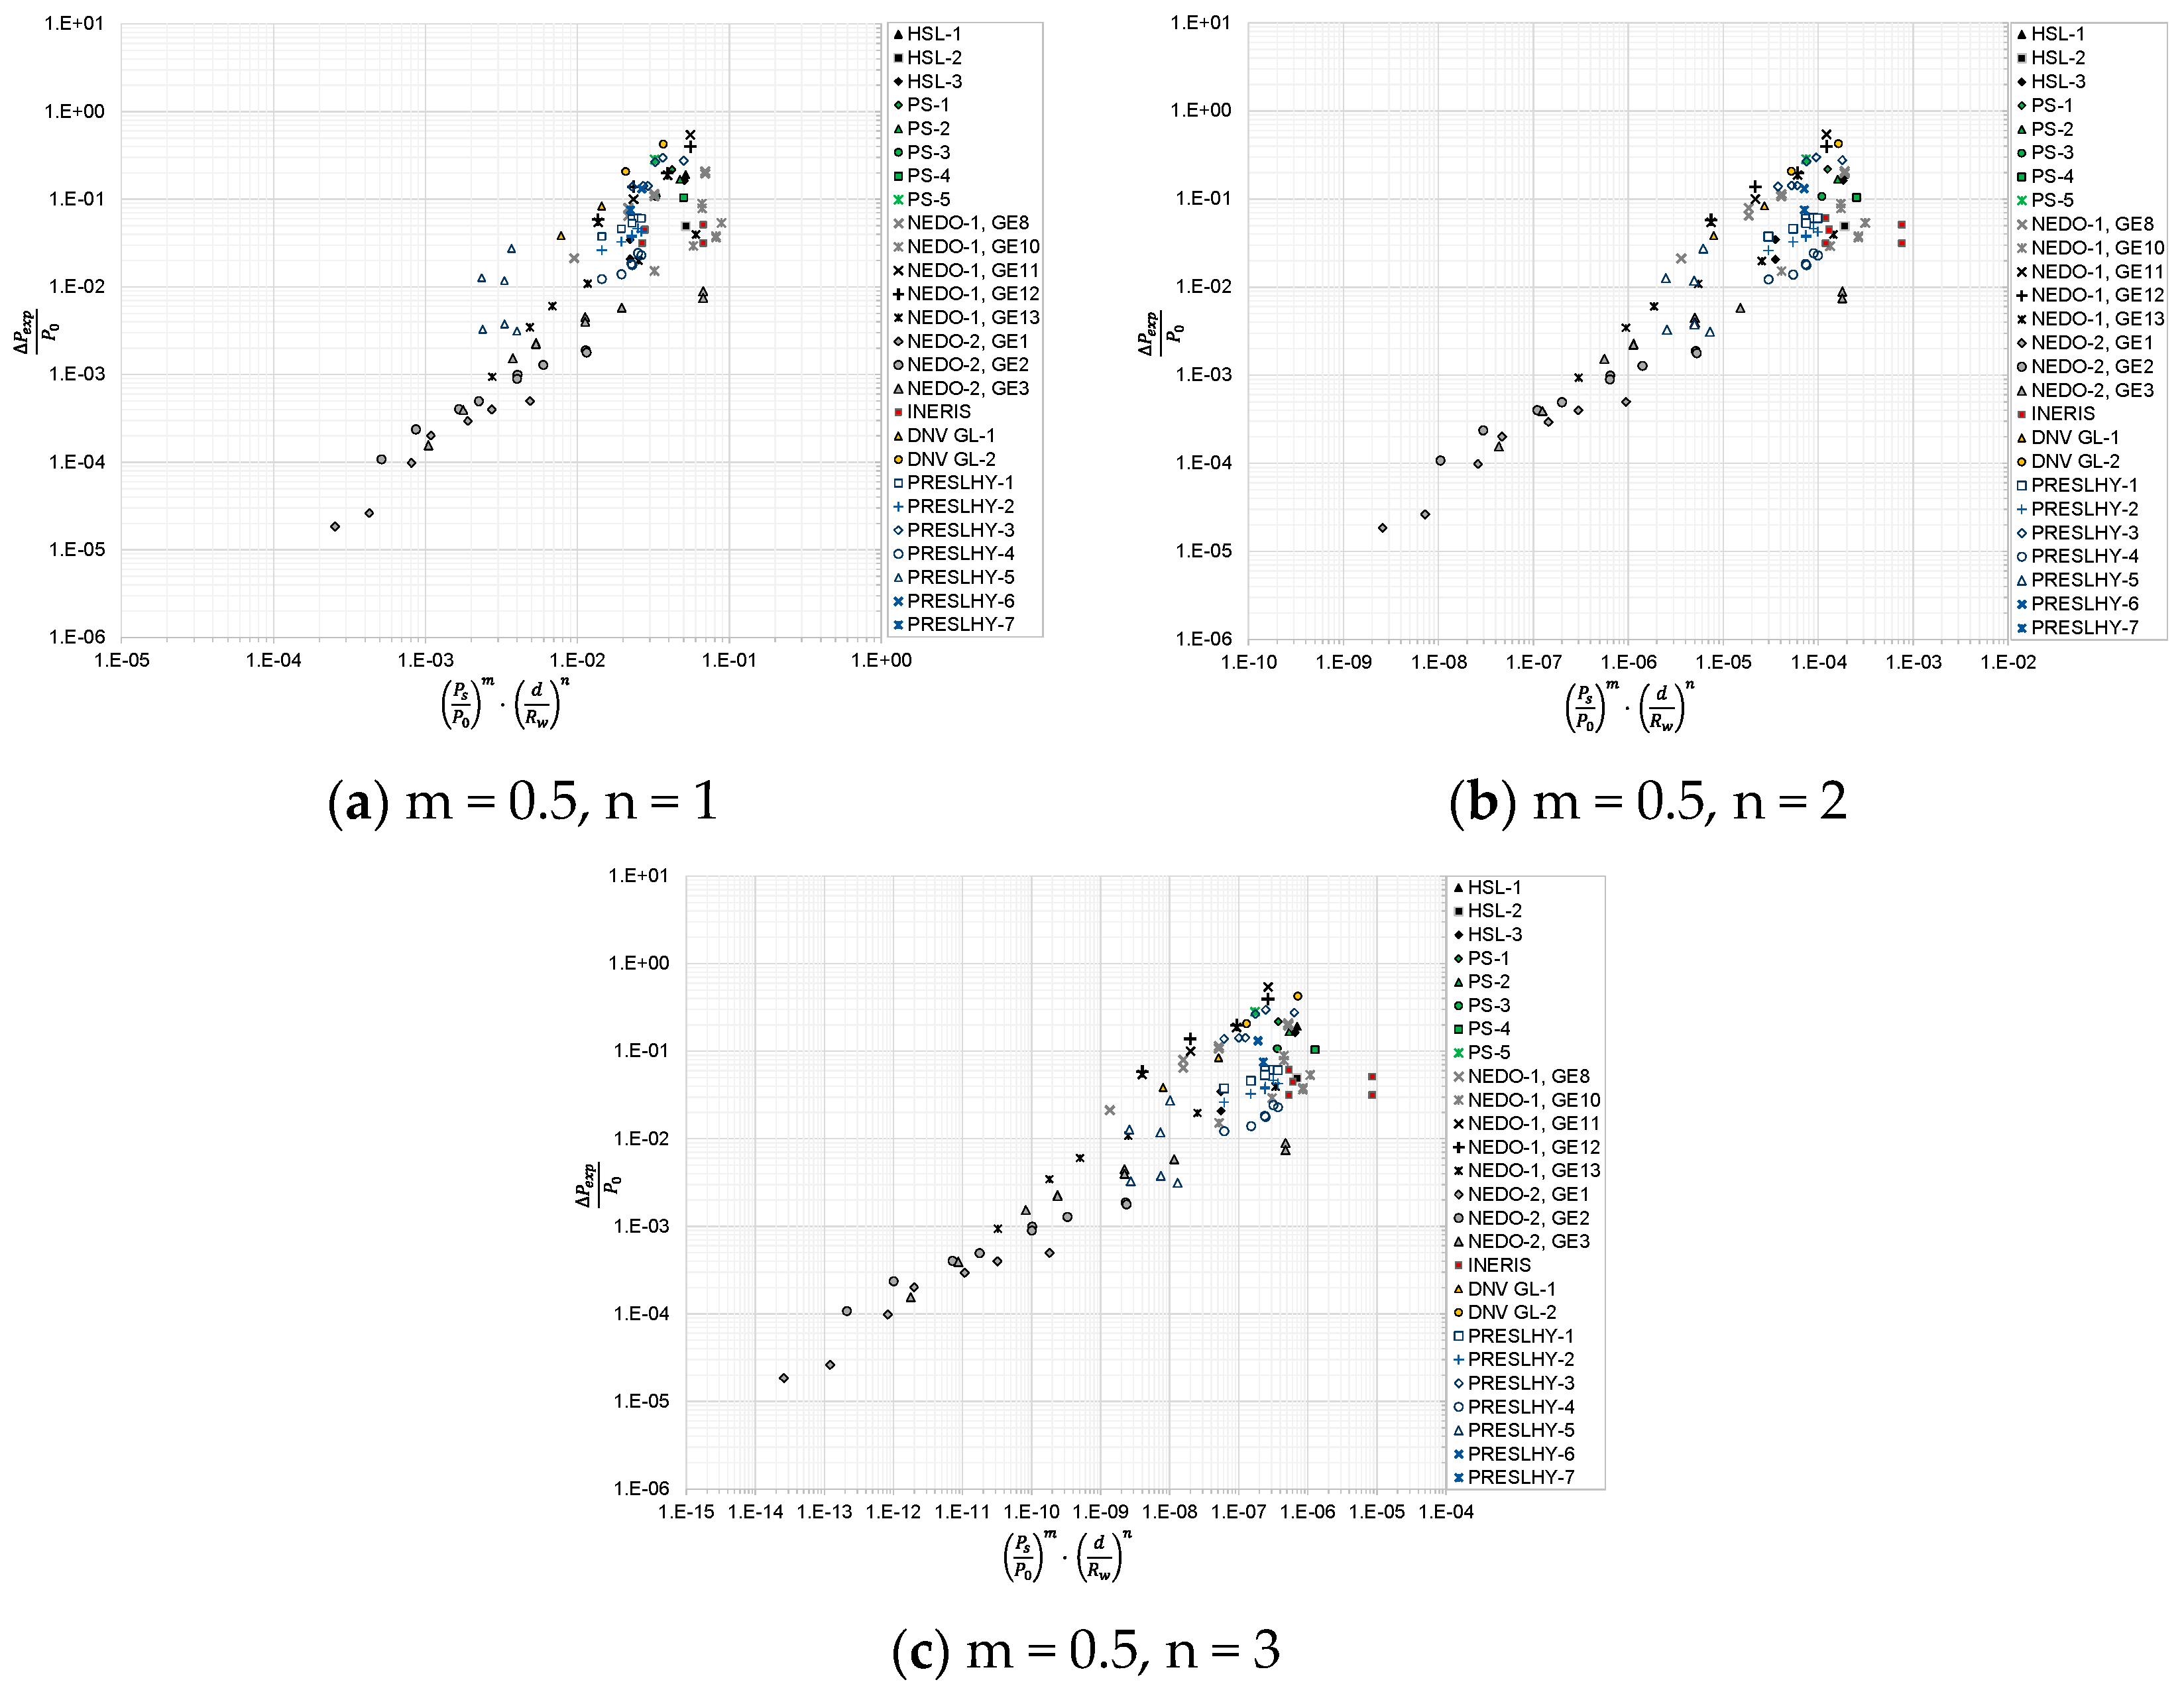
It is known from previous studies that a blast wave from a gaseous deflagration of the quiescent mixture in the open atmosphere exhibits a decay inversely proportional to the distance from the source, i.e.,
and thus in Equation (4) it is reasonable to see the effect of change of power
n = 2 to
n = 1 [
21,
22]. However, this observation is derived from quiescent gaseous mixtures deflagrations. On the other hand, studies [
23,
24] indicate that for high explosives the overpressure decays inversely proportionally to the third power of the distance, i.e., the effect of power change to
n = 3 should be investigated as well. The proportionality of the blast wave overpressure decay with distance is studied by varying the power
n of the dimensionless parameter
.
Figure 4 shows the distribution of the dimensionless experimentally recorded blast wave overpressure from
Table 1 using dimensionless coordinates of Equation (4) for three different powers of
n = 1 (
Figure 4a),
n = 2 (
Figure 4b) and
n = 3 (
Figure 4c) for the fixed value of power
m = 0.5. The power of
n = 2 provides a better representation of tests with low storage pressure (PRESLHY-5, pressure 0.5 MPa) in comparison to
n = 1, meanwhile providing a minimum scatter of the dataset in comparison to
n = 3 (+37% relative improvement). This implies that the blast wave from a turbulent hydrogen–air mixture deflagration/detonation in a jet decays faster compared to a quiescent hydrogen–air mixture deflagration but slower than for the blast wave generated by high explosives. Therefore, value
n = 2 is selected for the definition of the correlation.
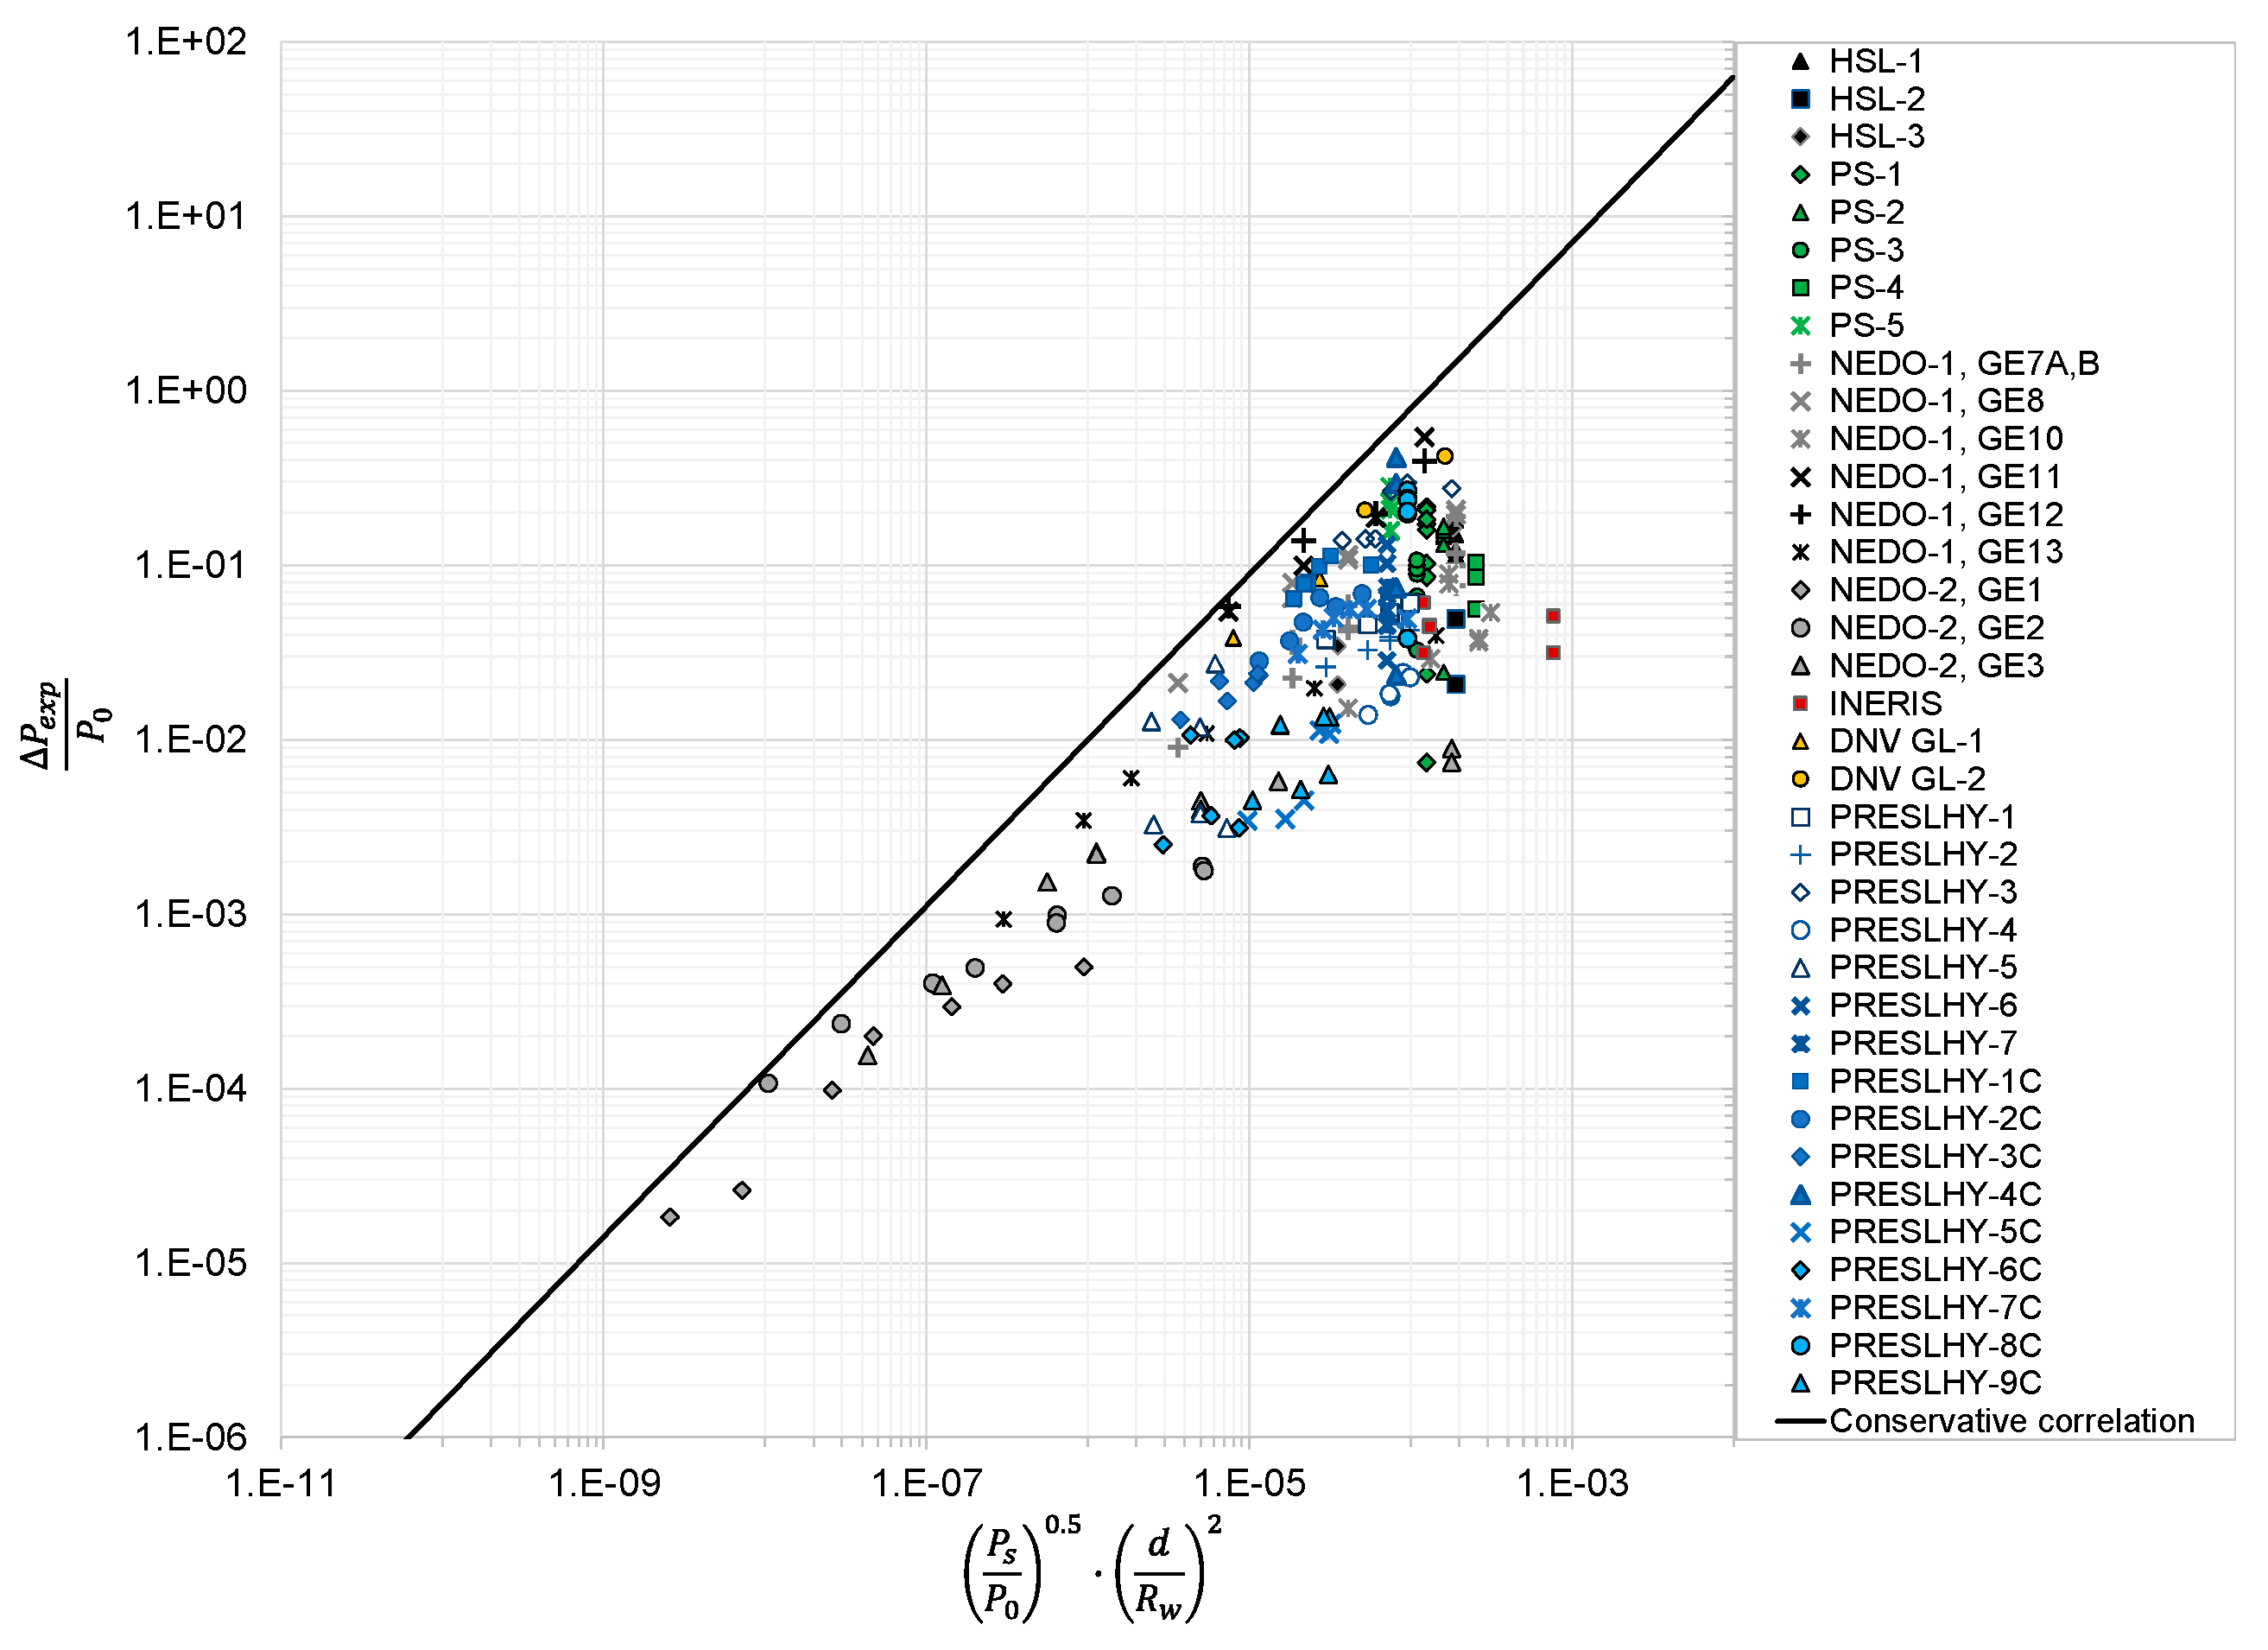
Figure 5 shows the distribution of the dimensionless experimentally recorded blast wave overpressure as a function of the derived dimensionless parameter for the validation tests (see
Table 1).
Figure 5 also includes the representation of the tests on ignition of cryogenic hydrogen summarised in
Table 2. It should be underlined that the maximum overpressures observed in experiments do not necessarily reproduce the maximum theoretically possible due to not exactly reproducing ignition delay and location needed to achieve the theoretically maximum overpressure for chosen storage pressure and nozzle diameter. This apparent fact explains the scatter of experimental overpressures in the correlation presented in
Figure 5 and the need to draw the conservative correlation as the line above all experimental data.
The conservative correlation presented by the solid line in
Figure 5 can be used for the calculation of maximum blast wave overpressure for the delayed ignition of under-expanded free hydrogen jet at arbitrary storage pressure, temperature and release nozzle diameter. It can be written as:
This correlation is derived from the extensive set of unique experimental data and can be used for hydrogen safety engineering to calculate hazard distances by the blast wave overpressure following the delayed ignition of hydrogen under-expanded jets for arbitrary storage pressure and leak diameter, e.g., pipe diameter in case of full bore rupture, etc.
Figure 5 demonstrates that the correlation well represents jets from storages and equipment at both ambient and cryogenic temperatures. This is in line with experimental observations in PRESLHY, where the recorded maximum overpressures were found to be marginally affected by the hydrogen storage temperature [
8]. The correlation is developed for free jets in the open atmosphere with vertically upwards or horizontal release direction. The correlation is yet applicable for the delayed ignition of hydrogen jets in confined spaces when no impingement of the jet up to the axial distance where it decays to the lower flammability limit (LFL). The presence of a barrier or confinement for a flammable jet can affect the resulting overpressure in the case of its delayed ignition. Experiments in [
25] demonstrated that, for a storage pressure of 20 MPa, the presence of a wall at a distance of 2.6 m located perpendicular to the jet axis, can increase the overpressure by 2.6 times in the proximity of the release point compared to the free jet overpressure of 16 kPa. This may correspond to the location of the vehicle and possible occupants in the scenario of a release from a TPRD in a confined space. The maximum recorded overpressure was 42.2 kPa for an orifice of 9.5 mm and wall with 90° tilt. The overpressure increased even further by 1.4 times to 57.2 kPa when the jet impinged on a wall with 60° tilt. The effect of impingement on overpressure decreases with the reduction of nozzle diameter. For example, for a 3.2 mm release, overpressure increased from 3.5 kPa to 4.1 kPa when the perpendicular to the jet axis wall was included in the experimental configuration. The overpressure increased to 8.6 kPa when the jet impinged on a wall with a 60° tilt.
The conservative correlation has been included in the guidelines for the safe design and operation of liquid hydrogen systems and infrastructure and recommendations for regulations, codes and standards (RCS) produced within the PRESLHY project [
26,
27]. It should be underlined that the correlation is applicable to free hydrogen jets within the validation domain including releases at storage temperature in the range 80–300 K, storage pressure 0.5–65.0 MPa and release diameters in the range 0.5–52.5 mm. Estimates that will be performed for jets with parameters outside this validation domain should be handled with care.
5. The Examples of the Conservative Correlation Application
5.1. Direct Problem: Calculation of Overpressure at the Known Target Location
Let us consider an onboard hydrogen storage tank at a nominal working pressure of NWP = 70 MPa () equipped by TPRD of diameter = 2 mm. Storage temperature is equal to that of the ambient, assumed as 288 K. Ambient pressure is 101,325 kPa. The scenario is a horizontal free jet that originates at the location with coordinates () = (0, 1, 0), e.g., as a result of partial car overturn during an incident. Let us estimate the maximum blast wave overpressure at the same height of the jet, at an axial distance of 2 m and radial distance of 2 m from the jet axis, i.e., at coordinates of a target () = (2, 1, 2). The following calculation steps should be performed:
The similarity law, Equation (2), is used to calculate the location on the jet axis with hydrogen concentration equal to 30% by volume. The distance is calculated as 1.67 m. In our model, this location corresponds to the center of the fast-burning hydrogen–air mixture 25–35% by volume in the jet.
The distance between the center of the fast-burning mixture in the jet and the target location can be calculated using the defined coordinates as:
Thus, the blast wave overpressure at the target location can be calculated by Equation (5) as:
This is above the serious injury threshold of 16.5 kPa. The reduction of TPRD diameter or use of explosion free in a fire self-venting through microchannels (TPRD-less) storage tanks can be recommended.
5.2. Inverse Problem: Calculation of Hazard Distances by Known Blast Wave Harm/Damage Overpressure
The developed correlation can be used to calculate the hazard distances at which the blast wave overpressure corresponding to the selected harm or damage criterion will be achieved for defined hydrogen storage and release parameters. The example below describes the estimation of the hazard distances from a source of pressure hazard to prevent harmful effects on humans.
The harm criteria for humans from pressure effects accepted in [
28] are applied here to assess the hazard distances by blast wave overpressure from a delayed ignition of a free turbulent hydrogen jet. A “no-harm” overpressure threshold of 1.35 kPa is assumed according to the harm criteria proposed in [
29]. The “injury” and “fatality” thresholds are taken as 16.5 kPa and 100 kPa, respectively, following the harm criteria accepted in [
30].
Similar to the previous example, a hydrogen jet from TPRD of a tank with NWP of
= 70 MPa, storage temperature of 288 K and TPRD diameter of
= 2 mm is considered. Equation (5) can be rewritten to calculate the distance between the center of the fast-burning cloud and the location where the “no-harm” overpressure of 1.35 kPa is reached,
, as:
The same procedure can be followed for the “injury” and “fatality” hazard distances using respective pressure thresholds:
The maximum hazard distance from the release source defined by the blast wave strength will be reached along the jet axis and can be calculated as:
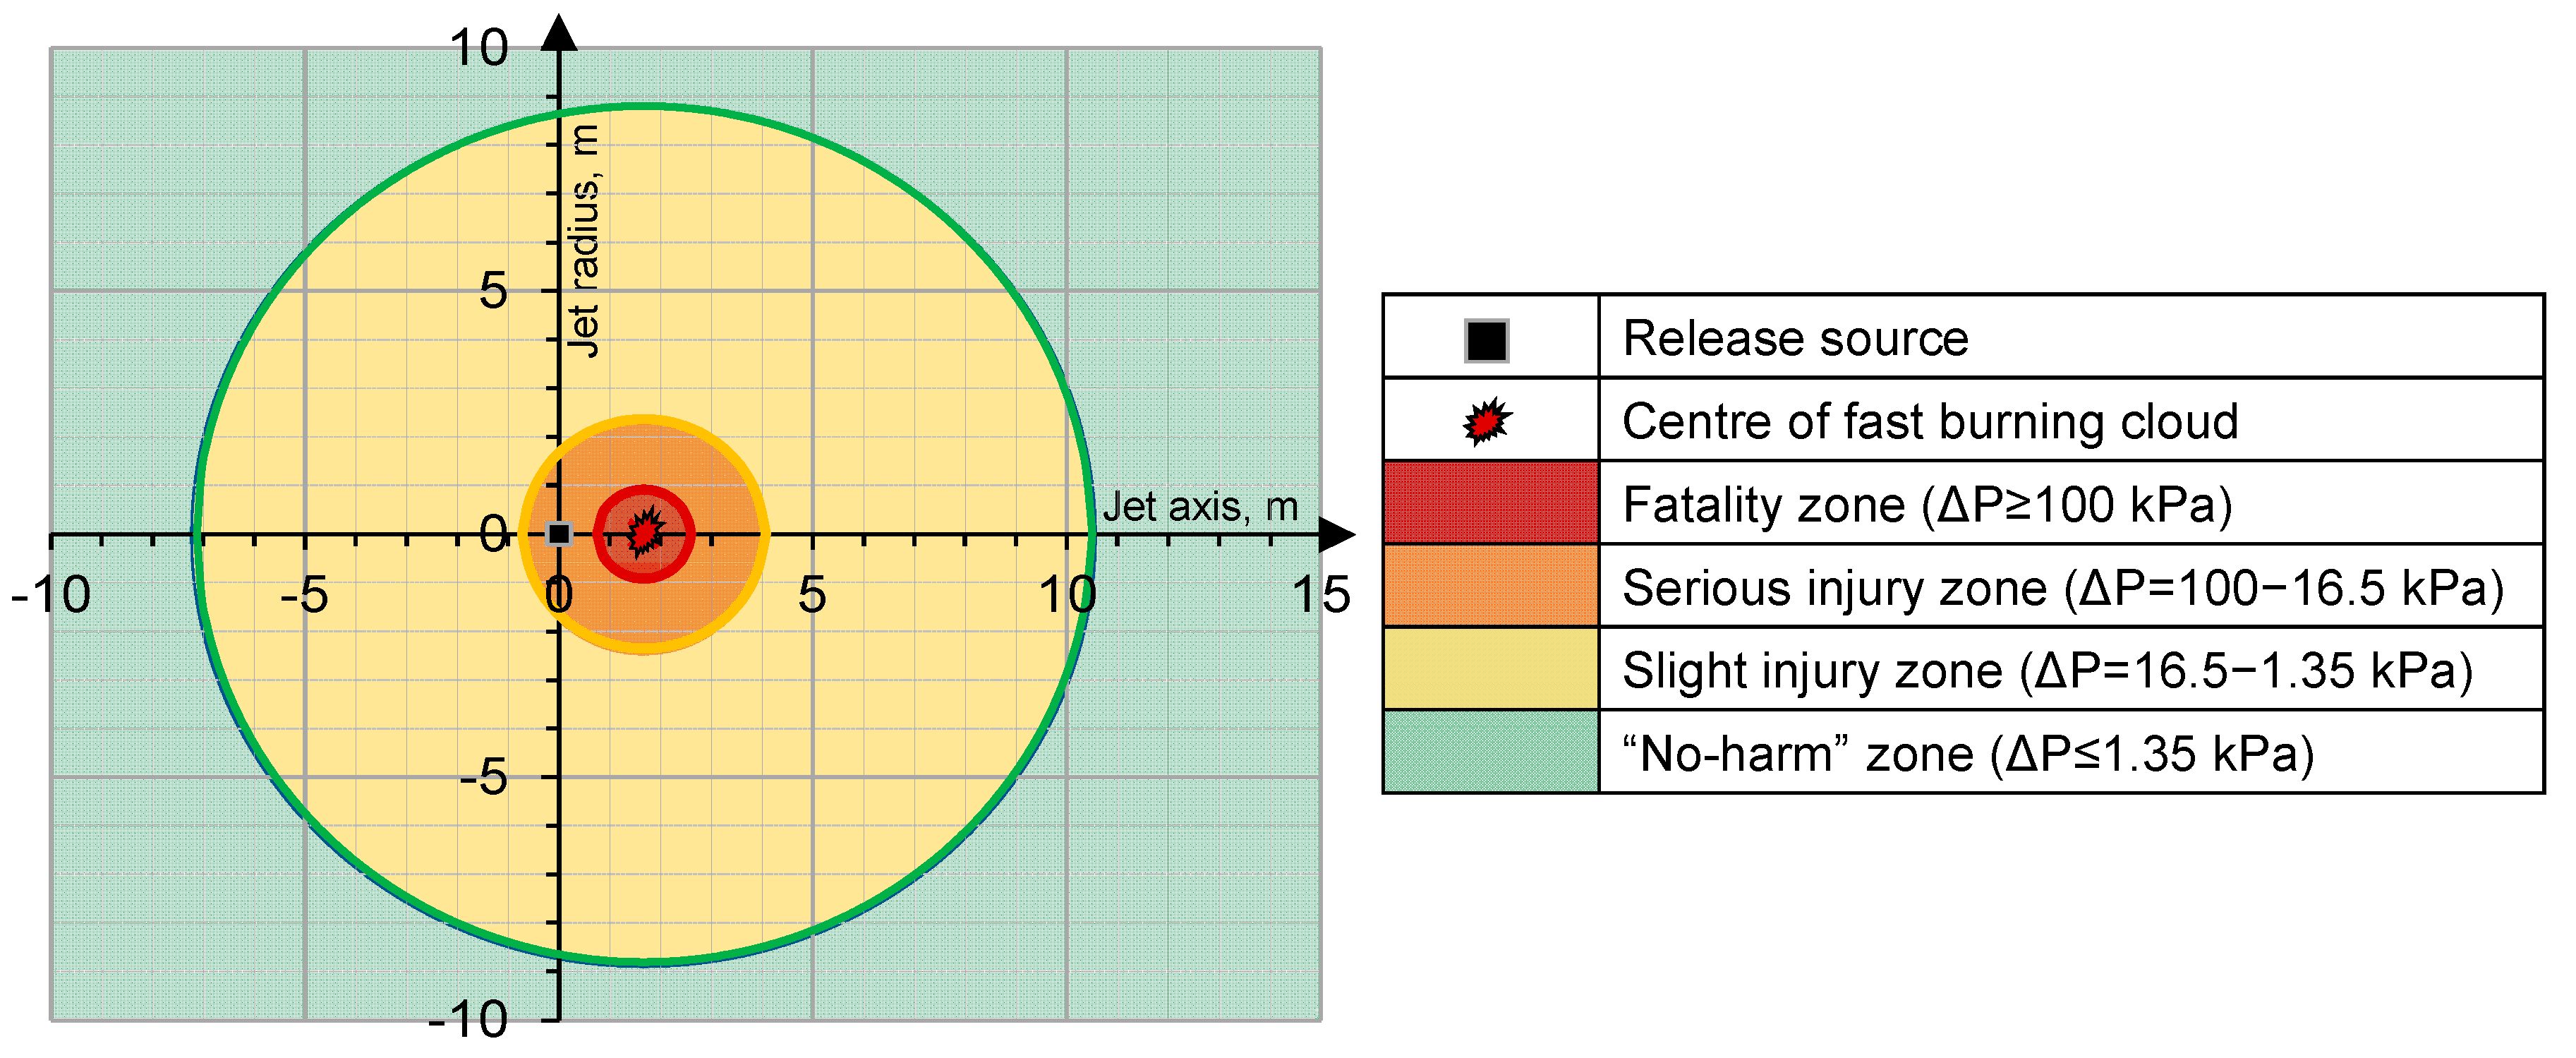
The distances from the release source for the “injury” and “fatality” limit can be calculated similarly to Equation (11) leading to distances equal to 4.1 m and 2.6 m, respectively.
Figure 6 shows the graphical representation of the hazard distances/zones obtained for the delayed ignition of a free turbulent hydrogen jet following the accepted harm criteria. The jet is originated at coordinates (0,0) and height of 1 m from a 70 MPa storage tank and TPRD diameter of 2 mm.
The developed conservative correlation for the maximum blast wave overpressure produced by the delayed ignition of a free hydrogen turbulent under-expanded jet was applied here to calculate the hazard distances/zones defined by the harm thresholds. It is worth mentioning that during the determination of hazard distances in practice not only pressure effect must be considered but also the thermal effects of the jet fire that most likely will be established after the jet ignition.
Five other examples of the correlation application are presented below. The first example includes a hydrogen-powered vehicle with onboard storage tank pressure of 70 MPa and three release scenarios associated with TPRD diameters of 0.5 mm, 1 mm and 2 mm, respectively, cases Vehicle (a), Vehicle (b) and Vehicle (c). The second example is a hydrogen-powered train with a storage system at 70 MPa and a larger TPRD diameter of 5 mm. The third example is a hydrogen bus with a storage tank pressure of 35 MPa and a TPRD = 5 mm. The fourth example is related to hydrogen pipeline at pressure 5.8 MPa, similar to that described in [
31], and pipeline diameters 114 mm and 220 mm placed above the ground assuming a full-bore rupture of pipeline scenario. The fifth example is a release from a storage system at a refuelling station with a pressure of 95 MPa through the pipe of 5 mm diameter. In all scenarios, the storage systems are at temperature equal to 288 K.
Table 3 presents the release parameters for each scenario mentioned above.
Table 4 reports the radial extension of the hazard zones associated with three harm criteria, i.e., “no-harm”, “injury” and “fatality”, as calculated using the correlation in Equation (5). These hazard distances are calculated from the center of the fast-burning hydrogen–air cloud, i.e., where a 30% hydrogen by volume concentration is located at the jet axis.
Table 4 reports also the maximum hazard distances from the release sources (in parenthesis).
It can be observed that in the case of a vehicle, the “no-harm” distance for humans reduces from 10.5 m to 2.6 m when a TPRD diameter decreases from currently applied by several OEMs 2 mm to a diameter of 0.5 mm. This means that the reduction of TPRD size leads to a “no-harm” distance comparable with a vehicle size. Seriously larger hazard distances are reached for a TPRD = 5 mm, which is assumed for the hydrogen-driven train scenario. In this case, 26.2 m distance should be ensured to prevent harmful effects on humans. This distance decreases slightly to 21.7 m for a storage pressure of 35 MPa. Novel engineering solutions should be applied to reduce TPRD diameter or eliminate TPRD at all, e.g., by using self-venting (TPRD-less) hydrogen storage tanks that reduce hazard distance to practically zero.
In the case of a pipeline for the transport of hydrogen the estimated conservative “no-harm” distance can be calculated as high as 302 m for a pipeline diameter of 114 mm, and even larger 583 m for a pipeline diameter of 220 mm. The “fatality” and “injury” hazard distances are as large as 61 m and 105 m, respectively, for the pipeline (a) with d = 114 mm and 117.6 m and 202.8 m for pipeline (b) with d = 220 mm. The underground location of a pipeline, pressure losses and buoyancy effects may reduce hazard distances, but the exact analysis of this scenario is beyond the scope of this study. It should be mentioned that the pipeline diameters considered in these examples are beyond the validation domain of the correlation (up to 52.5 mm) and thus these estimates should be handled with care.
6. Conclusions
The originality of the study is in the complementarity of the use of the similitude analysis and the extensive set of unique experimental data obtained for different hydrogen release conditions (storage pressure and temperature, release diameter) and ignition conditions (delay and location of an ignition source) to derive the conservative correlation for blast wave overpressure decay after the delayed ignition of an under-expanded hydrogen jet. The conservative correlation is derived with the understanding of the fact that experimental data are naturally scattered down from the theoretically maximum blast wave overpressure that depends, for particular release conditions, on the unknown “optimum” values of the delay and location of the ignition source.
The significance of this work is in the derivation for the first time of the correlation for the calculation of hazard distances/zones by the blast wave overpressure after the delayed ignition of free under-expanded hydrogen jets. The correlation can be used as a tool for hydrogen safety engineering to calculate the maximum blast wave overpressure for arbitrary ignition conditions of hydrogen release, i.e., hydrogen storage pressure and temperature and the release diameter. The correlation has been included in the guidelines and the recommendations for Regulations, Codes and Standards of the PRESLHY project [
26,
27] and will be included as a part of the recommendations for stakeholders in the HyTunnel-CS project.
The rigor of the study is underpinned by the use of a comprehensive set of experimental data to build the correlation. The correlation is validated against experimental hydrogen releases at storage temperature in the range 80–300 K, i.e., includes cryogenic releases, storage pressure 0.5–65.0 MPa and release diameters in the range 0.5–52.5 mm.


 ,
, 


