Article

Theoretical Prediction of the Efficiency of Hydrogen Production via Alkane Dehydrogenation in Catalytic Membrane Reactor

by
Ekaterina V. Shelepova
and
Aleksey A. Vedyagin
*
Department of Materials Science and Functional Materials, Boreskov Institute of Catalysis SB RAS, Lavrentieva Ave 5, 630090 Novosibirsk, Russia
*
Author to whom correspondence should be addressed.
Hydrogen 2021, 2(3), 362-376; https://doi.org/10.3390/hydrogen2030019
Submission received: 15 August 2021 / Revised: 1 September 2021 / Accepted: 3 September 2021 / Published: 11 September 2021
(This article belongs to the Special Issue Feature Papers in Hydrogen)

Abstract

:
The hydrogen economy is expected to dominate in the nearest future. Therefore, the most hydrogen-containing compounds are considered as potential pure hydrogen sources in order to achieve climate neutrality. On the other hand, alkanes are widely used to produce industrially important monomers via various routes, including dehydrogenation processes. Hydrogen is being produced as a by-product of these processes, so the application of efficient separation of hydrogen from the reaction mixture can give double benefits. Implementation of the dehydrogenation processes in the catalytic membrane reactor is that case. Since the use of dense metal membranes, which possess the highest perm-selectivity towards hydrogen, is complicated in practice, the present research is aimed at the optimization of the porous membrane characteristics. By means of a mathematical modeling approach, the effects of pore diameter on the hydrogen productivity and purity for the cases of ethane and propane dehydrogenation processes were analyzed. The pore size value of 0.45 nm was found to be crucial as far as the diffusion of both the alkane and alkene molecules through the membrane takes place.

1. Introduction

During the last decade, hydrogen has become the most attractive energy source playing a key role in multi-sectorial decarbonization processes [1,2,3,4]. Therefore, the longtime-known processes for clean hydrogen production from hydrocarbons, including catalytic decomposition of methane, have gained a special actuality [5,6,7,8,9,10,11,12]. In most cases, hydrocarbons are being decomposed into carbon and hydrogen that give the highest efficiency towards hydrogen as a target product. The carbon formed as a by-product is often considered as a potential value-added product if its characteristics are good enough for the wide practical application [13,14].
On the other hand, the decomposition of hydrocarbon molecules can be incomplete, as in the case of dehydrogenation reactions when hydrogen is being co-produced along with unsaturated hydrocarbon (alkene) [15]. Since alkenes are highly demanded as monomers for the large-scale chemical industry, such an approach is very favorable from the economic point of view. The alkane dehydrogenation processes can be, therefore, considered as an alternative for the existing hydrogen production methods, including steam reforming of methane and natural gas [16,17]. The efficiency of the dehydrogenation processes in terms of hydrogen productivity can be noticeably improved by involving membrane technologies. Thus, the realization of the process in a catalytic membrane reactor (CMR) allows the elimination of produced hydrogen from the reaction zone through the perm-selective membrane along with an increase in conversion of the hydrocarbon substrate. In this case, the hydrogen-containing and alkene-containing gaseous flows are spatially separated. Another advantage of using the CMR is that due to a shift of thermodynamic equilibrium, the dehydrogenation process can be realized at lower temperatures. Such a decrease in the process temperature positively affects the selectivity towards the target products (hydrogen and alkene) and allows minimizing the coke formation.
The main problem restricting the application of CMR in the industry is connected with the absence of inorganic membranes, which possess appropriate perm-selectivity and provide long-term stability at elevated temperatures. In general, a large number of research works reported in the literature deal with both dense metal membranes and porous membranes of different nature [18,19,20]. Among these materials, the dense metal membranes are characterized with the highest perm-selectivity towards hydrogen. However, such membranes are required to be almost ideal since any imperfectness or inconstancy of the structure (for instance, the formation of defects of cracks on the surface) causes an uncontrollable flux of all the reaction mixture components to the permeate side of the reactor. Usually, the embrittlement of the metal membranes takes place at high temperatures and can be facilitated by the action of the reaction medium. Porous ceramic membranes are significantly less perm-selective than the dense ones but exceed them in thermal stability and flux capability.
The present work is aimed at the optimization of the porous membrane’s characteristics providing the maximal conversion of alkane along with the highest productivity of permeated hydrogen. The question of hydrogen purity is considered as well. The optimization procedures were performed by simulating the processes of ethane and propane dehydrogenation in the CMR. Mathematical modeling is widely used for the analysis of various processes in the reactors of different types, including membrane reactors, as well as for the optimization of the parameters of the membrane, reactor, and overall process [21,22]. Recently, a two-dimensional non-isothermal mathematical model of the CMR was developed and verified for the alkane dehydrogenation processes [23,24,25,26]. Here, the process efficiency (alkane conversion, hydrogen productivity) was analyzed as a function of the pore diameter of the ceramic membrane of a constant thickness. The prospective of hydrogen production via the catalytic dehydrogenation of alkanes is elucidated.

2. Modeling and Calculations

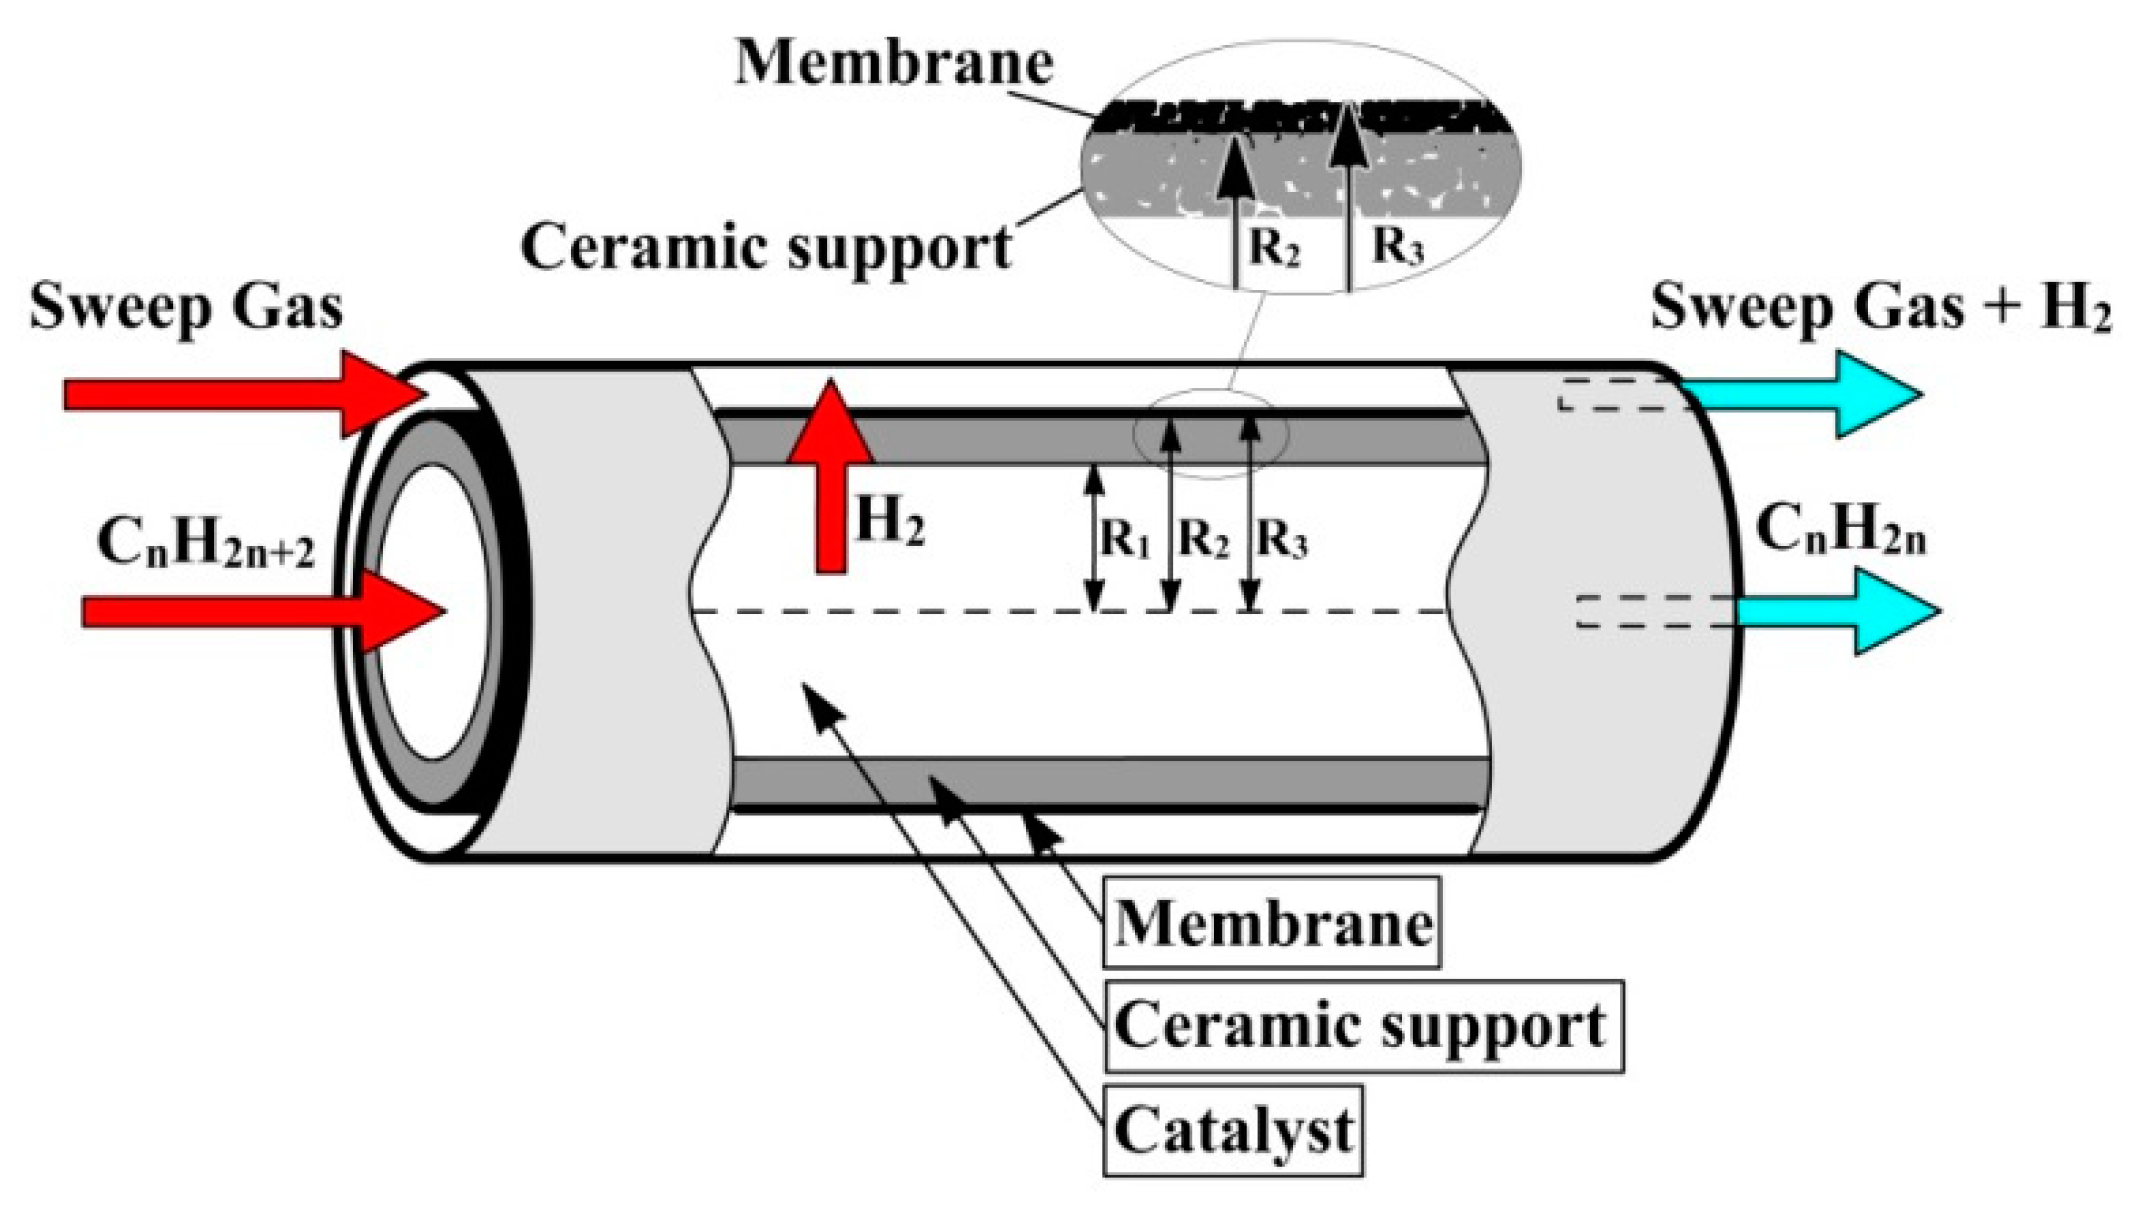
2.1. Description of the Reactor and the Mathematical Model

The scheme of the CMR used for the modeling is presented in Figure 1. A tubular reactor consisting of two tubes, inner and outer, is considered. The inner tube, in its turn, consists of the macroporous ceramic support covered with a layer of microporous oxide membrane. Therefore, the inner tube is permeable. The tube side (inside the inner tube) is filled with the dehydrogenation catalyst. The gaseous reaction mixture containing nitrogen with ethane or propane feeds the tube side of the CMR. The shell side (between the inner permeable and outer impermeable tubes) is purged with a sweep gas to output the hydrogen and other components fluxed through the inner tube.
The two-dimensional non-isothermal stationary mathematical model includes the mass and energy balance equations with the appropriate boundary conditions for tube and shell sides, for the ceramic support and porous membrane. The modeling of the heat and mass transfer processes was carried out by means of a one-dimensional plug-flow model for the shell side.
A few simplifying assumptions were applied:
  • The steady-state conditions are considered;
  • The convective radial transfer is negligible;
  • The axial dispersion is negligible (D/u·L < 0.01);
  • The internal mass and energy transport limitations inside the catalyst pellets, as well as external mass and heat transfer resistances at the surface of the pellets, are negligible.
The equations of the mass and energy balances are given in Appendix A. Appendix B presents the list of all symbols used in the equations.

2.2. Parameters of the Mathematical Model

The effective coefficient of radial diffusion for the ceramic support layer and membrane is described by the equation: D e c , m = ( ( 1 / D m ) + ( 1 / D k n ) ) 1 × p e r m × b .
The Knudsen diffusion coefficient is defined as: D k n = 2 3 r c a p u i , u i = 8 R T π M i / 10 3 . The effective coefficient of molecular diffusion is determined by the Wilkes formula: D m c , m = ( 1 y i ) / j = 1 , j i n ( y j / D i j ) .
For modeling the mass transfer processes in the microporous membrane, the correction coefficient b is taken into consideration. The coefficient b reflects the diffusion limitation, which appears when the pore diameter and the molecule size are of comparable values. Other dependences used for the determination of the mass and heat transfer coefficients are as reported elsewhere [15,23].
The mathematical model parameters used for the simulation of the CMR are summarized in Table 1.

2.3. Reaction Kinetics

2.3.1. Ethane Dehydrogenation

The ethane dehydrogenation reaction is considered in the tube side of the membrane reactor in accordance with the following equation:
C2H6 ↔ C2H4 + H2, ΔH298 = 137 kJ mol−1
For the numerical study of the process, the observed kinetic parameters, reported for the Pd/Al2O3 catalyst with a granule diameter of 3.35 mm and a height of 3.63 mm, are used [27]. The reaction rate of ethane dehydrogenation is described as follows:
r A = 4.39 exp ( 75.580 R T ) [ P C 2 H 6 P C 2 H 4 P H 2 / K e q ] , mol / ( g cat s ) .

2.3.2. Propane Dehydrogenation

The target and side reactions considered in the tube side of the membrane reactor during the propane dehydrogenation process are the following:
1. C3H8 ↔ C3H6 + H2, ΔH298 = 124 kJ mol−1
2. C3H8 ↔ C2H4 + CH4, ΔH298 = 81 kJ mol−1
3. C2H4 + H2 ↔ C2H6, ΔH298 = −137 kJ mol−1
The kinetic parameters for the mentioned reactions were determined for the Pt-Sn-K/Al2O3 catalyst with a particle diameter of 0.16–0.25 mm by Lobera et al. [28]. Table 2 summarizes these parameters.

2.4. Numerical Solution of the Model Equations

The mathematical model of the catalytic membrane reactor consists of the partial differential equations (Appendix A). For the obtained systems of nonlinear partial derivatives equations with the variable coefficients, an analytical solution does not exist. Therefore, the search for a solution was carried out using numerical methods.
The system was transformed into a non-linear set of the ordinary differential equations (ODE) to calculate the temperatures and the concentrations of all components. This transformation was performed using the methods and approaches reported elsewhere [29]. The obtained ODEs were solved using a semi-implicit Rosenbrock-type method of second-order accuracy with an automatic choice of the integration step [30].

3. Results and Discussion

As mentioned in the previous section, hydrogen permeated through the membrane from the reaction zone (tube side) to the shell side was outputted by a flow of the sweep gas. Such a regime complicates the illustration of the hydrogen concentration profile for the shell side. Therefore, the values of the hydrogen concentration in each point of the reactor length to image the concentration profile were obtained as the subtraction of the hydrogen amount left in the tube side from the amount of produced hydrogen during the dehydrogenation process. Figure 2 demonstrates the resulting hydrogen concentration profiles along the reactor length for the shell side of the CMR, for the cases of ethane and propane dehydrogenation. The dependence of the alkane conversion values at the reactor outlet on the pore diameter is plotted in Figure 3. As seen, in the case of ethane dehydrogenation, the hydrogen concentration for pore diameter (dp) values less than or equal to 0.45 nm increases as along the reactor length as with the growth of dp (Figure 2a). At dp values above 0.45 nm, the profiles exhibit a falling tendency. The outlet conversion values tend to be near 39% (Figure 3).
In the case of propane (Figure 2b), the shape of the hydrogen concentration profiles has also changed with the pore diameter increase but not so crucial. The breaking dp value here is 0.5 nm. Propane conversion at such a value of the pore diameter reaches 86%, and the corresponding outlet hydrogen concentration in the shell side is equal to 0.08 m.f.
The observed decrease of the hydrogen concentration in the shell side of the CMR with the growth of the pore diameter is connected with the size comparability of membrane pores and hydrocarbon molecules. The membrane becomes permeable for the other components of the reaction volume (initial alkane, reaction products). It should be mentioned that the diffusion rates for these components are noticeably lower if compared with the hydrogen permeation rate. Nevertheless, these diffusion processes negatively contribute to most of the dehydrogenation process parameters (hydrogen purity, alkane conversion, etc.).
Another important aspect of the hydrogen production in the CMR, which should be taken into consideration, is the distribution of hydrogen between the shell and tube sides of the reactor at the reactor outlet (named as a hydrogen S/T ratio). Figure 4 shows the hydrogen profiles along the reactor length for the tube and shell sides and the total amount of the produced hydrogen. Additionally, the curve for a traditional tubular reactor (TR, inner tube is not permeable for any gases) is presented for comparison. This curve represents the thermodynamic limitations of the corresponding dehydrogenation processes.
As seen, the total outlet hydrogen concentration can be significantly improved by performing the dehydrogenation process in CMR. In the case of ethane, this value for CMR exceeds that for TR by a factor of 3.3 (Figure 4a). Dehydrogenation of propane in CMR gives a 2.3 times higher concentration of hydrogen at the reactor outlet if compared with TR. Due to the hydrogen removal from the reaction zone, the equilibrium of the dehydrogenation reaction shifts towards the product side, thus improving the yields of hydrogen and alkene. By comparing the hydrogen profiles for tube and shell sides of the CMR, the hydrogen redistribution along the reactor length can be inferred. Initially, at the beginning of the reaction, hydrogen starts to form according to the dehydrogenation reaction, and its concentration in the tube side exceeds that in the shell side. Then, the curves intersect at 0.018 and 0.025 m in the cases of ethane and propane, correspondingly. Finally, at the reactor outlet, the hydrogen concentrations reach 0.0497 m.f. in the shell side and 0.0029 m.f. in the tube side for the ethane dehydrogenation process, and 0.0767 m.f. (shell side) and 0.0042 m.f. (tube side) for the dehydrogenation of propane. This results in the hydrogen S/T ratio values of 17.3 and 18.3 for the dehydrogenation of ethane and propane, respectively. Figure 5 demonstrates how the hydrogen S/T ratio depends on the pore diameter. Both curves show a fast-growing slope until the pore diameter reaches 0.45 nm. Then, in the case of ethane, a sharp decrease followed by a relative plateau is observed. For the propane, the hydrogen S/T ratio curve continues to grow until 0.5 nm and then smoothly declines, reaching the value of 9.7 at the pore diameter of 0.7 nm.
The obtained hydrogen concentrations allow estimating the hydrogen productivity for both processes. The resulting dependences of this parameter on the pore diameter are shown in Figure 6. The maximal values correspond to the pore diameters of 0.45 nm (ethane) and 0.5 nm (propane). Further increase in the pore diameter decreases the hydrogen productivity 1.6 and 1.3 times, accordingly. It should also be mentioned that propane dehydrogenation seems to be more efficient and preferable in terms of hydrogen productivity if compared with ethane dehydrogenation.
Since the mathematical modeling allows following the distribution of all the reagents along with the target and side products of the dehydrogenation processes, in both the tube and shell sides, parameters such as hydrogen purity can be estimated as well. As evident, the hydrogen purity parameter depends on the amount of other reaction mixture components diffused from the tube side to the shell side along with hydrogen. As shown in Figure 7, at pore sizes less than or equal to 0.4 nm, hydrogen dominantly transfers through the porous membrane, and its purity is about 100%. In order to simulate the transfer process via diffusion, the critical dimensions of the molecules were used (see Figure 8). If the pore size reaches 0.45 nm, methane molecules, as by-product of propane dehydrogenation, are able to permeate the membrane, and the hydrogen purity starts decreasing. Since ethane and ethylene molecules are bigger, hydrogen produced via the ethane dehydrogenation remains to be pure. A sharp fall of the hydrogen purity for both processes is observed when the pore size becomes 0.5 nm. The situation is more crucial for propane since the side reactions taking place during the dehydrogenation process are also being accelerated [15]. Methane formed as a by-product also penetrates the membrane and decreases the hydrogen purity already at the pore size of 0.45 nm.
The diffusion of hydrocarbons through the porous membrane worsens the overall process efficiency. As shown in Figure 9a,b, at a pore diameter of 0.5 nm and above, the alkene concentration profiles go through the maximum and exhibit a declining tendency at the reactor outlet. Figure 9c,d demonstrates the cumulative amount of hydrocarbons that appeared in the shell side. In both cases, this amount increases with the pore size increase, and the shape of the concentration profile becomes curved. This indicates that the higher hydrocarbon diffusion rates give a higher contribution to the concentration of hydrocarbons in the shell side at the initial part of the reactor.
The productivity of the considered processes towards the target alkenes is presented in Figure 10. When the pore size is 0.3 nm or below, hydrogen molecules do not permeate through the membrane, and the olefins productivity corresponds to thermodynamic values, like in the traditional tubular reactor (see Figure 2 and Figure 6). Within the pore size range from 0.35 to 0.45 nm, hydrogen preferably diffuses through the membrane that positively affects productivity. An increase in the pore size within this range raises the hydrogen diffusion rates at the same 100% purity of permeated hydrogen. The further increase in the pore diameter to 0.5 nm and higher sharply leads to a decrease in the olefins productivity due to the accelerated elimination of both initial alkanes and target alkenes from the reaction zone (the tube side). Therefore, the process of hydrogen and olefin co-production in the CMR can be efficient and reasonable when the ceramic membrane with an average pore size not exceeding 0.45 nm is applied. It is worth noting that the obtained results correlate well with the literature data on gas separation using porous membranes [31].

4. Conclusions

The hydrogen production via the dehydrogenation of alkanes (ethane, propane) in the catalytic membrane reactor was shown to be prospective if the membrane characteristics are well optimized. The hydrogen molecules start to permeate the membrane noticeably when the pore diameter exceeds 0.3 nm. An increase of the pore size up to 0.45 nm improves the process parameters (hydrogen and alkene productivity) and provides hydrogen purity at a 100% level. However, it should be mentioned that in the case of propane dehydrogenation, a pore size approaching the value of 0.45 nm intensifies the side reactions, including the methane formation. A further increase of the membrane pore size affects them more dramatically. Molecules, such as ethane and propane (initial reagents) and ethylene and propylene (target products), became able to diffuse through the pores from the inner tube side of the reactor to the shell side, where only hydrogen is expected to be. As a result, all the process parameters, as well as the hydrogen purity, worsen significantly. Finally, it can be concluded that there is a narrow window of the optimal pore sizes near 0.4–0.45 nm when the membrane technology can provide efficient production of industrially important monomers along with pure hydrogen.

Author Contributions

Conceptualization, A.A.V.; methodology, E.V.S.; software, E.V.S.; validation, E.V.S.; formal analysis, A.A.V. and E.V.S.; investigation, E.V.S.; writing—original draft preparation, E.V.S.; writing—review and editing, A.A.V.; supervision, A.A.V. All authors have read and agreed to the published version of the manuscript.

Funding

This research was funded by the Ministry of Science and Higher Education of the Russian Federation, project number AAAA-A21-121011390054-1.

Data Availability Statement

Data is contained within the article.

Conflicts of Interest

The authors declare no conflict of interest.

Appendix A. Model Equations

Mass Balances:
Tube Side: 0 < r 1 < R 1
( u l t C i t ) l = ε t 1 r 1 r 1 ( r 1 D e i t C i t r 1 ) + ρ k t ( 1 ε t ) × j = 1 N R γ i j w j , i
Boundary Conditions:
l = 0 : C i t = C i n t ; r 1 = 0 : C i t r 1 = 0
At the boundary tube/ceramic support:
r 1 = R 1 : C i t = C i c ;   D e i t ε t C i t r 1 | r 1 = R 1 = D e i c ε c C i c r 2 | r 2 = R 1 , i
Ceramic support: R 1 < r 2 < R 2
ε c r 2 r 2 ( r 2 D e i c C i c r 2 ) = 0 , i
Boundary Conditions:
At the boundary ceramic support/tube: the boundary conditions are identical to those for tube/ceramic support.
At the boundary ceramic support/membrane:
r 2 = R 2 : C i c = C i m ; D e i c ε c C i c r 2 | r 2 = R 2 = D e i m ε m C i m r 3 | r 3 = R 2 , i
Membrane: R 2 < r 3 < R 3
ε m r 3 r 3 ( r 3 D e i m C i m r 3 ) = 0 , i
At the boundary membrane/ceramic support: the boundary conditions are identical to those for ceramic support/membrane.
At the boundary membrane/shell:
r 3 = R 3 : D e i m ε m C i m r 3 | r 3 = R 3 = β ( C i s C i m ) , i
Shell side:
( u l s C i s ) l = β ( C i m C i s ) , i
Boundary Conditions:
l = 0 : C i s = 0 , i = 1 , N t 1
Energy Balance:
Tube side: 0 < r 1 < R 1
ρ G t c p t u l t T t l = 1 r 1 r 1 ( λ e f t r 1 T t r 1 ) + ρ k t ( 1 ε t ) × j = 1 N R w j ( Δ H j )
Boundary Conditions:
l = 0 : T t = T i n t r 1 = 0 : T t r 1 = 0
At the boundary tube/ceramic support:
r 1 = R 1 : T t = T c , λ e f t T t r 1 | r 1 = R 1 = λ c T c r 2 | r 2 = R 1
Ceramic Support: R 1 < r 2 < R 2
1 r 2 r 2 ( λ c r 2 T c r 2 ) = 0
Boundary Conditions:
At the boundary ceramic support/tube: the boundary conditions are identical to those applied for tube/ceramic support.
At the boundary ceramic support/membrane:
r 2 = R 2 : T c = T m , λ c T c r 2 | r 2 = R 2 = λ m T m r 3 | r 3 = R 2
Membrane: R 2 < r 3 < R 3
1 r 3 r 3 ( λ m r 3 T m r 3 ) = 0
At the boundary membrane/ceramic support: the boundary conditions are identical to those applied for ceramic support/membrane.
At the boundary membrane/shell:
r 3 = R 3 : λ m T m r 3 | r 3 = R 3 = α 1 ( T s T m )
Shell side:
ρ G s c p s u l s T s l = S s p 1 α 1 ( T m T s ) + S s p 2 α 2 ( T w T s )
Boundary Conditions:
l = 0 : T s = T i n s
Account of volume change:
Besides the heat and mass distributions on reactor length and reactor radius, the model takes into consideration the volume change of the gas mixtures due to reaction stoichiometry and component diffusion through the porous membrane. The change of mole amount is accounted by the calculation of the equation of axial velocity. The gas mixture velocities in the tube and shell sides are determined from the mass conservation equations.
Tube side:
u l t l = 2 ε c T 0 R 1 T a v ( i = 1 N t D e i c y i c r 2 ) | r 2 = R 1 + 2 R T 0 R 1 2 P 0 ρ k t ( 1 ε t ) 0 R 1 i = 1 N t j = 1 N R γ i j w j r 1 d r 1
Shell side:
u l s l = 2 R T 0 2 R 3 P 0 2 ( R r 2 R 3 2 ) T a v i = 1 N t β i ( p i m p i s )
The calculations of the hydrocarbon conversion are made under consideration of the gas-mixture volume change:
X = y C n H 2 n + 2 , i n ( u l t C t o t ) L 2 ( u l t C t o t ) i n R 1 2 0 R 1 ( y C n H 2 n + 2 ) L r 1 d r 1 + 2 ( u l t C t o t ) i n R 1 2 0 R 1 0 L y C n H 2 n + 2 d l d r 1 y C n H 2 n + 2 , i n

Appendix B. List of Symbols

Cit,c,m,s—concentrations, kmol m−3
cpt,s—heat capacity of gas mixture, kJ g−1 K−1
Deit,c,m—effective coefficient of radial diffusion of component i, m2 s−1
Dij—molecular diffusivity for component i in a binary mixture of i and j, m2 s−1
Dmt,c,m—coefficient of molecular diffusion, m2 s−1
Dkn—Knudsen diffusion coefficient, m2 s−1
dk—diameter of catalyst, m
dr—diameter of membrane reactor, m
dpc—pore diameter of ceramic support, m
dp—membrane pore diameter, nm
Gt,s—gas flow rate, ml min−1
−ΔHj—heat effect of reaction j, kJ mol−1
l—length of reactor, m
Mi—molecular weight of ith compound, g mol−1
NR—number of reactions within the tube side of reactor
Nt,s—number of components within the tube side/shell side of reactor
perm—permeability
P0—pressure at normal conditions, atm
Pit,s,c,m—partial pressure of components, atm
r1,2,3—radial coordinate into the tube side, in the ceramic support, in membrane, m
rcap—capillary radius, m
Rr—reactor radius, m
R—universal gas constant, J mol−1 K−1
Ssp1,sp2—specific surface area, m−1
T0—temperature at normal conditions, K
Tt,s,c,m,w—temperature, K
Tav—average temperature, K
ui—average thermal velocity of molecule, cm s−1
ult,s—axial velocity, m s−1
wj—rate of reaction, kmol kg−1 s−1
X—conversion, %
yi—mole fraction of ith component
Greek letters
α1,2—heat-transfer coefficient between the membrane and fixed bed catalyst (shell); between the exterior wall of reactor and fixed bed catalyst (shell), kJ m−2 s−1 K−1
β—mass transfer coefficient from membrane surface to shell side, m s−1
δc,m—ceramic support and membrane thickness, m
εt,c,m—porosity of catalyst layer (tube side); ceramic support and membrane
γij—stoichiometric coefficient for ith component into jth reaction
λtef—effective coefficient of radial thermal conductivity, J m−1 s−1 K−1
λc,m—thermal conductivity of the ceramic support, membrane, J m−1 s−1 K−1
μ—dynamic viscosity of a gas mix, kg m−1 s−1
ρGt,s—gas density, kg m−3
ρkt—density of catalyst, kg m−3
Indexes
c—ceramic support
in—inlet
m—membrane
s—shell side
t—tube side
W—wall of reactor
m.f.—mole fraction

References

  1. Newborough, M.; Cooley, G. Developments in the global hydrogen market: The spectrum of hydrogen colours. Fuel Cells Bull. 2020, 2020, 16–22. [Google Scholar] [CrossRef]
  2. Espegren, K.; Damman, S.; Pisciella, P.; Graabak, I.; Tomasgard, A. The role of hydrogen in the transition from a petroleum economy to a low-carbon society. Int. J. Hydrog. Energy 2021, 46, 23125–23138. [Google Scholar] [CrossRef]
  3. Falcone, P.M.; Hiete, M.; Sapio, A. Hydrogen economy and sustainable development goals: Review and policy insights. Curr. Opin. Green Sustain. Chem. 2021, 31, 100506. [Google Scholar] [CrossRef]
  4. Oliveira, A.M.; Beswick, R.R.; Yan, Y. A green hydrogen economy for a renewable energy society. Curr. Opin. Chem. Eng. 2021, 33, 100701. [Google Scholar] [CrossRef]
  5. Docekal, J. Hydrogen production from hydrocarbons. Int. J. Hydrog. Energy 1986, 11, 709–714. [Google Scholar] [CrossRef]
  6. Wang, H.; Baker, R.T.K. Decomposition of Methane over a Ni−Cu−MgO Catalyst to Produce Hydrogen and Carbon Nanofibers. J. Phys. Chem. B 2004, 108, 20273–20277. [Google Scholar] [CrossRef]
  7. Wang, Y.; Shah, N.; Huffman, G.P. Simultaneous production of hydrogen and carbon nanostructures by decomposition of propane and cyclohexane over alumina supported binary catalysts. Catal Today 2005, 99, 359–364. [Google Scholar] [CrossRef]
  8. Rahman, M.S.; Croiset, E.; Hudgins, R.R. Catalytic Decomposition of Methane for Hydrogen Production. Top. Catal. 2006, 37, 137–145. [Google Scholar] [CrossRef]
  9. Onsan, I. Catalytic Processes for Clean Hydrogen Production from Hydrocarbons. Turk. J. Chem. 2007, 31, 531–550. [Google Scholar]
  10. Ibrahim, A.A.; Fakeeha, A.H.; Al-Fatesh, A.S.; Abasaeed, A.E.; Khan, W.U. Methane decomposition over iron catalyst for hydrogen production. Int. J. Hydrog. Energy 2015, 40, 7593–7600. [Google Scholar] [CrossRef]
  11. Tezel, E.; Figen, H.E.; Baykara, S.Z. Hydrogen production by methane decomposition using bimetallic Ni–Fe catalysts. Int. J. Hydrog. Energy 2019, 44, 9930–9940. [Google Scholar] [CrossRef]
  12. Vedyagin, A.A.; Mishakov, I.V.; Korneev, D.V.; Bauman, Y.I.; Nalivaiko, A.Y.; Gromov, A.A. Selected Aspects of Hydrogen Production via Catalytic Decomposition of Hydrocarbons. Hydrogen 2021, 2, 122–133. [Google Scholar] [CrossRef]
  13. Choudhary, N.; Hwang, S.; Choi, W. Carbon Nanomaterials: A Review. In Handbook of Nanomaterials Properties; Springer: Berlin, Germany, 2014; pp. 709–769. [Google Scholar] [CrossRef]
  14. Zhou, X.; Wang, Y.; Gong, C.; Liu, B.; Wei, G. Production, structural design, functional control, and broad applications of carbon nanofiber-based nanomaterials: A comprehensive review. Chem. Eng. J. 2020, 402, 126189. [Google Scholar] [CrossRef]
  15. Shelepova, E.V.; Vedyagin, A.A.; Mishakov, I.V.; Noskov, A.S. Simulation of hydrogen and propylene coproduction in catalytic membrane reactor. Int. J. Hydrog. Energy 2015, 40, 3592–3598. [Google Scholar] [CrossRef]
  16. Ahn, S.H.; Choi, I.; Kwon, O.J.; Kim, J.J. Hydrogen production through the fuel processing of liquefied natural gas with silicon-based micro-reactors. Chem. Eng. J. 2014, 247, 9–15. [Google Scholar] [CrossRef]
  17. Bang, Y.; Han, S.J.; Yoo, J.; Park, S.; Choi, J.H.; Lee, Y.J.; Song, J.H.; Song, I.K. Hydrogen production by steam reforming of liquefied natural gas (LNG) over mesoporous nickel–phosphorus–alumina aerogel catalyst. Int. J. Hydrog. Energy 2014, 39, 4909–4916. [Google Scholar] [CrossRef]
  18. Ohashi, H.; Ohya, H.; Aihara, M.; Takeuchi, T.; Negishi, Y.; Fan, J.; Semenova, S.I. Analysis of a two-stage membrane reactor integrated with porous membrane having Knudsen diffusion characteristics for the thermal decomposition of hydrogen sulfide. J. Membr. Sci. 2000, 166, 239–247. [Google Scholar] [CrossRef]
  19. Koutsonikolas, D.; Kaldis, S.; Zaspalis, V.T.; Sakellaropoulos, G.P. Potential application of a microporous silica membrane reactor for cyclohexane dehydrogenation. Int. J. Hydrog. Energy 2012, 37, 16302–16307. [Google Scholar] [CrossRef]
  20. Wang, L.; Murata, K.; Inaba, M. Production of pure hydrogen and more valuable hydrocarbons from ethane on a novel highly active catalyst system with a Pd-based membrane reactor. Catal Today 2003, 82, 99–104. [Google Scholar] [CrossRef]
  21. Pedernera, M.; Alfonso, M.J.; Menéndez, M.; Santamaría, J. Simulation of a catalytic membrane reactor for the oxidative dehydrogenation of butane. Chem. Eng. Sci. 2002, 57, 2531–2544. [Google Scholar] [CrossRef]
  22. Brinkmann, T.; Perera, S.P.; Thomas, W.J. An experimental and theoretical investigation of a catalytic membrane reactor for the oxidative dehydrogenation of methanol. Chem. Eng. Sci. 2001, 56, 2047–2061. [Google Scholar] [CrossRef]
  23. Shelepova, E.V.; Vedyagin, A.A.; Mishakov, I.V.; Noskov, A.S. Mathematical modeling of the propane dehydrogenation process in the catalytic membrane reactor. Chem. Eng. J. 2011, 176–177, 151–157. [Google Scholar] [CrossRef]
  24. Shelepova, E.V.; Vedyagin, A.A.; Noskov, A.S. Effect of catalytic combustion of hydrogen on the dehydrogenation processes in a membrane reactor. I. Mathematical model of the process. Combust. Explos. Shock Waves 2011, 47, 499–507. [Google Scholar] [CrossRef]
  25. Shelepova, E.V.; Vedyagin, A.A.; Noskov, A.S. Effect of catalytic combustion of hydrogen on dehydrogenation in a membrane reactor. II. Dehydrogenation of ethane. Verification of the mathematical model. Combust. Explos. Shock Waves 2013, 49, 125–132. [Google Scholar] [CrossRef]
  26. Shelepova, E.V.; Vedyagin, A.A. Intensification of the dehydrogenation process of different hydrocarbons in a catalytic membrane reactor. Chem. Eng. Process.—Process Intensif. 2020, 155, 108072. [Google Scholar] [CrossRef]
  27. Gobina, E.; Hou, K.; Hughes, R. Ethane dehydrogenation in a catalytic membrane reactor coupled with a reactive sweep gas. Chem. Eng. Sci. 1995, 50, 2311–2319. [Google Scholar] [CrossRef]
  28. Lobera, M.P.; Téllez, C.; Herguido, J.; Menéndez, M. Transient kinetic modelling of propane dehydrogenation over a Pt–Sn–K/Al2O3 catalyst. Appl. Catal. A Gen. 2008, 349, 156–164. [Google Scholar] [CrossRef]
  29. Shelepova, E.V.; Ilina, L.Y.; Vedyagin, A.A. Mathematical modeling of a catalytic membrane reactor: Dehydrogenation of methanol over copper on silica-montmorillonite composite. React. Kinet. Mech. Catal. 2019, 127, 117–135. [Google Scholar] [CrossRef]
  30. Novikov, E.A. Numerical methods for solution of differential equations in chemical kinetics. In Mathematical Methods in Chemical Kinetics; Nauka: Novosibirsk, Russia, 1990; pp. 53–68. [Google Scholar]
  31. Garcia-Fayos, J.; Serra, J.M.; Luiten-Olieman, M.W.J.; Meulenberg, W.A. Gas separation ceramic membranes. In Advanced Ceramics for Energy Conversion and Storage; Elsevier: Amsterdam, The Netherlands, 2020; pp. 321–385. [Google Scholar] [CrossRef]
Figure 1. The scheme of the catalytic membrane reactor for the alkane dehydrogenation.
Hydrogen 02 00019 g001
Figure 2. Hydrogen concentration profiles vs. reactor length for various diameters of the membrane pores: (a) ethane dehydrogenation; (b) propane dehydrogenation.
Hydrogen 02 00019 g002
Figure 3. Alkane conversion at the reactor outlet depending on the membrane pore diameter.
Hydrogen 02 00019 g003
Figure 4. Hydrogen concentrations along the reactor length during the dehydrogenation process in a catalytic membrane reactor (dp = 0.45 nm) and a tubular reactor: (a) ethane dehydrogenation; (b) propane dehydrogenation.
Hydrogen 02 00019 g004
Figure 5. Dependence of the hydrogen S/T ratio on the pore diameter.
Hydrogen 02 00019 g005
Figure 6. Hydrogen productivity vs. the membrane pore diameter.
Hydrogen 02 00019 g006
Figure 7. Hydrogen purity depending on the membrane pore diameter.
Hydrogen 02 00019 g007
Figure 8. Critical dimensions (CD) of the main reagent and product molecules used for the modelling: (a) ethane; (b) ethylene; (c) propane; (d) propylene.
Hydrogen 02 00019 g008
Figure 9. Concentration profiles along the reactor length: ethylene in the tube side (a); propylene in the tube side (b); sum of ethane and ethylene in the shell side (c); sum of propane and propylene in the shell side (d).
Hydrogen 02 00019 g009
Figure 10. Productivity of olefins depending on the membrane pore diameter.
Hydrogen 02 00019 g010
Table 1. Parameters of the mathematical model.
Parameter, DimensionValueParameter, DimensionValue
L, m0.15Tw, °C500
r1, m0.39 × 10−2Tint,s, °C100
dr, m0.2 × 10−1Pt, atm1.5
δc, m0.11 × 10−2Ps, atm1
δm, m4 × 10−6Gt, ml·min−122
dpc, m1 × 10−6Gs, ml·min−175
dk, m0.15 × 10−2 C   t C n H 2 n + 2 , i n , m.f.0.1
ρkt, g·m−30.2 × 10⁷ C   t N 2 , i n , m.f.0.9
εt0.5μg, kg m−1 s−11.67 × 10⁻⁵
εc0.28λc,m, J m −1 s−1 K−10.1
εm0.14
Table 2. The kinetic parameters for the propane dehydrogenation process used for the modeling.
Reaction Rate and Rate Constant EquationsReaction Rate Constant at T0, mmol·g−1min−1bar−1Activation Energy, kJ mol−1
w C 3 H 8 = k 1 ( P C 3 H 8 ( P C 3 H 6 P H 2 / K e q ) ) 1 + ( P C 3 H 6 / K C 3 H 6 )
k 1 = k 01 exp [ E a 1 / R ( ( 1 / T ) ( 1 / T 0 ) ) ]
K C 3 H 6 = K 0 exp [ Δ H / R ( ( 1 / T ) ( 1 / T 0 ) ) ]
k01 = 0.5242
Δ H = −85.817 kJ mol−1
K0 = 3.46
Ea1 = 34.57
w 2 = k 2 P C 3 H 8   k 2 = k 02 exp [ E a 2 / R ( ( 1 / T ) ( 1 / T 0 ) ) ] k02 = 0.00465Ea2 = 137.31
w 3 = k 3 P C 2 H 4 P H 2
k 3 = k 03 exp [ E a 3 / R ( ( 1 / T ) ( 1 / T 0 ) ) ]
k03 = 0.000236Ea2 = 154.54
Publisher’s Note: MDPI stays neutral with regard to jurisdictional claims in published maps and institutional affiliations.

