Article

Heat Wave, Cone Crops, Forest-Floor Small Mammals, and Mustelid Predation in Coniferous Forests of Southern British Columbia

by
Thomas P. Sullivan
1,*,
Druscilla S. Sullivan
2 and
Alan Vyse
3
1
Department of Forest and Conservation Sciences, Faculty of Forestry, University of British Columbia, 2424 Main Mall, Vancouver, BC V6T 1Z4, Canada
2
Applied Mammal Research Institute, 11010 Mitchell Avenue, Summerland, BC V0H 1Z8, Canada
3
Independent Researcher, 2646 Valleyview Drive, Kamloops, BC V2C 4E5, Canada
*
Author to whom correspondence should be addressed.
Ecologies 2025, 6(2), 39; https://doi.org/10.3390/ecologies6020039
Submission received: 24 March 2025 / Revised: 9 May 2025 / Accepted: 19 May 2025 / Published: 22 May 2025

Abstract

:
We report a landscape-scale natural experiment that followed the abundance and demography of forest-floor small mammals and the activity of small mustelids over a 4-year period of an extreme heat wave and abundant coniferous cone crops. Deer mice (Peromyscus maniculatus) and southern red-backed voles (Myodes gapperi) are major species in the coniferous forest-floor small mammal community near Summerland in southern British Columbia, Canada. Their major mammalian predators include the short-tailed weasel (Mustela richardsonii), long-tailed weasel (Neogale frenata), and American marten (Martes americana). We evaluated three hypotheses (H) that may explain the changes in these mammals from 2021 to 2024: (H1) that large coniferous cone crops in 2022 would have generated high populations of forest-floor small mammals in 2023 owing to enhanced reproductive output and overwinter survival; (H2) that increased activity of mustelids would have followed population increases, resulting in the decline of small mammal prey in 2024; and (H3) that the widespread occurrence of cone crops in 2022 would also have elicited the same mammalian responses in 2023 at a second study area (Golden, BC) 276 km and three mountain ranges from Summerland. During the summer periods of each year, small mammal populations were monitored by intensive live-trapping, and mustelid presence was measured via an index of activity based on live traps, fecal scats, and predation events. The mean abundance and reproductive performance of the P. maniculatus and M. gapperi populations increased in response to the coniferous seedfall, thereby supporting H1. The activity of small mustelids responded positively to increased numbers of small mammal prey and potentially acted in a regulatory and top–down function in these communities, and hence partially support H2. Similar responses at Summerland and Golden indicated that this seedfall event and changes in the mammalian community occurred at a landscape-scale, thereby providing partial support for H3. Potential differential effects of large seed crops on consumers did not affect the mean abundance patterns for P. maniculatus but apparently reduced this metric for M. gapperi. Heat waves, induced by anthropogenic climate change, may alter the frequency of coniferous masting events, and their effects may temporarily change the number and species of mammalian seed consumers and their predators.

1. Introduction

Coniferous forests in temperate and boreal ecological zones are well known for their production of large amounts of cones and seeds during certain years. These masting events in the genera Abies, Picea, Pinus, and Pseudotsuga are often synchronized across wide (up to 2500 km for Pinus) geographic regions of the northern hemisphere [1,2]. The Pacific Northwest of North America experienced a 2-week-long extreme heat wave in late June 2021, a consequence of increasing global surface temperatures owing ostensibly to anthropogenic climate change [3,4,5]. In addition to the consequences for human health and social well-being, periods of sustained temperature stress have negative effects on fire regimes and the mortality of plants and trees in forest ecosystems [6,7]. To this end, the potential combination of heat stress and favorable temperatures for cone-bud development in the summer of 2021 likely led to outstanding cone crops of Douglas-fir (Pseudotsuga menziesii), spruce (Picea spp.), true firs (Abies spp.), pines (Pinus spp.), and other coniferous species in the Pacific Northwest in 2022. Evidence for this masting event was reported in coniferous tree seed orchards and collections (e.g., the production of total cones (hectolitres) was 8 times, and seed (kg) was 35 times greater in 2022 than 2023) [8] and in natural stands of Douglas-fir (A. Vyse, pers. obs.) in the southern interior of British Columbia (BC), Canada. In addition, field observations from natural history hikers and other recreationists [9,10], as well as observations from our study areas in southern BC, corroborated this pattern.
Coniferous seeds are a major food resource for a wide variety of small-mammal, avian, and invertebrate species. In the forests of temperate and boreal North America, the deer mouse (Peromyscus maniculatus), southern red-backed vole (Myodes gapperi), and yellow-pine chipmunk (Neotamias amoenus) forage on conifer seeds when available [11,12,13]. All three species have catholic feeding habits that include, in addition to coniferous seeds, mast from deciduous trees, berries, invertebrates, and fungi [12,14,15,16]. Both P. maniculatus and M. gapperi seem to have multi-annual fluctuations in abundance that are associated with the abundance of coniferous seeds. The abundance of P. maniculatus was linked to the abundance of Douglas-fir seed in Oregon [17,18] and BC [19] and to the abundance of white spruce (Picea glauca) seed in the southern Alberta foothills [20]. Similarly, peak populations of M. gapperi seemed to be linked to high-masting years for white pine (Pinus strobus) in Maine [21], black spruce (Picea mariana) in Quebec [22], and several conifer species in BC [23]. The abundance of N. amoenus may be linked to the seed crops of various conifers [12,24].
Major mammalian predators of P. maniculatus, M. gapperi, N. amoenus, and other forest-floor small mammal species include the short-tailed weasel (Mustela richardsonii), long-tailed weasel (Neogale frenata), and American marten (Martes americana) [25,26,27]. These mustelids are widely distributed in various forest successional stages (martens are found particularly in older forests), edge habitats, and riparian woodlands, where dense understory vegetation and woody debris provide cover for them and habitats for their small-mammal prey [28,29,30]. Both weasel species also occur in open habitats such as recent clearcuts if there is sufficient available food and structural cover from avian predators [26,31,32]. The construction of post-harvest woody debris piles on new clearcuts has provided both consistent cover and various small-mammal prey for these mustelids [33,34,35].
Based on these interactions, the population dynamics of these three rodent species and perhaps other mammalian seed predators may be driven by seed crop availability via a bottom–up effect [36,37,38]. In turn, predators may also follow increased populations of these prey species and potentially act in a regulatory and top–down function in these communities [38,39]. Examples for forest tree seeds include rodents and pine martens (Martes martes), weasels (Mustela spp.), and owls in Poland [40]; house mice (Mus musculus) and stoats (Mustela richardsonii) in New Zealand [41,42]; and southern red-backed voles, which are preyed upon by M. richardsonii and boreal owl (Aegolius funereus) in eastern North America [43,44]. Differential effects of large seed crops can be elicited through changes in the number and species of seed consumers and their predators within the overall community [45]. Furthermore, these predator–prey interactions in relation to seed crops may be intrinsically part of the seed–predator satiation effect of masting patterns that may be changing because of global warming [46,47].
As part of an ongoing monitoring program, we have a unique 4-year window for a landscape of uncut old-growth and managed second-growth coniferous forests that can be used to examine forest-floor small-mammal populations and the presence (via an index of activity patterns) of small mustelids near Summerland in southern BC, Canada. In addition, nearby clearcuts had debris piles constructed as habitats for weasels and small-mammal prey. In this natural experiment, the responses of these mammals in old forest and clearcuts were measured during the heat wave of 2021, the cone crops of 2022, and the post-cone-crop years of 2023 and 2024, while the responses for those in the second-growth stands were measured in 2023 and 2024. The presence of mustelids and small-mammal prey in dispersed debris and piles of debris on recent clearcuts near Golden, BC, in the Rocky Mountains were also measured during this unique period.
Thus, our objectives were (1) to provide a description of the demographic changes in populations of forest-floor small mammals and activity of the small mustelids; and (2) to evaluate three hypotheses (H) that may explain the changes in these mammals during this 4-year period: (H1) that coniferous cone crops of Douglas-fir (Pseudotsuga menziesii var. glauca) and interior spruce (Picea glauca × P. engelmannii) in 2022 would have generated high populations of forest-floor small mammals in 2023 owing to enhanced reproductive output and overwinter survival; (H2) that increased activity of mustelids would have followed, resulting in the decline of small mammal prey in 2024. A third hypothesis (H3) predicted that the widespread cone crops (Douglas-fir and spruce) occurring in 2022 would also have elicited the same mammalian responses in 2023 in the Rocky Mountains near Golden, BC, 276 km northeast of Summerland.
For H1, we predicted that an increased food supply from the fall masting of Douglas-fir and spruce would enhance overwinter survival and reproductive output in the following summer breeding period for P. maniculatus, M. gapperi, and N. amoenus. Therefore, the densities of all the species would be higher in the summer and fall periods after conifer masting compared with those in years of lower seed production. For H2, increased activity of weasels would follow high populations of small-mammal prey, and mustelid predation would result in a decline in prey species. For H3, owing to the widespread geographic occurrence of cone crops, we predicted that the Golden study area would yield high populations of P. maniculatus and M. gapperi in 2023, as recorded also in Summerland.

2. Methods

2.1. Study Areas

The two study areas were located in southern BC: (i) old-forest and second-growth forest sites (49°68′ N; 119°89′ W) 25 km west of Summerland, and Munro West (49°42′21″ N; 119°57′01″ W) and Munro East (49°42′38″ N; 119°53′53″ W) replicate sites 32 km and 35 km west of Summerland, respectively, and (ii) Donald (51°29′07″ N; 117°05′46″ W) and Dogtooth Creek (51°21′55″ N; 117°03′55″ W) replicate sites at 35 km and 10 km northwest, respectively, of Golden. The two Munro sites are in the Montane Spruce (MSdm; d,m = dry precipitation regime, mild temperature regime) biogeoclimatic subzone. The topography consists of rolling hills at 1450–1520 m above sea level (a.s.l.), with cold winters and moderately short, warm summers. The mean annual precipitation ranges from 300 to 900 mm. There are extensive even-aged post-fire lodgepole pine stands that have regenerated after wildfires. Hybrid interior spruce and subalpine fir are the dominant shade-tolerant climax trees. Trembling aspen (Populus tremuloides) is a common seral species, and black cottonwood (Populus trichocarpa) occurs on some moist sites [48].
The Donald and Dogtooth sites are in the Interior Cedar–Hemlock (ICHmk; m,k = moderate precipitation regime, cool temperature regime) biogeoclimatic subzone, with the topography ranging from hilly to steep terrain at 1100–1200 m elevation (a.s.l.) in the lower ranges of the Rocky Mountains. Upland coniferous forests dominate the ICH landscape, with western red cedar (Thuja plicata), western hemlock (Tsuga heterophylla), Douglas-fir, lodgepole pine (Pinus contorta var. latifolia), white and Engelmann spruce and their hybrids, and subalpine fir common in these stands [48].
The old-forest sites at Summerland included three replicate uncut old-forest stands that were composed of a mixture of Douglas-fir and lodgepole pine, with interior spruce and subalpine fir in wetter sites. The mean age of the lodgepole pine ranged from 140 to 187 years and that of Douglas-fir and the other conifers ranged from 120 to 220 years. The mean (±SE) total height of the overstory trees ranged from 10.8 ± 5.9 to 19.4 ± 2.3 m for the four conifer species. The mean (±SE) density of the overstory (>3 m height) conifers was 1437 ± 386 trees/ha. The area of these forest sites ranged from 10 to 100+ ha, and the stands were monitored from 2021 to 2024.
To provide a degree of landscape coverage of small-mammal responses to this masting event, eight stands of second-growth lodgepole pine were also selected that had been pre-commercially thinned in 1993, at an age of 13 years, to a range of stand densities. In 2023, at an age of 43 years and 30 years post-thinning, there were four replicate stands that had been heavily thinned to ≤539 trees/ha and four replicate stands that had been lightly thinned to 921 to 1369 trees/ha. The mean (±SE) diameter (cm) and height (m) of the crop trees in the heavily thinned stands ranged from 21.2 ± 0.8 to 24.1 ± 0.4 and 13.9 ± 0.7 to 14.1 ± 0.7, respectively. Diameter (cm) and height (m) measurements were 17.2 ± 0.5 to 19.9 ± 0.7 and 14.4 ± 1.0 to 15.3 ± 1.0, respectively, in the lightly thinned stands. The area of these second-growth forest sites ranged from 4.4 to 11.3 ha and were all within 1 km of each other, and the stands were monitored from 2023 to 2024. Details of the study design are given in Table 1.
Woody debris structures were on clearcut sites (harvested in 2016–2018) in four replicate blocks with a mean (±SE) area of 35.5 ± 3.2 ha (range 28.2 to 50.0 ha). Blocks were separated by a mean distance of 12 km at Golden and 3.3 km at Summerland. A randomized complete block design had the following two treatments: (a) dispersed post-harvest debris with no vertical structure > 0.3 m and (b) a linear configuration of woody debris piles installed across the long axis of each clearcut unit [49]. Summerland sites were monitored from 2021 to 2024, and Golden sites were monitored from 2021 to 2023. The Summerland clearcut sites were 3.7 and 4.9 km, respectively, from the forest grids.

2.2. Forest-Floor Small Mammals

Forest-floor small-mammal populations were sampled at 4-week intervals from May or June to October 2021 to 2024 in the three old-forest sites and in 2023 and 2024 for the second-growth stands at Summerland. One live-trapping grid (1 ha) was located in each of the 11 stands and had 49 (7 × 7) trap stations at 14.3 m intervals, with one Longworth live trap at each station. Traps were supplied with whole oats and carrots, with cotton as bedding. Each trap had a 30 cm × 30 cm plywood cover for protection from sunlight (heat) and precipitation. Traps were set on the afternoon of day 1, checked on the mornings of days 2 and 3, and then locked open between trapping periods. All small mammals captured were ear-tagged with serially numbered tags and the point of capture recorded. Breeding condition was noted by palpation of the male testes and by the condition of the mammaries of the females [50]. Animals were released on the grids immediately after processing. Unfortunately, there was a high mortality rate for shrews in the traps overnight, but this was unavoidable in practice. Therefore, shrews were collected, frozen, and later identified according to [51]. All handling of the animals followed guidelines approved by the American Society of Mammalogists [52] and the Animal Care Committee, University of British Columbia.
For the index lines in the dispersed debris and pile sites, forest-floor small mammals were sampled at 4-week intervals from May or June to October 2021 to 2023 (Golden) and from 2021 to 2024 (Summerland) (Table 1). Each of the two treatments within a given block had five 100 m index lines for sampling small-mammal prey species [53,54]. Each index line had seven trap stations at 14.3 m intervals, with four Longworth live traps at each station. Individual index lines were installed in the dispersed debris and in sets of debris piles that were arranged linearly across the long axis of each clearcut block [49]. The location of the index lines were at comparable distances (0.10–0.30 km, on average) to the edge of each respective clearcut block. Edge habitats were either mature/old-growth forest or 20- to 30-year-old second-growth forest. The trapping procedure for these index lines was identical to that described for the grids.

2.3. Demographic Analysis

For the forest grids, abundance estimates of the deer mouse, red-backed vole, and long-tailed vole (Microtus longicaudus) were derived from the Jolly–Seber (J-S) stochastic model for open populations, with small-sample-size corrections [55,56]. The minimum number alive was used to estimate populations of the meadow vole (M. pennsylvanicus) and heather vole (Phenacomys intermedius); the number of individuals was used for the montane shrew (Sorex monticolus) and common shrew (S. cinereus). J-S estimates were calculated for the yellow-pine chipmunk on grids and for the number of individuals captured each trapping week on the index lines, owing to their occasional movements among the lines. We calculated the effective trapped area (ETA) for each of the major species for each grid based on the mean maximum distance moved (MMDM) between trapping periods as a boundary-strip method [57]. Estimates of population size were converted into a density estimate by dividing the population estimates for each trapping period by the ETA. For the index lines in the dispersed and debris pile sites, the population size for each species was based on the mean number of animals per line for the five index lines for each treatment site. Overall, we consider each of these estimates to be an index of population size per 1 ha grid or index line [57]. The Jolly trappability was calculated for the major species according to the estimate discussed in [58].
Age classes were based on body mass (g); P. maniculatus was classified as juvenile (1–20g) or adult (≥ 21g), M. gapperi as juvenile (1–18g) or adult (≥ 19g), and N. amoenus as juvenile (1–44g) or adult (≥ 45g) [49]. Measurements of recruitment (new animals that entered the population through reproduction and immigration) and the number of successful pregnancies were derived from the sample of animals captured in each trapping session and then summed for each summer period. Early juvenile productivity is an index that relates the recruitment of young into the trappable population to the number of lactating females [50]. Overall mean total survival rates (28-day) for the 4-year period (2021–2024) were estimated from the J-S model.

2.4. Activity of Weasels

An index of the activity of mustelids was measured on grids by the capture of weasels in Longworth live traps (martens were not observed at Summerland). The activity of weasels and martens along the small-mammal index lines was measured at each site by (a) observations as well as live-trapping and release, (b) fecal scats on four 30 cm × 30 cm plywood boards used as covers at the trap stations, and (c) the predation disturbance of small mammals at the trap sites. Captures and fecal scats were identified as marten or weasel according to [59,60,61,62]. One Tomahawk live trap (Model 201; Tomahawk Live Trap Company, Tomahawk, Wisconsin) equipped with a nest box (1 L plastic bottle with coarse brown cotton) was located at each of three stations. The traps were provided with strawberry jam and set in the evening on day 1 and checked in the morning of days 2 and 3. The sampling periods and intervals were identical to those described for the small-mammal species. Mustelid observations and live captures (martens and weasels in Tomahawk traps and weasels in Longworth traps), fecal scats, and disturbances of the live traps were recorded during the 4–6 trapping periods each year. Thus, there were 12 to 18 cells for possible data entry each year: 4 to 6 trapping periods × 3 indicators of mustelid presence, which yielded a proportional value divided by 12, 15, or 18 for each treatment site.
Predation disturbance of the live traps was readily identified as being due to martens or weasels because of their very characteristic patterns of disturbance. Weasels disturbed an occupied Longworth trap by knocking the trap over, under the cover board, thereby opening the door and preying upon the occupant. Martens disturbed the occupied traps by breaking open the Longworth trap or rolling the Tomahawk trap and by moving the trap at least 1 m from the station. Other potential carnivores such as coyotes (Canis latrans) or lynx (Lynx canadensis) were uncommon in these habitats. Fecal scats may have been deposited at any time during the intervals between these trapping periods. All captured mustelids were identified to a species and released.

2.5. Statistical Analyses

A univariate analysis of variance (ANOVA) [63] was used to compare the four years (2021 to 2024) in the old-forest sites for mean values of abundance, number of recruits, number of successful pregnancies, juvenile productivity, and Jolly–Seber total summer and winter survival for the P. maniculatus, M. gapperi, and N. amoenus populations. A repeated-measures analysis of variance (RM-ANOVA) was conducted to determine if there was a difference in the mean abundance of P. maniculatus, M. gapperi, and the total number of small mammals over the two years (2023–2024) for the four replicate sites of heavily thinned and lightly thinned forest stands, as well as the effects of time and treatment × time interactions. The RM-ANOVA was also used over the three years (2021 to 2023) for which we had concurrent data from the dispersed and debris pile sites at Summerland and Golden to test for differences in the mean abundance of the major species: P. maniculatus, the total number of voles (M. gapperi and M. longicaudus combined), and the total number of small mammals. Meadow voles, heather voles, and Sorex shrews had low and inconsistent sample sizes (<2/line), as did N. amoenus, which occurred in the Summerland blocks only. These low samples precluded statistical analysis, but these species were included in the summaries of total abundance.
A univariate ANOVA compared the mean total number of small mammals (n = 2replicate sites) between Summerland and Golden for each year from 2021 to 2023 to determine if annual population changes were similar at both study areas. A univariate ANOVA compared estimates of the ETAs and Jolly trappability of P. maniculatus, M. gapperi, and N. amoenus and the mean total abundance of all the species among the old-forest sites.
Captures of the two weasel species in live traps on the 3 old-forest grids were recorded from 2021 to 2024 and in the 8 second-growth forest grids from 2023 to 2024. The measurement of mustelid activity on the debris study lines was a combination of observations and captures, analysis of fecal scats, and determination of predation disturbance by the two weasel species and martens. This index of activity was calculated as a mean value for the five sample lines for each of the four replicate sites of dispersed debris and piles of debris for the years 2021 to 2023 at Golden and 2021 to 2024 at Summerland. The RM-ANOVA was used to test for differences in the activity of mustelids in the dispersed and debris pile sites for the three years for which we had concurrent data, as well as for the effects of time and treatment × time interactions.
Homogeneity of variance was measured by the Levene statistic. Mauchly’s W-test statistic was used to test for sphericity (independence of data among repeated measures) [64,65]. For data found to be correlated among years, the Huynh–Feldt (H-F) correction was used to adjust the degrees of freedom of the within-subjects F-ratio [66]. Proportional data were transformed by the arcsin square root [67]. Duncan’s multiple-range test (DMRT), adjusted for multiple contrasts, was used to compare mean values based on ANOVA results [68]. In all analyses, the level of significance was set at p = 0.05 [69].

3. Results

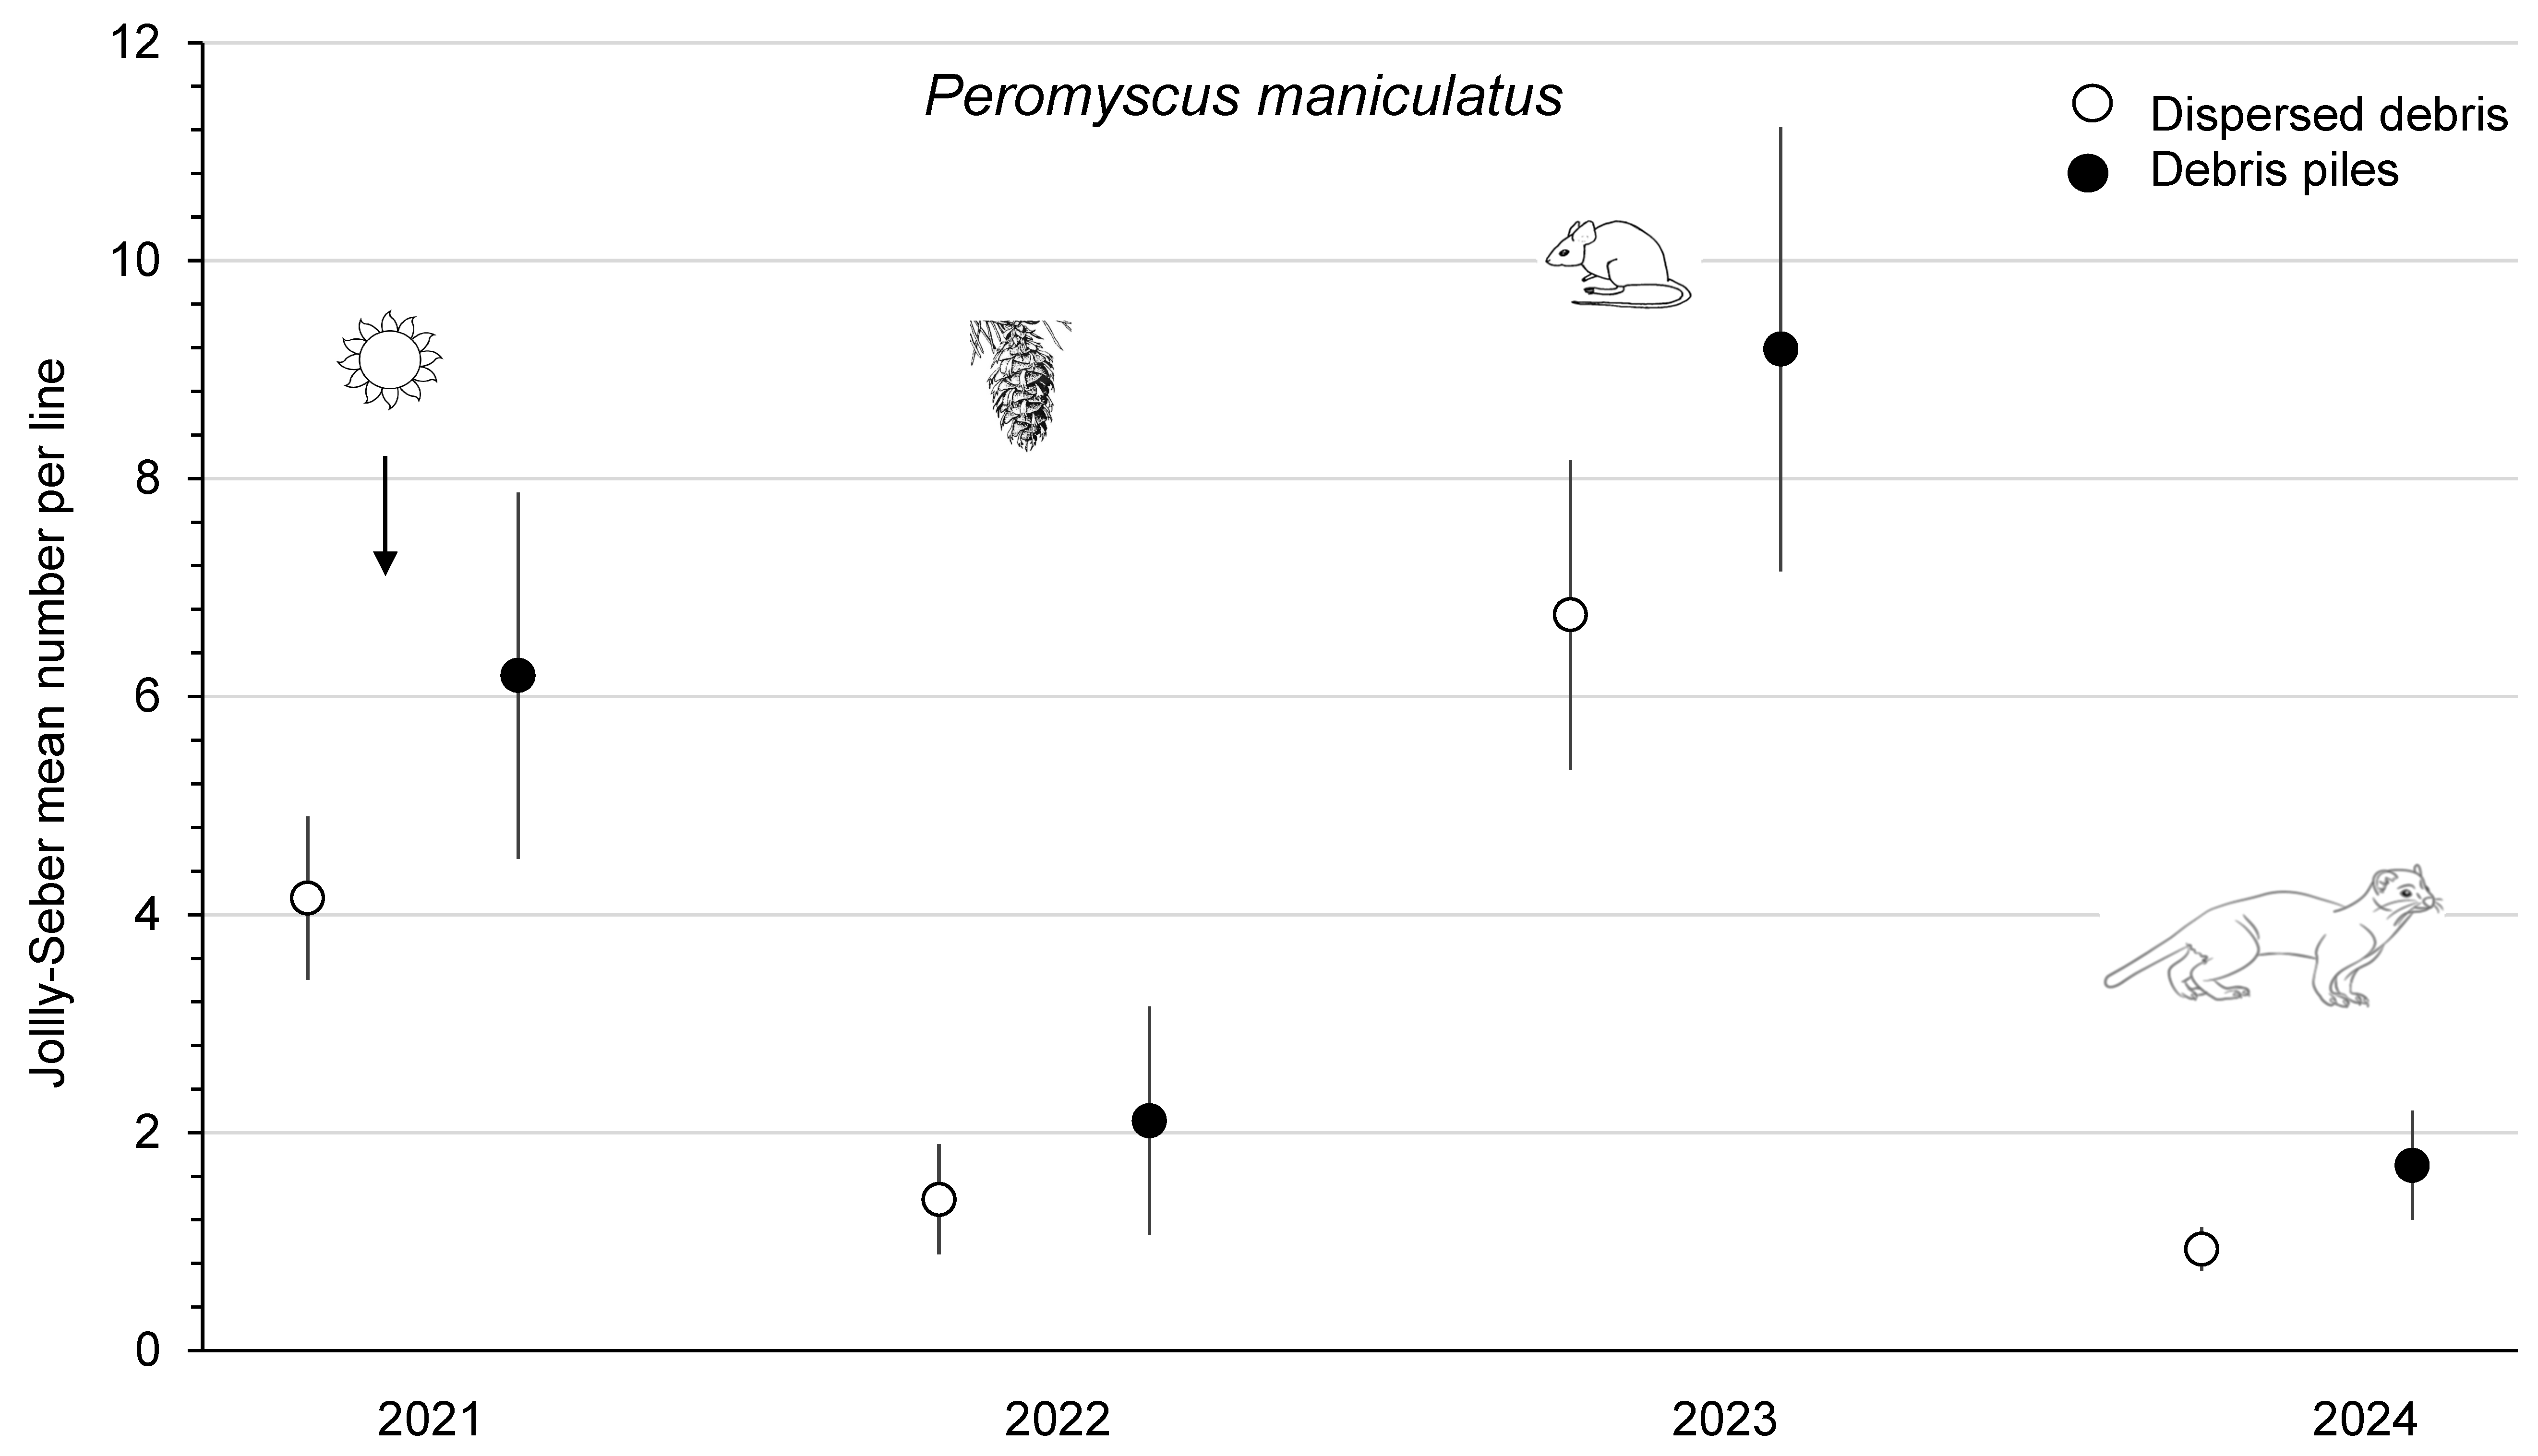
3.1. Forest-Floor Small Mammals

A total of eight species of forest-floor small mammals, composed of 4449 individuals, were captured in 20 and 11 trapping periods at the Summerland and Golden study areas, respectively. P. maniculatus was the most common species captured, with 1801 individuals, followed by M. longicaudus (673), M. gapperi (630), S. monticolus (588), N. amoenus (479), S. cinereus (190), P. intermedius (60), and M. pennsylvanicus (28).
For grids in the old-forest sites in 2021–2024, the mean (± SE) ETAs (ha) were 1.56 ± 0.09 for P. maniculatus, 1.18 ± 0.05 for M. gapperi, and 1.87 ± 0.16 for N. amoenus. Overall mean (±SE) trappability was 91.6 ± 1.9% for P. maniculatus, 77.3 ± 4.8% for M. gapperi, and 70.5 ± 2.4% for N. amoenus. For grids in the managed second-growth forest sites in 2023–2024, the mean (±SE) ETAs (ha) were 1.36 ± 0.02 and 1.40 ± 0.07 for P. maniculatus, 1.11 ± 0.01 and 1.19 ± 0.09 for M. gapperi, and 1.91 ± 0.20 and 1.43 ± 0.08 for N. amoenus in heavily and lightly thinned stands, respectively. These ETA estimates were similar (p ≥ 0.11) between treatment sites for all species, as were estimates of the mean Jolly trappability of P. maniculatus (p = 0.68) among the treatment sites, thereby meeting the homogeneity assumption related to these variables. Insufficient samples of trappability estimates for M. gapperi and N. amoenus precluded statistical analysis for these sites. For the index lines at Summerland and Golden, Jolly trappability estimates had mean (±SE) values of 77.0 ± 2.1% for P. maniculatus, 73.5 ± 6.0% for M. gapperi, and 75.7 ± 2.6% for M. longicaudus in those sites where these species were common.

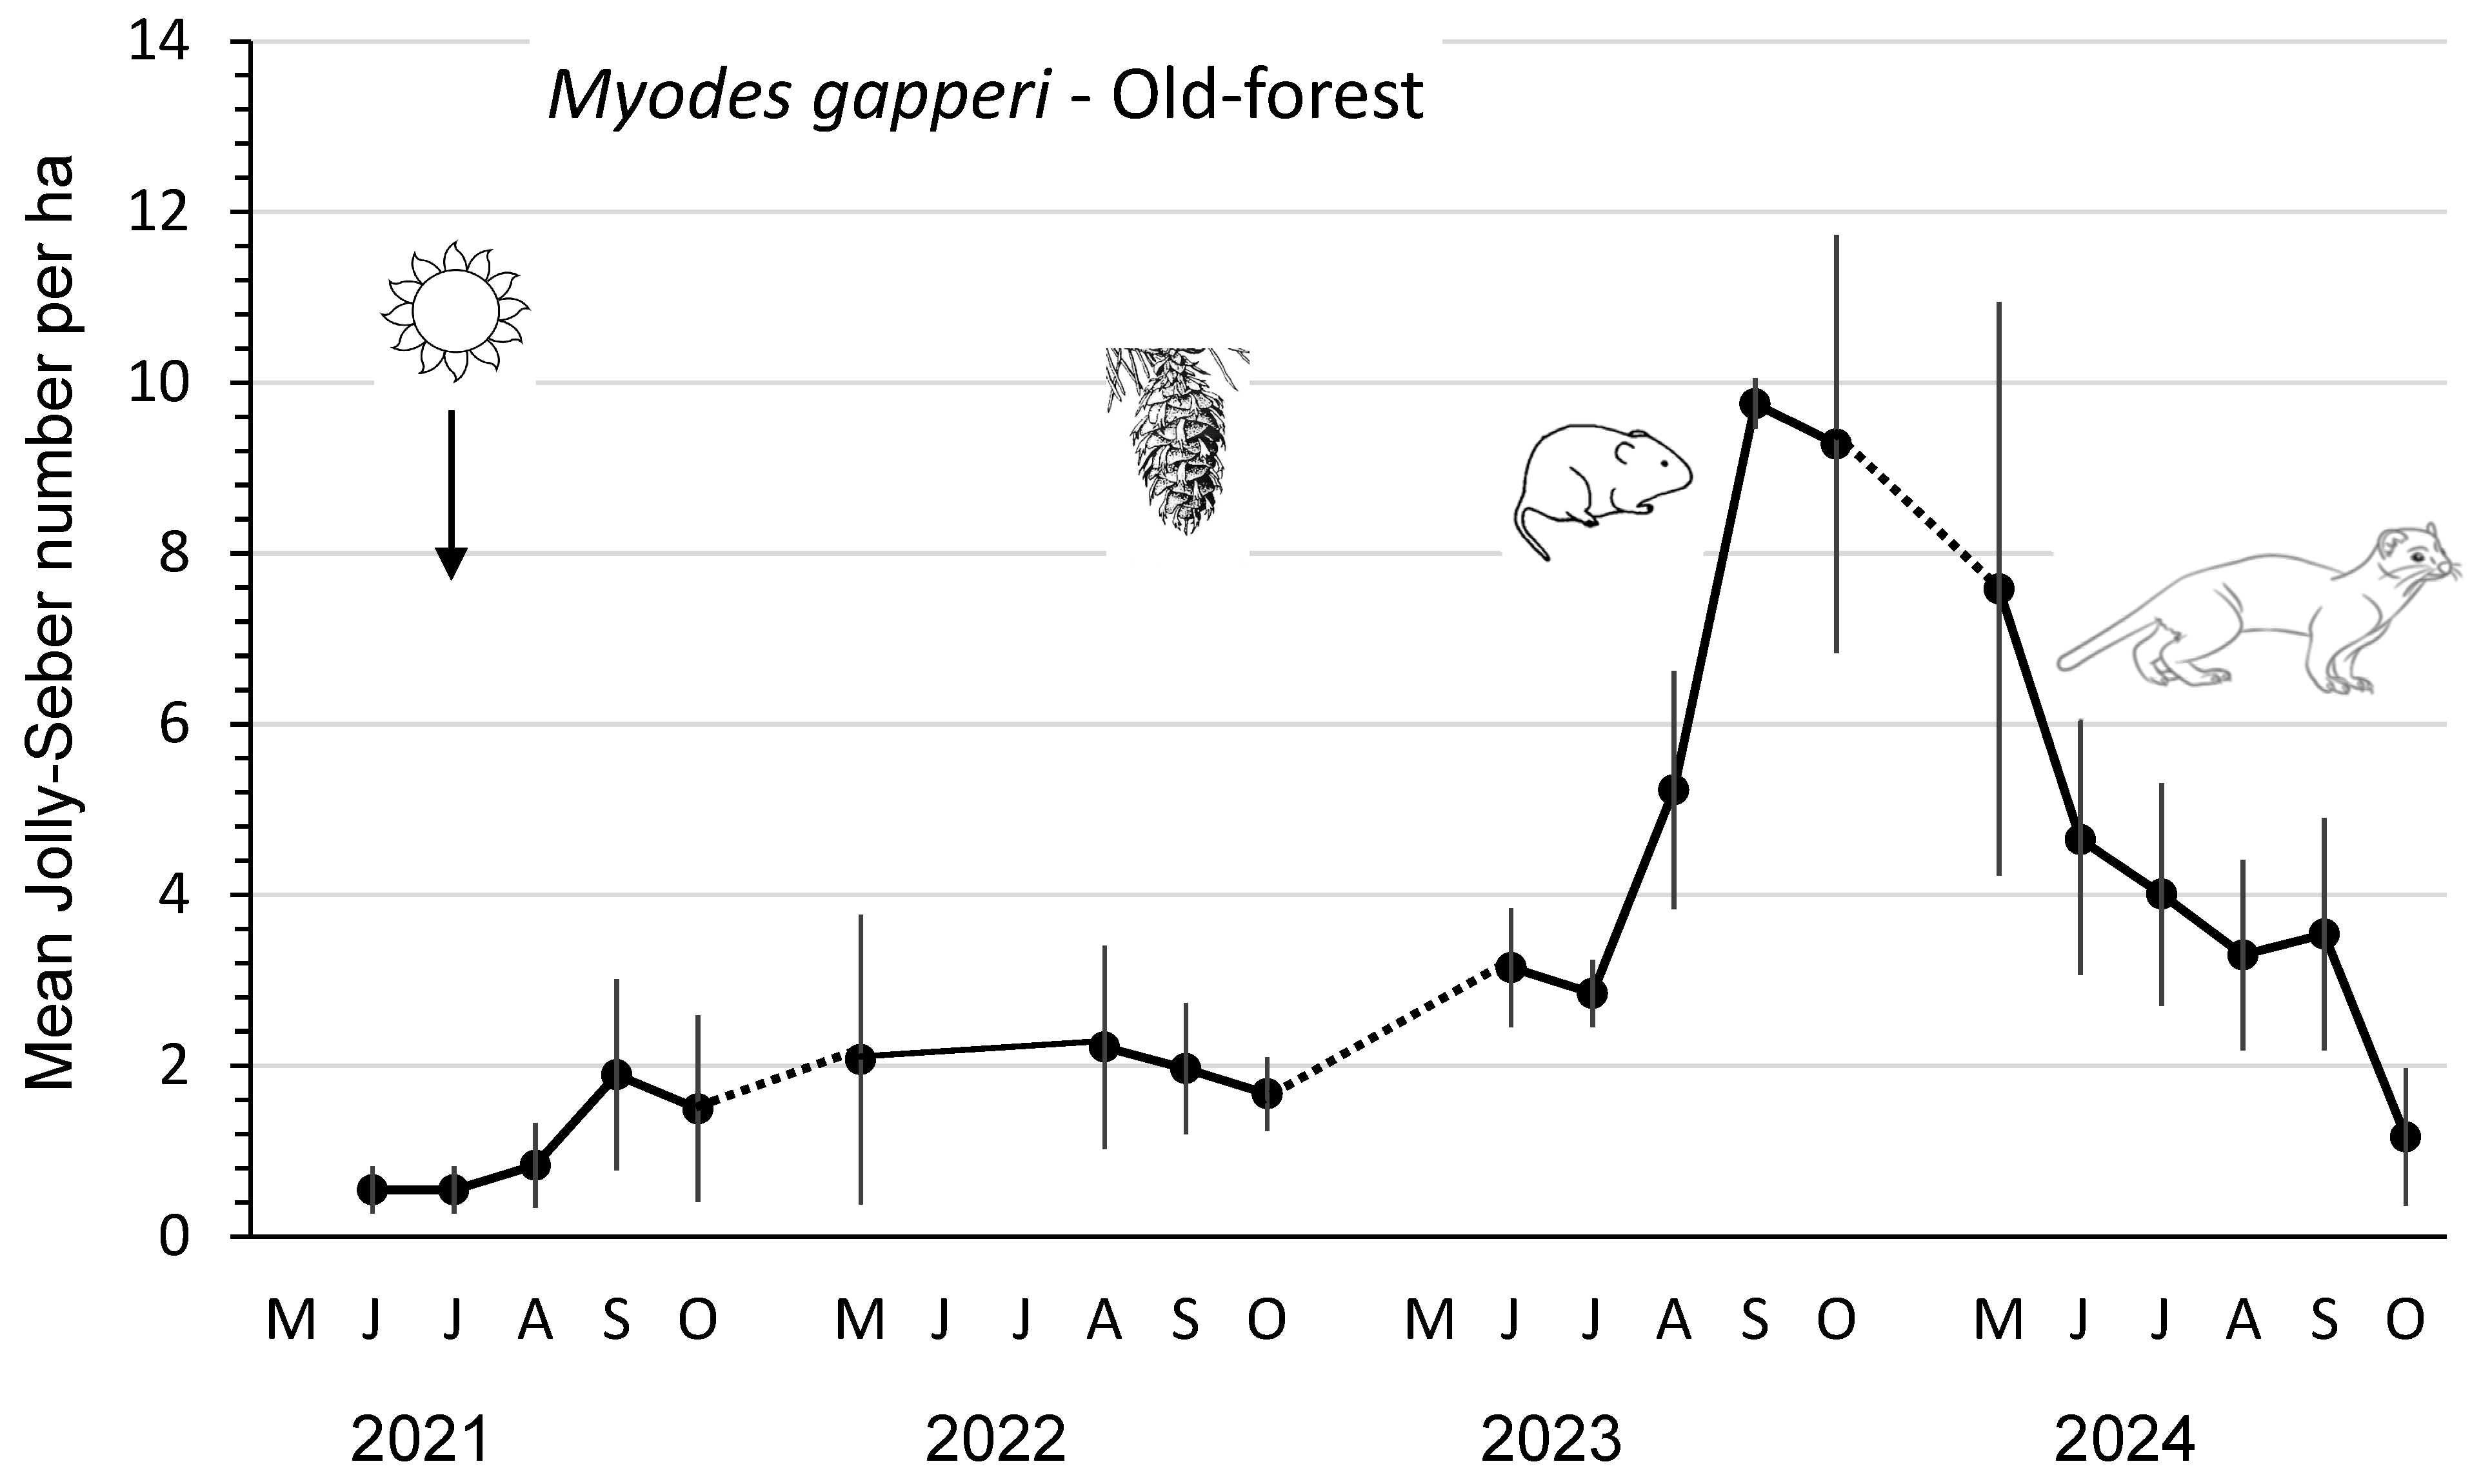
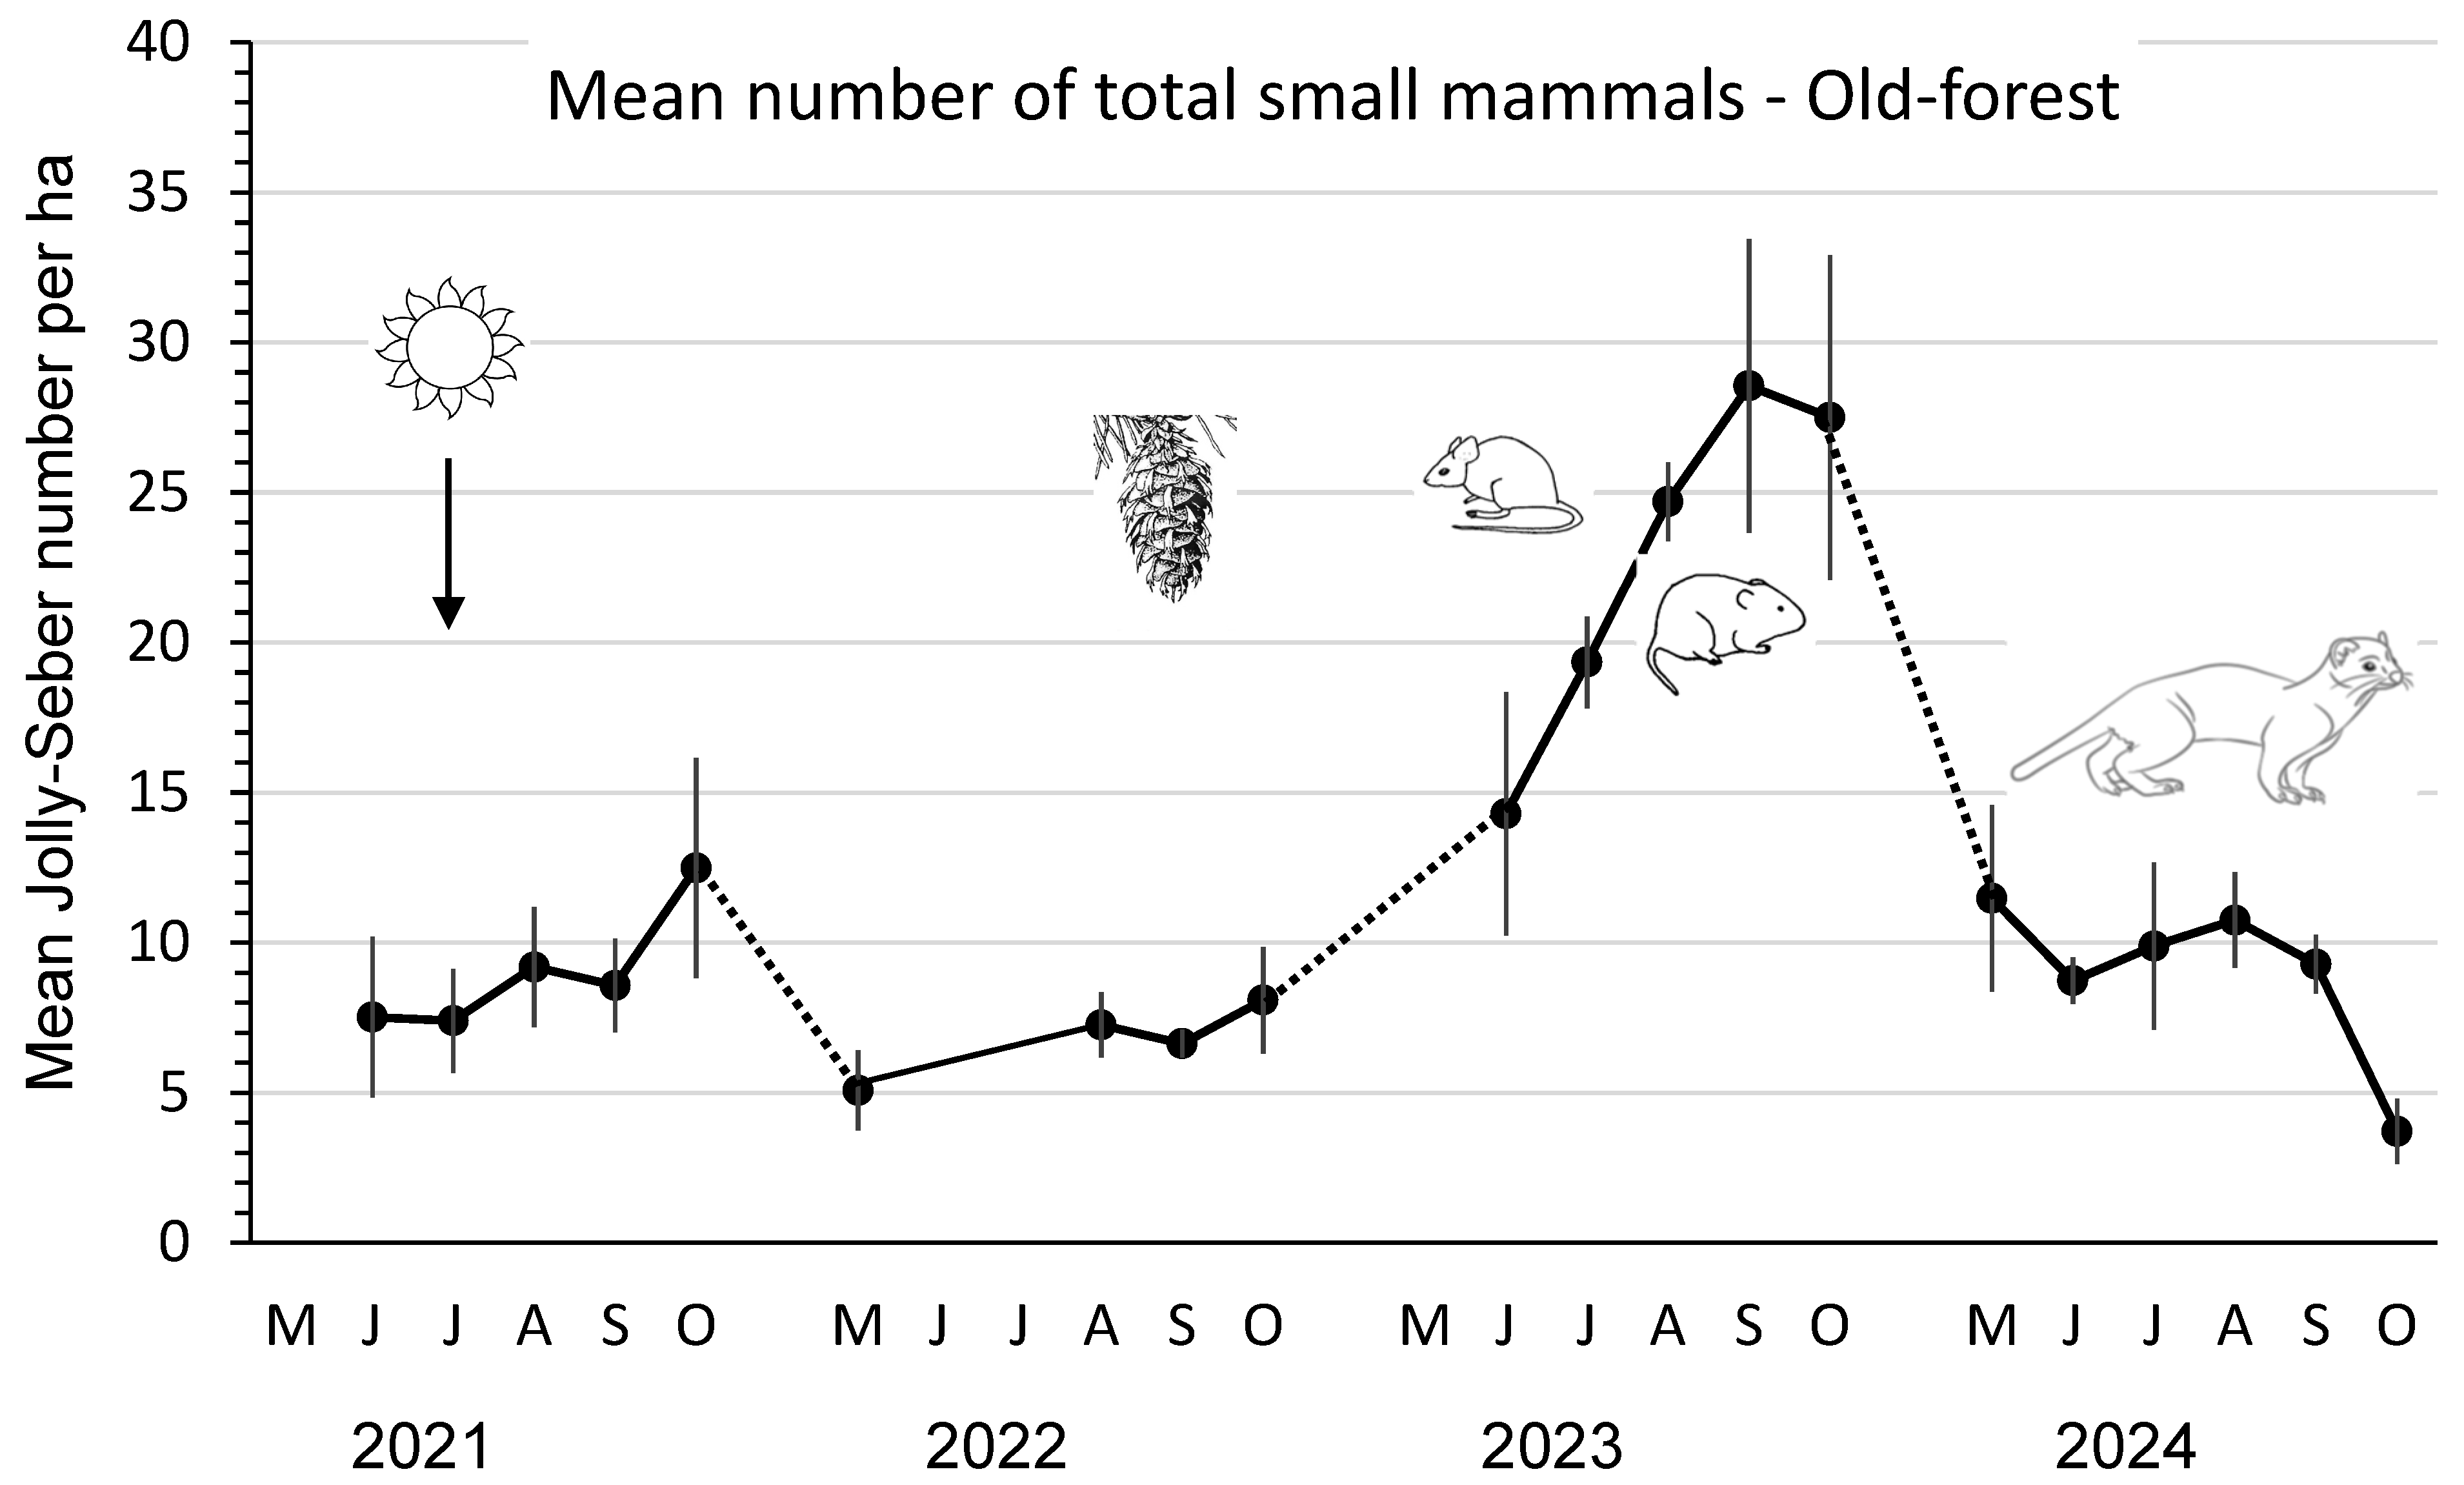
3.2. Small Mammals in Old-Forest Sites

In 2021, the mean abundance/ha of P. maniculatus in the old-forest sites was 6.1, which fell to 2.1 in 2022 before increasing significantly (F3,8 = 22.14; p < 0.01) to 12.4 in 2023 after substantial cone crops in the previous year. Mean numbers/ha then declined again in 2024 to 3.1 deer mice, likely owing to the large presence of weasels (Figure 1; Table 2). The mean peak abundance of deer mice each year followed this same pattern, with the highest (F3,8 = 14.06; p < 0.01) number of 17.2 in 2023. The mean number of lactating females (successful pregnancies) and mean number of juvenile recruits per year provided a measure of the reproductive performance (Table 2). In 2023, the mean numbers of total recruits and juvenile recruits of P. maniculatus were 1.6 to 6.0 times and 1.8 to 6.5 times greater, respectively, than in the other years. Both measures of recruitment were significantly (DMRT; p = 0.05) higher in 2023 than in the other years. The mean number of successful pregnancies per year also followed this pattern (Table 2). The mean index of juvenile productivity was 3.1 to 5.0 times higher in 2023 than in other years. The mean monthly Jolly–Seber summer survival was consistently lower (an average of 14%) than that for winter survival throughout the four years.
The mean abundance and peak abundance per ha of M. gapperi were 1–2 and 3–3.5, respectively, in 2021 and 2022 (Figure 2; Table 2). These density parameters increased significantly (p ≤ 0.04) in the post-cone-crop year 2023 to 6.1 and 11.0 per ha before declining to statistically similar (DMRT; p =0.05) mean values of 4.1 and 8.2 in 2024. All three measures of reproductive performance—mean numbers of lactating females and recruits as well as index of juvenile productivity—were highest in 2023, corresponding with the peak abundance of M. gapperi (Table 2). Mean numbers of total recruits and juvenile recruits were 1.8 to 6.9 times and 2.2 to 19.6 times greater, respectively, than in the other years. Both measures of recruitment were significantly (DMRT; p = 0.05) higher in 2023 than in the other years. The mean monthly Jolly–Seber summer survival was consistently lower (an average of 28%) than that of winter survival throughout the four years.
Population numbers of N. amoenus were low (1–5/ha) throughout the four years, with mean abundance ranging from 1 to 3 per ha (Table 2). Overwinter declines occurred in all years. Reproductive data were limited but tended to follow the pattern of P. maniculatus and M. gapperi (Table 2). The mean monthly Jolly–Seber summer survival was consistently lower (an average of 21%) than that of winter survival (in hibernation) throughout the four years.
The mean total number of small mammals in old forests was low, ranging from 5–12 animals/ha in 2021–2022, increasing significantly (F3,8 = 21.43; p < 0.01) up to a peak of 28/ha in September 2023, and then declining over winter to ≤ 11 animals/ha in 2024 (Figure 3). Mean numbers of P. intermedius, M. longicaudus, and Sorex spp. were consistently low (0 to ≤0.4/ha) in these old-forest stands.

3.3. Small Mammals in Second-Growth Forest Sites

The mean abundance of P. maniculatus in managed second-growth forests in 2023–2024 was similar (F1,6 = 3.29; p = 0.12) between treatment stands but with a significant (p < 0.01) time effect between the two years (Table 3). The mean abundance of deer mice per ha was 5.0 to 7.5 times higher in 2023 than in 2024, with numbers up to 16 mice/ha in the heavily thinned stands in 2023 and then declining to <3 mice/ha in both treatments in 2024. The mean numbers of M. gapperi were significantly (F1,6 = 7.57; p = 0.03) different, with 2.0 to 2.7 times more red-backed voles in the lightly compared with the heavily thinned stands (Table 3). However, there was no difference (p = 0.26) between the two years in these stands. The total number of small mammals showed a similar (p = 0.24) mean abundance between the treatment stands, but there was a significant (p < 0.01) effect of time, with 2.7 to 3.0 times as many animals in 2023 as in 2024 (Table 3). Following the cone crops in the fall–winter of 2022, the mean total number of mammals per ha increased to 21 animals in the late summer of 2023 before declining over winter to 5–6 animals/ha. Except for the significant time effect for P. maniculatus, there were no other significant time or treatment x time effects. Mean numbers of P. intermedius, N. amoenus, and Sorex spp. were consistently low (0 to ≤0.9/ha) in these second-growth forest stands.
In the second-growth forests, the mean number of successful pregnancies per year (2023 to 2024) of P. maniculatus was similar (F1,6 = 0.09; p = 0.78) between the treatment stands, ranging from 1.5 to 3.5 lactating females (Table 4). This range was the same as that recorded in the old-forest sites (2021 to 2024) (Table 2). However, the mean numbers of total recruits and juvenile recruits of P. maniculatus in 2023 were 2.8 to 5.7 times and 1.6 to 7.2 times greater, respectively, than in 2024 (Table 4). These comparisons were significantly (p ≤ 0.01) different between 2023 and 2024 for both parameters. The mean index of juvenile productivity for P. maniculatus was 3.8 to 5.9 times higher in 2023 than in 2024 (Table 4).
The higher mean numbers of M. gapperi in the lightly thinned compared with those in the heavily thinned stands likely reflected the greater density of coniferous trees in these former stands. To this end, mean numbers of lactating females, total recruits, and juvenile recruits all tended to be higher in the denser stands, at least in 2023, before declining in 2024 (Table 4). This pattern did not occur in the heavily thinned stands, where the mean numbers of both recruits increased in 2024 from 2023 and generated a significant treatment × time interaction for both parameters (Table 4). At least in the lightly thinned stands, all three measures of reproductive performance—mean numbers of lactating females and recruits as well as the index of juvenile productivity—approximated the parameters measured in the old-forest sites during these same years (Table 2).

3.4. Small Mammals on Clearcuts

The mean abundance of P. maniculatus was similar (F1,3 = 5.17; p = 0.11) between dispersed debris and piles sites from 2021 to 2023 at the combined Summerland and Golden study areas (Figure 4). Deer mouse numbers increased 4.4- to 4.9-fold from 2022 to 2023, and this population change was a significant (p < 0.01) time effect, which, again, was likely related to the substantial cone crops in 2022. The mean abundance of P. maniculatus declined to <2 mice/ha on the Summerland sites in 2024 (Figure 4). M. gapperi and M. longicaudus were combined and counted as the total number of voles to increase the sample size, with a significant (F1,3 = 105.64; p < 0.01) difference between treatment sites. There was a trend for increased vole numbers (2.0- to 2.2-fold) from 2021 to 2023, but the time effect was not significant (p = 0.16). The mean total abundance of small mammals was significantly (F1,3 = 49.77; p < 0.01) different between sites, with higher numbers in piles than in dispersed debris (Figure 5). There was a significant (p = 0.01) time effect, as the mean total number of small mammals increased 1.7- (dispersed sites) to 2.0-fold (piles sites) from 2022 to 2023. In 2024 at Summerland, these populations declined to 8 to 10 animals per index line (Figure 5). There were no significant treatment x time effects in these RM-ANOVA analyses. Comparisons of the mean total number of small mammals between Summerland and Golden, on an annual basis from 2021 to 2023, showed that these were similar (p ≥ 0.08).

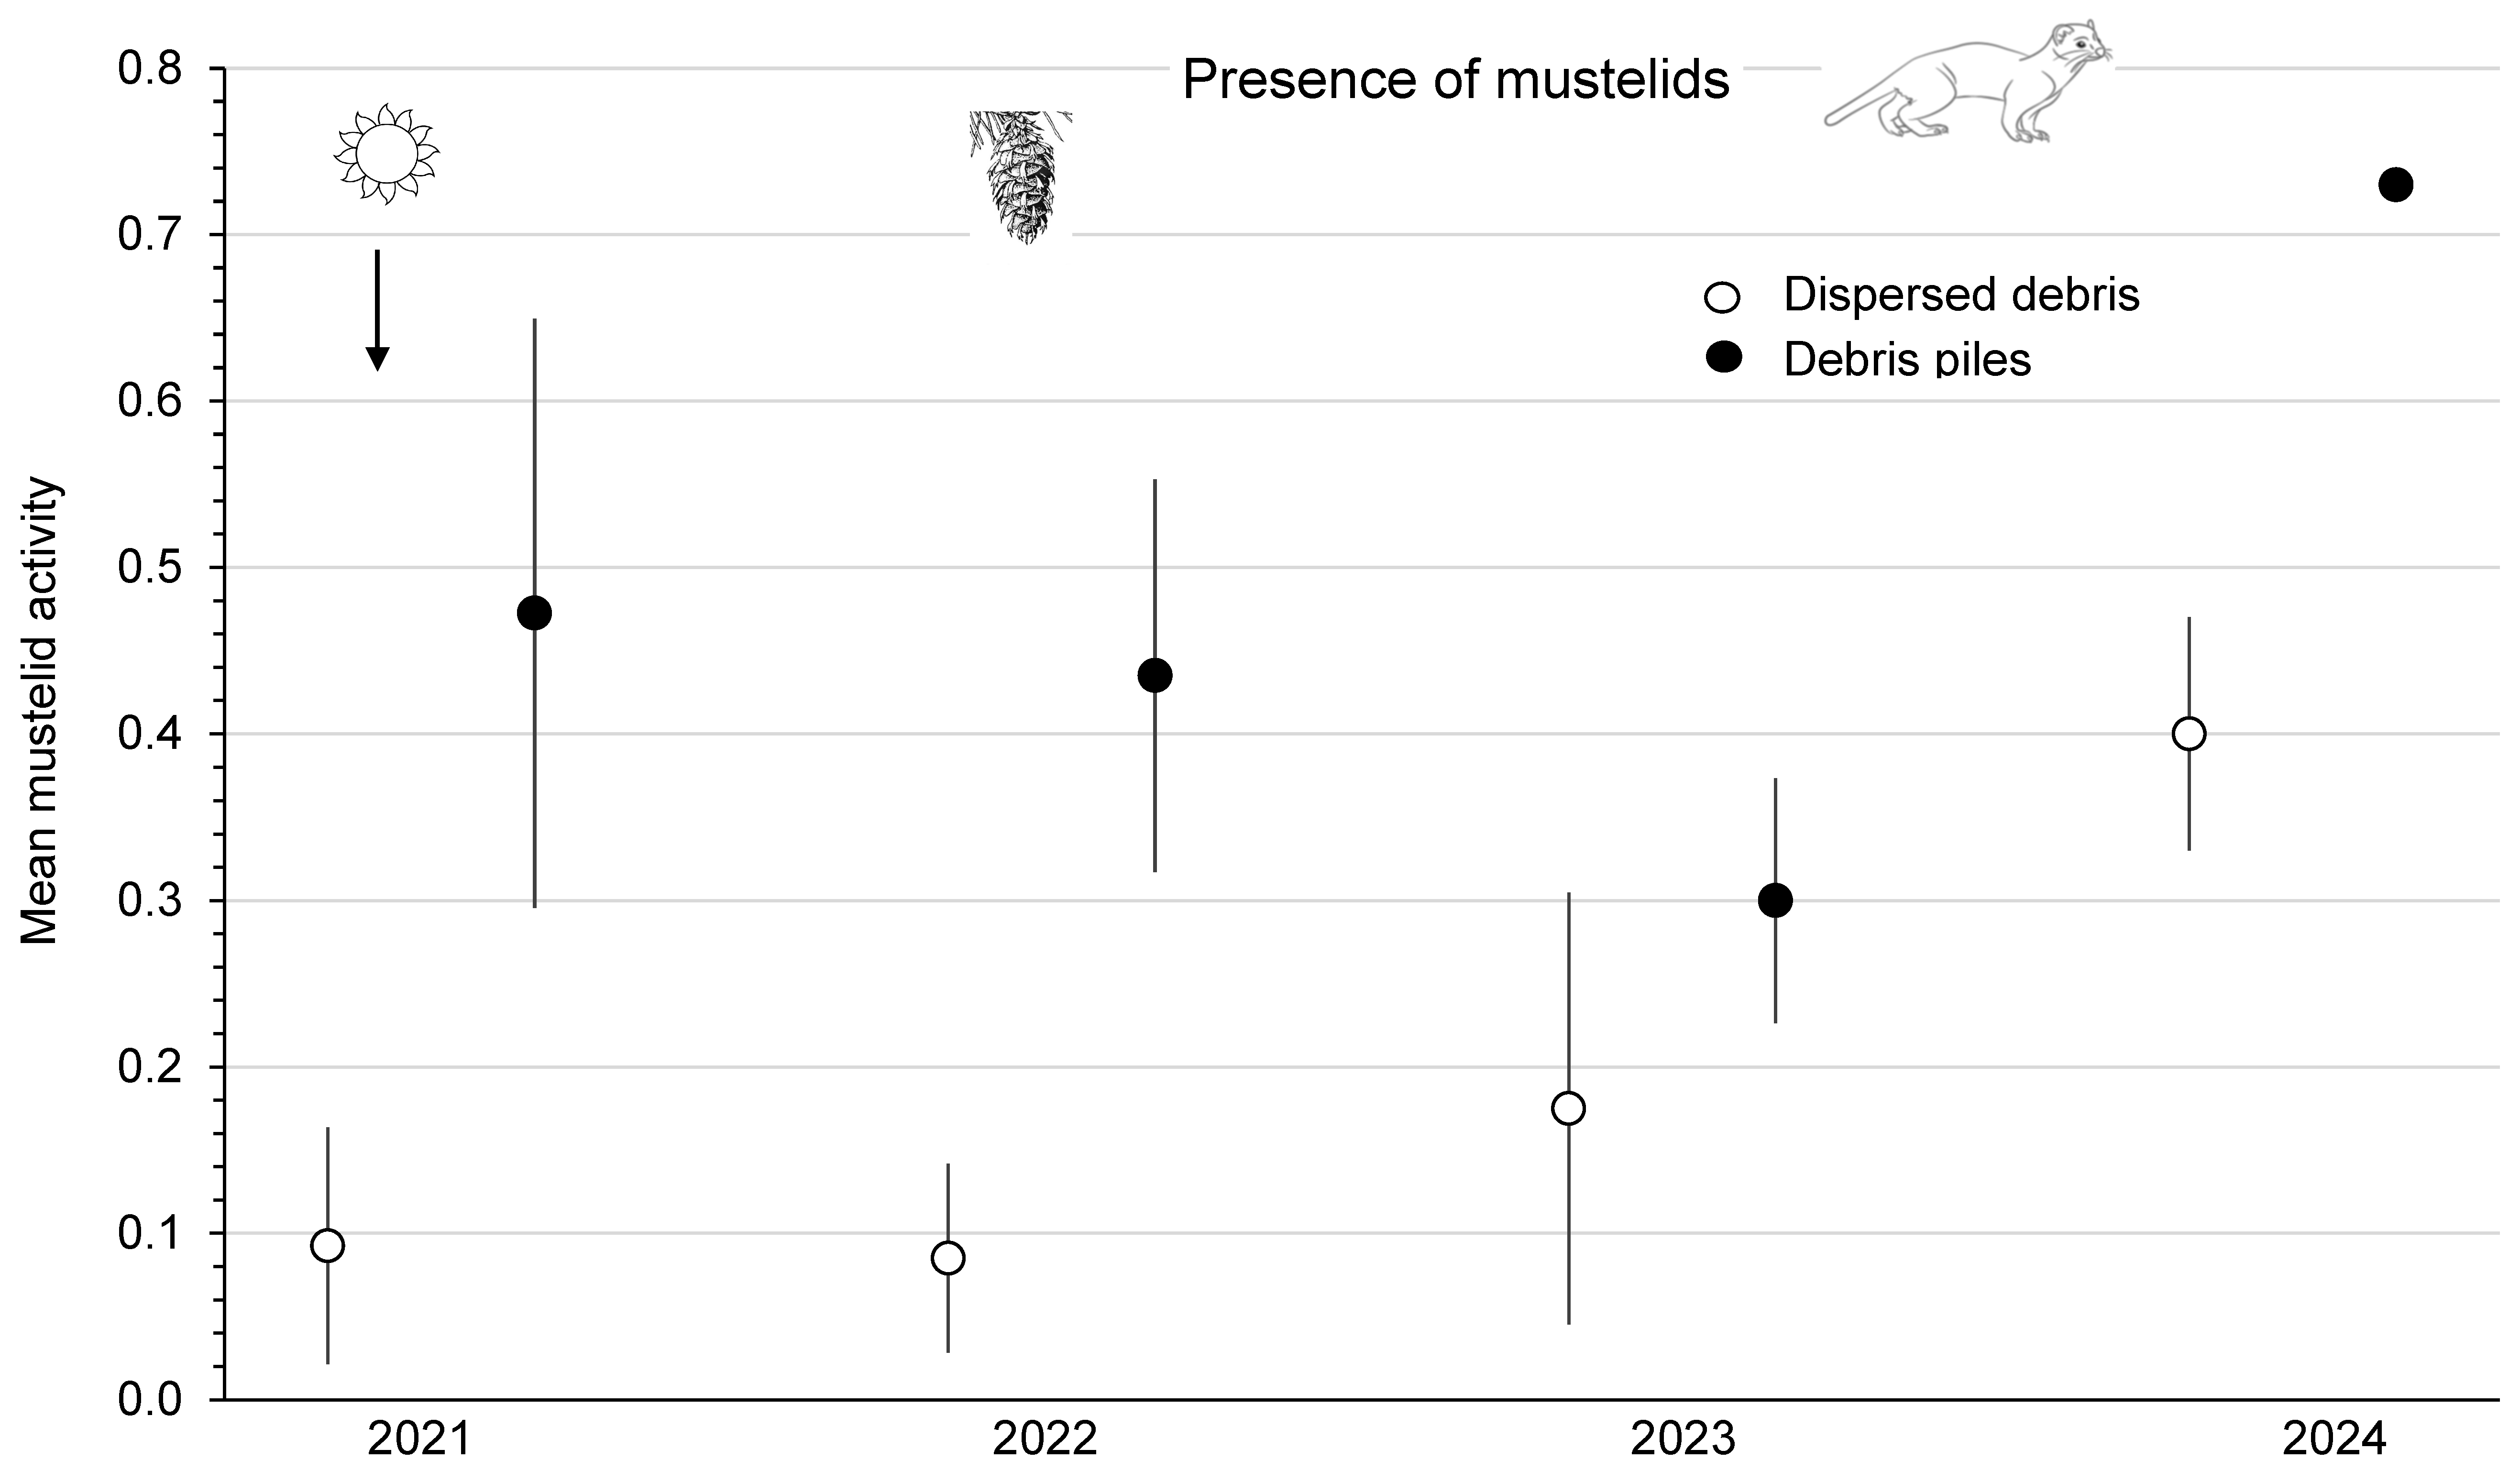
3.5. Activity of Weasels

There were no weasels captured in Longworth live traps on small-mammal old-forest grids each year from 2021 to 2024. Captures of weasels on second-growth forest grids numbered zero in 2023 and five in 2024. On clearcuts, the mean activity of mustelids was significantly (F1,3 = 13.75; p = 0.03) higher (by 1.7 to 5.1 times) in piles than in dispersed sites along index-lines at the Summerland and Golden areas from 2021 to 2023 (Figure 6). This measure of mustelid activity was similar (F3,3 = 3.17; p = 0.18) among the four blocks. There were no significant (p > 0.66) time or treatment x time interaction effects. However, at Summerland, both dispersed and piles sites had dramatic increases (2.3- to 2.4-fold) in mustelid activity in 2024 compared with 2023, which coincides with the highest numbers of small-mammal prey recorded at the study site (Figure 6).

4. Discussion

4.1. Cone Crops and Small Mammals

The outstanding cone crops of coniferous tree species in 2022 in the Pacific Northwest was likely stimulated by an unprecedented heat wave during the early summer of 2021 [3,4,5]. Evidence of this masting event was reported by coniferous tree seed orchards and collections in the southern interior of BC [8], field observations by recreationists, and our own observations at the two study areas and elsewhere in natural stands of Douglas-fir (A. Vyse, pers. obs.). The apparent widespread distribution of this event fits the areal extent of synchronous masting events of coniferous tree species across wide (up to 2500 km for Pinus) geographic regions of the northern hemisphere [1,2].
We report mean abundances and demography of the three major seed-eating small-mammal species in old forests during a 4-year period that encompassed an extreme heat wave, cone crops, and high numbers followed by declining numbers in 2024. P. maniculatus reached a mean abundance and peak of 12.4 and 17.2 mice/ha, respectively, in 2023 before declining over winter to 3.1 mice/ha. Measurements of reproductive performance followed this pattern, with consistently lower summer compared with winter survival. Although we had just two years (2023 and 2024) of data in second-growth forest sites, the mean abundances of deer mice were at comparable levels to those in old-forest sites in 2023, likely in response to the same seeding event. Mean levels of recruitment and the index of juvenile productivity also followed this pattern in 2023. In addition, there was a significant decline over winter in 2023–24 in all sites.
The waves of new juvenile deer mice appearing on our forest grids in 2023 seemed to be well beyond the reproductive capacity of the resident adult female mice. The mean index of juvenile productivity (ranging from 10.98 to 14.13) was substantially higher than expected based on mean litter sizes in BC of 4.04 [70] and 3.0–5.3 [14]. Thus, as discussed by [19], either litter sizes had increased, the survival of young during lactation was higher, there were additional litters, or the immigration of transient juvenile mice onto the grids had occurred, possibly in response to the substantial food supply from cone crops in 2022. These results were similar to those recorded over an earlier long-term (26 years) study of P. maniculatus in these same stands, where seedfall events from cone crops generated increases in abundance from enhanced reproduction and survival in five out of six events [19]. Mast crops in eastern North America have also increased populations of Peromyscus but there are always some seasons or years where they do not increase or even decline [71,72].
M. gapperi reached a mean and peak abundance of 6.1 and 11.0 mice/ha, respectively, in 2023, before declining over winter to 4.1 mice/ha. Although these population changes were not as dramatic as for P. maniculatus, the measurements of reproductive performance and survival also followed the pattern of abundance. In other studies, high-masting years of white pine in Maine and black spruce in Quebec [22] have led to peak populations of M. gapperi. In addition, M. gapperi exhibited three cyclic population fluctuations, with increases positively related to the cone crops of three coniferous tree species, again, in these same old-forest stands [23]. However, as reported by several authors, seedfall events may not always lead to population increases in Myodes [21,22,73]. The survival of red-backed voles was particularly poor in the summers of 2023 and 2024 at 41% and 48%, respectively, and may have contributed to the low amplitude of this population fluctuation in these two years. In laboratory feeding trials, the consumption of lodgepole pine and white spruce seeds by both P. maniculatus and M. gapperi was corroborated, but Douglas-fir seeds were not tested [13]. In western North America and elsewhere, deer mice have a long history as coniferous seed predators, particularly in limiting reforestation efforts by direct seeding Douglas-fir, lodgepole pine, and white spruce seeds on cutover forest land [17,18,20,74].
The abundance of N. amoenus may have been slightly enhanced in 2023 by the availability of coniferous seed. A possible explanation for this lack of response is that N. amoenus has general affinity for early successional habitats, edges, strips of residual forest, and “open” stands in managed landscapes [12,75]. In general, chipmunk (Tamias, Neotamias) species are not common in managed second-growth and uncut mature or older coniferous forests with reduced understory shrub cover [76,77].
Thus, H1, that increased food supply from the fall masting of Douglas-fir and spruce would enhance overwinter survival and reproductive output in the following summer breeding period for P. maniculatus and M. gapperi, was supported. However, there were insufficient numbers of N. amoenus; hence, we could not make a decision on the validity of H1 for this species. The Douglas-fir and spruce seedfall data were collected from a variety of locations in relatively undisturbed forests and seed orchards in the southern interior of BC.
There are two important caveats to this hypothesis. First, we inferred that the heavy seedfall event in 2022 also occurred at our Summerland and Golden study areas. Based on the responses of reproduction in P. maniculatus, in particular, in both old-forest and second-growth forest sites, and its abundance in dispersed debris and debris piles on clearcuts, the seedfall event occurred at a landscape scale. As noted, observations by recreationists support this contention. Considering the wide geographical area over which northern coniferous mast cone crops are synchronous, this assumption seems reasonable [1].
Second, coniferous seed from mature and old forests may extend into adjacent sites during seedfall and is still used as a means of natural regeneration for cutover forest land [78,79,80]. Seed dispersal curves for boreal tree species are strongly right-skewed [81]. For a forest type similar to that at Summerland, Douglas-fir seedfall was reduced by 75% at 15 m into a forest opening and by 88% at 30 m [82]. The range of average distances of seed dispersal was 70% to 23 m, 20% to 70 m, and 10% to 115 m from the edge of mature timber, with considerable variability among coniferous species depending upon the seed size [79]. Dispersal distances further than 150 m have also been reported, with seeds blown on snow as the suggested mechanism [81]. Therefore, Douglas-fir, spruce, and other conifer seeds from the 2022 cone crops were likely available for seed predators in the second-growth stands and clearcuts at our study areas. Spillover of rodents such as Myodes glareolus into adjacent open habitat patches from sources of coniferous seedfall in forest patches was reported in Austria [83].

4.2. Activity of Mustelids

Although no weasels were captured in live traps in the old-forest sites during the period from 2021 to 2024, and five were captured in the second-growth stands in 2024, we had 20 camera images (i.e., detections) of the two weasel species recorded in these same stands from 2021 to 2023 [84]. Of these 20 detections, 6 occurred in the old-forest sites and 14 in the second-growth sites over the 3-year camera period. In addition, the 20 detections over time consisted of 9 in 2021, 2 in 2022, and 9 in 2023.
The activity of small mustelids was significantly higher in debris piles than in dispersed debris on recent clearcuts at our Summerland and Golden study areas during the period from 2021 to 2023. Mustelid activity increased dramatically at the Summerland replicate blocks of dispersed debris and debris piles in 2024, probably owing to high numbers of prey species in the summer of 2023 and the winter of 2023–24. Thus, these results, plus the live captures in 2024 and camera detections of weasels in 2023, provide partial support for H2, i.e., that the increased activity of mustelids would follow high populations of small-mammal prey, and that mustelid predation would result in a decline in small mammals in 2024. The response of prey species and mustelids to dispersed and piles of debris concurred with an earlier report based on the number of years since harvest at these study areas [49].
Studies in Fennoscandia have suggested that predators cause population declines in various microtine species [85,86], with both numerical and functional responses by small weasels to prey abundance [87]. More recently, abundances of pine martens and small weasels were positively associated with population increases of rodents in Norway [88]. M. richardsonii populations have apparently shown cyclic dynamics that may have been related to cycling prey species such as M. gapperi in eastern Canada [43].
There are three important caveats to consider with this hypothesis. First, we did not have data for mustelid activity or small-mammal abundance for the Golden study area in 2024, nor did we have camera images for this final year at Summerland to provide as supplemental data. However, the high number of camera detections (9/20) of weasels in 2023 corresponded to increases in the mean number of detections of P. maniculatus (3 to 17 times higher) and M. gapperi (1.5 to 7 times higher) from 2022 to 2023 (T. Sullivan, unpublished).
Second, we assumed that weasels increasing in abundance on clearcut sites at Summerland would provide an indication of similar population increases at forest sites 3.7 to 4.9 km further away. Small mustelids are wide-ranging predators covering up to hundreds of hectares [25,89]. In addition, weasels are widely distributed in various forest successional stages, especially in linear habitats along edges and riparian courses that provide small-mammal prey and in the cover of understory vegetation and woody debris [28,31,32].
Third, the scientific literature focuses on the relationship of mustelid predation and vole populations in the genera Myodes and Microtus. However, food selection of the short-tailed weasel in forested environments, in particular, may include both P. maniculatus and shrews (Sorex spp.), sometimes at a similar frequency to that for voles [27,90]. Weasels prey on mixed populations of voles (Microtus and Myodes) and wood mice (Apodemus sylvaticus) in the United Kingdom and northern Europe [29]. Thus, weasels may have readily preyed on P. maniculatus as well as M. gapperi and other less-common species in our forest and clearcut sites during the winter of 2023–24, thereby leading to overwinter declines and low populations in 2024.
Our final hypothesis, H3, that the widespread cone crops (Douglas-fir and spruce) occurring in 2022 would also elicit the same mammalian responses in 2023 in the Rocky Mountains near Golden, BC, was partly supported for these rodent species. Populations of P. maniculatus, total vole populations, and the total number of small mammals increased from 2022 to 2023, but the time effect for microtines was not significant. However, we did not have mammal data from the Golden replicate blocks in 2024 and do not know if small-mammal populations there declined in 2024. At Summerland in 2024, small-mammal populations had declined dramatically (at least in debris piles) over winter, owing, presumably, to increased weasel predation. It may also be possible that other predator species such as hawks and owls may have contributed to the decline in prey numbers at our two study areas in the overwinter of 2023-24 and the summer 2024. However, we do not have any data on these other predators to support or refute this explanation.

4.3. Tree Seeds, Small Mammals, and Mustelids

We predicted that the masting of coniferous trees, ostensibly caused by an extreme heat wave event, led to high populations of seed-eating rodents, which, in turn, stimulated an increase in weasel predation. This pulsed resource (conifer seed) appeared to elicit a bottom–up effect (rodent seed predators) that was accompanied by a top–down trophic cascade (mustelid predation) [38,39]. A similar phenomenon has also been reported for forest tree seeds, rodents and pine martens, weasels, and owls in Poland [40]; house mice and stoats (Microtus richardsonii) in New Zealand [41,42,91]; and rodents, white-tailed deer (Odocoileus virginianus), and mammalian carnivores [71]. All of these examples had potentially negative effects by top–down predators on alternative prey species [38]. Although possibly occurring, we do not have any specific evidence of other species of predators (e.g., hawks, owls) or mustelid predation on alternative prey species at our study areas. Future studies could investigate potential effects of the buildup of predator numbers and implications for other prey species in this top–down trophic cascade.

5. Conclusions

To our knowledge, this study is the first to document the relationship among coniferous tree seeds, forest-floor small mammals, and mustelid predators in North America. This landscape-scale natural experiment covered a 4-year period that included the heat wave, cone crops, high numbers of forest-floor small mammals, and increased activity of small mustelids. The mean abundance and reproductive performance of P. maniculatus and M. gapperi populations (84.3% of the total number of small mammals) increased in several forested sites in response to the coniferous seedfall. Small mustelids responded positively to increased numbers of small-mammal prey and potentially acted in a regulatory and top–down function in these communities. The similar responses of these mammalian species at Summerland and Golden in southern BC indicated that this seedfall event and changes in the mammalian community occurred at a landscape scale. Population changes in mean numbers of P. maniculatus due to the seedfall event and the subsequent mustelid predation were within the average long-term abundance levels for this rodent in coniferous forests in southern BC. However, changes in the mean numbers of M. gapperi for a multi-annual population fluctuation were substantially reduced from previous peak abundance levels, possibly owing to competition with P. maniculatus and other seed consumers or enhanced predation on this vole by mustelids. Thus, the potential differential effects of large seed crops on consumers did not affect the mean abundance patterns of P. maniculatus but apparently reduced this metric for M. gapperi. Predator (mustelid)—prey (rodent) interactions in relation to coniferous seed crops may be intrinsically part of the seed–predator satiation effect of masting patterns. Heat waves, induced by anthropogenic climate change, may alter natural coniferous masting events, and their effects may change the number and species of mammalian seed consumers and their predators. In addition, periods of sustained temperature stress have negative effects on wildfire regimes and the mortality of plants and trees in forest ecosystems.

Author Contributions

Conceptualization, T.P.S. and D.S.S.; methodology, T.P.S.; formal analysis, T.P.S.; investigation, T.P.S. and D.S.S.; resources, T.P.S.; writing—original draft, T.P.S. and D.S.S.; writing—review and editing, D.S.S. and A.V. All authors have read and agreed to the published version of the manuscript.

Funding

This research was funded by the BC Habitat Conservation Trust Foundation, Forest Enhancement Society of BC, Gorman Bros. Lumber Ltd., and the Applied Mammal Research Institute.

Institutional Review Board Statement

All handling of the animals followed guidelines approved by the American Society of Mammalogists and the Animal Care Committee, University of British Columbia.

Informed Consent Statement

Not applicable.

Data Availability Statement

The data presented in this study are available on request from the corresponding author.

Acknowledgments

We thank Gorman Bros. Lumber Ltd. and the Applied Mammal Research Institute for logistical support, the Penticton Indian Band, and the Okanagan Nation Alliance for allowing us to conduct this work on their traditional territory and H. Sullivan for assistance with the fieldwork.

Conflicts of Interest

The authors declare no conflicts of interest. The funders had no role in the design of the study; in the collection, analyses, or interpretation of data; in the writing of the manuscript, or in the decision to publish the results.

References

  1. Koenig, W.D.; Knops, J.M.H. Scale of mast-seeding and tree-ring growth. Nature 1998, 396, 225–226. [Google Scholar] [CrossRef]
  2. Koenig, W.D.; Knops, J.M.H. The mystery of masting in trees. Am. Sci. 2005, 93, 340–347. [Google Scholar] [CrossRef]
  3. Thompson, V.; Kennedy-Asser, A.T.; Vosper, E.; Lo, Y.E.; Huntingford, C.; Andrews, O.; Collins, M.; Hegerl, G.C.; Mitchell, D. The 2021 western North America heat wave among the most extreme events ever recorded globally. Sci. Adv. 2022, 8, eabm6860. [Google Scholar] [CrossRef] [PubMed]
  4. Heeter, K.J.; Harley, G.L.; Abatzoglou, J.T.; Anchukaitis, K.J.; Cook, E.R.; Coulthard, B.L.; Dye, L.A.; Homfeld, I.K. Unprecedented 21st century heat across the Pacific Northwest of North America. Clim. Atmosph. Sci. 2023, 6, 5. [Google Scholar] [CrossRef]
  5. White, R.H.; Anderson, S.; Booth, J.F.; Braich, G.; Draeger, C.; Fei, C.; Harley, C.D.; Henderson, S.B.; Jakob, M.; Lau, C.A.; et al. The unprecedented Pacific Northwest heat-wave of June 2021. Nat. Commun. 2023, 14, 727. [Google Scholar] [CrossRef]
  6. Allen, C.D.; Breshears, D.D.; McDowell, N.G. On underestimation of global vulnerability to tree mortality and forest die-off from hotter drought in the Anthropocene. Ecosphere 2015, 6, 1–55. [Google Scholar] [CrossRef]
  7. Halofsy, J.E.; Peterson, D.L.; Harvey, B.J. Changing wildfire, changing forests: The effects of climate change on fire regimes and vegetation in the Pacific Northwest, USA. Fire Ecol. 2020, 16, 4. [Google Scholar] [CrossRef]
  8. British Columbia Ministry of Forests. Tree Seed Centre; Kalamalka Lake Tree Seed Orchards: Vernon, BC, Canada, 2023; Available online: https://forestgeneticsbc.ca/wp-content/uploads/2024/02/9-Dave-Kolotelo-Tree-Seed-Centre-Update.pdf (accessed on 20 February 2024).
  9. Feick, J.L. Conifer Cornucopia. The Great Divide Trail Association. 22 October 2022. Available online: https://www.greatdividetrail.com/conifer-cornucopia/ (accessed on 23 January 2025).
  10. Hagen, J. A Cone Crop for the Ages. Great Divide’s Fall Newsletter 2022. Great Divide Nature Interpretation. 2022. Available online: https://www.greatdivide.ca/category/newsletters/ (accessed on 23 January 2025).
  11. Merritt, J.F. Clethrionomys gapperi; Mamm. Species. 1981, No. 146, 1–9. Available online: https://academic.oup.com/mspecies/article/doi/10.2307/3503900/2600558 (accessed on 23 January 2025).
  12. Sutton, D.A. Tamias amoenus. Mamm. Species 1992, No. 390, 1–8. Available online: https://www.science.smith.edu/departments/biology/VHAYSSEN/msi/pdf/i0076-3519-390-01-0001.pdf (accessed on 23 January 2025).
  13. Lobo, N.; Duong, M.; Millar, J.S. Conifer-seed preferences of small mammals. Can. J. Zool 2009, 87, 773–780. [Google Scholar] [CrossRef]
  14. Nagorsen, D.W. Rodents and Lagomorphs of British Columbia; Royal BC Museum: Victoria, BC, Canada, 2005. [Google Scholar]
  15. Maser, C.; Claridge, A.W.; Trappe, J.M. Trees, Truffles, and Beasts: How Forests Function; Rutgers University Press: Piscataway, NJ, USA, 2008. [Google Scholar]
  16. Lobo, N.; Millar, J.S. The efficacy of conifer seeds as major food resources to deer mice (Peromyscus maniculatus) and southern red-backed voles (Myodes gapperi). Mammal. Biol. 2011, 76, 274–284. [Google Scholar] [CrossRef]
  17. Gashwiler, J.S. Tree seed abundance vs. deer mouse populations in Douglas-Fir clearcuts. Proc. Soc. Am. For. 1965, 1965, 219–222. [Google Scholar]
  18. Gashwiler, J.S. Deer mouse reproduction and its relationship to the tree seed crop. Am. Midl. Nat. 1979, 102, 95–104. [Google Scholar] [CrossRef]
  19. Sullivan, T.P.; Sullivan, D.S.; Boonstra, R.; Krebs, C.J.; Vyse, A. Population regulation in the deer mouse (Peromyscus maniculatus) in old-growth coniferous forests of southern British Columbia: Insights from a long-term study. Mam. Res. 2023, 68, 37–51. [Google Scholar] [CrossRef]
  20. Lobo, N.; Millar, J.S. Indirect and mitigated effects of pulsed resources on the population dynamics of a northern rodent. J. Anim. Ecol. 2013, 82, 814–825. [Google Scholar] [CrossRef]
  21. Elias, S.P.; Witham, J.W.; Hunter, M.L. A cyclic red-backed vole (Clethrionomys gapperi) population and seedfall over 22 years in Maine. J. Mammal. 2006, 87, 440–445. [Google Scholar] [CrossRef]
  22. Fauteux, D.; Cheveau, M.; Imbeau, L.; Drapeau, P. Cyclic dynamics of a boreal southern red-backed vole population in northwestern Quebec. J. Mammal. 2015, 96, 1–6. [Google Scholar] [CrossRef]
  23. Sullivan, T.P.; Sullivan, D.S.; Boonstra, R.; Krebs, C.J.; Vyse, A. Mechanisms of population limitation in the southern red-backed vole in conifer forests of western North America: Insights from a long-term study. J. Mammal. 2017, 98, 1367–1378. [Google Scholar] [CrossRef]
  24. Vander Wall, S.B. Cache site selection by chipmunks (Tamias spp.) and its influence on the effectiveness of seed dispersal in Jeffrey pine (Pinus jeffreyi). Oecologia 1993, 96, 246–252. [Google Scholar] [CrossRef]
  25. Buskirk, S.W.; Zielinski, W.J. Small and mid-sized carnivores. In Mammal Community Dynamics: Management and Conservation in the Coniferous Forests of Western North America; Zabel, C.J., Anthony, R.G., Eds.; Cambridge University Press: Cambridge, UK, 2003; pp. 207–249. [Google Scholar]
  26. Sheffield, S.R.; Thomas, H.H. Mustela frenata; Mamm. Species. 1997. No. 570; 1–9. Available online: https://www.science.smith.edu/departments/biology/VHAYSSEN/msi/pdf/i0076-3519-570-01-0001.pdf (accessed on 23 January 2025).
  27. Simms, D.A. North American weasels: Resource utilization and distribution. Can. J. Zool. 1979, 57, 504–520. [Google Scholar]
  28. Hargis, C.D.; Bissonette, J.A.; Turner, D.L. The influence of forest fragmentation and landscape pattern on American martens. J. Appl. Ecol. 1999, 36, 157–172. [Google Scholar] [CrossRef]
  29. King, C.M.; Powell, R.A. The Natural History of Weasels and Stoats: Ecology, Behavior, Management; Oxford University Press: New York, NY, USA, 2007. [Google Scholar]
  30. Linnell, M.A.; Epps, C.W.; Forsman, E.D.; Zielinski, W.J. Survival and predation of weasels (Mustela erminea, Mustela frenata) in North America. Northwest Sci. 2017, 91, 15–26. [Google Scholar] [CrossRef]
  31. Evans, B.E.; Mortelliti, A. Forest disturbance and occupancy patterns of American ermine (Mustela richardsonii) and long-tailed weasel (Neogale frenata): Results from a large-scale natural experiment in Maine, United States. J. Mammal. 2022, 103, 1338–1349. [Google Scholar] [CrossRef]
  32. Lisgo, K.A.; Bunnell, F.L.; Harestad, A.S. Summer and fall use of logging residue piles by female short-tailed weasels. USDA For. Serv. Gen. Tech. Rep. PSW-GTR 2002, 181, 319–329. [Google Scholar]
  33. Sullivan, T.P.; Sullivan, D.S.; Lindgren, P.M.F.; Ransome, D.B. If we build habitat, will they come? Woody debris structures and conservation of forest mammals. J. Mammal. 2012, 93, 1456–1468. [Google Scholar] [CrossRef]
  34. Sullivan, T.P.; Sullivan, D.S.; Sullivan, J.H. Mammalian responses to windrows of woody debris on clearcuts: Abundance and diversity of forest-floor small mammals and presence of small mustelids. For. Ecol. Manag. 2017, 399, 143–154. [Google Scholar] [CrossRef]
  35. Seip, C.; Hodder, D.; Crowley, S.; Johnson, C. Use of constructed coarse woody debris corridors in a clearcut by American martens (Martes americana) and their prey. Forestry 2018, 91, 506–513. [Google Scholar] [CrossRef]
  36. Ogawa, R.; Mortelliti, A.; Witham, J.W.; Hunter, M.L. Demographic mechanisms linking tree seeds and rodent population fluctuations: Insights from a 33-year study. J. Mammal 2017, 98, 419–427. [Google Scholar] [CrossRef]
  37. Zwolak, R.; Witczuk, J.; Bogdiewicz, M.; Rychlik, L.; Pagacz, S. Simultaneous population fluctuations of rodents in montane forests and alpine meadows suggest indirect effects of tree masting. J. Mammal. 2018, 99, 586–595. [Google Scholar] [CrossRef]
  38. Ostfeld, R.S.; Keesing, F. Pulsed resources and community dynamics of consumers in terrestrial ecosystems. Trends Ecol. Evol. 2000, 15, 232–237. [Google Scholar] [CrossRef]
  39. Pace, M.L.; Cole, J.J.; Carpenter, S.R.; Kitchell, J.F. Trophic cascades revealed in diverse ecosystems. Tree 1999, 14, 483–488. [Google Scholar] [CrossRef]
  40. Jędrzejewska, B.; Jędrzejewski, W. Predation in Vertebrate Communities: The Bialowieźa Primeval Forest as a Case Study; Springer: Berlin, Germany, 1998. [Google Scholar]
  41. King, C.M. The relationship between beech (Nothofagus spp.) seedfall and populations of mice (Mus musculus), and the demographic and dietary responses of stoats (Mustela erminea), in three New Zealand forests. J. Anim. Ecol. 1983, 52, 141–166. [Google Scholar] [CrossRef]
  42. O’Donnell, C.F.J.; Phillipson, S.M. Predicting the incidence of mohua predation from the seedfall, mouse, and predator fluctuations in beech forests. N. Z. J. Zool. 1996, 23, 287–293. [Google Scholar] [CrossRef]
  43. Johnson, D.R.; Swanson, B.J.; Eger, J.L. Cyclic dynamics of eastern Canadian ermine populations. Can. J. Zool. 2000, 78, 835–839. [Google Scholar] [CrossRef]
  44. Cheveau, M.; Drapeau, P.; Imbeau, L.; Bergeron, Y. Owl winter irruptions as an indicator of small mammal population cycles in the boreal forest of eastern North America. Oikos 2004, 107, 190–198. [Google Scholar] [CrossRef]
  45. Schnurr, J.L.; Ostfeld, R.S.; Canham, C.D. Direct and indirect effects of masting on rodent populations and tree seed survival. Oikos 2002, 96, 402–410. [Google Scholar] [CrossRef]
  46. Zwolak, R.; Celebias, P.; Bogdziewicz, M. Global patterns in the predator satiation effect of masting: A meta-analysis. Proc. Nat. Acad. Sci. USA 2022, 119, e2105655119. [Google Scholar] [CrossRef]
  47. Bogdziewicz, M.; Zwolak, R.; Crone, E.E. How do vertebrates respond to mast seeding? Oikos 2016, 125, 300–307. [Google Scholar] [CrossRef]
  48. Meidinger, D.; Pojar, J. Ecosystems of British Columbia; Special Report Series No. 6; Research Branch, BC Ministry of Forests: Victoria, BC, Canada, 1991. [Google Scholar]
  49. Sullivan, T.P.; Sullivan, D.S. Woody debris structures on large clearcut openings: Oases for small mustelids and prey species? For. Ecol. Manag. 2023, 543, 121117. [Google Scholar] [CrossRef]
  50. Krebs, C.J.; Keller, B.L.; Tamarin, R.H. Microtus population biology: Demographic changes in fluctuating populations of M. ochrogaster and M. pennsylvanicus in southern Indiana. Ecology 1969, 50, 587–607. [Google Scholar] [CrossRef]
  51. Nagorsen, D.W. Opossums, Shrews, and Moles of British Columbia. In The Mammals of British Columbia; University of British Columbia Press: Vancouver, BC, Canada, 1996; Volume 2. [Google Scholar]
  52. Sikes, R.S. The Animal Care and Use Committee of the American Society of Mammalogists. Guidelines of the American Society of Mammalogists for the use of wild mammals in research and education. J. Mammal. 2016, 97, 663–688. [Google Scholar] [CrossRef]
  53. Pearson, D.E.; Ruggiero, L.F. Transect versus grid trapping arrangements for sampling small-mammal communities. Wildl. Soc. Bull. 2003, 31, 454–459. [Google Scholar]
  54. Sullivan, T.P.; Sullivan, D.S. Forecasting vole population outbreaks: The rise and fall of a major mammalian pest. For. Ecol. Manag. 2010, 260, 983–993. [Google Scholar] [CrossRef]
  55. Seber, G.A.F. The Estimation of Animal Abundance and Related Parameters, 2nd ed.; Charles Griffin: London, UK, 1982. [Google Scholar]
  56. Krebs, C.J. Ecological Methodology; Addison Wesley Longman, Inc.: White Plains, NY, USA, 1999; 624p. [Google Scholar]
  57. Krebs, C.J.; Boonstra, R.; Gilbert, S.; Reid, D.; Kenney, A.J.; Hofer, E.J. Density estimation for small mammals from livetrapping grids: Rodents in northern Canada. J. Mammal. 2011, 92, 974–981. [Google Scholar] [CrossRef]
  58. Krebs, C.J.; Boonstra, R. Trappability estimates for mark-recapture data. Can. J. Zool. 1984, 62, 2440–2444. [Google Scholar] [CrossRef]
  59. Murie, O. A Field Guide to Animal Tracks; The Peterson Field Guide Series 9; Houghton Mifflin Co.: Boston, MA, USA, 1954. [Google Scholar]
  60. Zielinski, W.J.; Kucera, T.E. (Eds.) American Marten, Fisher, Lynx, and Wolverine: Survey Methods for Their Detection; Gen Tech Rep PSW-GTR-157; USDA Forest Service: Ogden, UT, USA, 1995. [Google Scholar]
  61. British Columbia Ministry of Environment. Inventory Methods for Marten and Weasels; Standards for Components of British Columbia’s Biodiversity No. 24 Version 2.0; British Columbia Ministry of Environment: Victoria, BC, Canada, 1998. [Google Scholar]
  62. Rezendes, P. Tracking and the Art of Seeing: How to Read Animal Tracks and Sign; Firefly Books: Willowdale, ON, Canada, 1999. [Google Scholar]
  63. IBM Corp. IBM SPSS Statistics for Windows, version 29.0; IBM Corp.: Armonk, NY, USA, 2023. [Google Scholar]
  64. Littel, R.C. Statistical analysis of experiments with repeated measures. HortScience 1989, 24, 36–40. [Google Scholar]
  65. Kuehl, R.C. Statistical Principles of Research Design and Analysis; Duxbury Press: Belmont, CA, USA, 1994. [Google Scholar]
  66. Huynh, H.; Feldt, L.S. Estimation of the Box correction for degrees of freedom from sample data in the randomized block and split-plot designs. J. Educ. Stat. 1976, 1, 69–82. [Google Scholar] [CrossRef]
  67. Fowler, J.; Cohen, L.; Jarvis, P. Practical Statistics for Field Biology, 2nd ed.; John Wiley and Sons: Hoboken, NJ, USA, 1998; 259p. [Google Scholar]
  68. Saville, D.J. Multiple comparison procedures: The practical solution. Am. Stat. 1990, 44, 174–180. [Google Scholar] [CrossRef]
  69. Zar, J.H. Biostatistical Analysis; Prentice-Hall, Inc.: Englewood Cliffs, NJ, USA, 1999; 663p. [Google Scholar]
  70. Banfield, A.W.F. The Mammals of Canada; University of Toronto Press: Toronto, ON, Canada, 1974. [Google Scholar]
  71. McShea, W.J. The influence of acorn crops on annual variation in rodent and bird populations. Ecology 2000, 81, 228–238. [Google Scholar] [CrossRef]
  72. Elias, S.P.; Witham, J.W.; Hunter, M.L. Peromyscus leucopus abundance and acorn mast: Population fluctuation patterns over 20 years. J. Mammal. 2004, 85, 743–747. [Google Scholar] [CrossRef]
  73. Boonstra, R.; Krebs, C.J. Population limitation of the northern red-backed vole in the boreal forests of northern Canada. J. Anim. Ecol. 2006, 75, 1269–1284. [Google Scholar] [CrossRef]
  74. Sullivan, T.P.; Sullivan, D.S. The use of alternative foods to reduce lodgepole pine seed predation by small mammals. J. Appl. Ecol. 1982, 19, 33–45. [Google Scholar] [CrossRef]
  75. Zwolak, R. A meta-analysis of the effects of wildfire, clearcutting, and partial harvest on the abundance of North American small mammals. For. Ecol. Manag. 2009, 258, 539–545. [Google Scholar] [CrossRef]
  76. Rosenberg, D.K.; Anthony, R.G. Differences in Townsend’s chipmunk populations between second- and old-growth forests in western Oregon. J. Wildl. Manag. 1993, 57, 365–373. [Google Scholar] [CrossRef]
  77. Hayes, J.P.; Horvath, E.G.; Hounihan, P. Townsend’s chipmunk populations in Douglas-fir plantations and mature forests in the Oregon coast range. Can. J. Zool. 1995, 73, 67–73. [Google Scholar] [CrossRef]
  78. Gashwiler, J.S. Seed fall of three conifers in west-central Oregon. For. Sci. 1969, 15, 290–295. [Google Scholar]
  79. McCaughey, W.W.; Schmidt, W.C.; Shearer, R.C. ; Shearer, R.C. (Compiler) Seed-dispersal characteristic of conifers in the inland mountain west. In Proceedings of the Conifer Tree Seed in the Inland Mountain West Symposium, Missoula, MT, USA, 5–6 August 1985; Forest Service, U.S. Department of Agriculture, Intermountain Research Station, Northern Region: Albany, CA, USA, 1985. [Google Scholar]
  80. Weetman, G.; Vyse, A. Natural Regeneration. In Regenerating B.C.’s Forests; Lavender, D.P., Parish, R., Johnson, C., Montgomery, G., Vyse, A., Willis, R., Winston, D., Eds.; UBC Press: Vancouver, BC, Canada, 1990; pp. 118–129. [Google Scholar]
  81. Greene, D.F.; Zasada, J.C.; Sirois, L.; Kneeshaw, D.; Morin, H.; Charron, I.; Simard, M.-J. A review of the regeneration dynamics of North American boreal forest tree species. Can. J. For. Res. 1999, 29, 824–839. [Google Scholar] [CrossRef]
  82. Huggard, D.J.; Arsenault, A.; Lloyd, D.; Vyse, A.; Klenner, W. The Opax Mountain Silviculture Systems Project: Preliminary results for managing complex, dry interior Douglas-fir forests. Min. For. Res. Program Ext. Note 2005, 72, 16. [Google Scholar]
  83. Sachser, F.; Pesendorfer, M.; Gratzer, G.; Nopp-Mayr, U. Differential spatial responses of rodents to masting on forest sites with differing disturbance history. Ecol. Evol. 2021, 11, 11890–11902. [Google Scholar] [CrossRef]
  84. Sullivan, T.P.; Sullivan, D.S. Influence of stand thinning on wildlife in managed second-growth forests: Tree squirrels, small mustelids, and mammalian species richness. Wildl. Res. 2024, 51, WR24063. [Google Scholar] [CrossRef]
  85. Henttonen, H.; Oksanen, T.; Jortikka, A.; Haukisalmi, V. How much do weasels shape microtine cycles in the northern Fennoscandian taiga? Oikos 1987, 50, 353–365. [Google Scholar] [CrossRef]
  86. Hanski, I.; Hansson, L.; Henttonen, H. Specialist predators, generalist predators, and the microtine rodent cycle. J. Anim. Ecol. 1991, 60, 353–367. [Google Scholar] [CrossRef]
  87. Korpimaki, E.; Norrdahl, K.; Rinta-Jaskari, T. Responses of stoats and least weasels to fluctuating food abundances: Is the low phase of the vole cycle due to mustelid predation? Oecologia 1991, 88, 552–561. [Google Scholar] [CrossRef] [PubMed]
  88. Cano-Martinez, R.; Carricondo-Sanchez, D.; Devineau, O.; Odden, M. Small rodent cycles influence interactions among predators in a boreal forest ecosystem. Mammal Res. 2021, 66, 592–593. [Google Scholar] [CrossRef]
  89. Powell, R.A. Structure and spacing of Martes populations. In Martens, Sables, and Fishers: Biology and Conservation; Buskirk, S.W., Harestad, A.S., Raphael, M.G., Powell, R.A., Eds.; Comstock Publishing Associates, Cornell University Press: Ithaca, NY, USA, 1994; pp. 101–121. [Google Scholar]
  90. Edwards, M.A.; Forbes, G.J. Food habits of ermine, Mustela erminea, in a forested landscape. Can. Field Nat. 2003, 117, 245–248. [Google Scholar] [CrossRef]
  91. Wilson, P.R.; Karl, B.J.; Toft, R.J.; Beggs, J.R.; Taylor, R.H. The role of introduced predators and competitors in the decline of kaka (Nestor meridionalis) populations in New Zealand. Biol. Conserv. 1998, 83, 175–185. [Google Scholar] [CrossRef]
Figure 1. Mean (n = 3 replicate sites ± SE) number of Peromyscus maniculatus per ha, as an index, based on Jolly–Seber population estimates and effective trapped areas from 2021 to 2024 in old-forest sites in southern British Columbia, Canada. Datapoints indicate individual trapping weeks in each summer (May to October), and dots indicate those winter periods when we did not sample populations. Mean numbers increased significantly in 2023 after substantial cone crops in the previous year. Mean numbers then declined again in 2024, likely owing to weasel predation.
Ecologies 06 00039 g001
Figure 2. Mean (n = 3 replicate sites ± SE) number of Myodes gapperi per ha, as an index, based on Jolly–Seber population estimates and effective trapped areas from 2021 to 2024 in old-forest sites in southern British Columbia, Canada. Datapoints indicate individual trapping weeks in each summer (May to October), and dots indicate those winter periods when we did not sample populations. Mean numbers increased significantly in 2023 after substantial cone crops in the previous year but were similar in 2024.
Ecologies 06 00039 g002
Figure 3. Mean (n = 3 replicate sites ± SE) total number of small mammals per ha, as an index, based on Jolly–Seber population estimates and effective trapped areas from 2021 to 2024 in old-forest sites in southern British Columbia, Canada. Datapoints indicate individual trapping weeks in each summer (May to October), and dots indicate those winter periods when we did not sample populations. Mean numbers increased significantly in 2023 after substantial cone crops in the previous year. Mean numbers then declined again in 2024, likely owing to weasel predation.
Ecologies 06 00039 g003
Figure 4. Mean (n = 4 replicate sites ± SE) annual number of Peromyscus maniculatus per index line, based on Jolly–Seber population estimates from 2021 to 2024 in sites with dispersed debris and piles of debris on recent clearcuts in southern British Columbia, Canada. Deer mouse numbers increased 4.4- to 4.9-fold from 2022 to 2023, and this significant time effect was likely related to the substantial cone crops in 2022. Mean numbers then declined again in 2024, likely owing to weasel predation.
Ecologies 06 00039 g004
Figure 5. Mean (n = 4 replicate sites ± SE) annual total number of small mammals per index line, based on Jolly–Seber population estimates from 2021 to 2024 in sites with dispersed debris and piles of debris in recent clearcuts in southern British Columbia, Canada. Mean total numbers of small mammals increased 1.7- to 2.0-fold from 2022 to 2023, and this significant time effect was likely related to the substantial cone crops in 2022. Mean numbers then declined again in 2024, likely owing to weasel predation.
Ecologies 06 00039 g005
Figure 6. Mean (n = 4 replicate sites) ± SE annual estimate of mustelid activity per index line in sites with dispersed debris and piles of debris from 2021 to 2024 in southern British Columbia, Canada. The increase in mustelid activity in 2024 is presumably in response to high numbers of small-mammal prey.
Ecologies 06 00039 g006
Table 1. Time-line of activities for the study of forest-floor small mammals and weasel activity at old-forest and managed second-growth forest sites at Summerland and at clearcut-harvested sites with and without debris piles at Summerland and Golden in southern BC, Canada. SUM = Summerland; GOLD = Golden.
ParameterOld ForestSecond-Growth ForestDispersed + Piles of DebrisDispersed + Piles of Debris
Years2021–20242023–20242021–20242021–2023
LocationSUMSUMSUMGOLD
No. of replicate sites3422
Monitoring of small mammalsYesYesYesYes
Monitoring of weasel presenceCapturesCapturesOverall activityOverall activity
MethodologyGridsGridsIndex linesIndex lines
Table 2. Mean (n = 3 replicate sites) ± SE estimates of demographic responses of Peromyscus maniculatus, Myodes gapperi, and Neotamias amoenus per year from 2021 to 2024 in old-growth coniferous forest in southern British Columbia, Canada, and results of the ANOVA. Within a row, mean values with different letters are significantly different by Duncan’s multiple-range test. Significant values are given in bold text. J-S = Jolly–Seber.
Species and ParameterYear
P. maniculatus
Parameter2021202220232024F3,8p
Abundance/ha6.1 ± 0.1 b2.1 ± 0.5 bc12.4 ± 1.8 a3.1 ± 0.5 b22.14<0.01
Annual peak abundance/ha8.6 ± 0.8 b3.8 ± 0.8 b17.2 ± 2.7 a5.3 ± 1.3 b14.06<0.01
Number of lactating females3.0 ± 1.71.3 ± 0.93.7 ± 1.72.7 ± 2.20.350.80
Total number recruits25.0 ± 3.5 ab6.7 ± 2.8 bc40.3 ± 8.1 a14.7 ± 1.8 b9.49<0.01
Total number of juvenile recruits19.3 ± 3.4 b5.3 ± 2.2 c34.3 ± 4.8 a12.0 ± 1.0 bc15.24<0.01
Index of juvenile2.72 ± 1.643.44 ± 2.3813.60 ± 5.134.33 ± 3.382.250.16
productivity
Summer J-S survival0.58 ± 0.130.77 ± 0.120.66 ± 0.100.53 ± 0.151.010.44
 (rate per 28 days)
F2,6p
Winter J-S survival 0.78 ± 0.020.83 ± 0.050.72 ± 0.022.030.21
 (rate per 28 days)
M. gapperi
Parameter2021202220232024F3,8p
Abundance/ha1.1 ± 0.3 c2.0 ± 0.8 bc6.1 ± 0.4 a4.1 ± 1.4 ab6.980.01
Peak abundance/ha2.8 ± 1.0 b3.5 ± 1.0 b11.0 ± 1.5 a8.2 ± 3.2 ab4.580.04
Number of lactating females1.0 ± 1.01.7 ± 1.27.3 ± 3.35.7 ± 3.71.400.31
Total number of recruits3.0 ± 0.6 c5.0 ± 0.6 bc20.7 ± 3.2 a11.7 ± 2.7 b13.94<0.01
Total number of juvenile recruits0.7 ± 0.3 c2.7 ± 0.3 bc13.7 ± 2.7 a6.3 ± 0.9 b15.53<0.01
Index of juvenile0.00 ± 0.000.92 ± 0.584.90 ± 3.552.54 ± 1.291.260.35
productivity
Summer J-S survival0.86 ± 0.14 a0.71 ± 0.07 ab0.41 ± 0.03 b0.48 ± 0.04 b5.180.03
 (rate per 28 days)
F2,6p
Winter J-S survival 0.94 ± 0.060.89 ± 0.050.86 ± 0.051.360.33
 (rate per 28 days)
N. amoenus
Parameter2021202220232024F3,8p
Abundance/ha1.3 ± 0.52.2 ± 0.33.1 ± 0.61.3 ± 0.23.330.08
Peak abundance/ha3.4 ± 1.53.6 ± 0.85.2 ± 1.42.2 ± 0.51.240.36
Number of lactating females0.7 ± 0.70.0 ± 0.00.7 ± 0.70.3 ± 0.30.410.75
Total number of recruits5.3 ± 0.93.3 ± 1.25.3 ± 0.92.3 ± 0.92.380.15
Total number of juvenile recruits1.3 ± 0.90.0 ± 0.01.3 ± 0.90.0 ± 0.01.520.28
Index of juvenile0.50 ± 0.500.0 ± 0.00.50 ± 0.500.0 ± 0.00.670.60
productivity
Summer J-S survival0.49 ± 0.290.95 ± 0.030.77 ± 0.080.81 ± 0.060.440.73
 (rate per 28 days)
F2,6p
Winter J-S survival 0.98 ± 0.010.97 ± 0.030.96 ± 0.010.600.58
 (rate per 28 days)
Table 3. Mean (n = 4 replicate sites) ± SE abundance of P. maniculatus, M. gapperi, and total forest-floor small mammals per ha as an index based on Jolly–Seber population estimates and effective trapped areas between heavily thinned and lightly thinned stands of managed lodgepole pine forest during 2023 and 2024 in the Summerland study area as well as results of the RM-ANOVA. Within a species, columns of mean values with different letters are significantly different. Significant values are given in bold text.
RM-ANOVA
TreatmentTreatmentTimeTreatment × Time
Species + YearHeavily ThinnedLightly ThinnedF1,6pF1,6pF1,6p
P. maniculatusAA3.290.1243.45<0.011.610.25
  202313.1 ± 2.68.2 ± 1.6
  20242.6 ± 0.51.1 ± 0.3
M. gapperiBA7.570.031.570.262.240.19
  20231.7 ± 0.84.6 ± 0.4
  20241.8 ± 0.93.6 ± 0.4
Total number of small mammalsAA0.240.6462.39<0.010.620.46
  202316.9 ± 3.314.6 ± 1.6
  20245.6 ± 1.75.4 ± 0.4
Table 4. Mean (n = 4 replicate sites) ± SE estimates of reproductive parameters for Peromyscus maniculatus and Myodes gapperi per year in 2023 and 2024 in second-growth forests with heavily and lightly thinned treatments at the Summerland study area as well as results of the RM-ANOVA. Within a parameter, columns of mean values with different letters are significantly different. Significant values are given in bold text.
RM-ANOVA
TreatmentTreatmentTimeTreatment × Time
Parameter and YearHeavily ThinnedLightly ThinnedF1,6pF1,6pF1,6p
P. maniculatus
Number of lactating femalesAA0.090.783.770.100.790.08
 20233.5 ± 1.03.0 ± 1.2
 20241.5 ± 0.61.5 ± 0.5
Total number of recruitsAB7.110.0431.66<0.014.100.09
 202336.0 ± 5.817.0 ± 4.7
 202410.5 ± 2.15.0 ± 2.0
Total number of juvenile recruitsAA2.820.1452.09<0.011.720.24
 202330.3 ± 5.021.0 ± 2.9
 20247.5 ± 1.75.3 ± 1.1
Index of juvenile productivity 0.140.726.630.040.220.65
 202310.98 ± 3.7114.13 ± 6.29
 20242.88 ± 1.092.38 ± 0.80
M. gapperi
Number of lactating femalesAA4.490.084.540.080.390.55
 20230.5 ± 0.34.5 ± 1.3
 20243.3 ± 1.76.0 ± 1.6
Total number of recruitsBA6.940.049.480.0219.36<0.01
 20235.8 ± 2.317.5 ± 1.0
 20247.3 ± 2.99.0 ± 0.8
Total number of juvenile recruitsAA5.350.067.900.0320.21<0.01
 20232.5 ± 0.610.0 ± 1.4
 20244.0 ± 1.63.5 ± 1.2
Index of juvenile productivityAA0.680.441.830.232.100.20
 20231.25 ± 0.952.99 ± 0.93
 20241.32 ± 0.631.09 ± 0.67
Disclaimer/Publisher’s Note: The statements, opinions and data contained in all publications are solely those of the individual author(s) and contributor(s) and not of MDPI and/or the editor(s). MDPI and/or the editor(s) disclaim responsibility for any injury to people or property resulting from any ideas, methods, instructions or products referred to in the content.

