
Environmental Heterogeneity Drives Secondary Metabolite Diversity from Mesquite Pods in Semiarid Regions

 ,
,  , , , , , , and
Abstract
1. Introduction
2. Materials and Methods
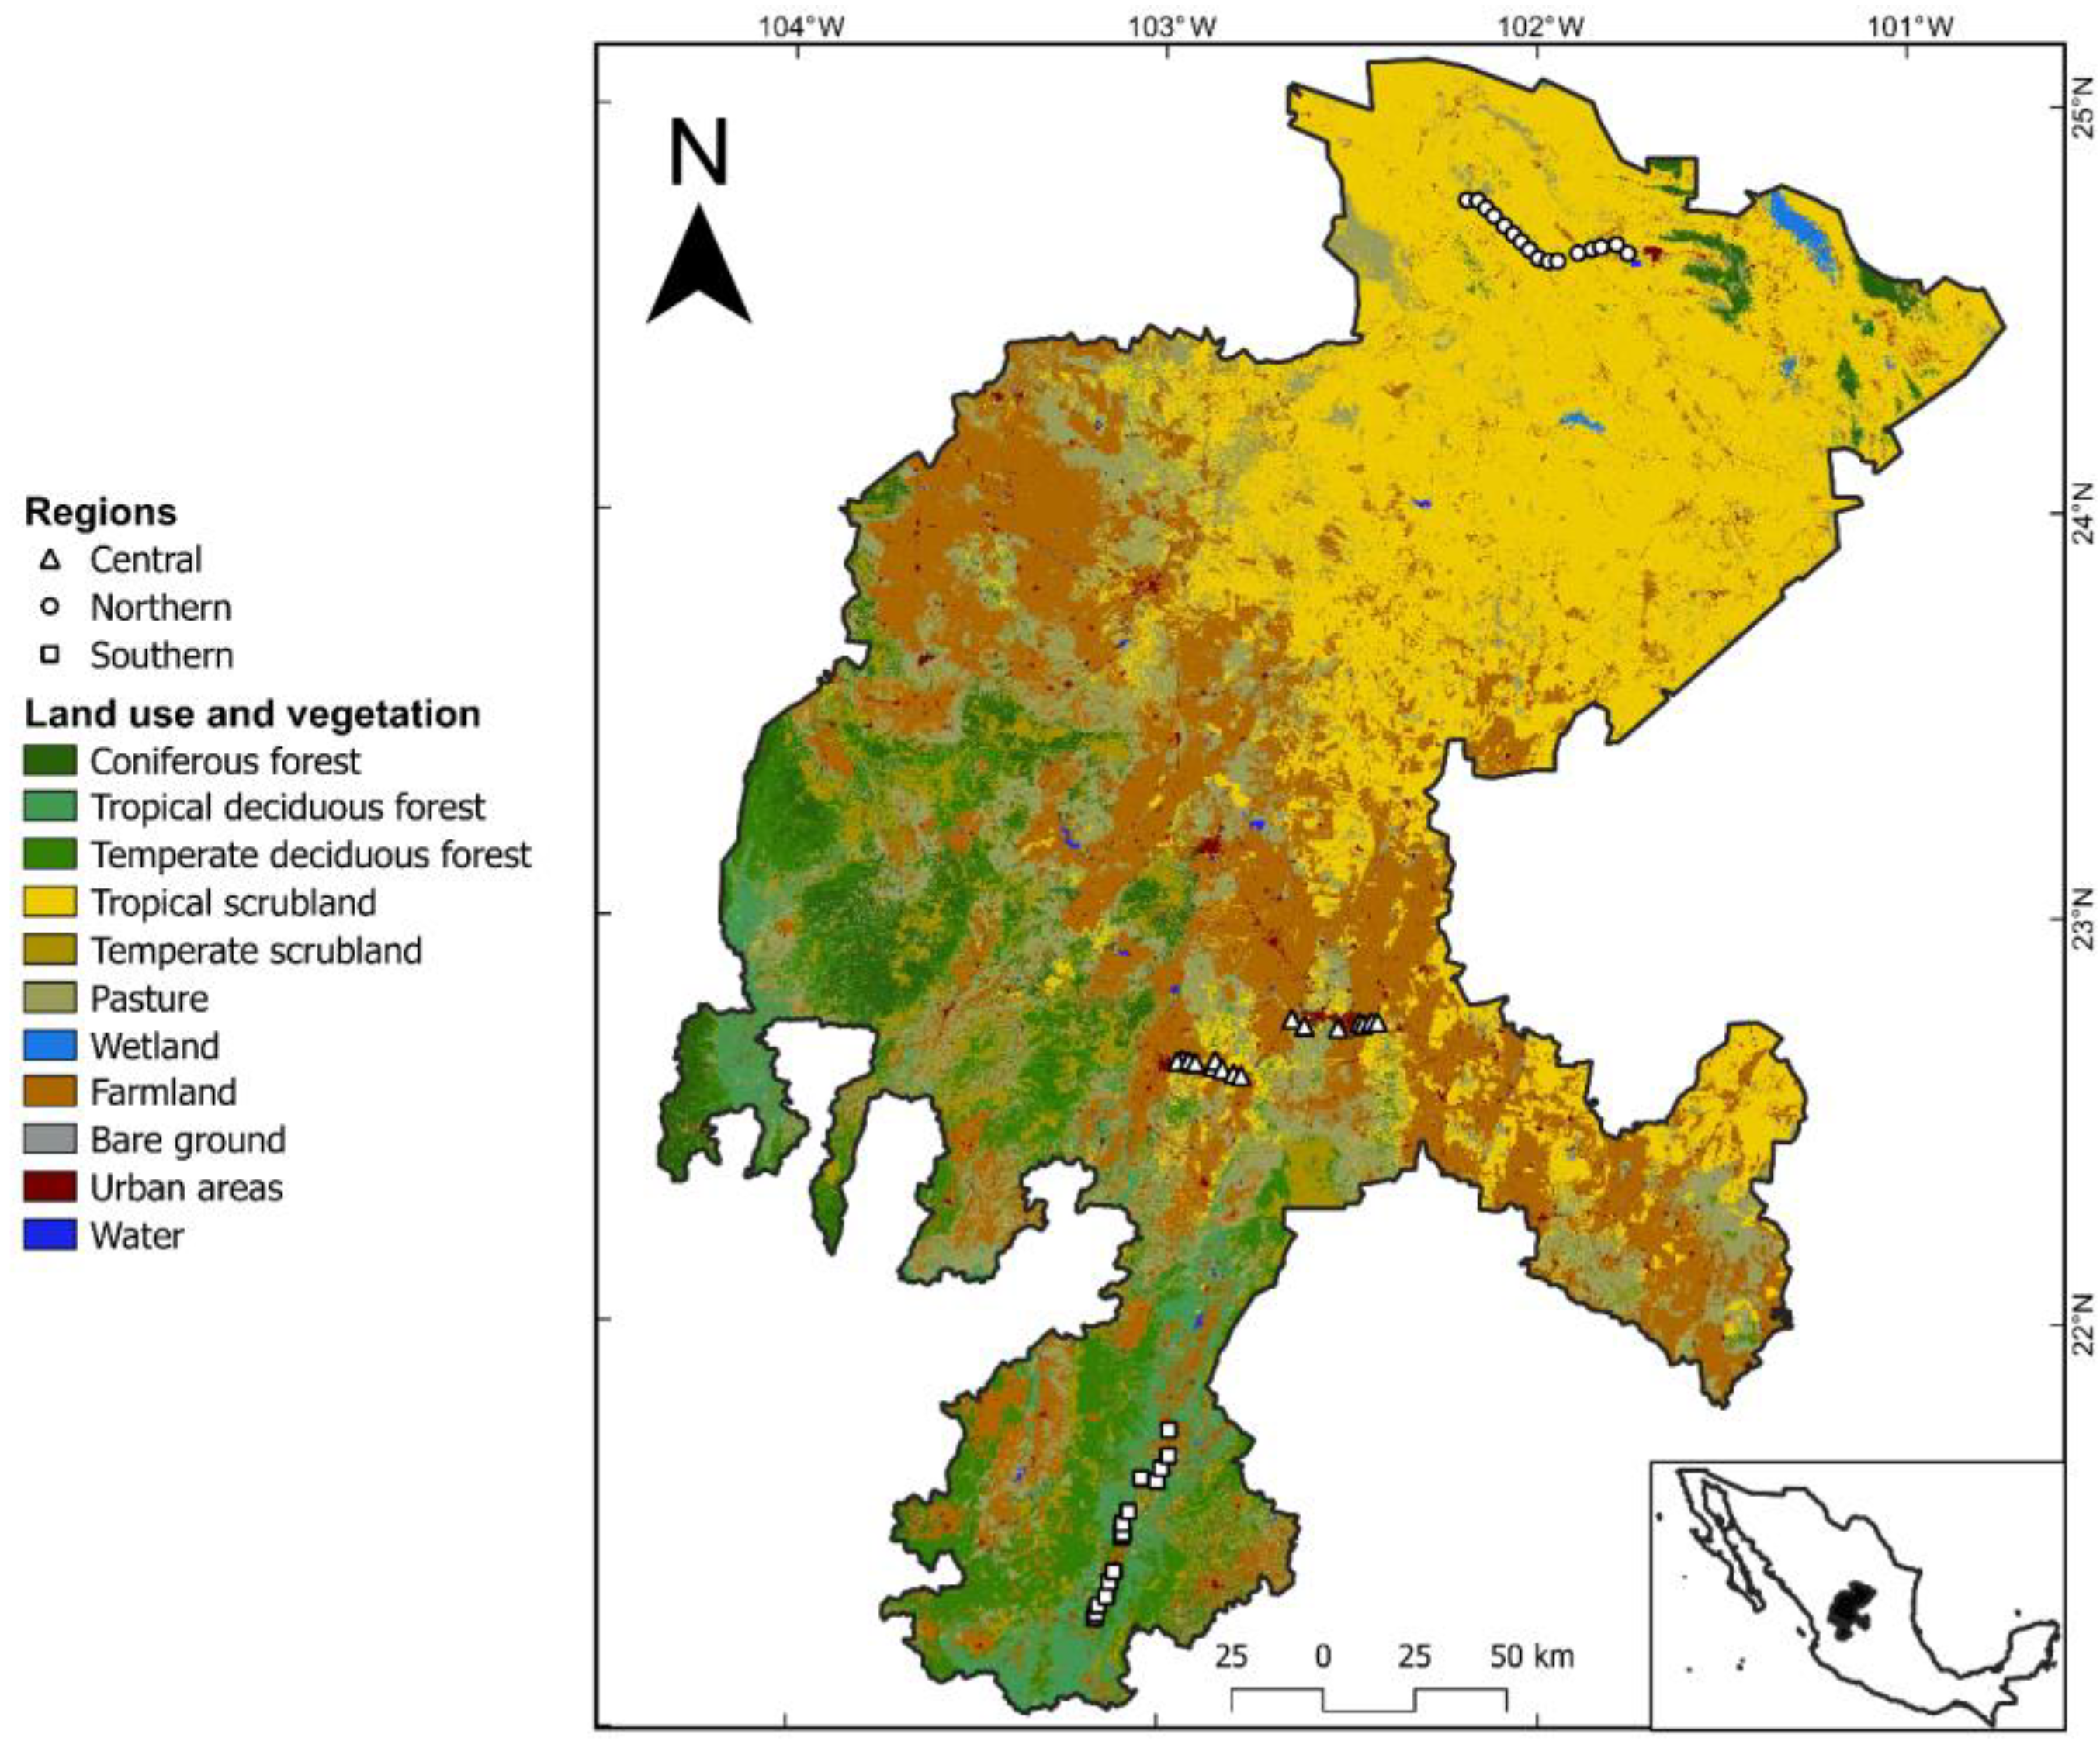
2.1. Field Survey and Plant Materials
2.2. Secondary Metabolite Extraction
2.3. Qualitative Tests for Chemical Profile
2.4. Remote-Sensing Data
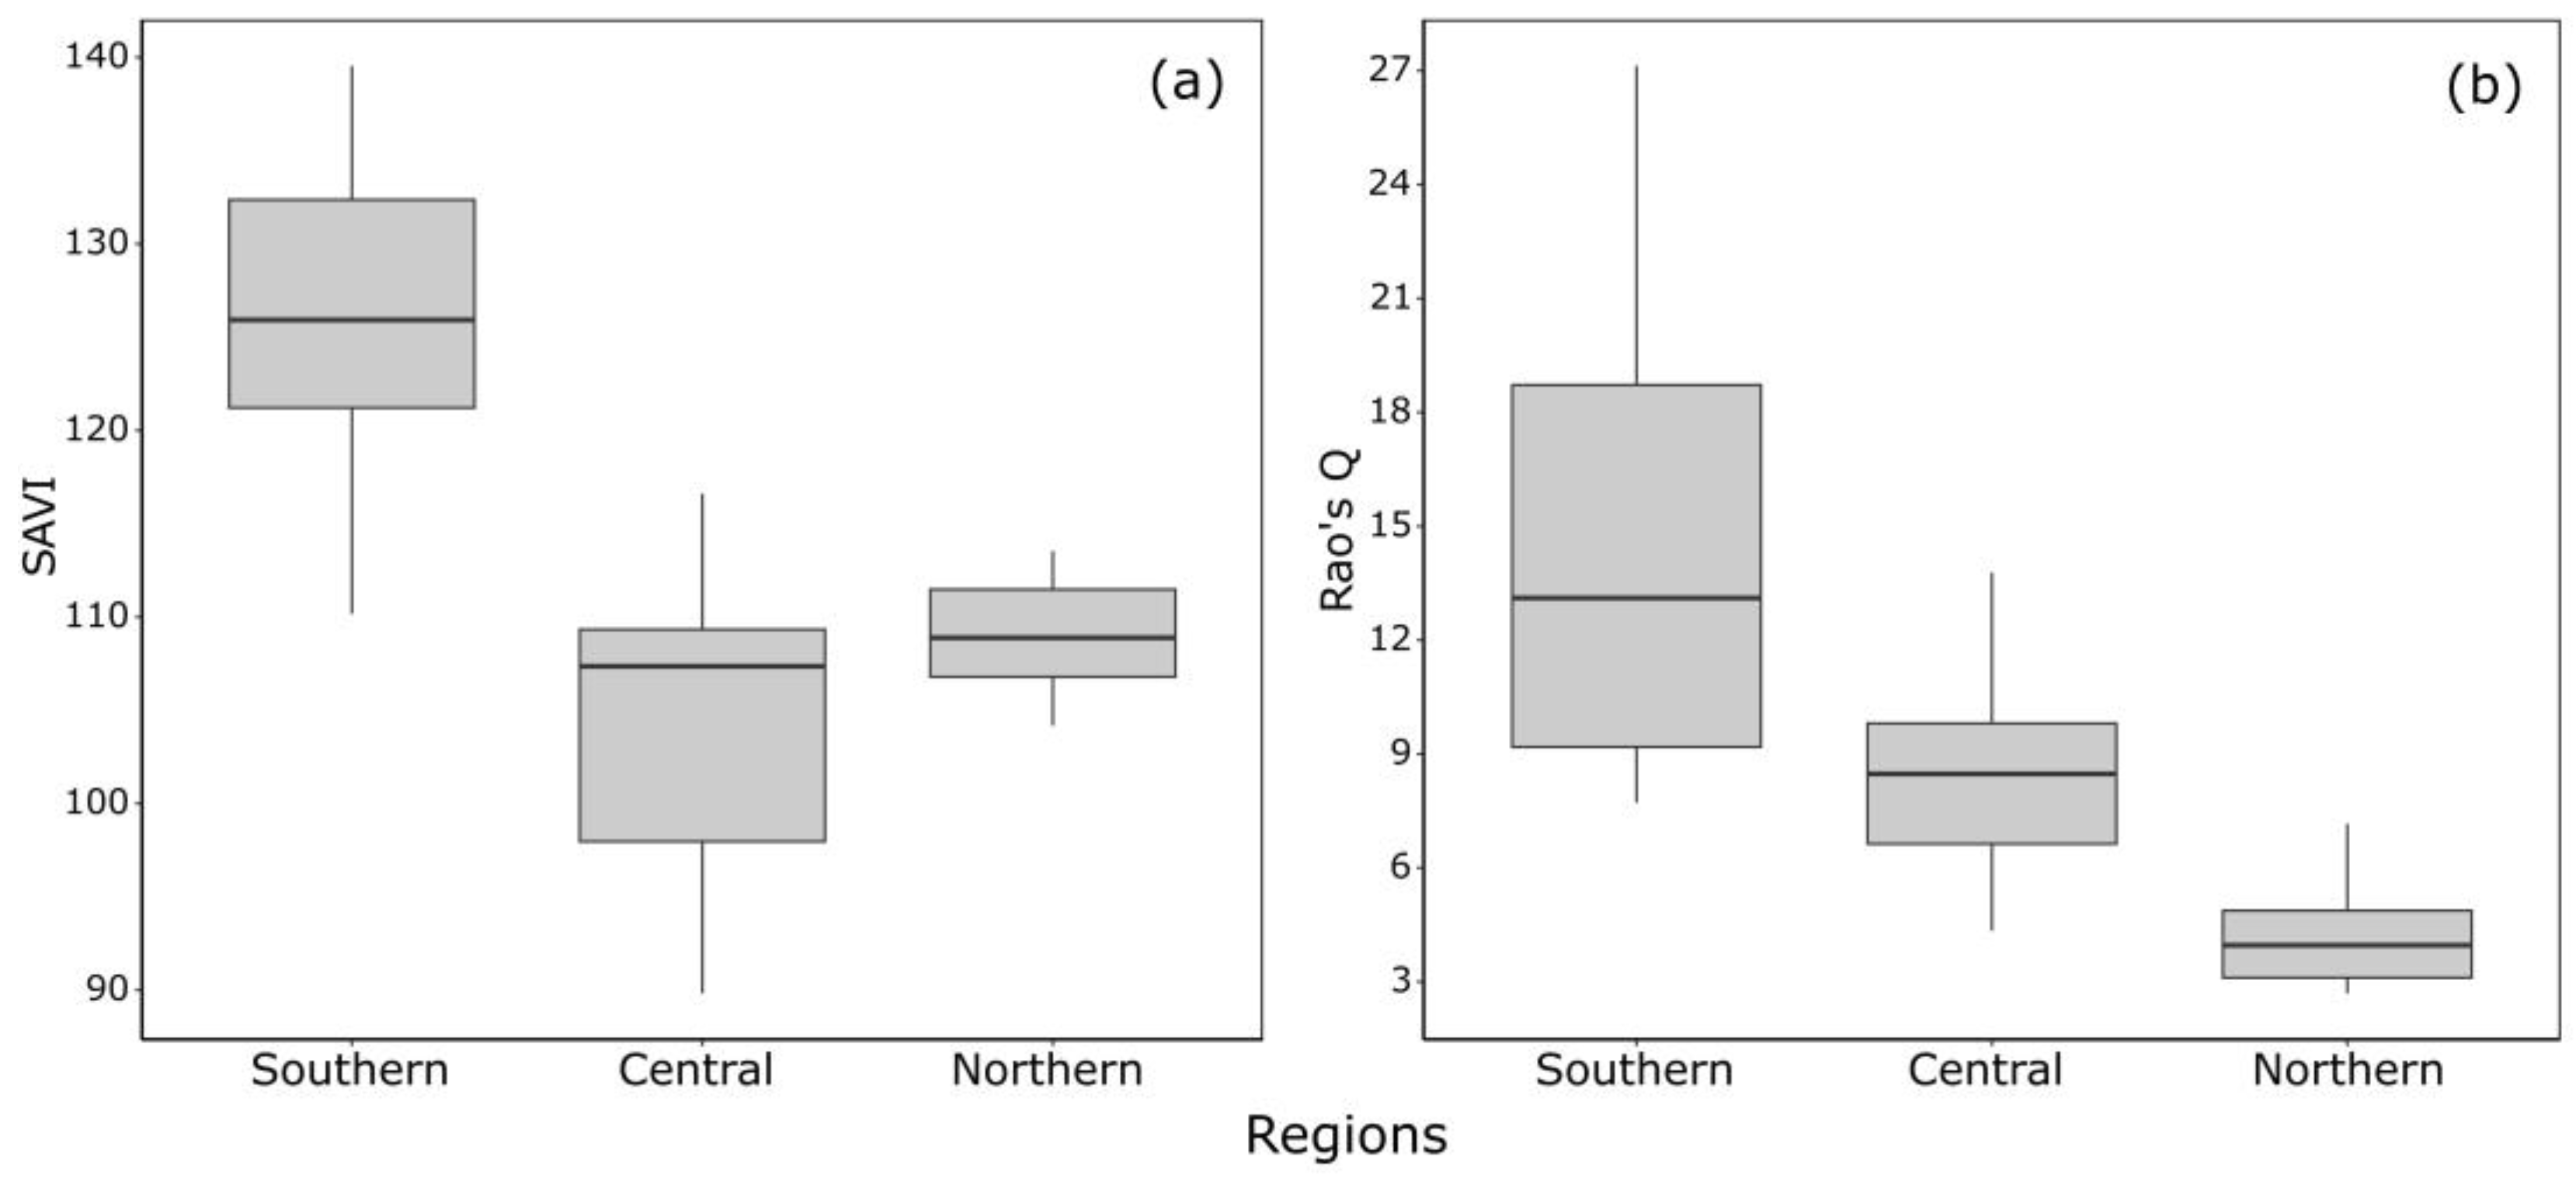
2.5. Environmental Heterogeneity Estimation
2.6. Data Analysis
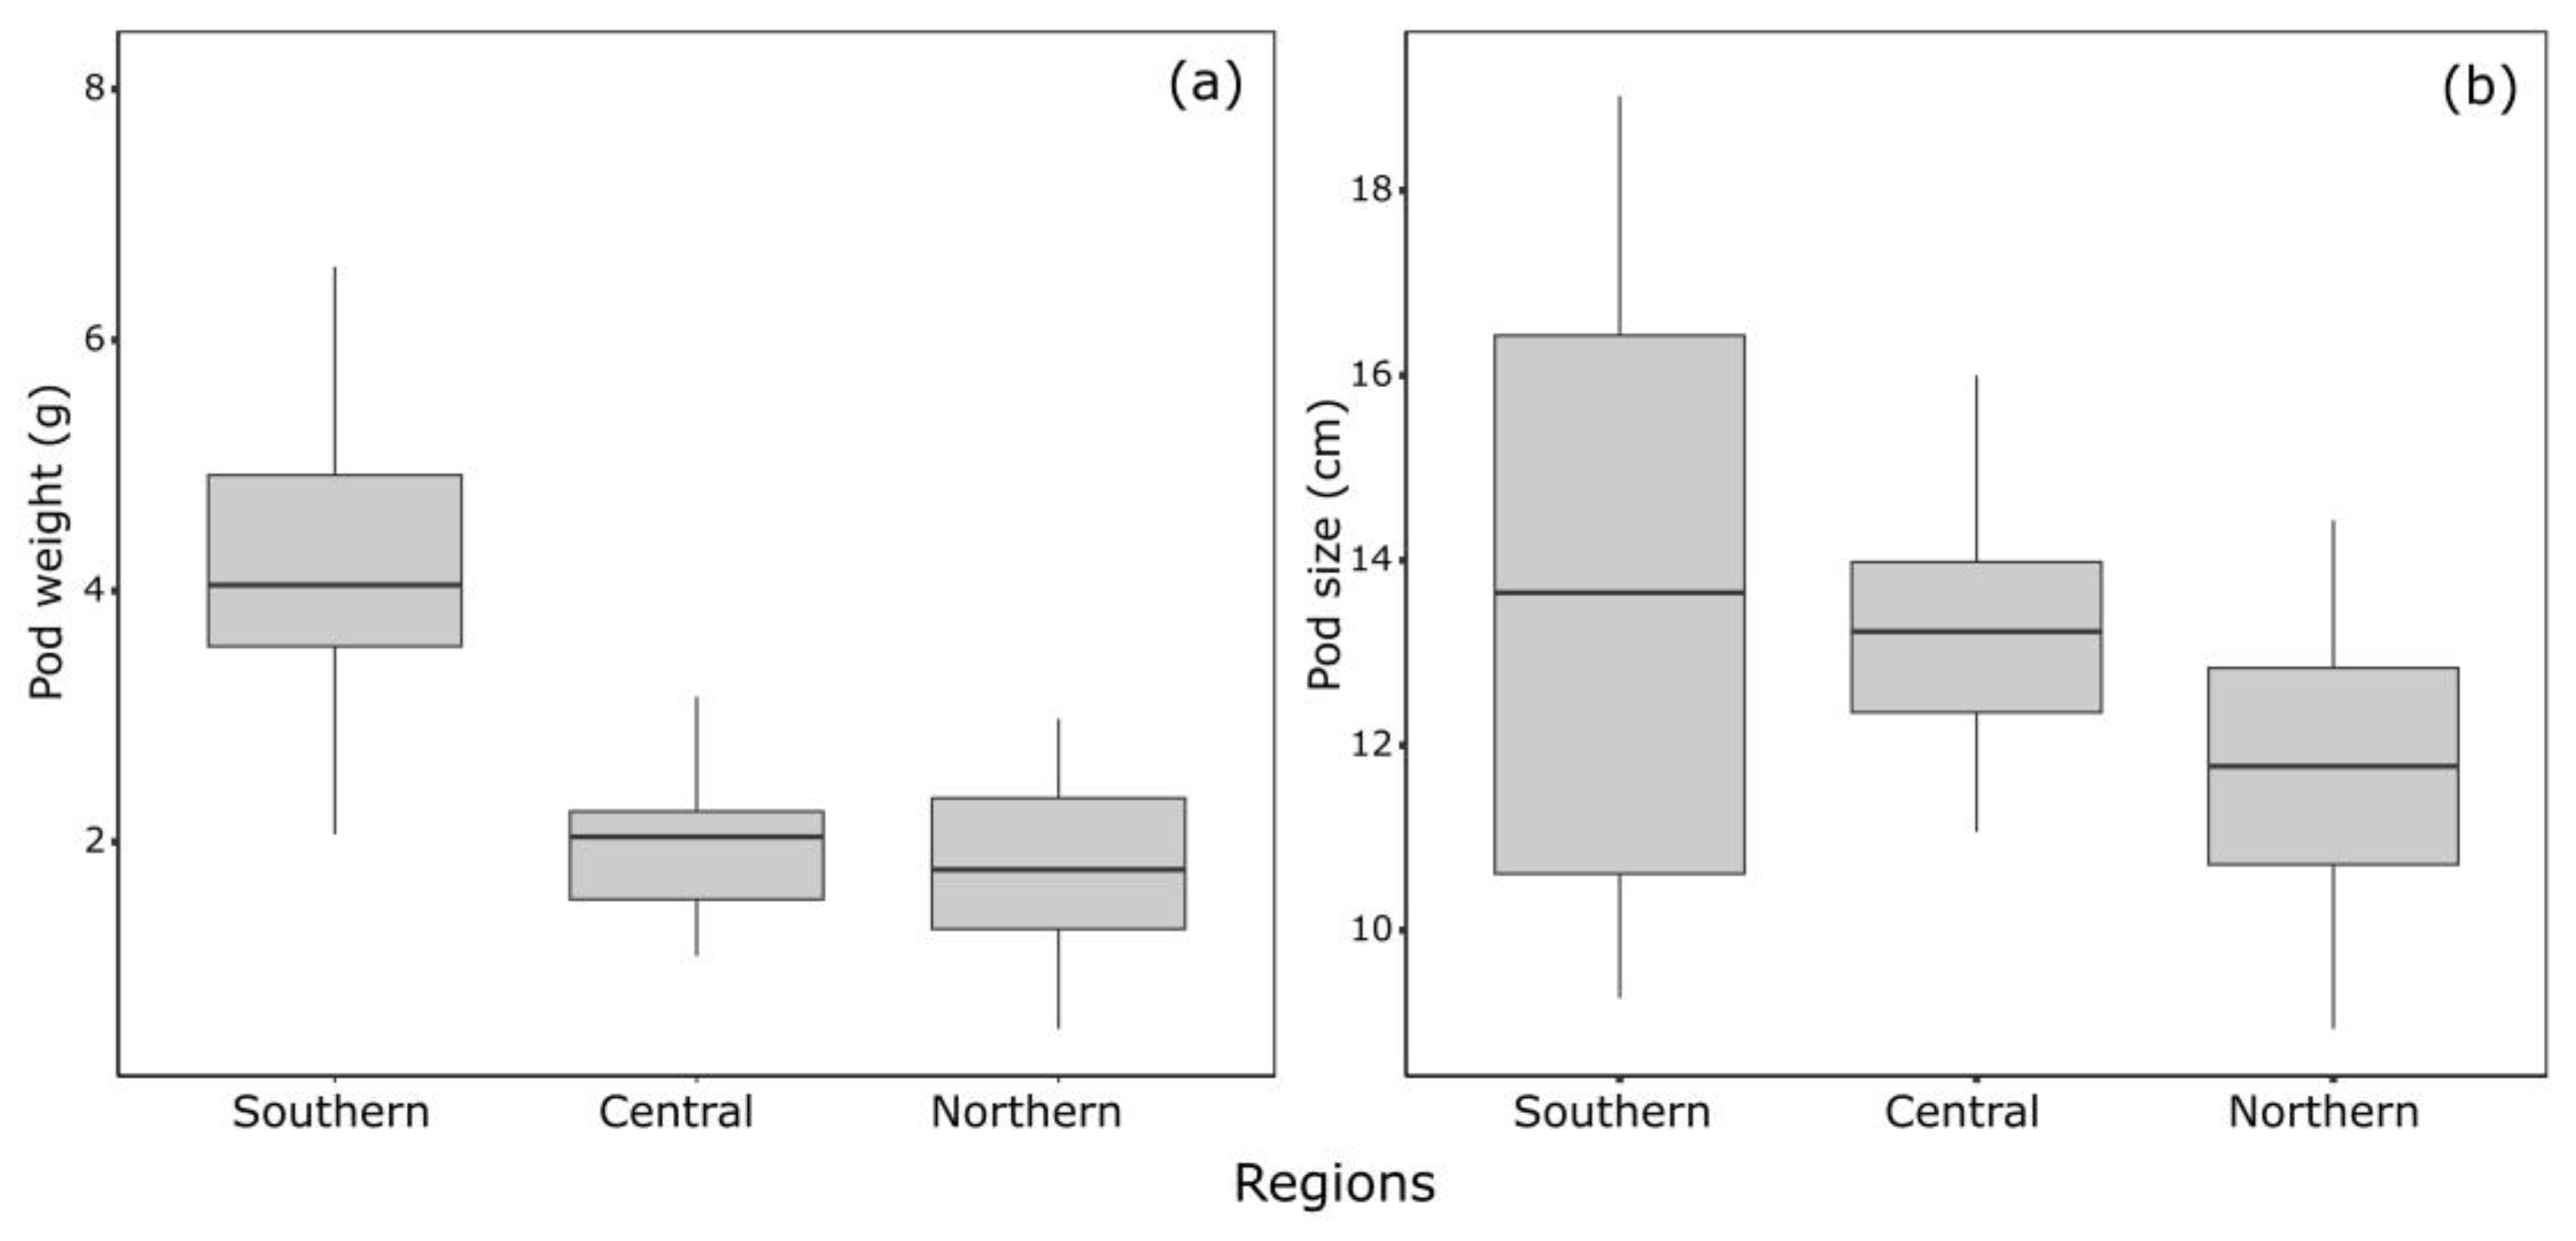
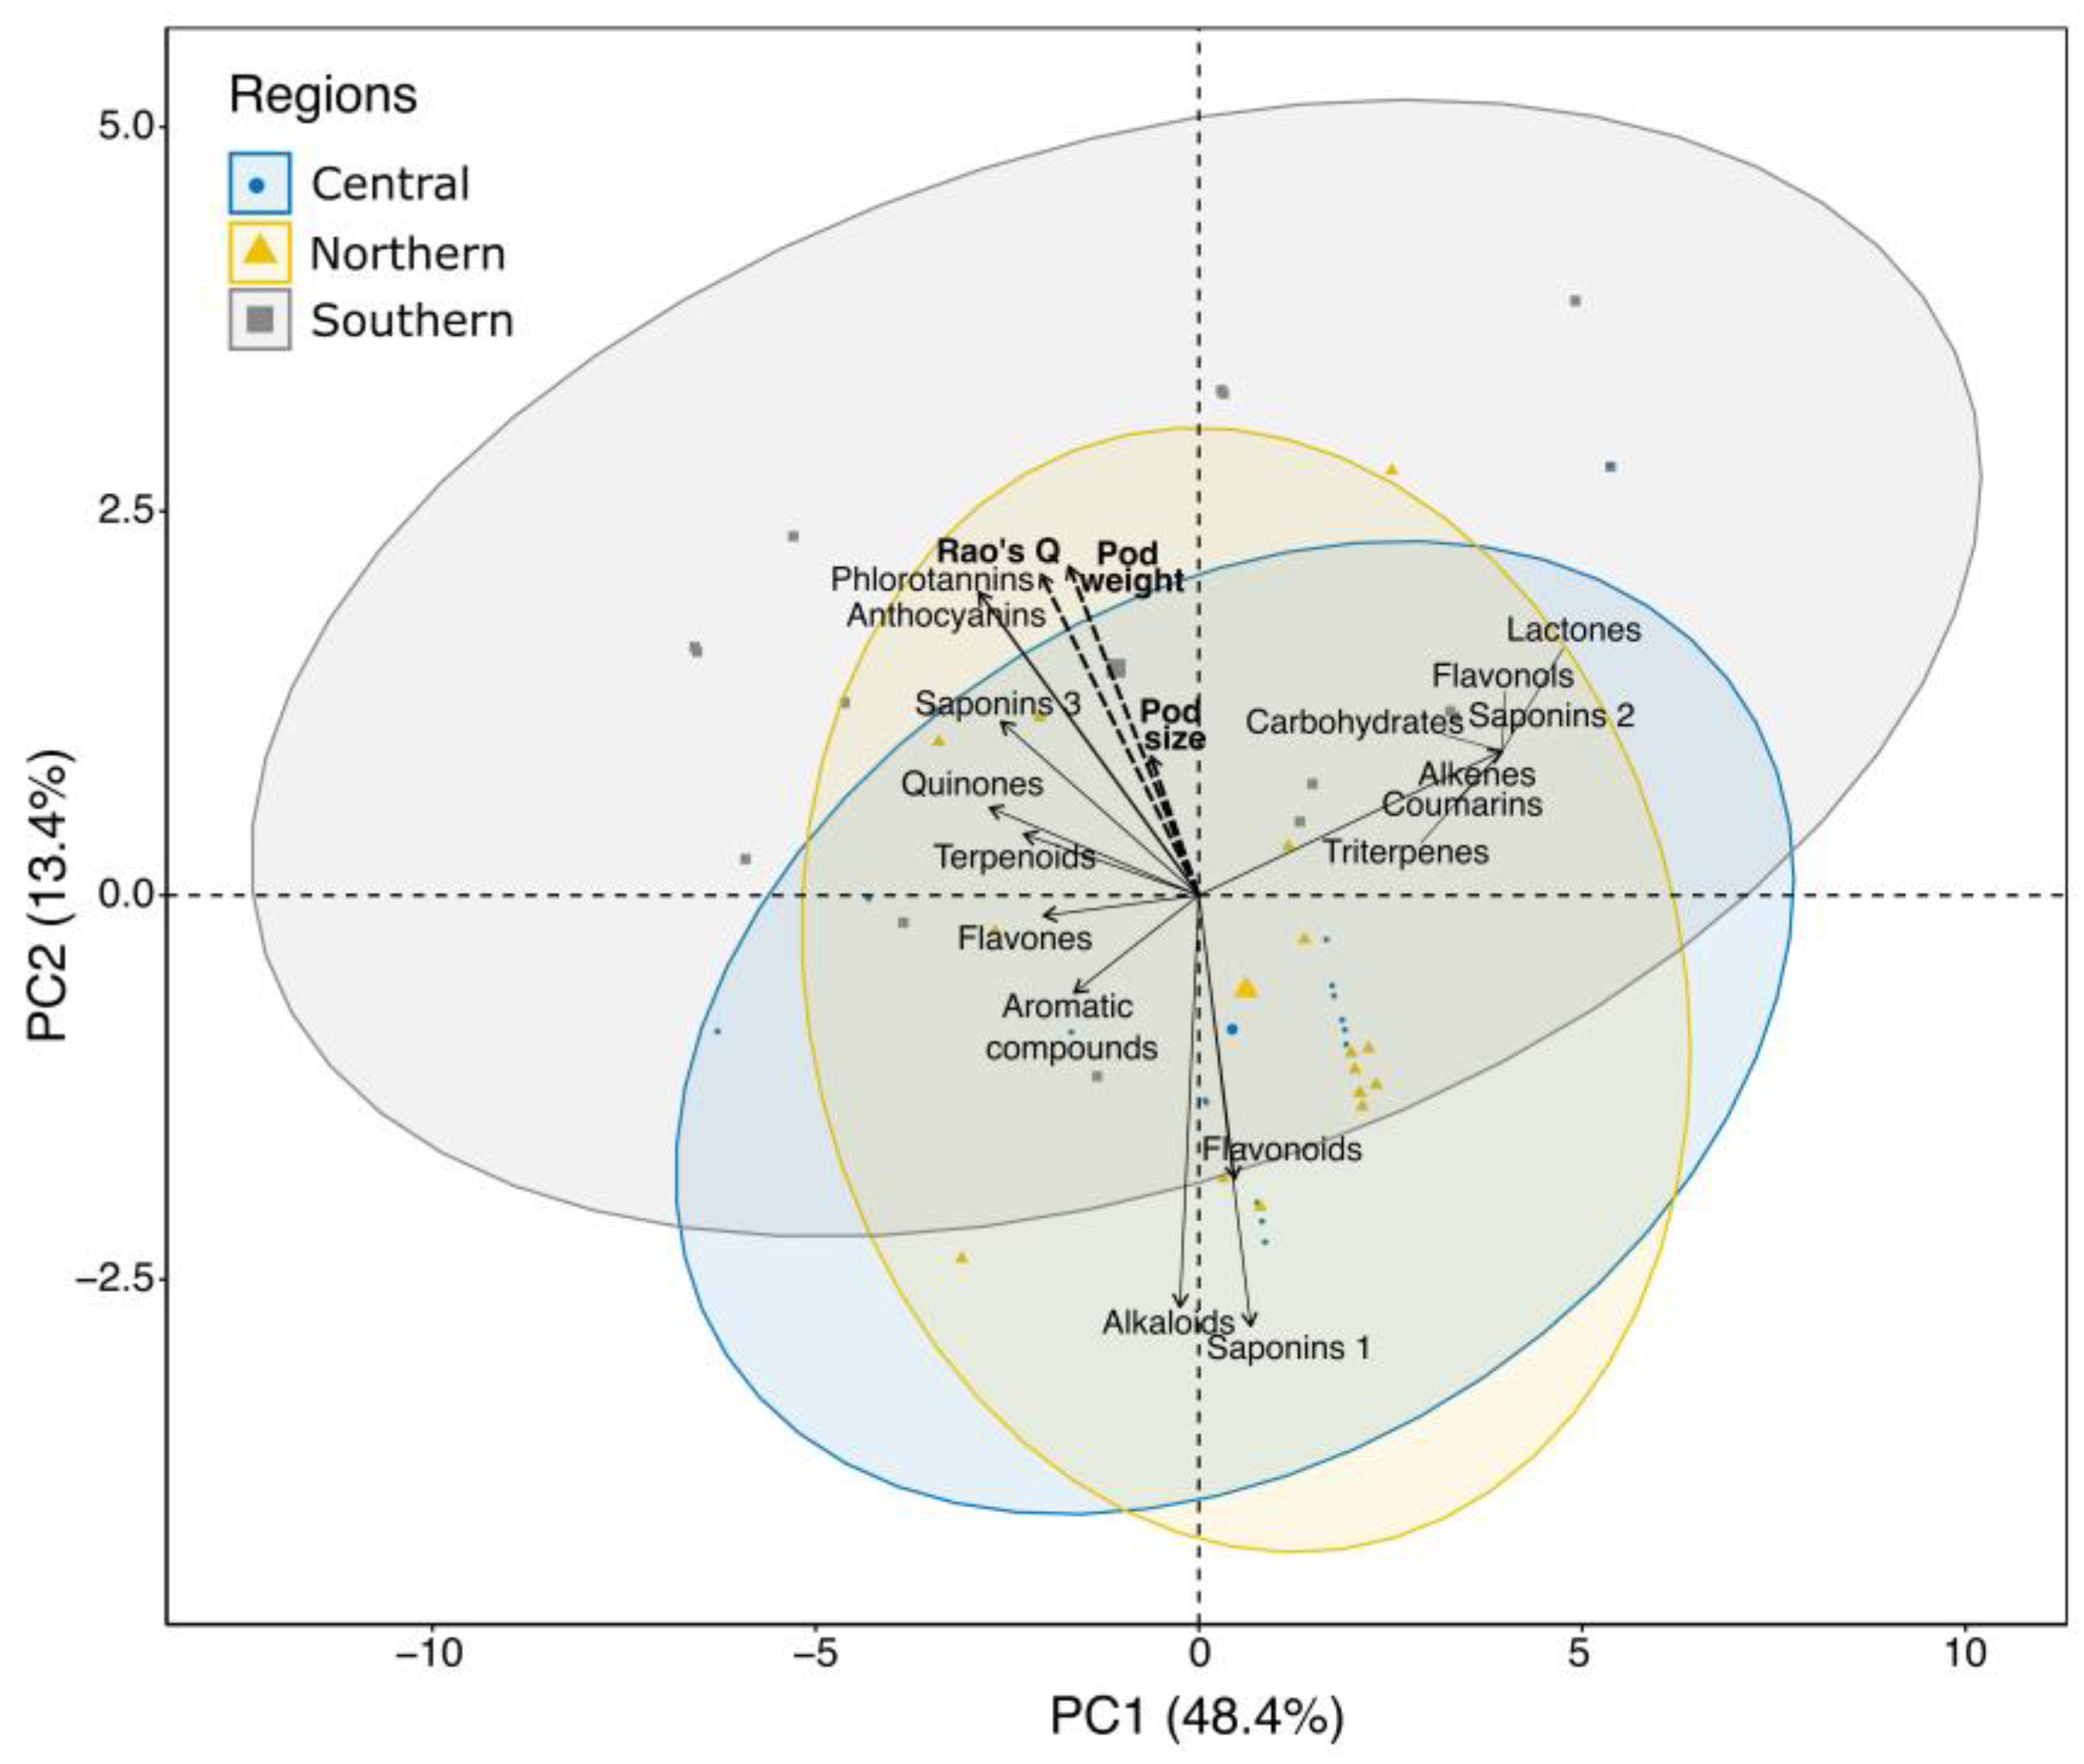
3. Results
4. Discussion
5. Conclusions
Supplementary Materials
Author Contributions
Funding
Institutional Review Board Statement
Informed Consent Statement
Data Availability Statement
Acknowledgments
Conflicts of Interest
References
- Uthe, H.; van Dam, N.M.; Hervé, M.R.; Sorokina, M.; Peters, K.; Weinhold, A. A Practical Guide to Implementing Metabolomics in Plant Ecology and Biodiversity Research. In Advances in Botanical Research; Pétriacq, P., Bouchereau, A., Eds.; Academic Press: Cambridge, MA, USA, 2021; Volume 98, pp. 163–203. [Google Scholar]
- Pant, P.; Pandey, S.; Dall’Acqua, S. The Influence of Environmental Conditions on Secondary Metabolites in Medicinal Plants: A Literature Review. Chem. Biodivers. 2021, 18, e2100345. [Google Scholar] [CrossRef]
- Wang, S.; Alseekh, S.; Fernie, A.R.; Luo, J. The Structure and Function of Major Plant Metabolite Modifications. Mol. Plant 2019, 12, 899–919. [Google Scholar] [CrossRef] [PubMed]
- Burow, M.; Halkier, B.A. How Does a Plant Orchestrate Defense in Time and Space? Using Glucosinolates in Arabidopsis as Case Study. Curr. Opin. Plant Biol. 2017, 38, 142–147. [Google Scholar] [CrossRef]
- Fuica-Carrasco, C.; Toro-Núñez, Ó.; Lira-Noriega, A.; Pérez, A.J.; Hernández, V. Metabolome Expression in Eucryphia Cordifolia Populations: Role of Seasonality and Ecological Niche Centrality Hypothesis. J. Plant Res. 2023, 136, 827–839. [Google Scholar] [CrossRef] [PubMed]
- Wilson, S.D. Heterogeneity, Diversity and Scale in Plant Communities. In The Ecological Consequences of Environmental Heterogeneity; Hutchings, M.J., John, E.A., Stewart, A.J.A., Eds.; Blackwell Scientic: Oxford, UK, 2000; pp. 53–69. [Google Scholar]
- Stein, A.; Gerstner, K.; Kreft, H. Environmental Heterogeneity as a Universal Driver of Species Richness across Taxa, Biomes and Spatial Scales. Ecol. Lett. 2014, 17, 866–880. [Google Scholar] [CrossRef]
- Costanza, J.K.; Moody, A.; Peet, R.K. Multi-Scale Environmental Heterogeneity as a Predictor of Plant Species Richness. Landsc. Ecol. 2011, 26, 851–864. [Google Scholar] [CrossRef]
- Stein, A.; Kreft, H. Terminology and Quantification of Environmental Heterogeneity in Species-Richness Research. Biol. Rev. 2014, 90, 815–836. [Google Scholar] [CrossRef]
- Torresani, M.; Rossi, C.; Perrone, M.; Hauser, L.T.; Féret, J.B.; Moudrý, V.; Simova, P.; Ricotta, C.; Foody, G.M.; Kacic, P.; et al. Reviewing the Spectral Variation Hypothesis: Twenty Years in the Tumultuous Sea of Biodiversity Estimation by Remote Sensing. Ecol. Inform. 2024, 82, 102702. [Google Scholar] [CrossRef]
- MacFadyen, S.; Hui, C.; Verburg, P.H.; Van Teeffelen, A.J.A. Quantifying Spatiotemporal Drivers of Environmental Heterogeneity in Kruger National Park, South Africa. Landsc. Ecol. 2016, 31, 2013–2029. [Google Scholar] [CrossRef]
- Zeng, Y.; Hao, D.; Huete, A.; Dechant, B.; Berry, J.; Chen, J.M.; Joiner, J.; Frankenberg, C.; Bond-Lamberty, B.; Ryu, Y.; et al. Optical Vegetation Indices for Monitoring Terrestrial Ecosystems Globally. Nat. Rev. Earth Environ. 2022, 3, 477–493. [Google Scholar] [CrossRef]
- Gamon, J.A.; Field, C.B.; Goulden, M.L.; Griffin, K.L.; Hartley, A.E.; Joel, G.; Penuelas, J.; Valentini, R. Relationships Between NDVI, Canopy Structure, and Photosynthesis in Three Californian Vegetation Types. Ecol. Appl. 1995, 5, 28–41. [Google Scholar] [CrossRef]
- Xiao, J.; Chevallier, F.; Gomez, C.; Guanter, L.; Hicke, J.A.; Huete, A.R.; Ichii, K.; Ni, W.; Pang, Y.; Rahman, A.F.; et al. Remote Sensing of the Terrestrial Carbon Cycle: A Review of Advances over 50 Years. Remote Sens. Environ. 2019, 233, 111383. [Google Scholar] [CrossRef]
- Gao, X.; Huete, A.R.; Ni, W.; Miura, T. Optical-Biophysical Relationships of Vegetation Spectra without Background Contamination. Remote Sens. Environ. 2000, 74, 609–620. [Google Scholar] [CrossRef]
- Huete, A.; Didan, K.; Miura, T.; Rodriguez, E.; Gao, X.; Ferreira, L. Overview of the Radiometric and Biophysical Performance of the MODIS Vegetation Indices. Remote Sens. Environ. 2002, 83, 195–213. [Google Scholar] [CrossRef]
- Fine, P.V.A.; Salazar, D.; Martin, R.E.; Metz, M.R.; Misiewicz, T.M.; Asner, G.P. Exploring the Links between Secondary Metabolites and Leaf Spectral Reflectance in a Diverse Genus of Amazonian Trees. Ecosphere 2021, 12, e03362. [Google Scholar] [CrossRef]
- Melandri, G.; Thorp, K.R.; Broeckling, C.; Thompson, A.L.; Hinze, L.; Pauli, D. Assessing Drought and Heat Stress-Induced Changes in the Cotton Leaf Metabolome and Their Relationship With Hyperspectral Reflectance. Front. Plant Sci. 2021, 12, 751868. [Google Scholar] [CrossRef] [PubMed]
- Rocchini, D.; Marcantonio, M.; Ricotta, C. Measuring Rao’s Q Diversity Index from Remote Sensing: An Open Source Solution. Ecol. Indic. 2017, 72, 234–238. [Google Scholar] [CrossRef]
- Torresani, M.; Rocchini, D.; Sonnenschein, R.; Zebisch, M.; Marcantonio, M.; Ricotta, C.; Tonon, G. Estimating Tree Species Diversity from Space in an Alpine Conifer Forest: The Rao’s Q Diversity Index Meets the Spectral Variation Hypothesis. Ecol. Inform. 2019, 52, 26–34. [Google Scholar] [CrossRef]
- Ahmed, S.; Jamil, S.; Siddiqui, M.U.A. Secondary Metabolites-God Gifted Arsenal for Plants. J. Pharmacogn. Phytochem. 2024, 13, 38–43. [Google Scholar] [CrossRef]
- Dávila-Rangel, I.E.; Charles-Rodríguez, A.V.; López-Romero, J.C.; Flores-López, M.L. Plants from Arid and Semi-Arid Zones of Mexico Used to Treat Respiratory Diseases: A Review. Plants 2024, 13, 792. [Google Scholar] [CrossRef] [PubMed]
- Rzedowski, J. Vegetación de México. 1ra. Edición Digital, Comisión Nacional Para El Conocimiento y Uso de La Biodiversidad. Taxon 2006, 31, 504. [Google Scholar]
- Hughes, C.E.; Ringelberg, J.J.; Lewis, G.P.; Catalano, S.A. Disintegration of the Genus Prosopis L. (Leguminosae, Caesalpinioideae, Mimosoid Clade). PhytoKeys 2022, 205, 147–189. [Google Scholar] [CrossRef] [PubMed]
- Villaseñor, J.L. Checklist of the Native Vascular Plants of Mexico. Rev. Mex. Biodivers. 2016, 87, 559–902. [Google Scholar] [CrossRef]
- Persia, F.; Rinaldini, E.; Hapon, M.; Gamarra, L.C. Overview of Genus Prosopis Toxicity Reports and Its Beneficial Biomedical Properties. J. Clin. Toxicol. 2016, 6, 1000326. [Google Scholar]
- Rodríguez, S.E.N.; Rojo, M.G.E.; Ramírez, V.B.; Martínez, R.R.; Cong, H.M.D.L.C.; Medina, T.S.M.; Piña, R.H.H. Análisis Técnico Del Árbol Del Mezquite (Prosopis Laevigata Humb. & Bonpl. Ex Willd.) En México. Ra Ximhai 2014, 10, 173–193. [Google Scholar] [CrossRef]
- Pasiecznik, N.M.; Vall, A.O.M.; Nourissier-Mountou, S.; Danthu, P.; Murch, J.; McHugh, M.J.; Harris, P.J.C. Discovery of a Life History Shift: Precocious Flowering in an Introduced Population of Prosopis. Biol. Invasions 2006, 8, 1681–1687. [Google Scholar] [CrossRef]
- Yoda, K.; Elbasit, M.A.; Hoshino, B.; Nawata, H.; Yasuda, H. Root System Development of Prosopis Seedlings under Different Soil Moisture Conditions. J. Arid L. Stud. 2012, 22, 13–16. [Google Scholar]
- Valencia, D.; Rueda Puente, E.O.; Leyva Peralta, M.A.; Mazón-López, S.R.; Ortega-García, J. Compuestos Bioactivos, Actividad Antioxidante y Perfil de Ácidos Grasos En Aceite de Semilla de Mezquite (Prosopis Spp). Rev. Soc. Latinoam. Nutr. 2020, 70, 50–59. [Google Scholar] [CrossRef]
- Angeles-Hernandez, J.C.; Santiago, E.D.J.F.; Cardoso-Gutiérrez, E.; Valencia-Salazar, S.S.; Rodriguez, O.E.D.R.; Paz, E.A.; Ku-Vera, J.C.; Kebreab, E.; Benaouda, M.; Garduño García, Á. The Use of Mesquite Pods (Prosopis spp.) as an Alternative to Improve the Productive Performance and Methane Mitigation in Small Ruminants: A Meta-Analysis. Fermentation 2024, 10, 625. [Google Scholar] [CrossRef]
- Ramírez, M.; Vargas, D.; Hernández, J.; Martínez, E.; Sánchez, J.; Torrescano, G.; Sánchez, A. Antioxidant Activity of Mesquite Leaf Extracts (Prosopis velutina). Rev. Cienc. Biológicas Salud 2019, 20, 113–119. [Google Scholar]
- Jan, R.; Asaf, S.; Numan, M.; Lubna; Kim, K.M. Plant Secondary Metabolite Biosynthesis and Transcriptional Regulation in Response to Biotic and Abiotic Stress Conditions. Agronomy 2021, 11, 968. [Google Scholar] [CrossRef]
- Padilla-González, G.F.; Frey, M.; Gómez-Zeledón, J.; Da Costa, F.B.; Spring, O. Metabolomic and Gene Expression Approaches Reveal the Developmental and Environmental Regulation of the Secondary Metabolism of Yacón (Smallanthus sonchifolius, Asteraceae). Sci. Rep. 2019, 9, 13178. [Google Scholar] [CrossRef] [PubMed]
- Hannah, M.A.; Caldana, C.; Steinhauser, D.; Balbo, I.; Fernie, A.R.; Willmitzer, L. Combined Transcript and Metabolite Profiling of Arabidopsis Grown under Widely Variant Growth Conditions Facilitates the Identification of Novel Metabolite-Mediated Regulation of Gene Expression. Plant Physiol. 2010, 152, 2120–2129. [Google Scholar] [CrossRef] [PubMed]
- Palacios, R. Los Mezquites Mexicanos: Biodiversidad y Distribución Geográfica. Bol. Soc. Argent. Bot. 2006, 41, 99–121. [Google Scholar]
- CONABIO. Cobertura Del Suelo de México a 30 Metros, 2020, Escala: 1:100000; Comisión Nacional Para El Conocimiento y Uso de La Biodiversidad: Mexico City, Mexico, 2020.
- QGIS. QGIS Geographic Information System. Open Source Geospatial Foundation Project. 2024. Available online: http://qgis.org (accessed on 2 December 2024).
- Morales-Márquez, R.; Delgadillo-Ruiz, L.; Esparza-Orozco, A.; Delgadillo-Ruiz, E.; Bañuelos-Valenzuela, R.; Valladares-Carranza, B.; Chávez-Ruvalcaba, M.I.; Chávez-Ruvalcaba, F.; Valtierra-Marín, H.E.; Gaytán-Saldaña, N.A.; et al. Evaluation of Larrea Tridentata Extracts and Their Antimicrobial Effects on Strains of Clinical Interest. Int. J. Mol. Sci. 2025, 26, 1032. [Google Scholar] [CrossRef] [PubMed]
- Domínguez, X.A. Métodos de Investigación Fitoquímica; Editorial Limusa: Mexico City, Mexico, 1973; 281p. [Google Scholar]
- Bañuelos-Valenzuela1, R.; Delgadillo-Ruiz, L.; Echavarría-Cháirez, F.; Delgadillo-Ruiz, O.; Meza-López, C. Chemical Composition and FTIR of Ethane Extracts of Larrea Tridentata, Origanum Vulgare, Artemisa Ludoviciana and Ruta Graveolens. Agrociencia 2018, 52, 309–321. [Google Scholar]
- Rivero-Pérez, N.; Jaramillo, A. Anthelmintic Activity of Leucaena Leucocephala Pod on Gastrointestinal Nematodes of Sheep (in Vitro). Abanico Vet. 2019, 9, 1–9. [Google Scholar]
- Rao, R. Diversity and Dissimilarity Coefficients: A Unified Approach. Theor. Popul. Biol. 1982, 21, 24–43. [Google Scholar] [CrossRef]
- Rocchini, D.; Thouverai, E.; Marcantonio, M.; Iannacito, M.; Da Re, D.; Torresani, M.; Bacaro, G.; Bazzichetto, M.; Bernardi, A.; Foody, G.M.; et al. Rasterdiv—An Information Theory Tailored R Package for Measuring Ecosystem Heterogeneity from Space: To the Origin and Back. Methods Ecol. Evol. 2021, 12, 1093–1102. [Google Scholar] [CrossRef] [PubMed]
- R Core Team. R: A Language and Environment for Statistical Computing, version 4.2.3; R Foundation for Statistical Computing: Vienna, Austria, 2023; Available online: https://www.r-project.org/ (accessed on 2 December 2024).
- Oksanen, J.; Blanchet, F.G.; Friendly, M.; Kindt, R.; Legendre, P.; McGlinn, D.; Minchin, P.R.; O’Hara, R.B.; Simpson, G.L.; Solymos, P.; et al. Vegan: Community Ecology Package. R Package Version 2019, 2, 321–326. [Google Scholar]
- Esparza-Orozco, A.; Lira-Noriega, A.; Martínez-Montoya, J.F.; Pineda-Martínez, L.F.; Méndez-Gallegos, S.D.J. Influences of Environmental Heterogeneity on Amphibian Composition at Breeding Sites in a Semiarid Region of Mexico. J. Arid Environ. 2020, 182, 104259. [Google Scholar] [CrossRef]
- Borcard, D.; Gillet, F.; Legendre, P. Numerical Ecology with R; Springer: New York, NY, USA, 2011. [Google Scholar]
- Lê, S.; Josse, J.; Husson, F. FactoMineR: An R Package for Multivariate Analysis. J. Stat. Softw. 2008, 25, 253–258. [Google Scholar] [CrossRef]
- Cohen, H.; Shir, O.M.; Yu, Y.; Hou, W.; Sun, S.; Han, T.; Amir, R. Genetic Background and Environmental Conditions Drive Metabolic Variation in Wild Type and Transgenic Soybean (Glycine Max) Seeds. Plant Cell Environ. 2016, 39, 1805–1817. [Google Scholar] [CrossRef]
- Zhang, W.; Curtin, C.; Kikuchi, M.; Franco, C. Integration of Jasmonic Acid and Light Irradiation for Enhancement of Anthocyanin Biosynthesis in Vitis Vinifera Suspension Cultures. Plant Sci. 2002, 162, 459–468. [Google Scholar] [CrossRef]
- Gershenzon, J. Changes in the Levels of Plant Secondary Metabolites Under Water and Nutrient Stress. In Phytochemical Adaptations to Stress; Springer US: Boston, MA, USA, 1984; pp. 273–320. [Google Scholar]
- Scheiner, S.M.; Willig, M.R. A General Theory of Ecology. Theor. Ecol. 2008, 1, 21–28. [Google Scholar] [CrossRef]
- Armijo-Nájera, M.G.; Moreno Reséndez, A.; Blanco Contreras, E.; Borroel-García, V.J.; Reyes-Carrillo, J.L. Vaina de Mezquite (Prosopis Spp.) Alimento Para El Ganado Caprino En El Semidesierto. Rev. Mex. Ciencias Agrícolas 2019, 10, 113–122. [Google Scholar] [CrossRef]
- Méndez, T.V.; Ibarra, F.E.B.; Gonzalez, M.D. Caracterización Química y Nutricional de La Harina de Mezquite (Prosopis juliflora, Prosopis granulosa) Para La Formulación de Un Alimento Funcional Para La Diabetes Mellitus Tipo 2; OmniaScience: Barcelona, Spain, 2024. [Google Scholar]


| Secondary Metabolite Classes Detected | Test | Procedure |
|---|---|---|
| Alkenes | KMnO4 | A total of 3 drops of 2% KMnO4 were added dropwise to 100 µL of the extract. A positive test was indicated by discoloration or the formation of a brown precipitate (manganese dioxide). |
| Triterpenes | Liebermann–Burchard | The reagent was prepared by mixing 1 mL CH3COOH, 1 mL CHCl3, and 1 drop of H2SO4, followed by cooling to 0 °C. To 100 µL of the extract, 3 drops of the reagent were added. Positive results were observed as blue, green, red, or orange over time. |
| Carbohydrates | Molisch | A total of 2 drops of Molisch’s reagent were added to 100 µL of the extract, followed by 500 µL of H2SO4. A positive test was indicated by the presence of a purple ring at the interface. |
| Coumarins/Lactones | Coumarins/Lactones | A total of 100 µL of 10% NaOH was added to 100 µL of the extract. A positive result was indicated by the appearance of a yellow coloration, which disappeared upon acidification with HCl. |
| Flavanols | H2SO4 | A total of 500 µL of H2SO4 was added to 100 µL of the extract. Positive detection was indicated by yellow coloration. |
| Flavones | H2SO4 | A total of 500 µL of H2SO4 was added to 100 µL of the extract. Positive results were indicated by orange–cherry coloration. |
| Flavonoids | Shinoda | A total of 500 µL of the extract was mixed with 200 µL of ethanol, followed by the addition of magnesium filings. The sample was boiled, and 3 drops of concentrated HCl were added. Positive results were indicated by orange, red, pink, blue, or violet coloration. |
| Quinones | H2SO4 | A total of 500 µL of H2SO4 was added to 100 µL of the extract. Positive results were indicated by red–purple coloration. |
| Alkaloids | Dragendorff | A solution A (0.054 M bismuth nitrate and 3.5 M acetic acid) and a solution B (2.4 M KI) were prepared. A total of 5 mL of solution A and 4 mL of solution B were taken and diluted to 100 mL. Then, 2 drops of the previous mixture were added to 200 µL of the extract. An orange to reddish coloration was considered positive. |
| Saponins 1 | Agitation | A total of 1 mL of extract was dissolved in 1 mL of water in a test tube and vigorously shaken for 3–5 min. A positive test was indicated by the formation of a stable honeycomb-like foam that persisted for 30 min. |
| Saponins 2 | NaHCO3 | A total of 2 drops of H2SO4 were added to 100 µL of the extract. The mixture was then gently shaken, and 2–3 drops of a 10% NaHCO3 solution were added. A positive test was indicated by the formation of stable bubbles that persisted for more than one minute. |
| Saponins 3 | Salkowski | A total of 100 µL of the extract were dissolved in 500 µL of CHCl3, followed by the addition of 500 µL of H2SO4. A positive test was indicated by the appearance of a red color. |
| Aromatic compounds | H2SO4-CH2O | A total of 1 drop of the H2SO4-CH2O mixture was added to 100 µL of the extract dissolved in a non-aromatic solvent. A positive result was indicated by the appearance of a red or violet color. |
| Anthocyanins | HCl | A total of 5 mL of the 10% HCl was added to 1 mL of the extract. The mixture was then boiled in a water bath. A positive result was indicated by the appearance of a pale pink coloration. |
| Terpenoids | H2SO4 | A total of 4 mL of CHCl3 was added to 5 mL of the extract, followed by the addition of 4 mL of H2SO4. A positive test was indicated by the appearance of reddish-brown color at the interface. |
| Phlorotannins | HCl | A total of 100 µL of extract and 2 mL of 1% HCl were boiled in a water bath. The test was considered positive when a red precipitate appeared. |
| Regions | Species | Number of Individuals |
|---|---|---|
| Neltuma laevigata | 16 | |
| Southern | Neltuma velutina | 0 |
| Neltuma juliflora | 0 | |
| Neltuma laevigata | 14 | |
| Central | Neltuma velutina | 1 |
| Neltuma juliflora | 1 | |
| Neltuma laevigata | 11 | |
| Northern | Neltuma velutina | 0 |
| Neltuma juliflora | 5 |
| Classes of Secondary Metabolites | UAE | EE | ||||
|---|---|---|---|---|---|---|
| Southern | Central | Northern | Southern | Central | Northern | |
| Alkenes | 16 | 16 | 16 | 16 | 16 | 16 |
| Coumarins | 16 | 16 | 16 | 16 | 16 | 16 |
| Lactones | 16 | 16 | 16 | 16 | 16 | 16 |
| Carbohydrates | 16 | 16 | 16 | 16 | 16 | 16 |
| Triterpenes | 16 | 16 | 16 | 13 | 0 | 0 |
| Flavonols | 16 | 16 | 16 | 0 | 0 | 0 |
| Flavones | 4 | 4 | 0 | 12 | 3 | 3 |
| Quinones | 7 | 3 | 1 | 8 | 1 | 0 |
| Alkaloids | 6 | 15 | 11 | 11 | 10 | 5 |
| Saponins 1 | 11 | 14 | 12 | 2 | 2 | 10 |
| Saponins 2 | 16 | 16 | 16 | 16 | 16 | 16 |
| Saponins 3 | 6 | 1 | 5 | 0 | 0 | 0 |
| Aromatics compounds | 2 | 3 | 2 | 5 | 2 | 0 |
| Flavonoids | 2 | 4 | 5 | 0 | 3 | 4 |
| Terpenoids | 4 | 1 | 3 | 6 | 0 | 2 |
| Anthocyanins | 8 | 2 | 2 | 1 | 1 | 0 |
| Phlorotannins | 8 | 2 | 2 | 1 | 1 | 0 |
Disclaimer/Publisher’s Note: The statements, opinions and data contained in all publications are solely those of the individual author(s) and contributor(s) and not of MDPI and/or the editor(s). MDPI and/or the editor(s) disclaim responsibility for any injury to people or property resulting from any ideas, methods, instructions or products referred to in the content. |
© 2025 by the authors. Licensee MDPI, Basel, Switzerland. This article is an open access article distributed under the terms and conditions of the Creative Commons Attribution (CC BY) license (https://creativecommons.org/licenses/by/4.0/).
Share and Cite
Esparza-Orozco, A.; Carranza-Becerra, L.; Delgadillo-Ruiz, L.; Bollaín y Goytia, J.J.; Gaytán-Saldaña, N.A.; Mandujano-García, C.D.; Delgadillo-Ruiz, E.; Michel-López, C.Y.; Huerta-García, J.; Valladares-Carranza, B.; et al. Environmental Heterogeneity Drives Secondary Metabolite Diversity from Mesquite Pods in Semiarid Regions. Ecologies 2025, 6, 19. https://doi.org/10.3390/ecologies6010019
Esparza-Orozco A, Carranza-Becerra L, Delgadillo-Ruiz L, Bollaín y Goytia JJ, Gaytán-Saldaña NA, Mandujano-García CD, Delgadillo-Ruiz E, Michel-López CY, Huerta-García J, Valladares-Carranza B, et al. Environmental Heterogeneity Drives Secondary Metabolite Diversity from Mesquite Pods in Semiarid Regions. Ecologies. 2025; 6(1):19. https://doi.org/10.3390/ecologies6010019
Chicago/Turabian StyleEsparza-Orozco, Alfredo, Liliana Carranza-Becerra, Lucía Delgadillo-Ruiz, Juan José Bollaín y Goytia, Norma Angélica Gaytán-Saldaña, Cruz Daniel Mandujano-García, Eladio Delgadillo-Ruiz, Claudia Yared Michel-López, Josefina Huerta-García, Benjamín Valladares-Carranza, and et al. 2025. "Environmental Heterogeneity Drives Secondary Metabolite Diversity from Mesquite Pods in Semiarid Regions" Ecologies 6, no. 1: 19. https://doi.org/10.3390/ecologies6010019
APA StyleEsparza-Orozco, A., Carranza-Becerra, L., Delgadillo-Ruiz, L., Bollaín y Goytia, J. J., Gaytán-Saldaña, N. A., Mandujano-García, C. D., Delgadillo-Ruiz, E., Michel-López, C. Y., Huerta-García, J., Valladares-Carranza, B., & Valtierra-Marín, H. E. (2025). Environmental Heterogeneity Drives Secondary Metabolite Diversity from Mesquite Pods in Semiarid Regions. Ecologies, 6(1), 19. https://doi.org/10.3390/ecologies6010019