

Distributional Trends and Species Richness of Maryland, USA, Stoneflies (Insecta: Plecoptera), with an Emphasis on the Appalachian Region

1
Department of Entomology, University of Illinois, Urbana-Champaign, Urbana, IL 61801, USA
2
Center for Biodiversity Studies, Department of Biology, Western Kentucky University, Bowling Green, KY 42101, USA
*
Author to whom correspondence should be addressed.
Ecologies 2022, 3(3), 395-421; https://doi.org/10.3390/ecologies3030029
Submission received: 27 August 2022
/
Revised: 9 September 2022
/
Accepted: 11 September 2022
/
Published: 15 September 2022
(This article belongs to the Special Issue The Ecology of Rivers, Floodplains and Oxbow Lakes)
Abstract
:Faunistic studies of regional biodiversity of aquatic insects are increasing in importance as declines are noted globally. Federal and state government conservation attempts for rare and threatened species are predicated upon the initial research of specialized taxonomists and trained field biologists. The reporting of aquatic insect occurrence data provides a baseline for conservation agencies to compare water quality monitoring studies. Updated field work, literature reviews, and database queries for stoneflies from the mid-Atlantic United States of America state of Maryland necessitated an assessment of species diversity for the state. Seven new state records and one new literature record are presented, bringing the total number of species to 122. Chao1 estimates of species richness are presented for diversity hotspots and the state as a whole, indicating that increased sampling is still necessary to fully understand diversity patterns. Accompanying are assessments of elevation trends and adult presence patterns within nine families. Collections are predominantly restricted to the Appalachian region. Herein, we direct future efforts to focus on understudied regions. An outline of distribution knowledge for species is presented to inform upcoming State Wildlife Action Plans.
1. Introduction
Plecoptera, or stoneflies, are well-known model organisms to assess environmental change, as many species are subject to extirpation and increasingly restricted ranges from anthropogenic impacts, including chemical [1] and thermal water pollution [2], climate change [3,4,5], and habitat degradation [6,7,8]. Stoneflies spend the majority of their lives in an aquatic, larval stage that leaves them vulnerable to the aforementioned impacts. Master et al. [9] listed stoneflies as the third most imperiled freshwater group, behind only Unionid freshwater mussels and crayfish. Stonefly range reductions, extirpations, and extinctions have been increasingly recorded from the eastern United States of America (USA). DeWalt et al. [6] noted that 28% of stonefly species have been extirpated from Illinois as a direct result of human impacts. Similarly, DeWalt et al. [10] recorded extirpations from Ohio, while DeWalt and Grubbs [11] recorded losses amounting to 12% of the known Indiana stonefly fauna. These losses are recorded not only throughout the midwestern USA but also internationally, with extirpations from Czechoslovakia [7,12].
As stoneflies are garnering increased attention as biomonitoring tools, it is important to inventory and describe faunal assemblages within political units to identify regions where conservation efforts should be concentrated. In regions subjected to intense anthropogenic disturbances, faunal assemblages have shifted species composition as taxa are extirpated or become increasingly more uncommon, and species with life history traits inclined to survive disturbances become more common [13]. Inventories of species diversity and distributions are especially important in the face of a changing climate, which may further limit fauna to increasingly restricted habitats. Climate change resulting in warming stream temperatures pushes montane stenothermic stoneflies to increasingly lower quality, isolated patches of habitat reducing connectivity, and population persistence [4,14].
State and federal conservation agencies provide lists of rare and threatened species to monitor through State Wildlife Action Plans (SWAPs). The species listed in SWAPs are considered Species of Greatest Conservation Need (SGCN), and conservation efforts for these taxa are prioritized over non-listed species. Species listing is reliant upon taxonomic experts to provide data on target species that demonstrate the necessity of listing. Limited resources handicap the knowledge of rare and uncommonly collected stoneflies, as intense sampling protocols over multiple years are often necessary to determine population statuses and document range contractions for at-risk species [15]. Updating SWAPs to include additional at-risk species with the best available data is important to protect and conserve each state’s wildlife resources.
The northeastern USA has undergone historic and contemporaneous freshwater habitat disturbances that have restructured lotic systems [16]. Within this region, Maryland, a small central Atlantic state with varied topography and land use, has been subjected to multiple human-induced aquatic stressors, with agriculture [17], mining [18], riparian corridor manipulation [16], and land conversion for urban development [19] being major sources of impairment. In the face of increasing land conversion for urbanization and climate change in Maryland, it is important to inventory and detail the distributional status of aquatic insect taxa in the state most impacted by these anthropogenic impacts. Maryland is of focal interest because of historical data present in the literature and in institutions (e.g., Illinois Natural History Survey), but also due to prior fieldwork by the second author and others that has resulted in iterative, updated species checklists [20,21,22,23]. The latter efforts have led to a developing database of valid distributional records that could be built upon with contemporaneous and focused sampling efforts. The greatest diversity of stoneflies has been found in cold-water, highly oxygenated streams of unglaciated montane regions; however, understudied habitats such as warmer, lowland, and coastal streams of the Atlantic Coastal Plain have been identified as hosting a diverse assemblage of stoneflies [24,25,26,27,28]. The paucity of stonefly collection data in Atlantic Coastal Plain streams hinders the ability to determine potential ecological and biodiversity impacts of agricultural practices and human development.
By addressing the general distributional trends of stoneflies in Maryland and identifying regions of biodiversity, this study can present a directive on where, and for which species, conservation efforts should be focused in the future. Faunal surveys of aquatic insects within political boundaries offer valuable information to state wildlife and fisheries biologists by providing both a baseline and an update by monitoring changes in environmental quality in addition to identifying distribution patterns of rare and uncommon species [29,30]. As such, the objectives of this study were to (1) refine biogeographical trends of the state’s stonefly fauna, (2) address gaps in the known distributions of uncommon species (i.e., SGCNs) known from Maryland, and (3) identify and characterize regions of the highest biodiversity within the state.
2. Materials and Methods
2.1. Study Area
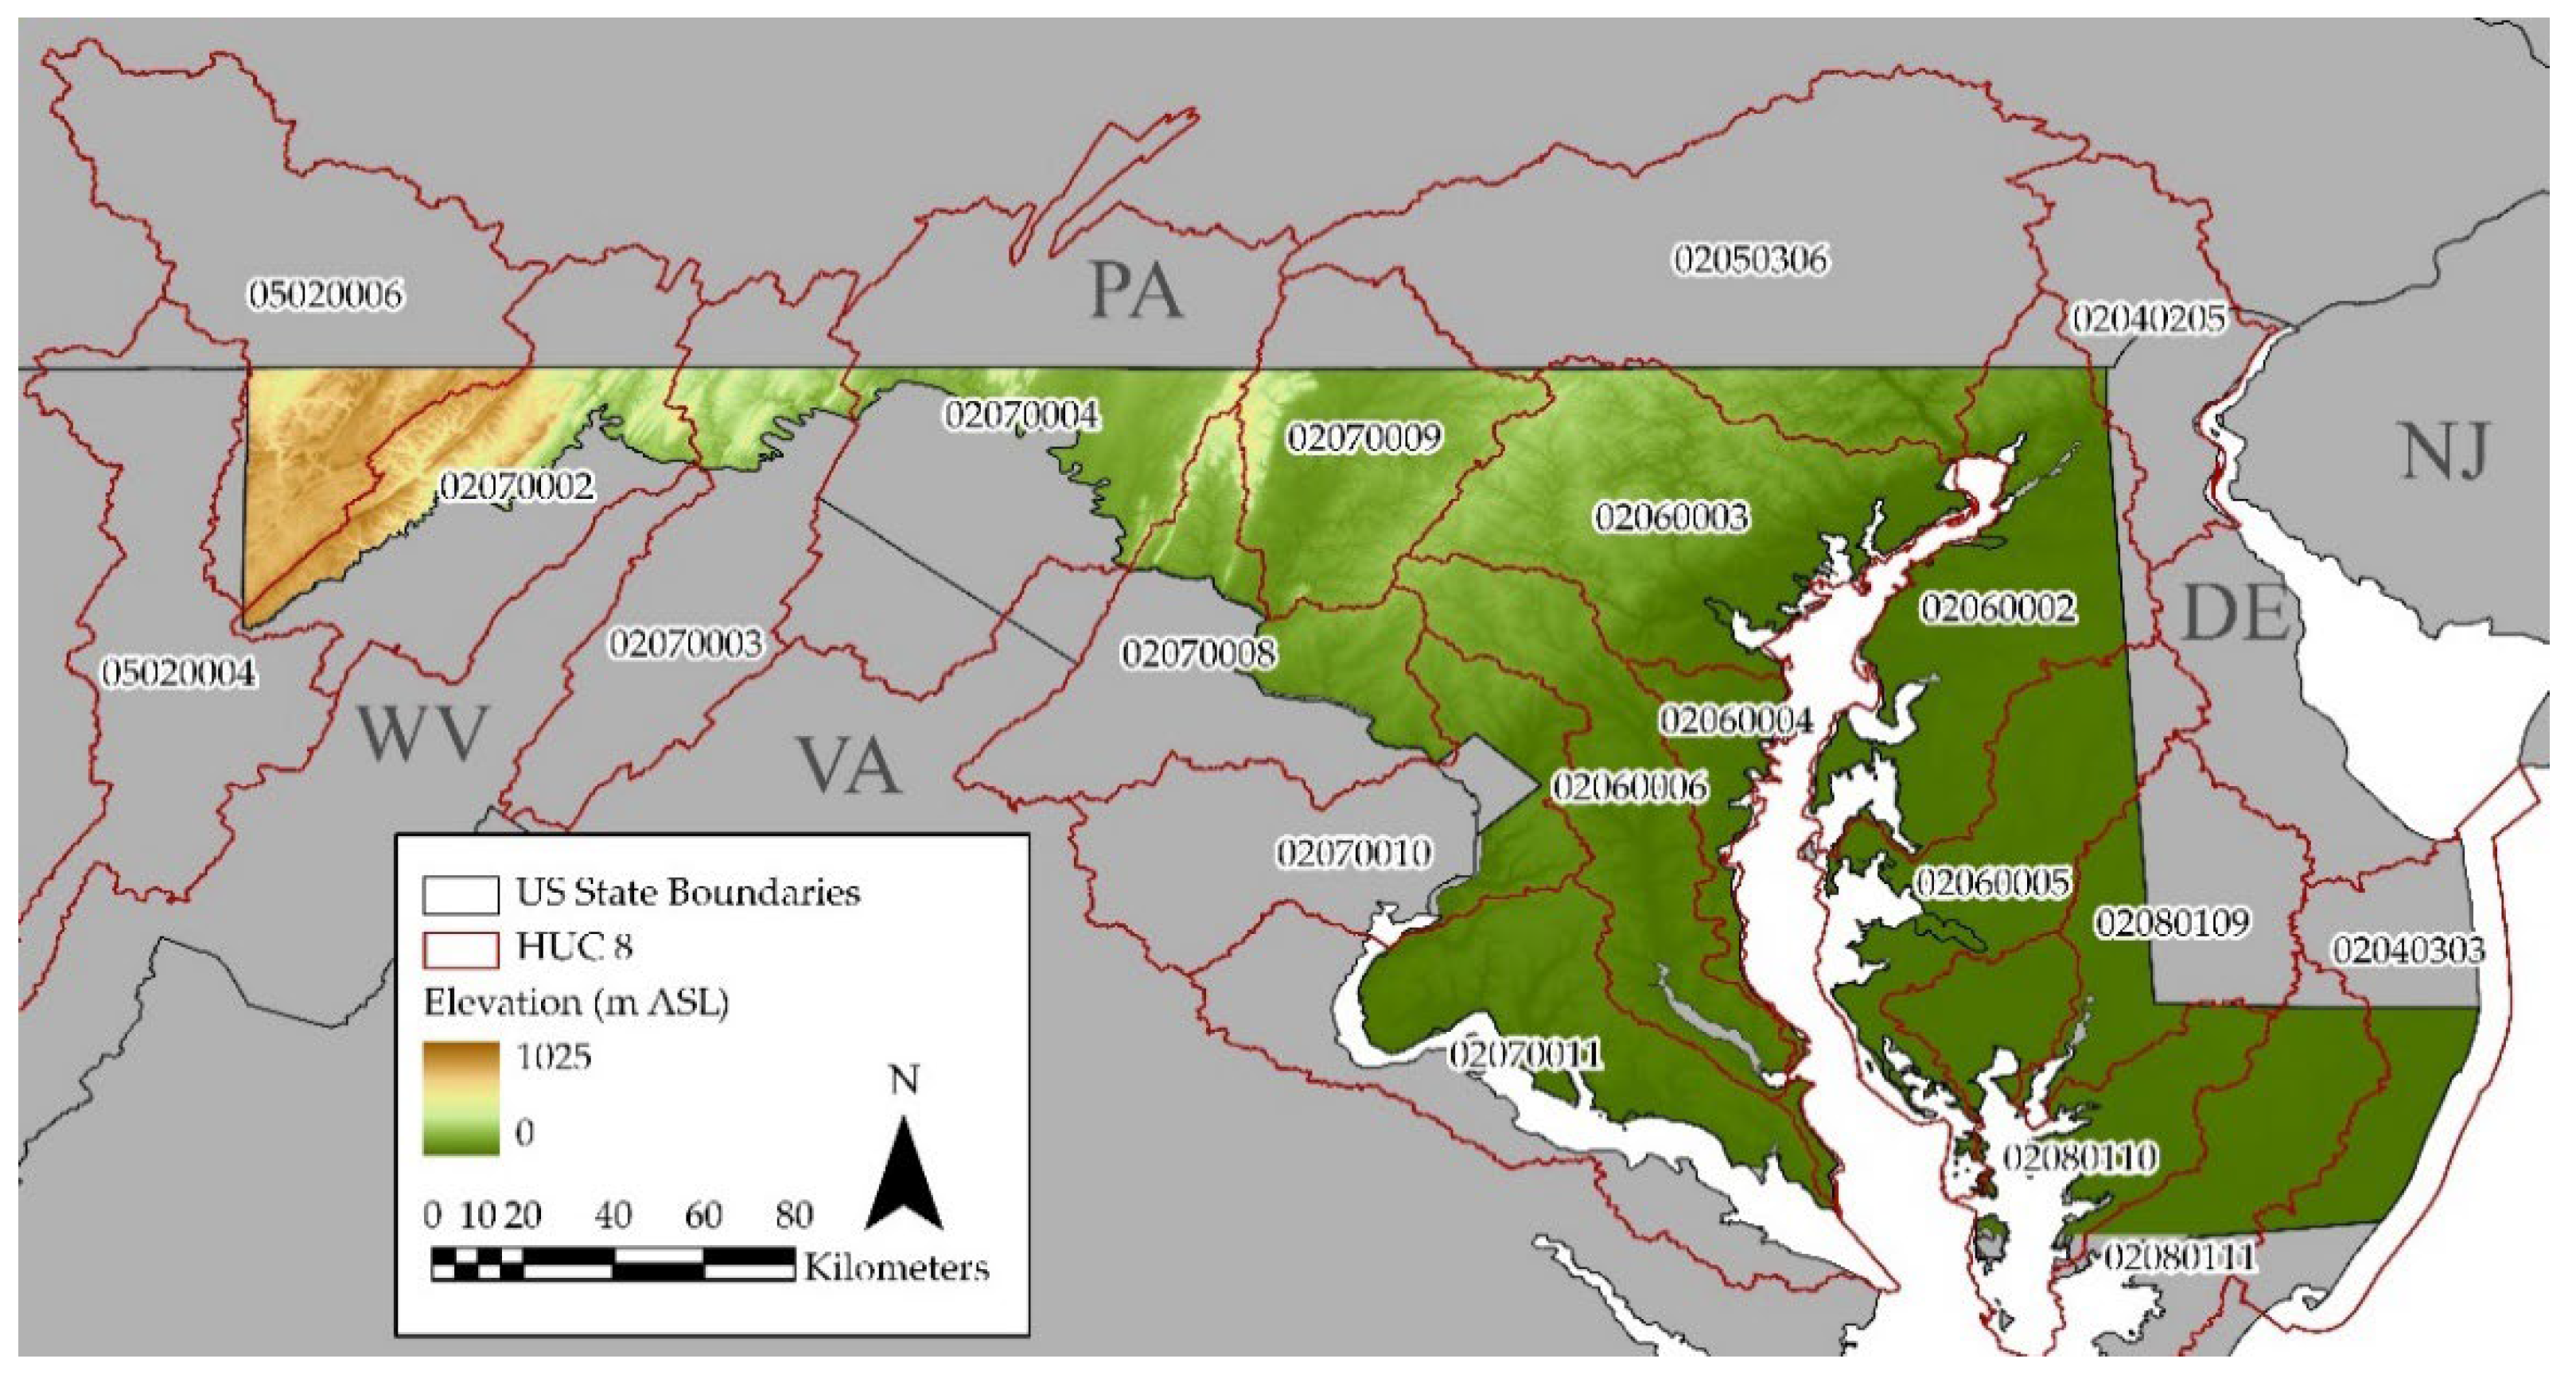
The political borders of Maryland span between the latitudes of 37.9 N and 39.5 N and the longitudes of −75.0 W and −79.5 W, covering nearly 25,500 km2 of land. The southern border of Maryland, east of the Chesapeake Bay, runs northwestward along the Potomac River. The Mason–Dixon line forms the northern border of the state with Pennsylvania. The topographic relief of Maryland ranges from sea level along the Chesapeake Bay and the Atlantic Ocean to 1025 m Above Sea Level (ASL) (3360 ft ASL) at Hoye-Crest along Backbone Mountain in southwestern Garrett County (Figure 1). Physical habitats of lotic systems vary from low-gradient streams in the Coastal Plain to high-gradient streams in the Appalachian region. Stream substrates in the Coastal Plains generally consist of sand and gravel beds, while streams and rivers in the Piedmont regions and west to the central Appalachians are composed of a varied mix of bedrock, boulder, and large cobble [31].
2.2. Data Acquisition
Specimens and data for this project were obtained from fieldwork by both authors, examination of material in collections (see below), integration of records from the Illinois Natural History Survey (INHS; https://insect.inhs.illinois.edu/, accessed on 1 November 2019) and the Maryland Biological Stream Survey (MBSS), personal correspondence between Dr. Rebecca F. Surdick (RFSC) and SAG during the 1990s, and valid literature sources (Table 1).
Stoneflies were collected by the authors during 1992–2000 (SAG) and 2020–2022 (PNH), the latter under Maryland Department of Natural Resources Scientific Collecting Permit Number SCP202064. Sites were accessed along state roads, state forest roads, and hiking trails. Collecting occurred using a combination of standard techniques, namely, with a beating sheet for adults from riparian vegetation, battery-powered ultra-violet light traps on clear summer evenings for Perlidae, and hand picking with forceps from bridges, culverts, streamside rocks, emergent leaf packs, and vegetation. Larvae were collected sporadically by hand picking from submerged rocks, leaf packs, and wood. All specimens were preserved on site in 95% ethanol and are stored at Western Kentucky University. Specimens were also examined from the Charles H. Nelson Collection, Chattanooga, Tennessee; Carnegie Museum of Natural History, Pittsburgh, Pennsylvania; and the United States National Museum, Washington, D.C. (USNM). All specimen data accrued for this project were archived in Darwin Core Archive file format supported by Dryad and are available here: doi:10.5061/dryad.hdr7sqvmg. Records are formatted to include specific collection data. All distribution maps were prepared using ArcGIS Pro 2.8.0 [32].
GPS coordinates (in decimal degrees) for all records were either recorded directly in the field at each site or georeferenced from museum label data using Acme Mapper 2.2 (https://mapper.acme.com, accessed on 1 February 2022) to the highest precision allowable by the location description. Record data were organized by elevation, drainage area, county, U.S. Environmental Protection Agency Level-III Ecoregion, and United States Geological Survey (USGS) Hydrologic Unit Code (HUC)-8 subbasin. HUC-8 subbasins were used here to delineate increasingly smaller subsets of catchments. Elevation data were extracted from the USGS 3D Elevation Program [33]. We recognize, however, that for some record data, elevation was only a gross estimate since GPS precision ranged from 10–10,000 km2 radii.
2.3. Statistical Methods
A Principal Component Analysis (PCA) was conducted to differentiate habitats for Maryland SGCNs. Three topographic variables (slope, aspect, and Topographic Wetness Index) were derived from a ⅓-arc-second resolution elevation raster from the USGS 3D Elevation Program [33]. Annual precipitation data averaged from 1991–2020 were downloaded from PRISM [34]. Record redundancy between field and literature data was removed prior to analyses. A Non-metric Multi-Dimensional Scaling (NMDS) ordination of species composition using an unweighted presence–absence matrix for stonefly species of the eastern USA was completed to identify similarities between state faunal assemblages. The Sørensen Distance was used to determine similarity to discrete presence–absence data. Species presence was recorded for each state from Plecoptera.Speciesfile.org and updated using contemporaneous collections in Maryland [35]. Analyses were performed using R version 4.2.1 [36]. Chao1 species richness estimates were generated using EstimateS version 9.1.0 [37].
3. Results
3.1. General Trends
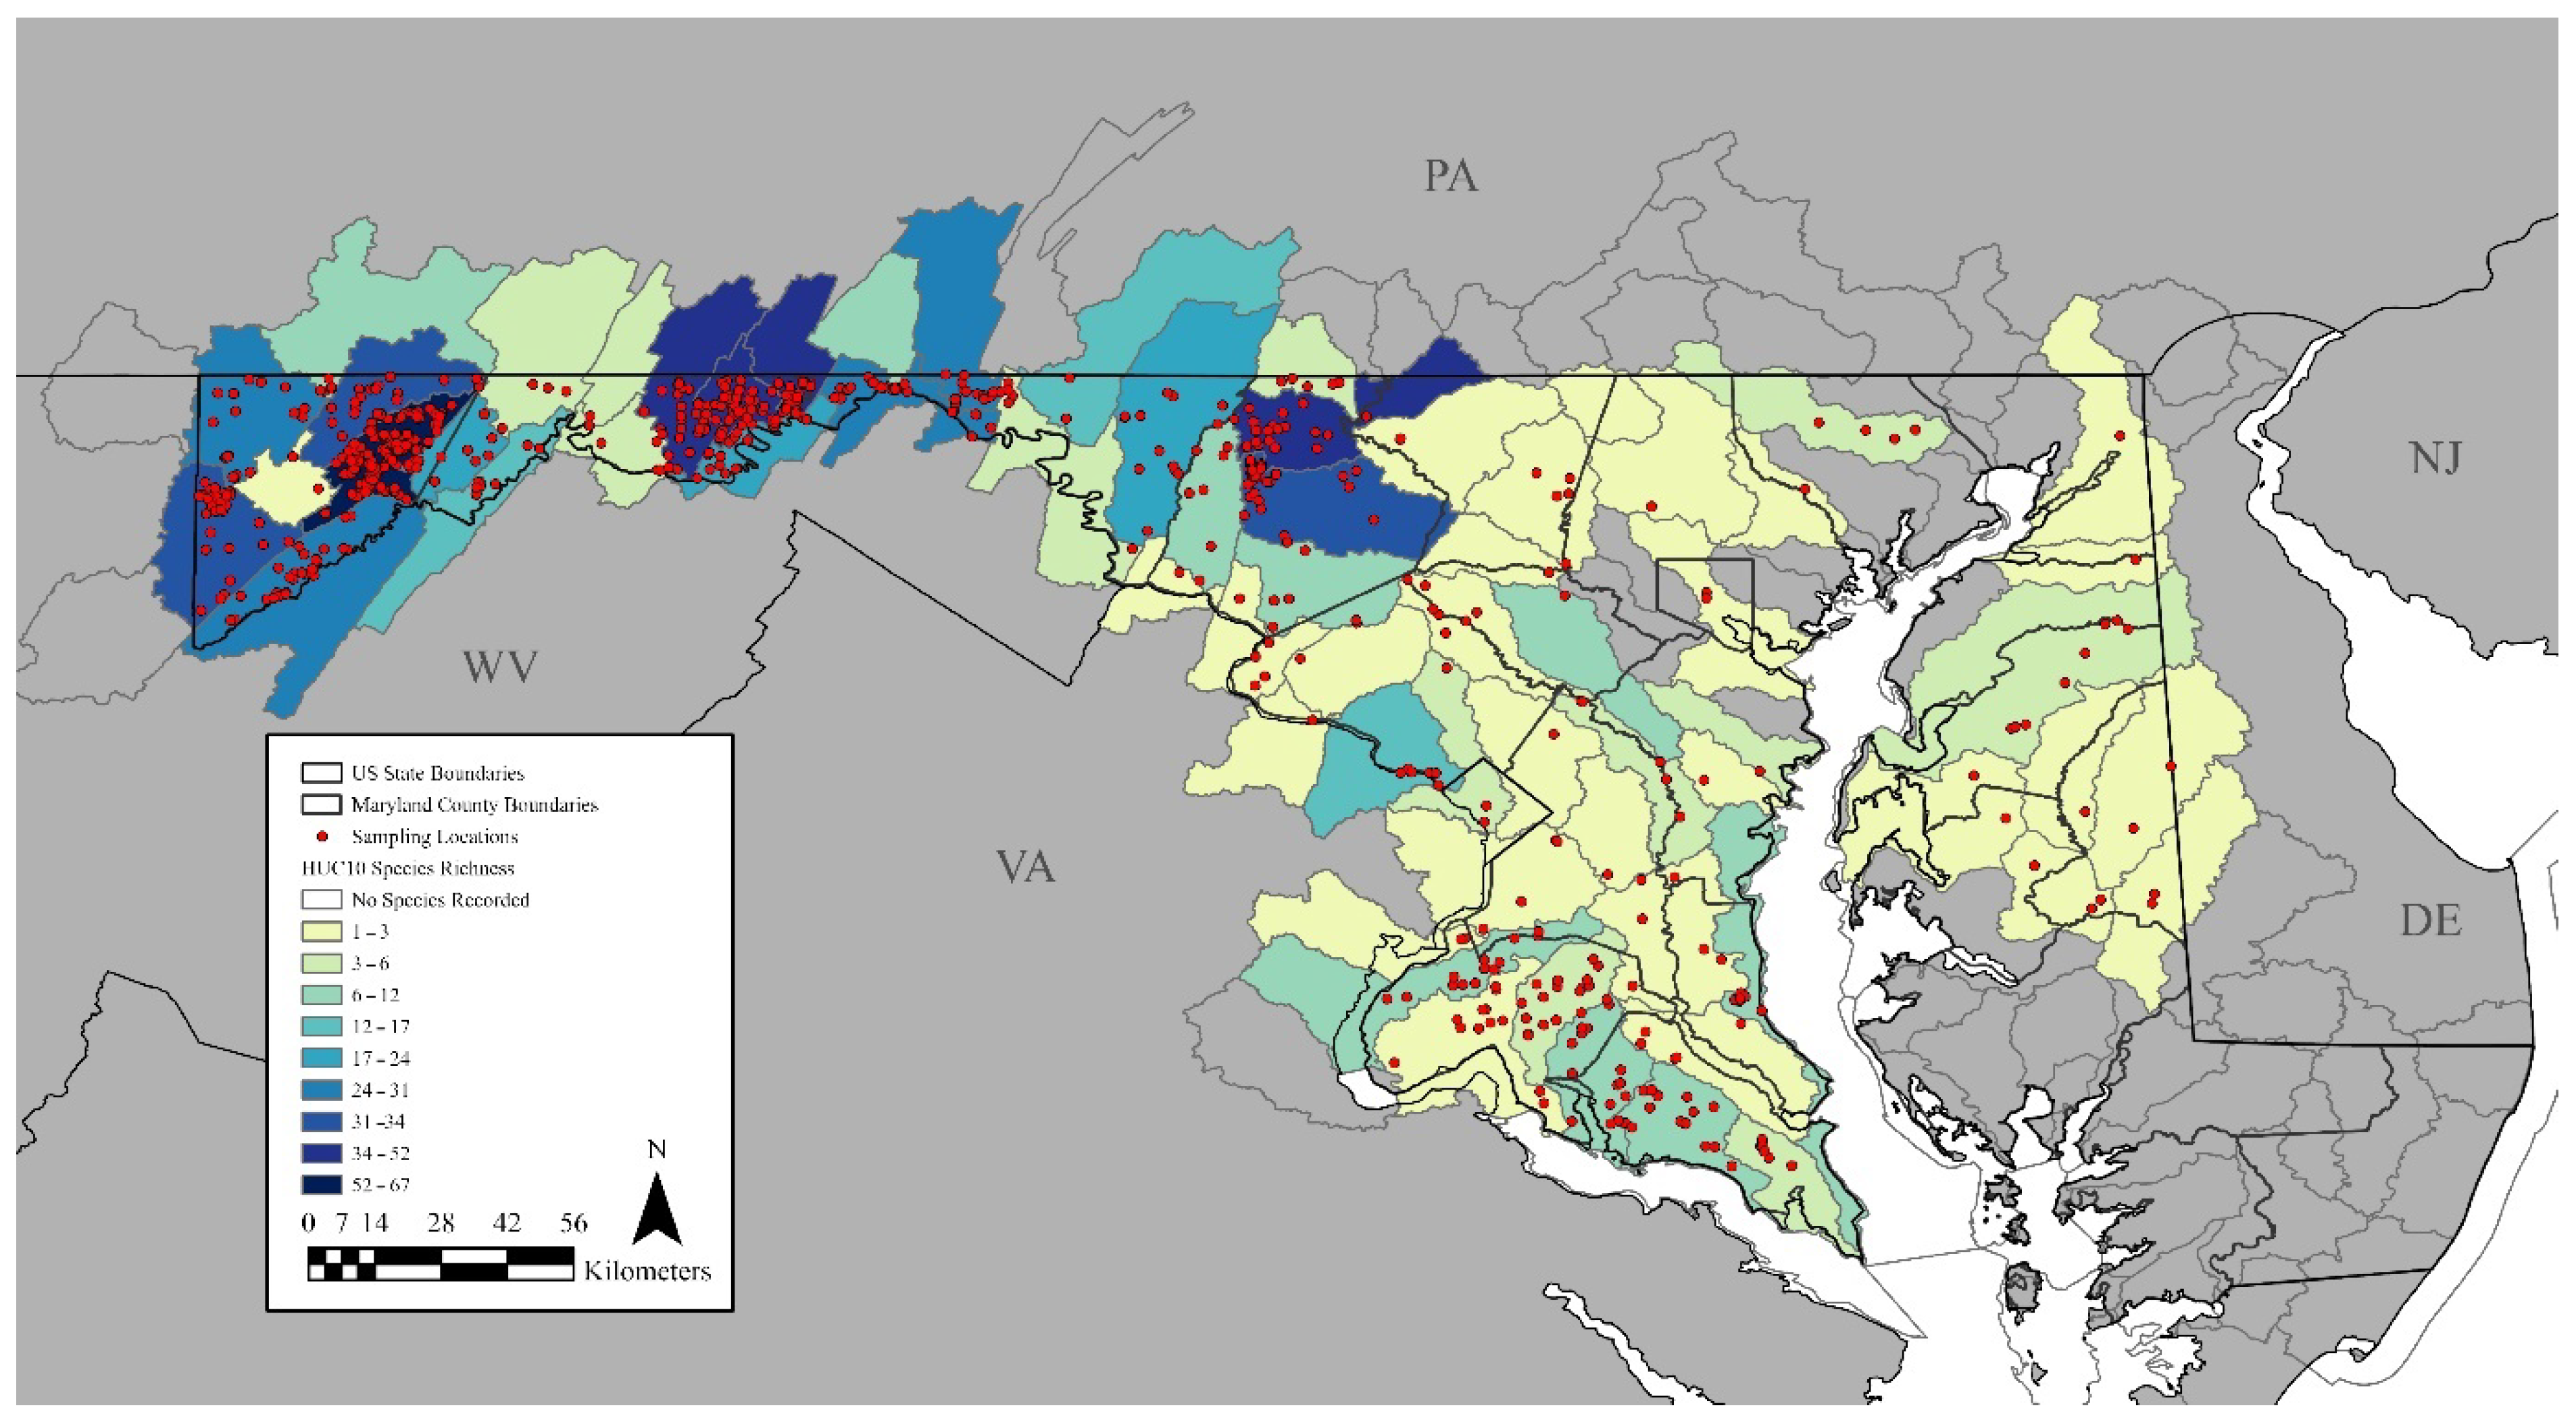
A total of 3824 collection records and 260 valid literature records were compiled for this study, ranging in elevation from 1 (Saint Mary’s Co.) to 874 m ASL (Garrett Co.) (Figure 2; Table 1). Of the 24 counties within the state, 20 are represented by at least one collection record. The greatest proportion of collection data were from Garrett Co., accounting for 51% (n = 2097) of the total available records. The three remaining Appalachian counties (Allegany, Washington, and Frederick) combined accounted for an additional 38% (n = 1562). The 16 non-Appalachian counties with collection data available, however, only accounted for the remaining 11% (n = 425) of records. The four counties without species-level collection records are all located in the southern half of the eastern peninsula (Dorchester, Somerset, Wicomico, and Worcester) (Figure 2).
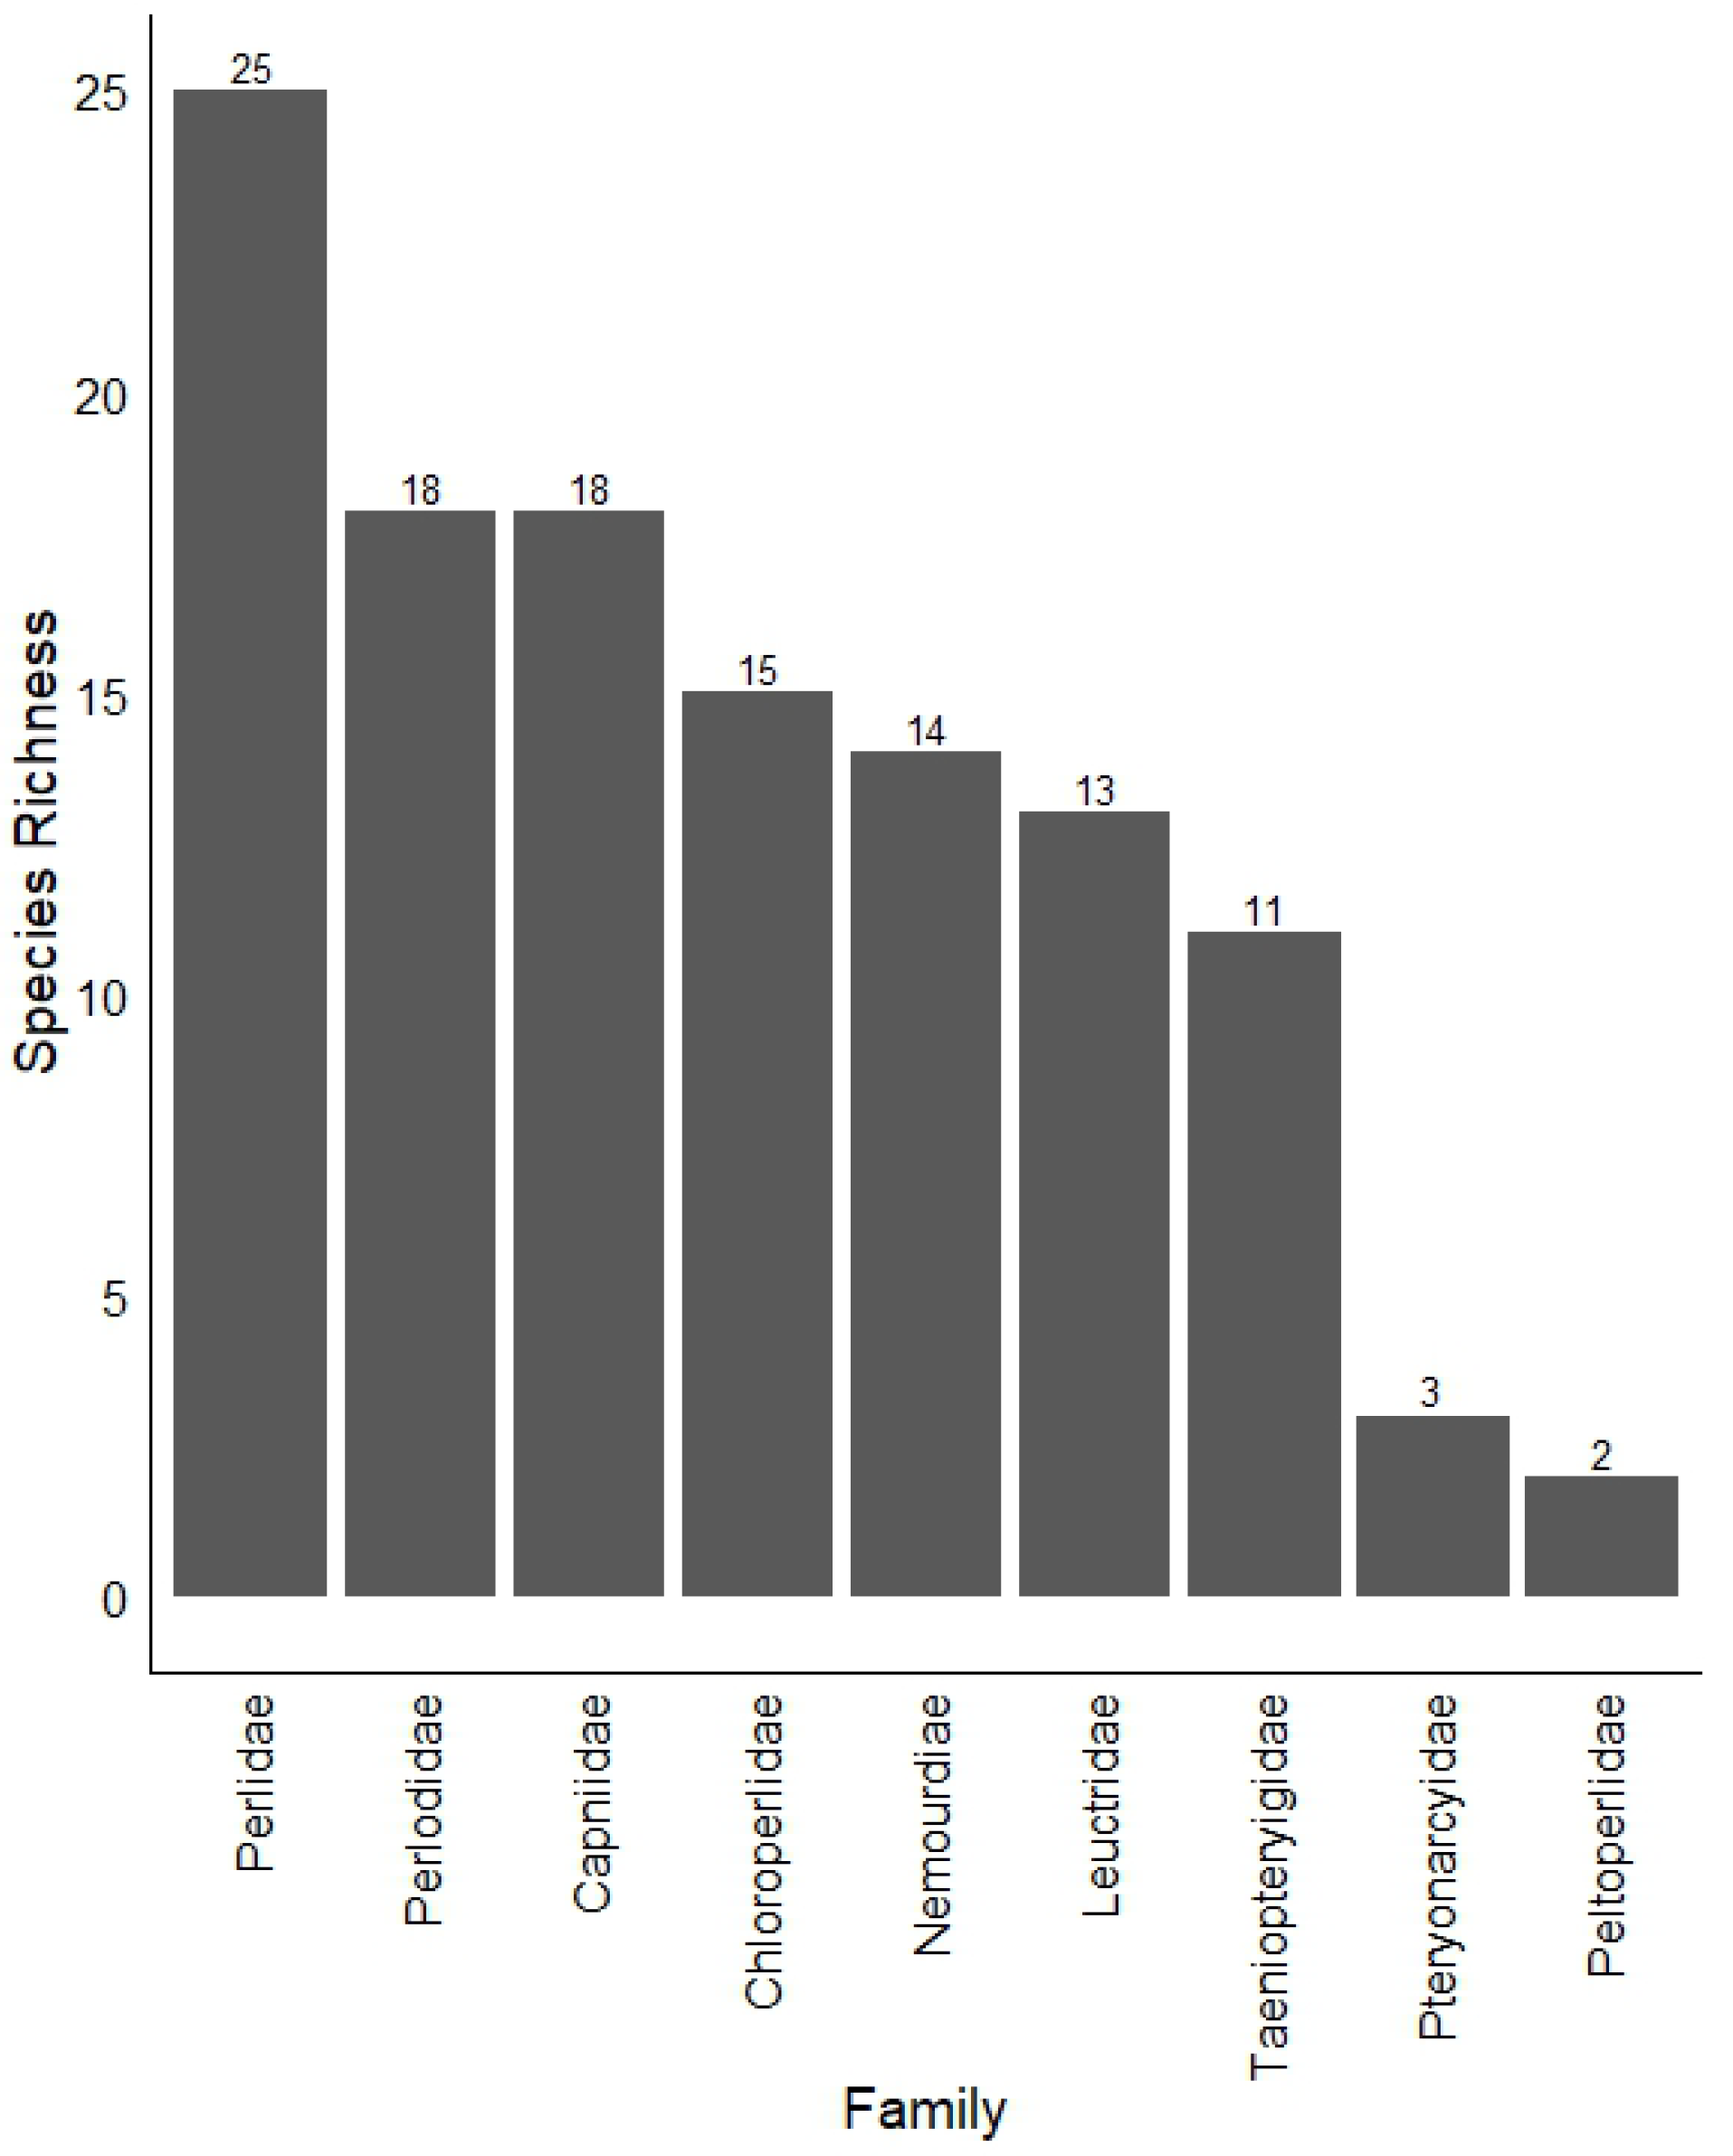
A total of 122 species are reported here, including 7 new state records noted below (Table 2). Nine of the ten Nearctic stonefly families are represented from Maryland. The tenth family, Kathroperlidae, is known only from the far western Nearctic and South Korea [38]. The most diverse family in the state is Perlidae (n = 25 species), followed by Perlodidae (n = 19) and Capniidae (n = 18) (Figure 3). Nearly 50% of the diversity within the state is found within six genera: Allocapnia Claassen, 1928 (n = 17 species); Leuctra Stephens, 1836 (n = 11); Isoperla Banks, 1906 (n = 10); Alloperla Banks, 1906 (n = 7); Perlesta Banks, 1906 (n = 7); and Taeniopteryx Pictet, 1841 (n = 7).
3.2. Faunal Relationship to USA States
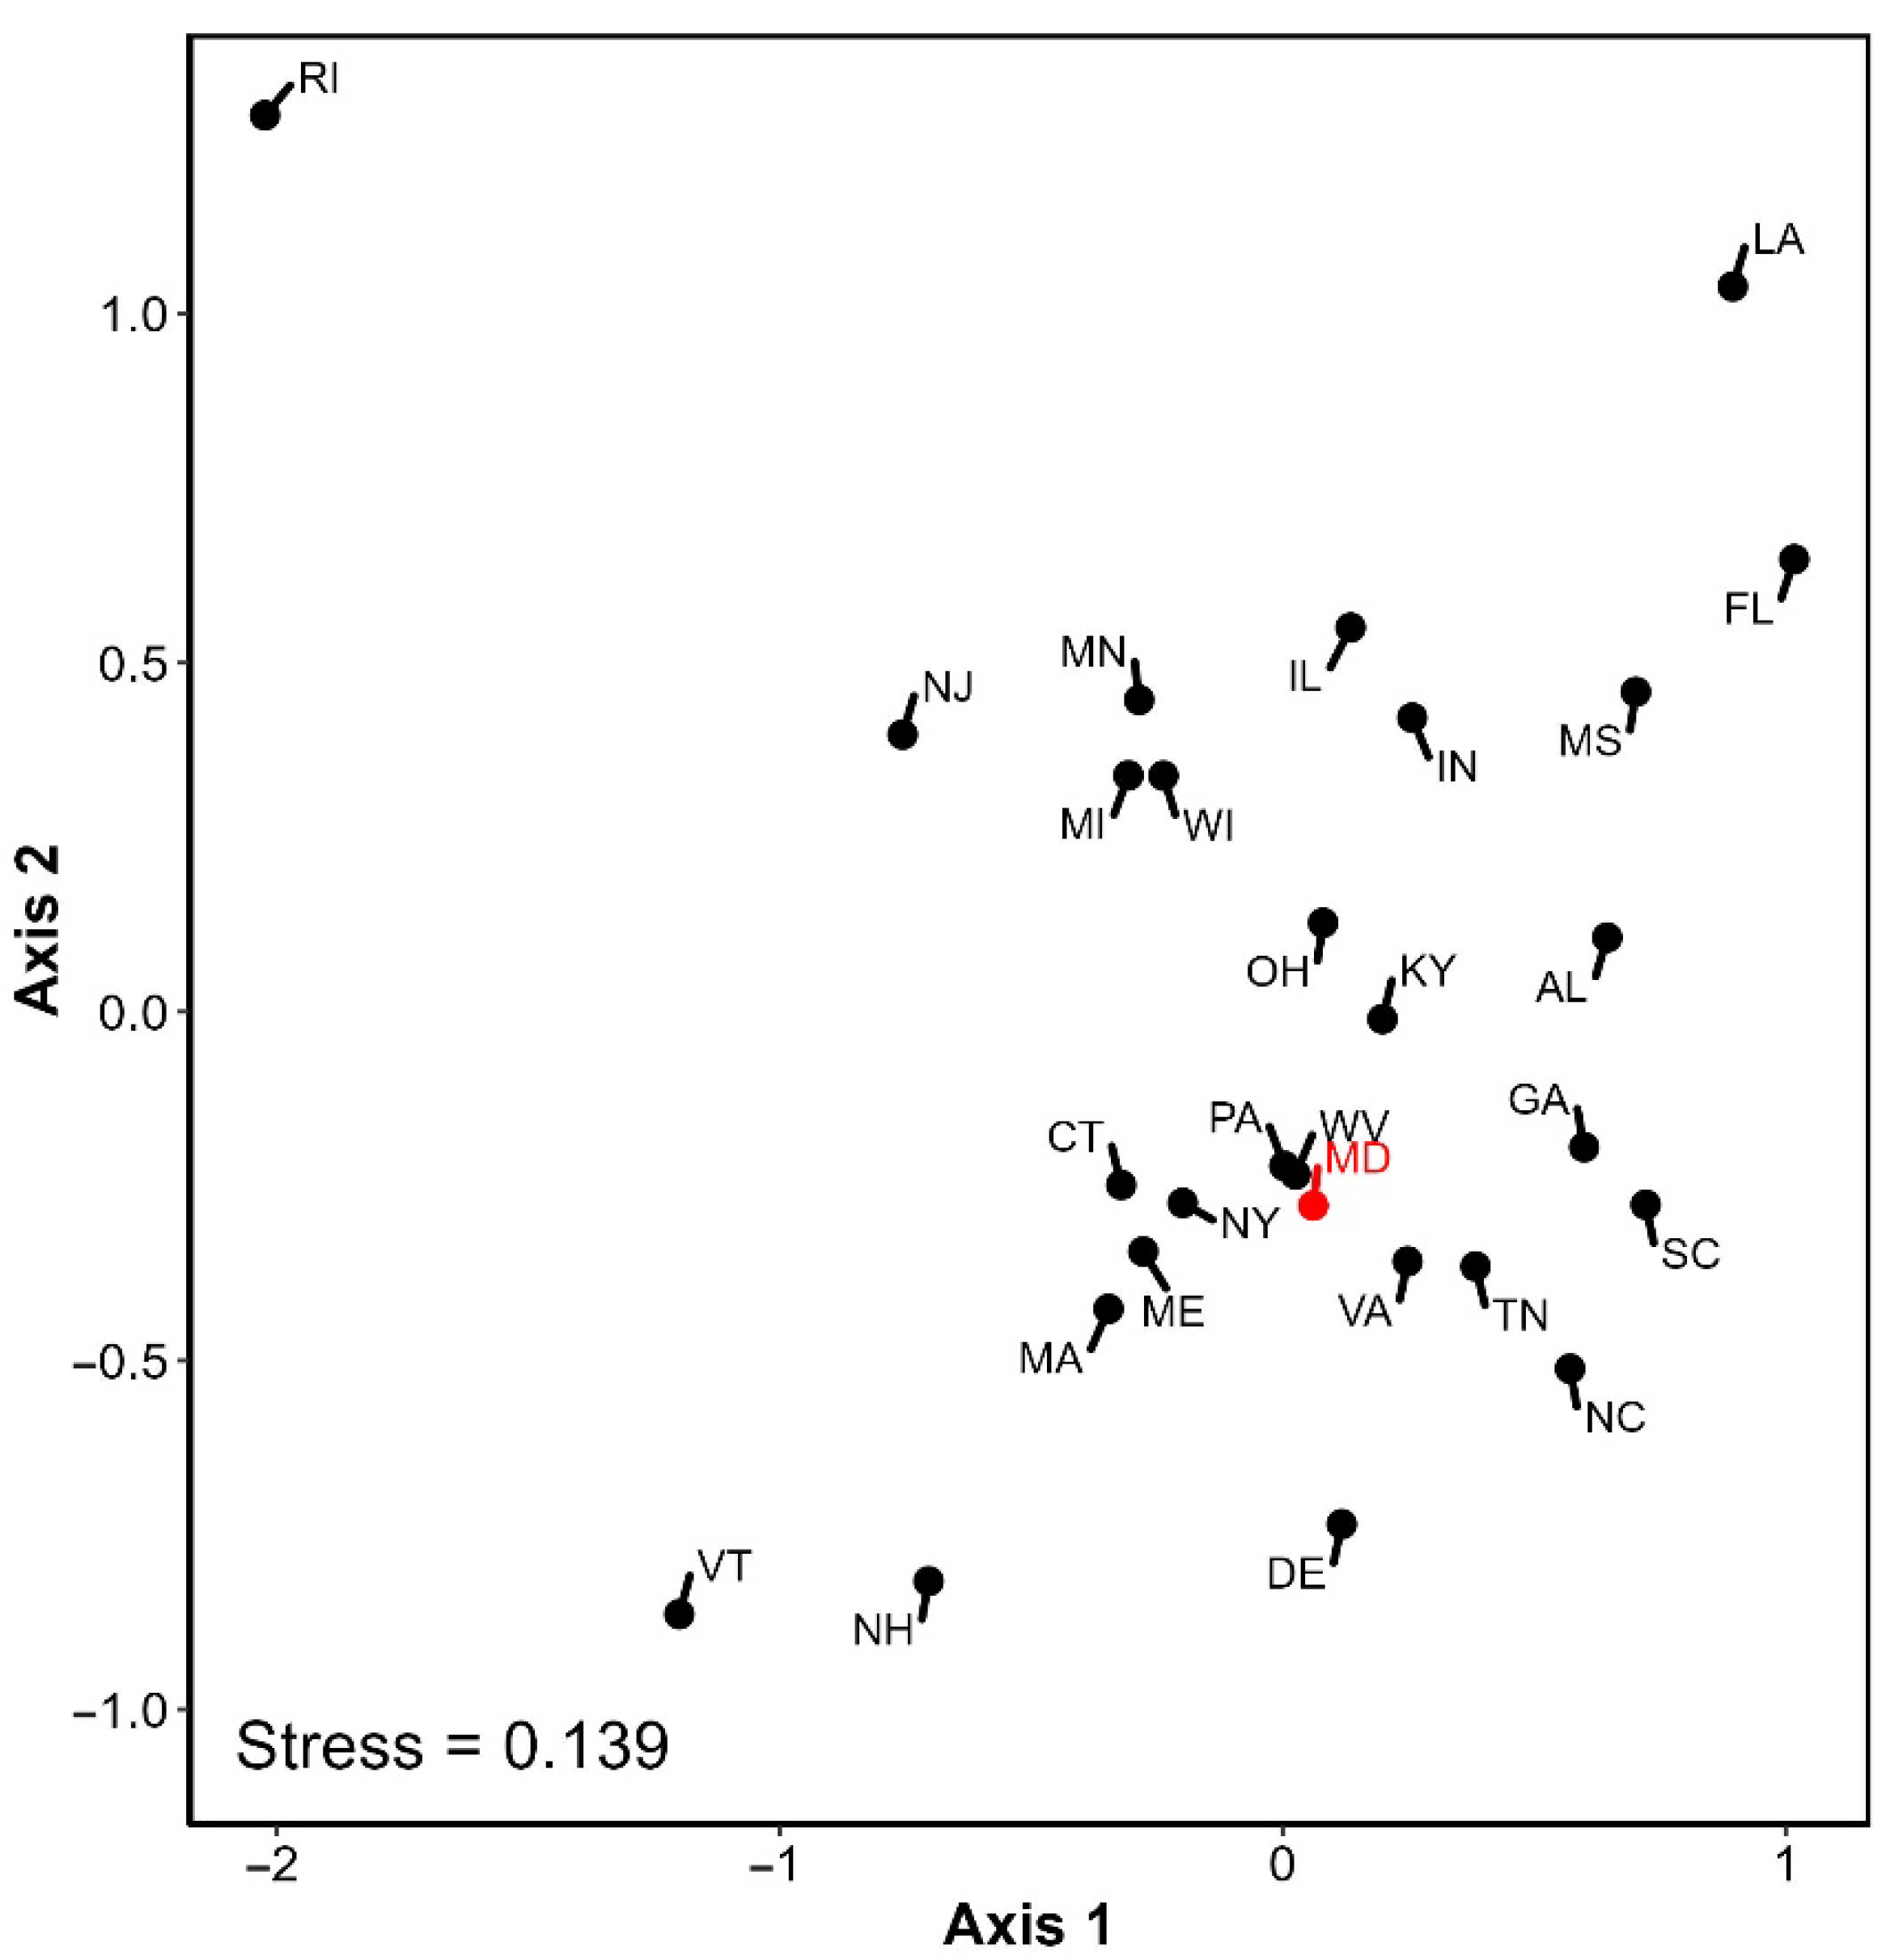
The NMDS of eastern USA state faunal assemblages performed well, indicated by the high non-metric fit (R2 = 0.981) and linear fit (R2 = 0.933). A stress value of 0.139 was recorded for the NMDS using two dimensions. Clustering of states based on the similarity of typical faunal assemblages was typical of geographic proximity (Southern Appalachian, Interior Highlands, etc.) (Figure 4). Not surprisingly, the closest related states are those bisecting the Appalachian Mountains and bordering states. In contrast, there are several states that are highly dissimilar due to the paucity of species recorded from those states (e.g., Rhode Island, n = 3) [35].
3.3. New State and Literature Records
Seven new state records representing six families are reported based on 2020–2021 field collections and MBSS records. In addition, one previously unreported species record was mined from the literature. All eight species have been previously reported from at least two adjacent states. Each new record presented is reported below as their presence from each individual HUC-8.
3.3.1. New State Records
Capniidae: Allocapnia simmonsi Kondratieff and Voshell, 1981
HUC-8: 0207004
Comments. This uncommon species was reported previously only from adjacent Pennsylvania, West Virginia, and Virginia [35,39]. Collections of A. simmonsi from bordering states are from small to medium-sized streams in the Northern Piedmont and Ridge and Valley ecoregions.
Capniidae: Allocapnia virginiana Frison, 1942
HUC-8: 0207011
Comments. This common species known from the Coastal Plain and Piedmont regions of the eastern USA was reported previously from adjacent Delaware and Virginia [35]. This new state record was anticipated.
Chloroperlidae: Alloperla petasata Surdick, 2004
HUC-8: 0207002 and 0207003
Comments. This common and widespread Appalachian species has been reported previously from adjacent Pennsylvania, West Virginia, and Virginia [35,40].
Leuctridae: Leuctra truncata Claassen, 1923
HUC-8: 0207002, 0207003, 02070009, and 5020006
Comments. This species has been reported from adjacent Pennsylvania, Virginia, and West Virginia [35].
Perlodidae: Isoperla davisi James, 1974
HUC-8: 02060004
Comments. This common and widespread species was known previously from adjacent Delaware and Virginia [35,41]. Adults were collected from a sandy-bottomed, highly incised second-order tributary of the Southeastern Plains.
Perlodidae: Isoperla nelsoni Szczytko and Kondratieff, 2015
HUC-8: 02070002
Comments. This is a recently described species reported from adjacent Virginia and West Virginia [35,41,42]. This record represents the northernmost extent of this species’ known range.
Taeniopterygidae: Bolotoperla rossi (Frison, 1942)
HUC-8: 05020006
3.3.2. New Literature Record
Helopicus subvarians (Banks, 1920) was included in Needham and Claassen [44] under the junior synonym Perla postica from Great Falls on the Virginia side of the Potomac River and from Maryland at Chain Bridge, also along the Potomac River. Banks [45] included references to collections at both High Island and Great Falls from Maryland. These records have been unintentionally missed in both faunistic (e.g., Grubbs [22]) and taxonomic treatments (e.g., Stark and Ray [46]) until this study. This species has been reported previously from adjacent Pennsylvania, Virginia, and West Virginia [35,46,47].
3.4. Species Known Only from Historical Localities
Three species have not been collected within Maryland since prior to the mid-1990s. One, as noted above, is H. subvarians, with two historical records from the Potomac River from 1907 and 1912 [44]. Shipsa rotunda (Claassen, 1923) is known from only two separate state records dating back to 1938 at INHS [48]. For both S. rotunda and H. subvarians, all four collection localities are from comparatively undersampled portions east of the Appalachian Mountains. Allocapnia vivipara (Claassen, 1924) is a common and widespread species found largely west of the Appalachian Mountains and spottily distributed eastwards. INHS records for this species are known only from Frederick County dating from 1966 and prior.
3.5. Anticipated Faunal Deletions
The reporting of two species, Isoperla gibbsae Harper, 1971, and Tallaperla elisa Stark, 1983, from Frederick County in Duffield and Nelson [21] and their subsequent retention in state checklists [22,23] remains dubious. All verified records of I. gibbsae appear to be restricted to Connecticut, Massachusetts, New York, and Quebec [41]. The record from West Virginia [49] is likewise considered questionable until verified with modern taxonomic literature [41]. Tallaperla elisa appears to be restricted to the southern Appalachian Mountain Highlands region in east Tennessee and western North Carolina [50]. Collections by the authors in Frederick County and higher-elevation Garrett County have yielded no material of either species. Similar questionable records of T. elisa in Pennsylvania have been examined and determined as T. maria (Needham and Smith, 1916), resulting in the removal of the former from the state list [51]. Both dubious species are retained on the Maryland checklist until specimens are reexamined.
3.6. Geographic and Phenological Patterns by Family
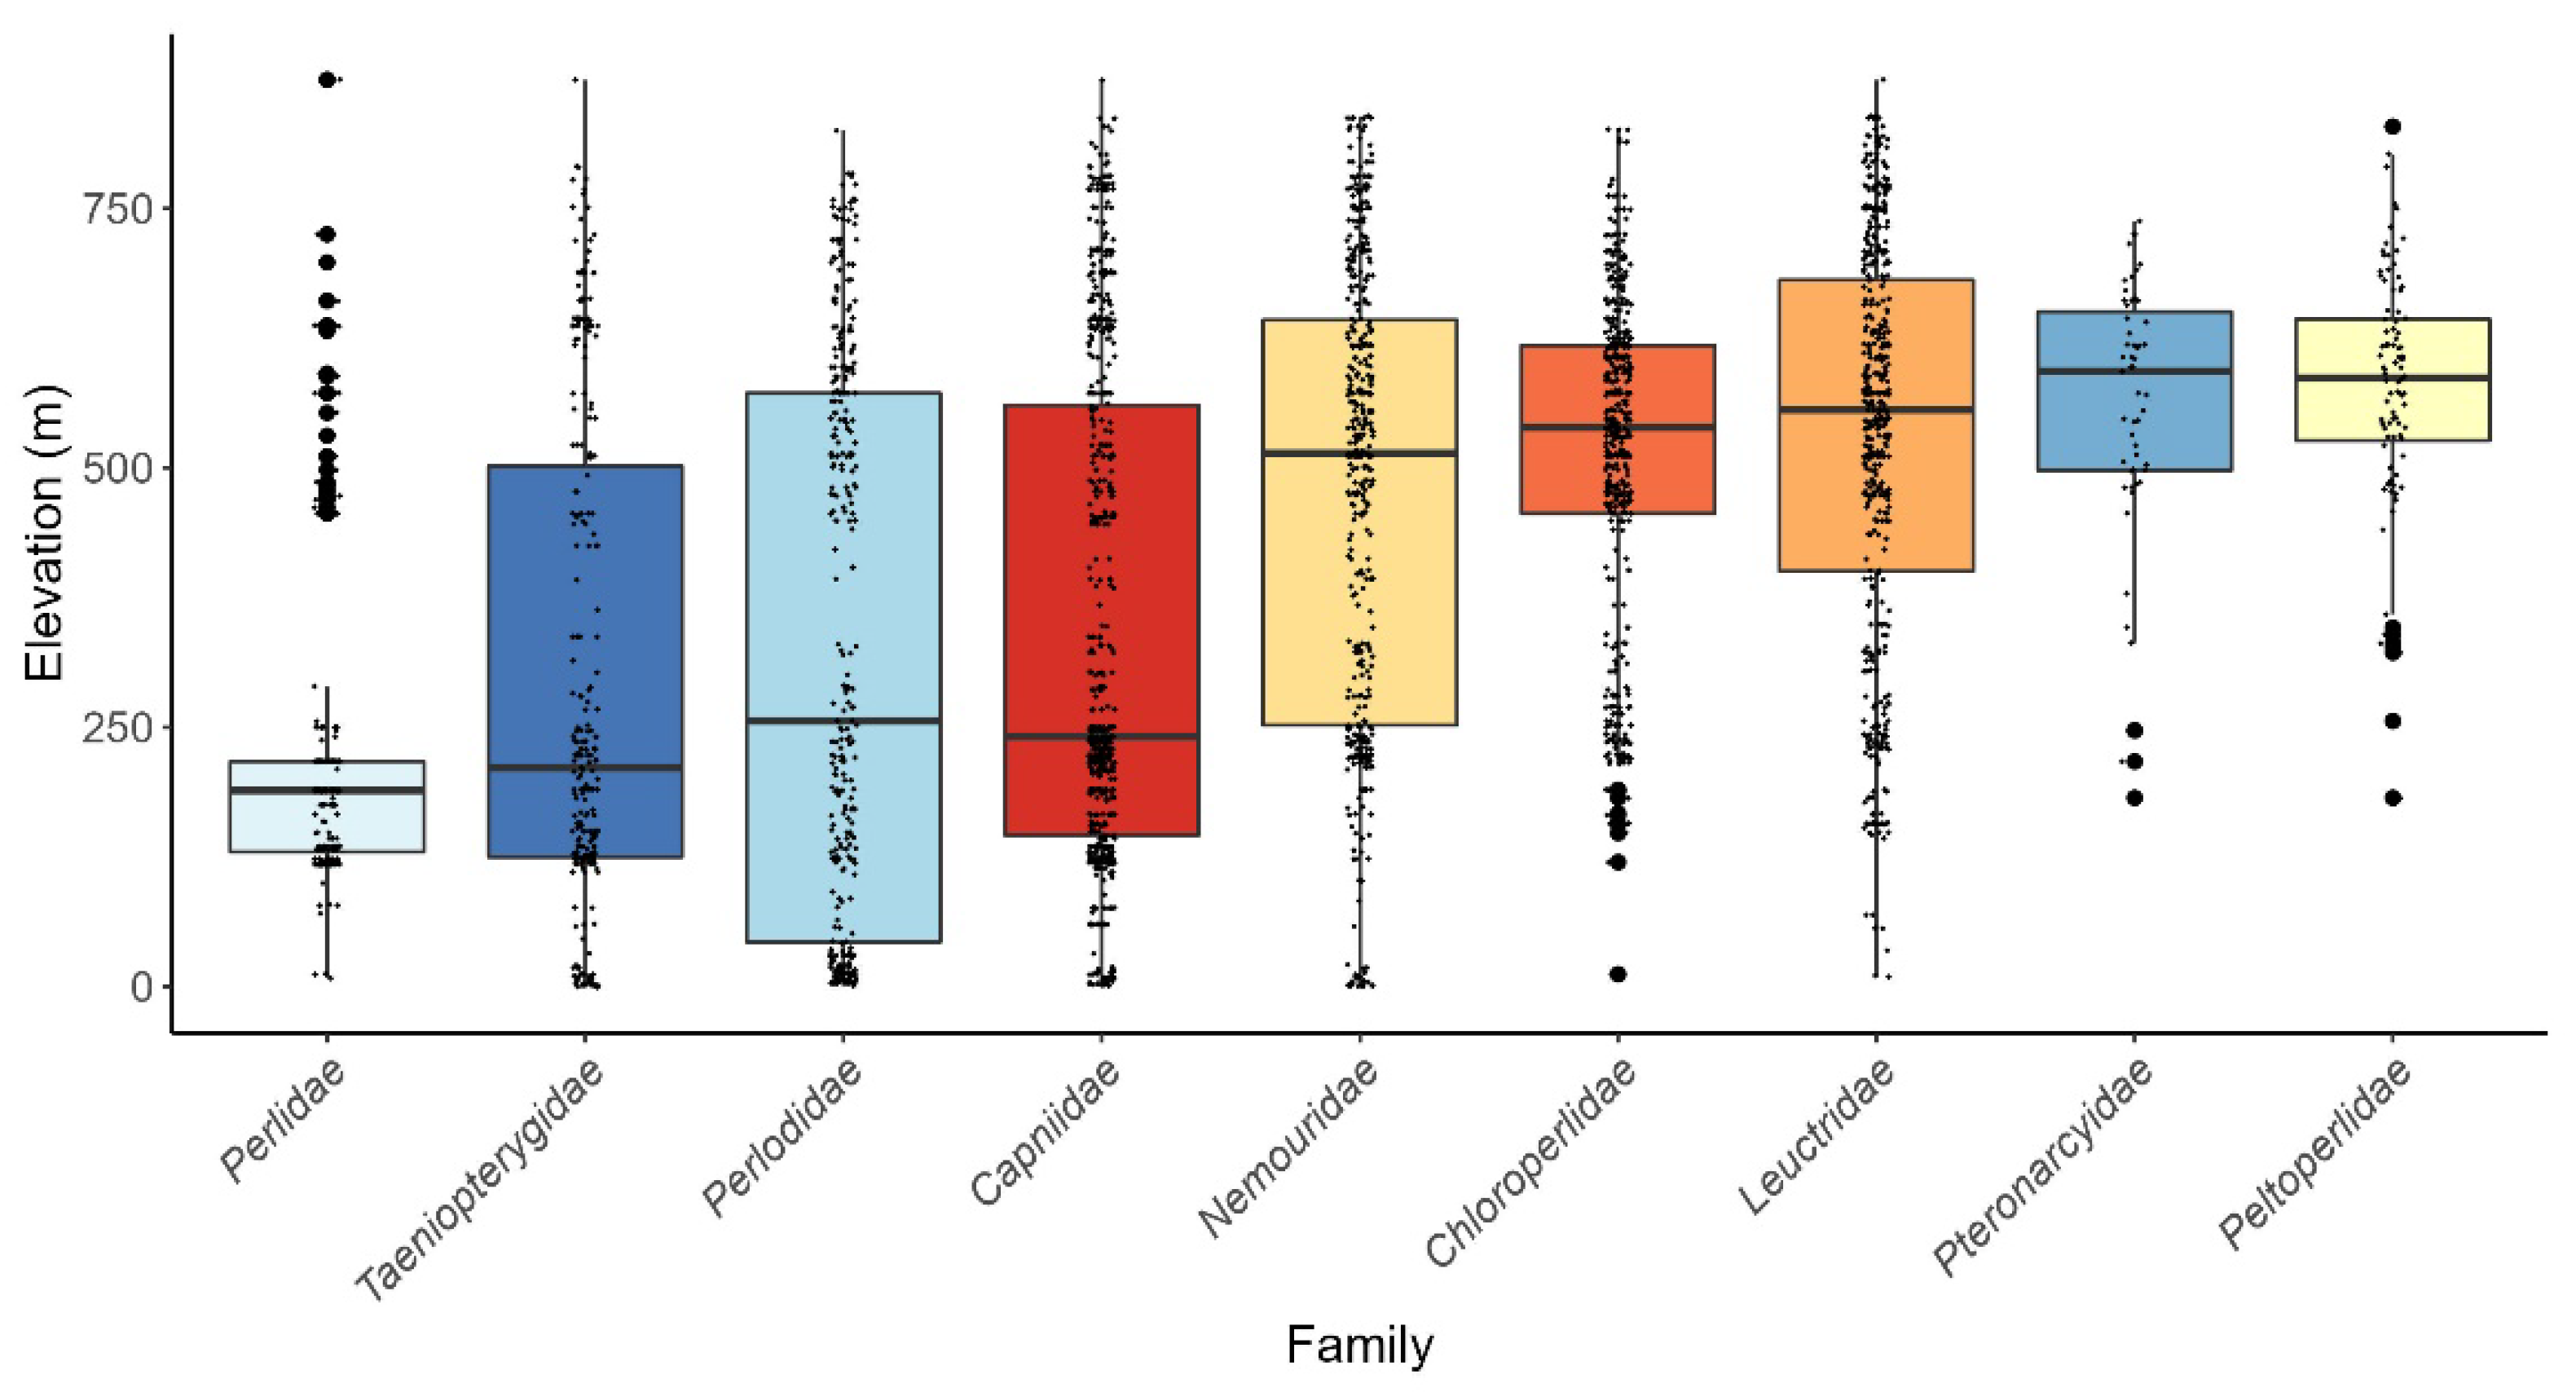
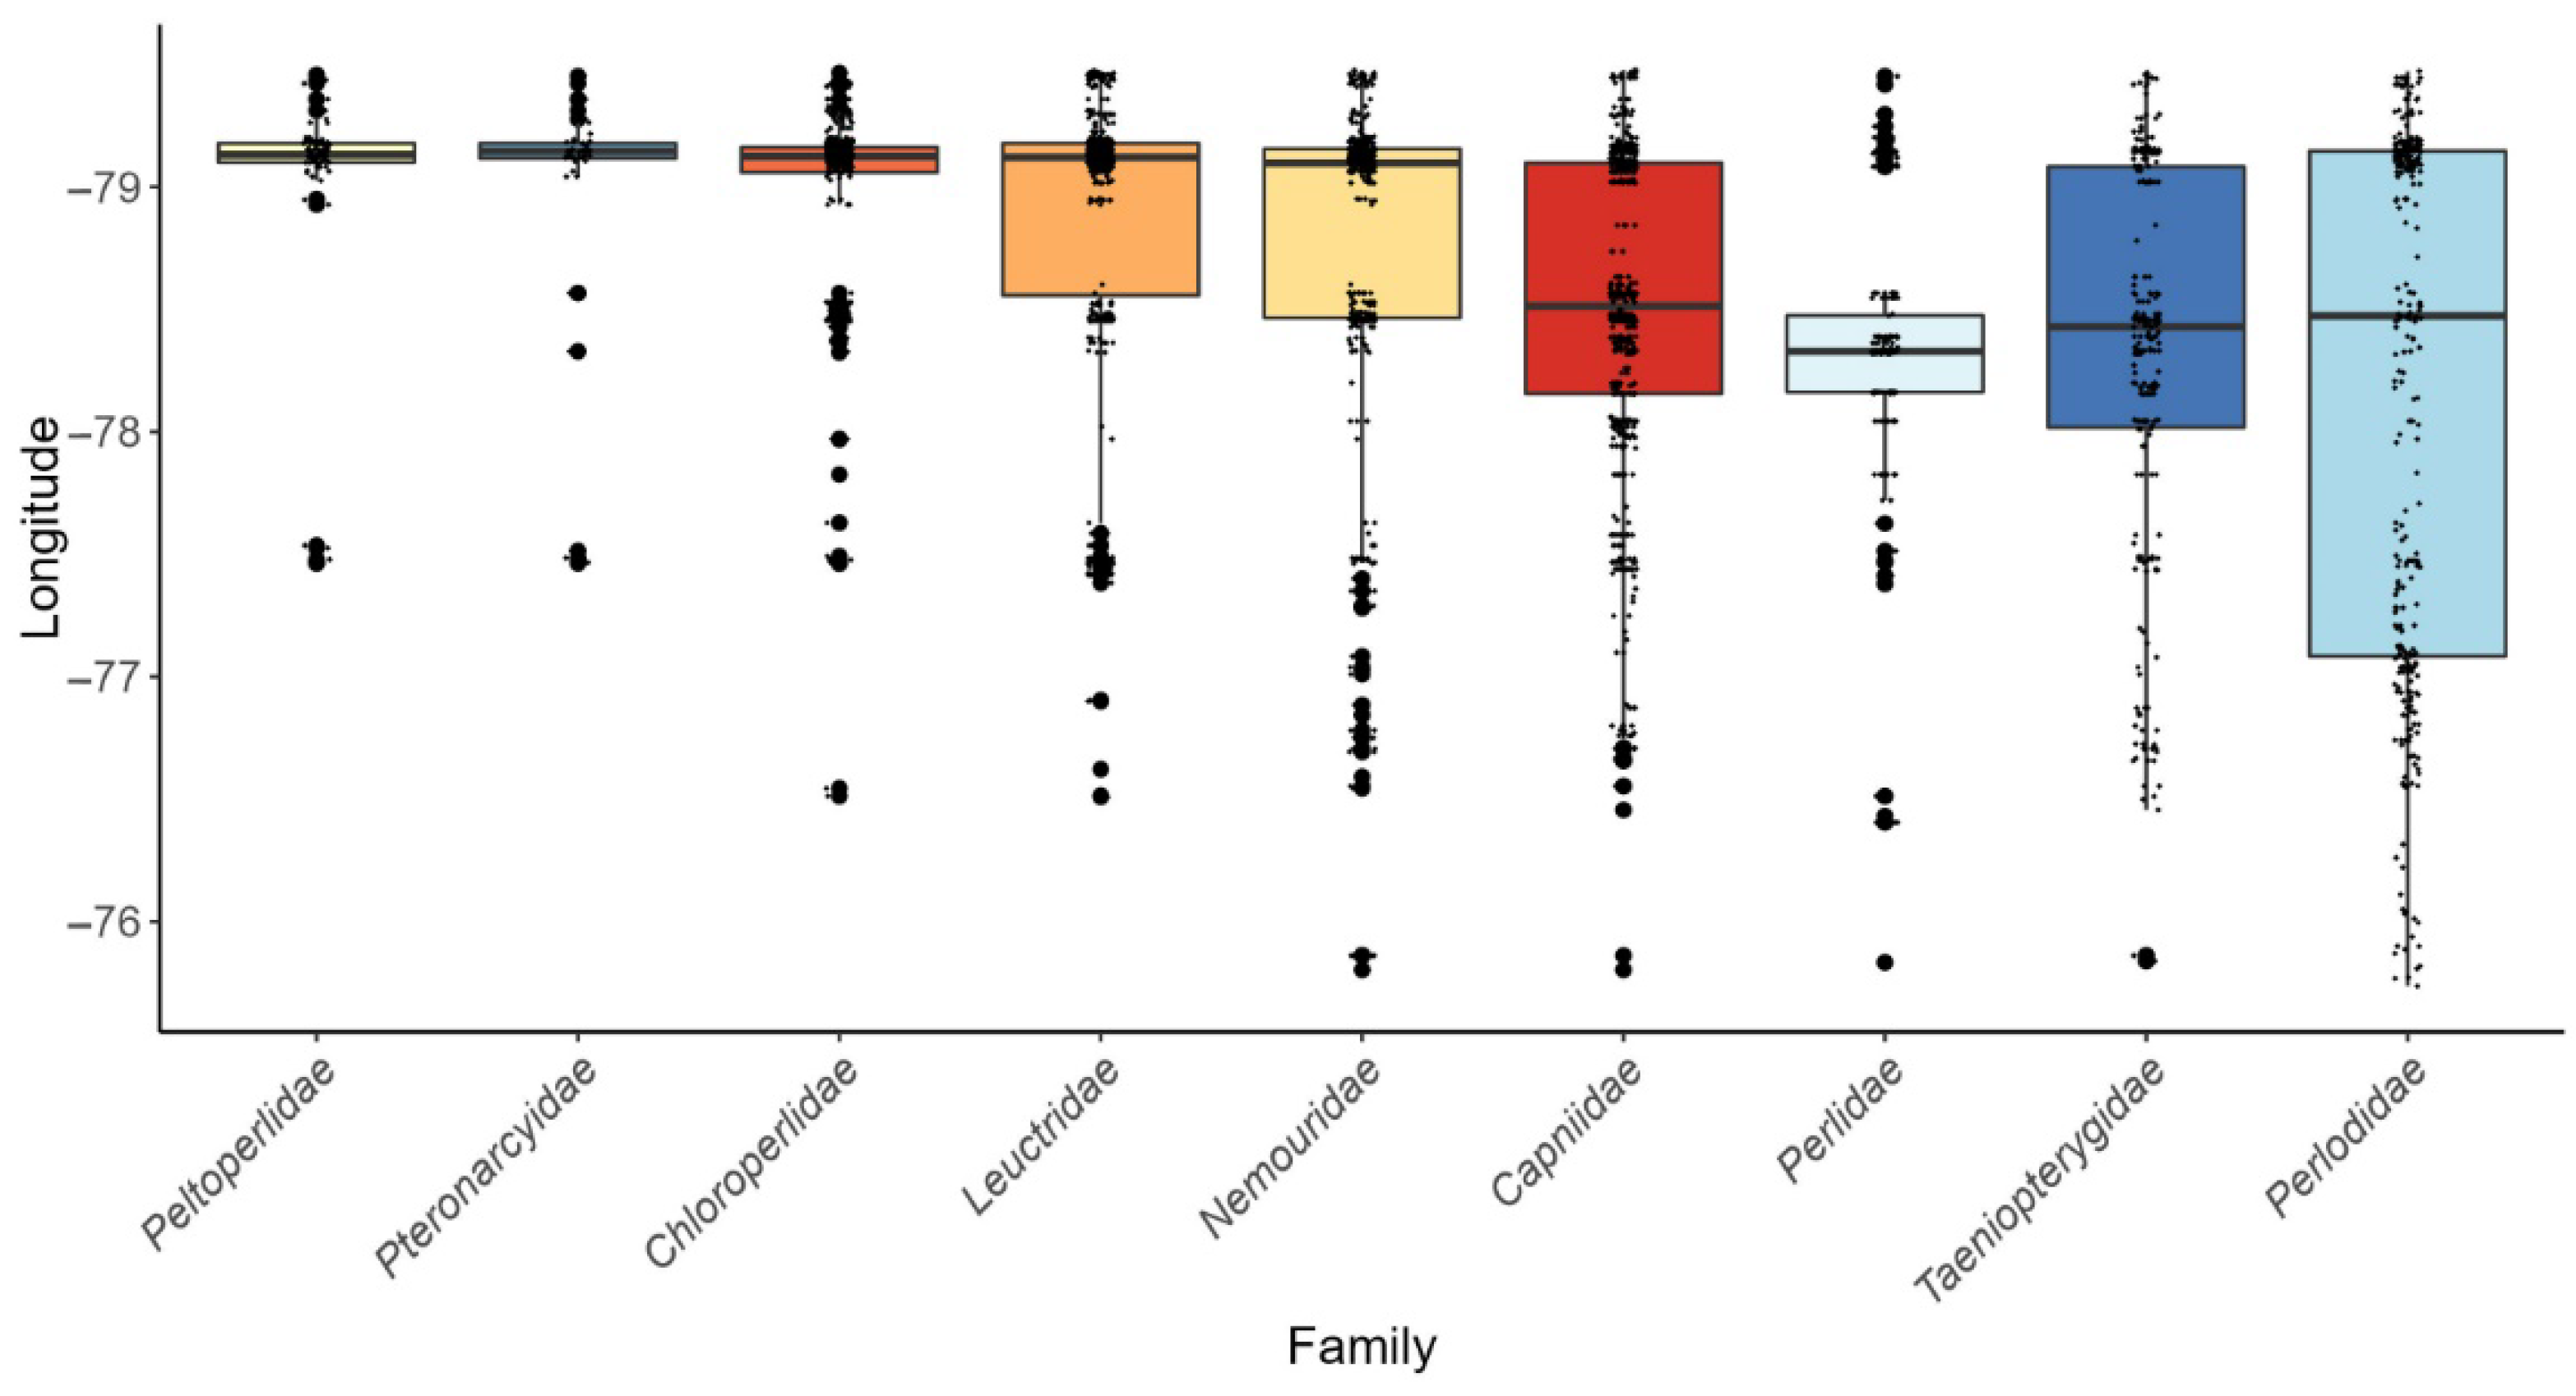
The mean elevation of families ranged from 233 m (Perlidae) to 585 m ASL (Peltoperlidae) (Figure 5). Peltoperlidae and Pteronarcyidae were also found in a restricted longitudinal span (−77.4 W to −79.5 W), primarily within the montane regions of the state where collections have been concentrated (Figure 6). Although the remaining families are found statewide, similar to the Peltoperlidae and Pteronarcyidae, the concentration of collections are in the montane region. The nemourid genus Shipsa Ricker, 1952, is known from the lowest elevations of all of the Maryland genera. Diploperla Needham and Claassen, 1925, and the monospecific genus Bolotoperla Ricker and Ross, 1975, were found at the highest mean elevation of the genera identified. Adult presence appears to be successional for each family, beginning in early winter with Capniidae and Taeniopterygidae, followed by the remaining families during late winter and spring (Table 3). The latest emerging family, Peltoperlidae, also had the shortest period of adult presence, from late May to mid-August. The most prolonged adult presence was for Leuctridae, with adult presence recorded in all seasons.
3.6.1. Capniidae
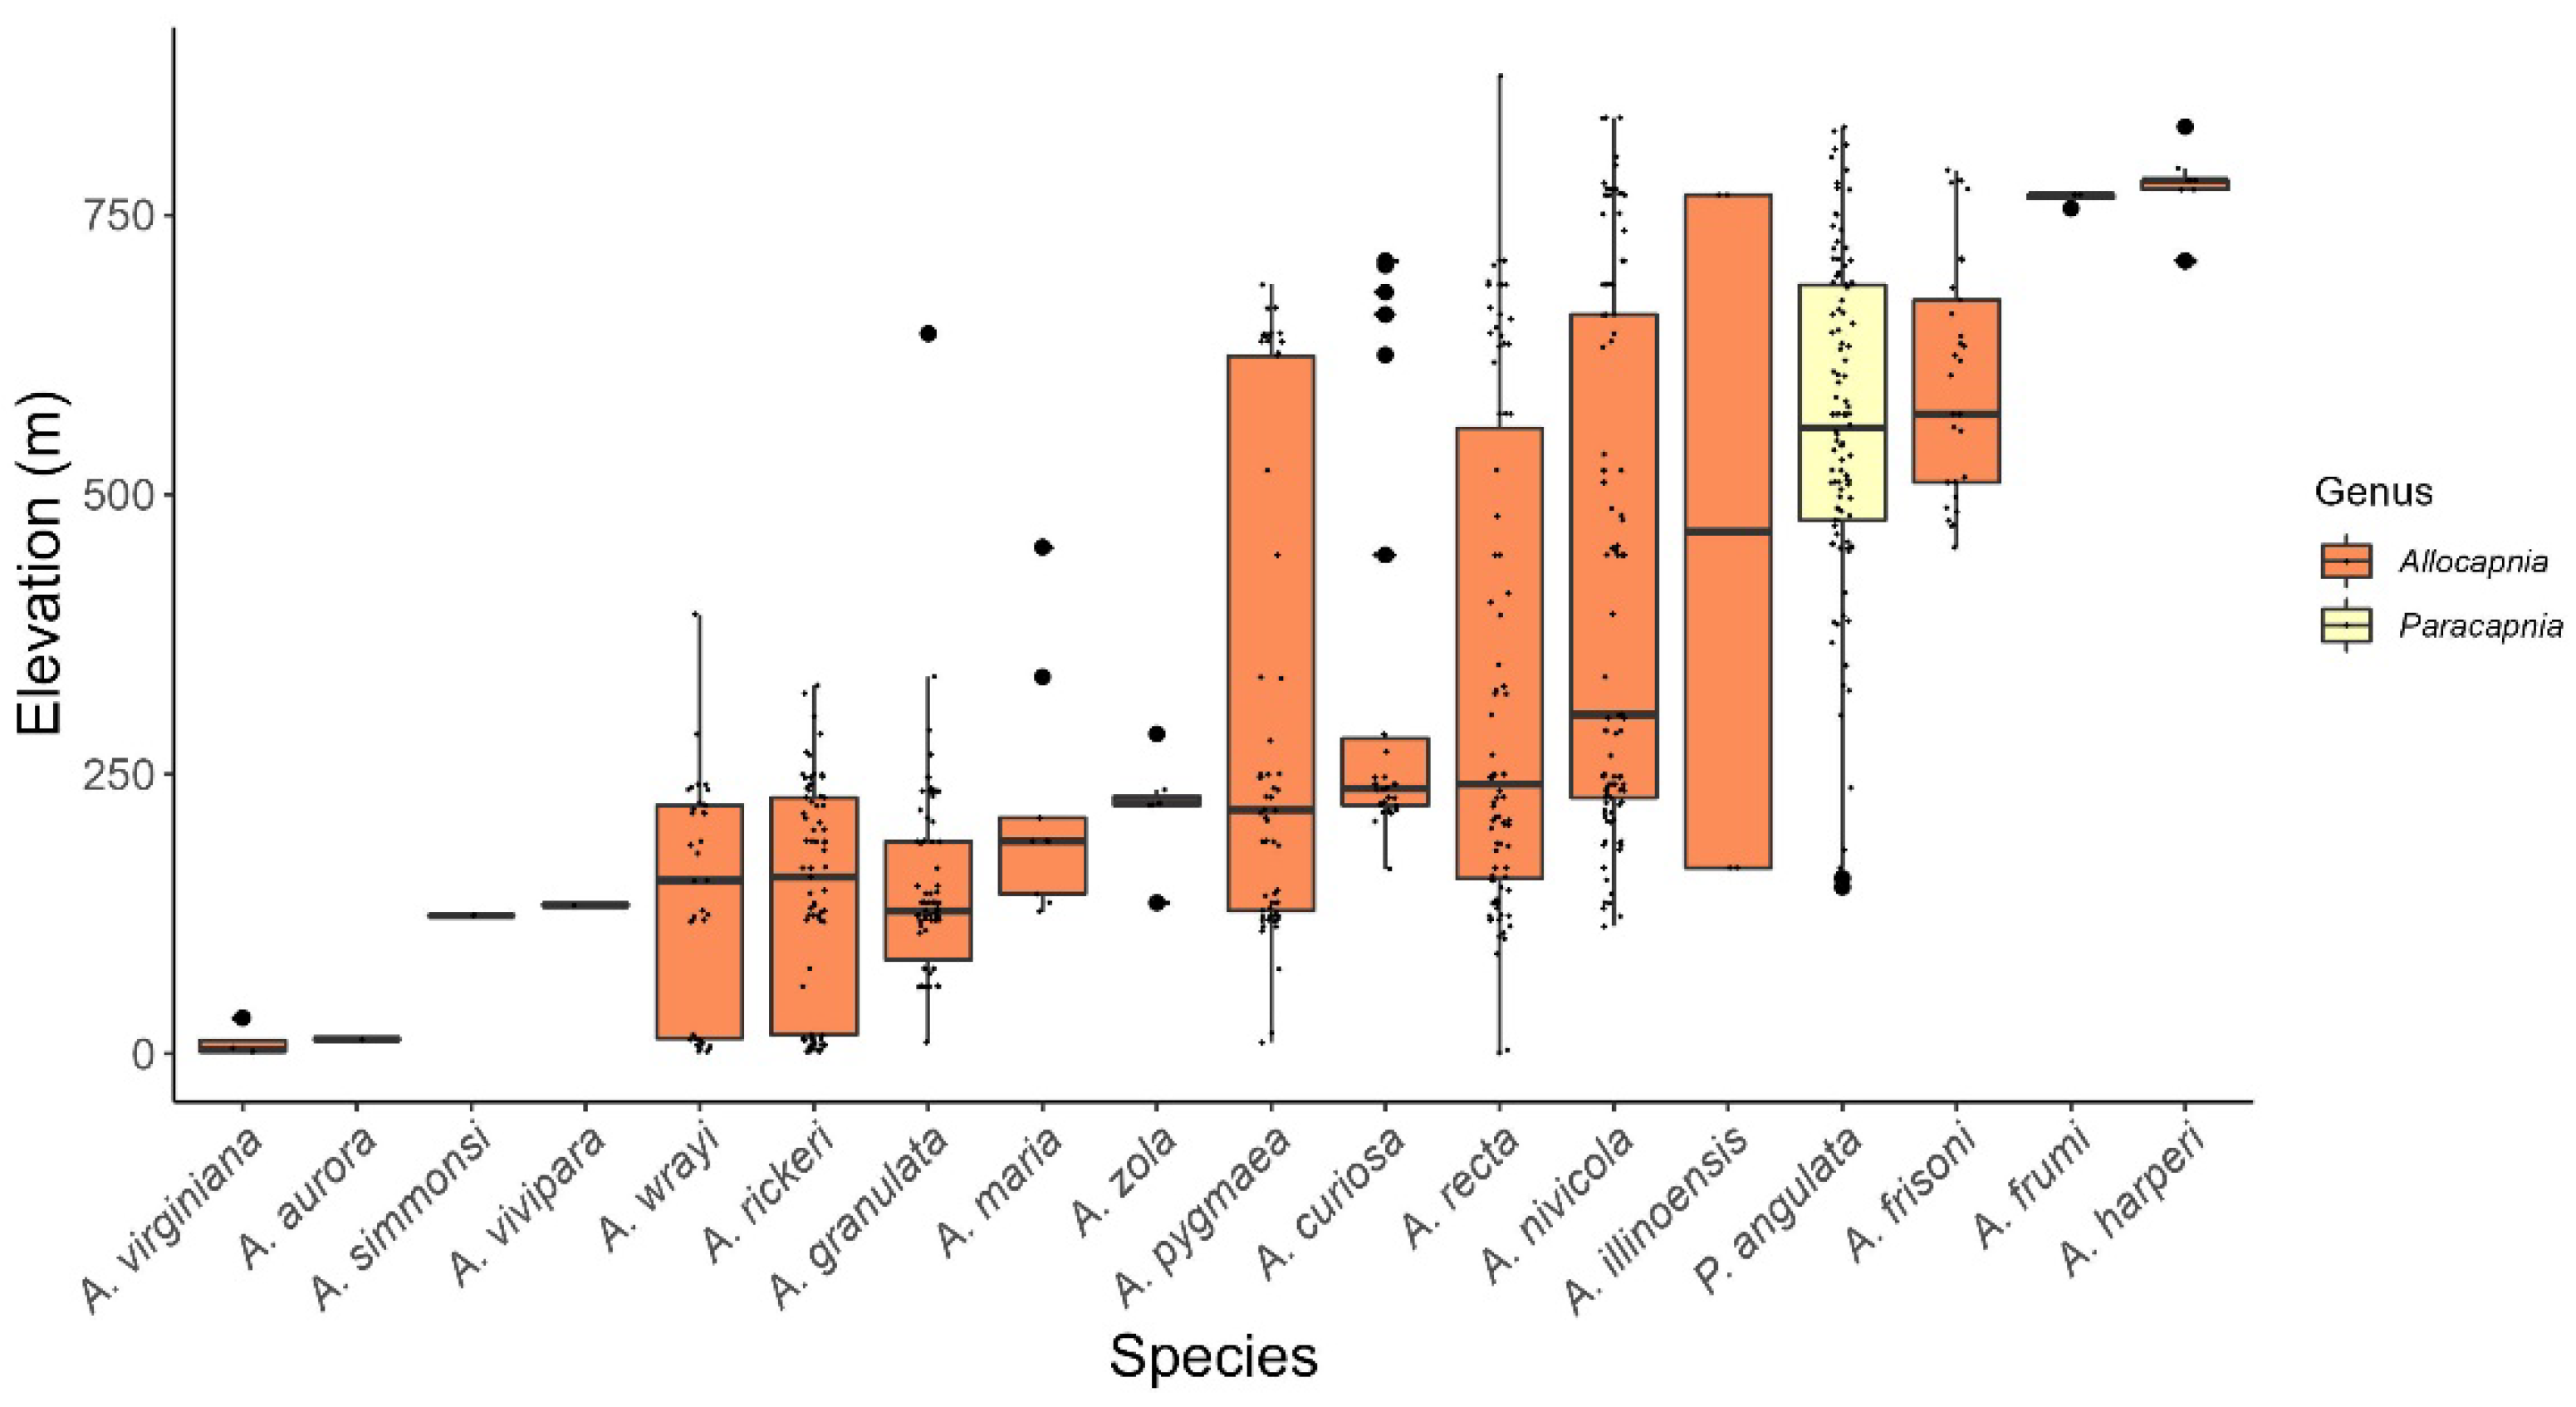
Two genera and eighteen species of capniids are recognized from Maryland. The known adult presence spans from late November through mid-May (Table 3). The longest adult presence is for Allocapnia nivicola (Fitch, 1847), recorded from late November until late April (Table 4). Overall, adult Capniidae have been recorded across the widest elevation range amongst the nine families reported from the state (1–874 m ASL) (Figure 7). Two species, A. frumi Kirchner, 1982, and A. harperi Kirchner, 1980, are restricted to higher-elevation streams in the state (Figure 7). Comparatively, A. virginiana is found at the lowest elevations (2–7 m ASL). Although our highest-elevation site is at 837 m, Frison [52] reported Capnia opis (Newman, 1839) from Keyser Ridge at 874 m. This, however, was prior to the description of Paracapnia Hanson, 1961, and the splitting of P. angulata Hanson, 1961, from P. opis (Newman, 1839). The specimens reported by Frison [52] are larvae and females, neither of which can be determined to species. Coincidentally, P. angulata was collected at an elevation of 829 m from a stream in western Garrett County.
3.6.2. Chloroperlidae
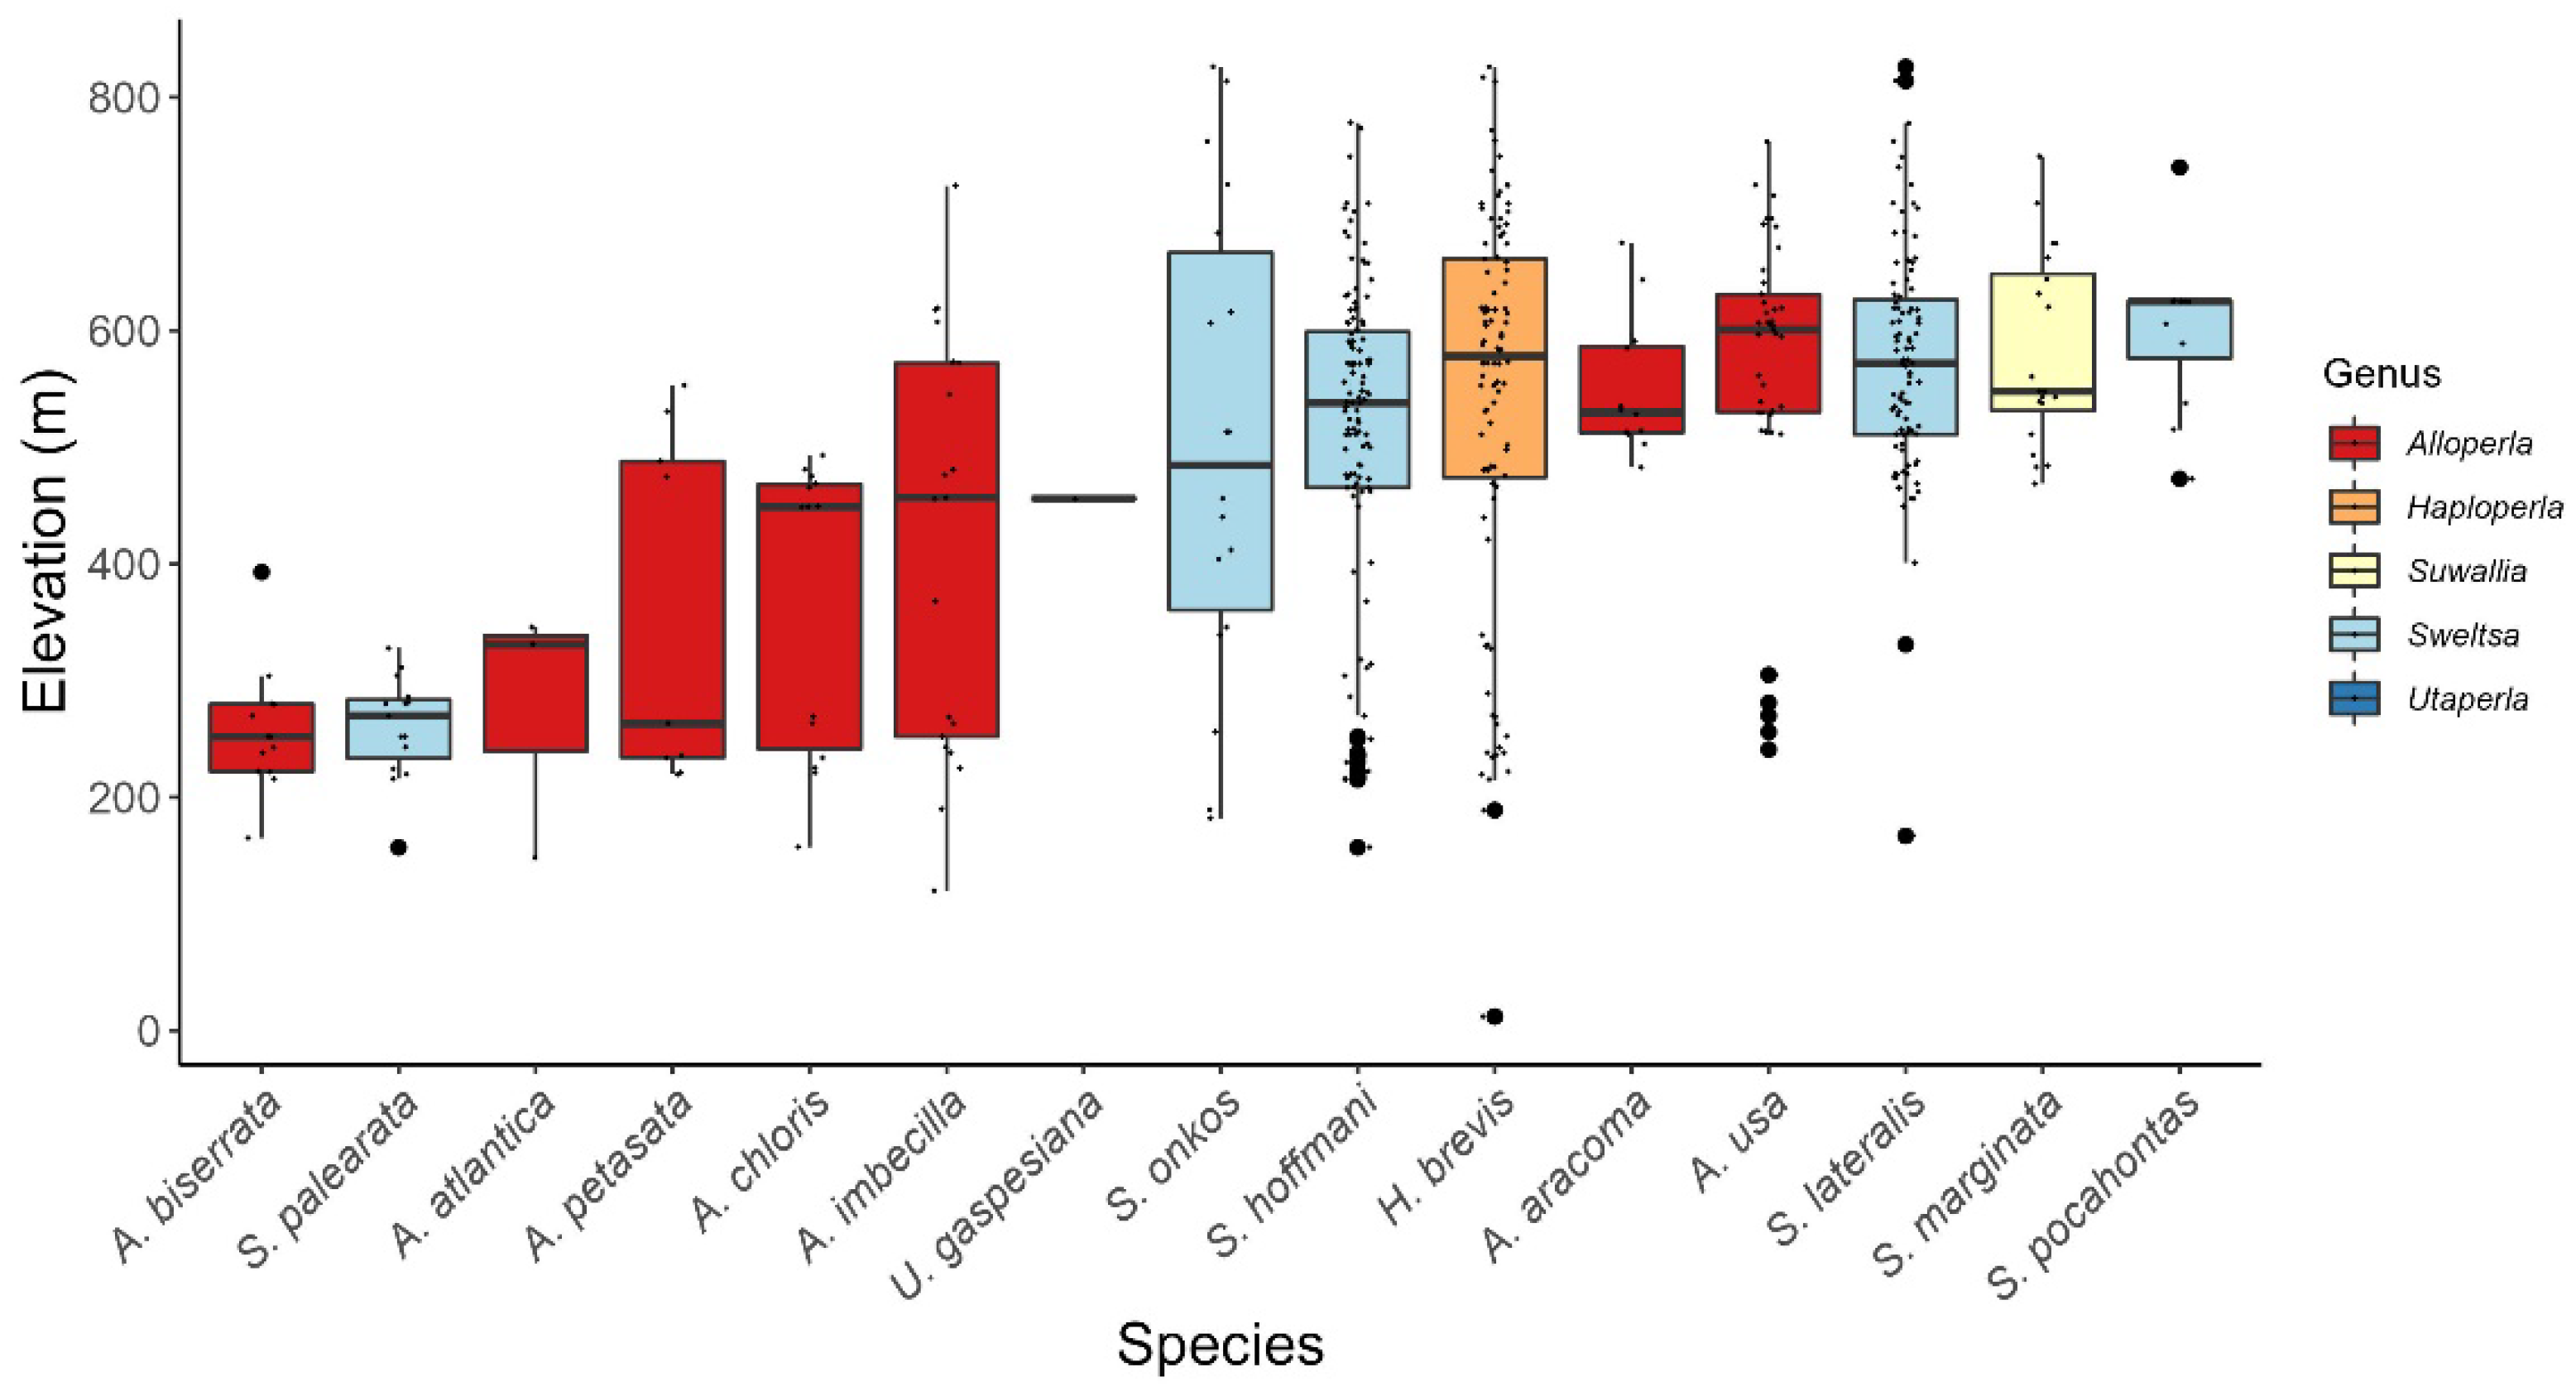
Fifteen species in five genera are now recorded from Maryland. This family encompasses 83% (n = 5/6) of Maryland’s stonefly SGCNs. Adult presence spans from mid-April to early August (Figure 8). Haploperla brevis (Banks, 1895) has the longest recorded adult presence, with collections from mid-April to early August (Table 5). Adults have been collected from a wide range of elevations (12–874 m ASL), with the broadest displayed by H. brevis (12–826 m ASL). Several species are more restricted in elevation range, with Alloperla biserrata Nelson and Kondratieff, 1980, and Swelsta palearata Surdick, 2004, found in lower-elevation (157–393 m ASL) headwater streams and springs of the Ridge and Valley ecoregion (Table 5). Comparatively, Suwalia marginata (Banks, 1897) and Sweltsa pocahontas Kirchner and Kondratieff, 1988, are found in higher-elevation (469–749 m ASL), medium-sized, high-gradient streams and high-elevation (473–740 m ASL) springs and spring-fed headwater streams, respectively.
3.6.3. Leuctridae
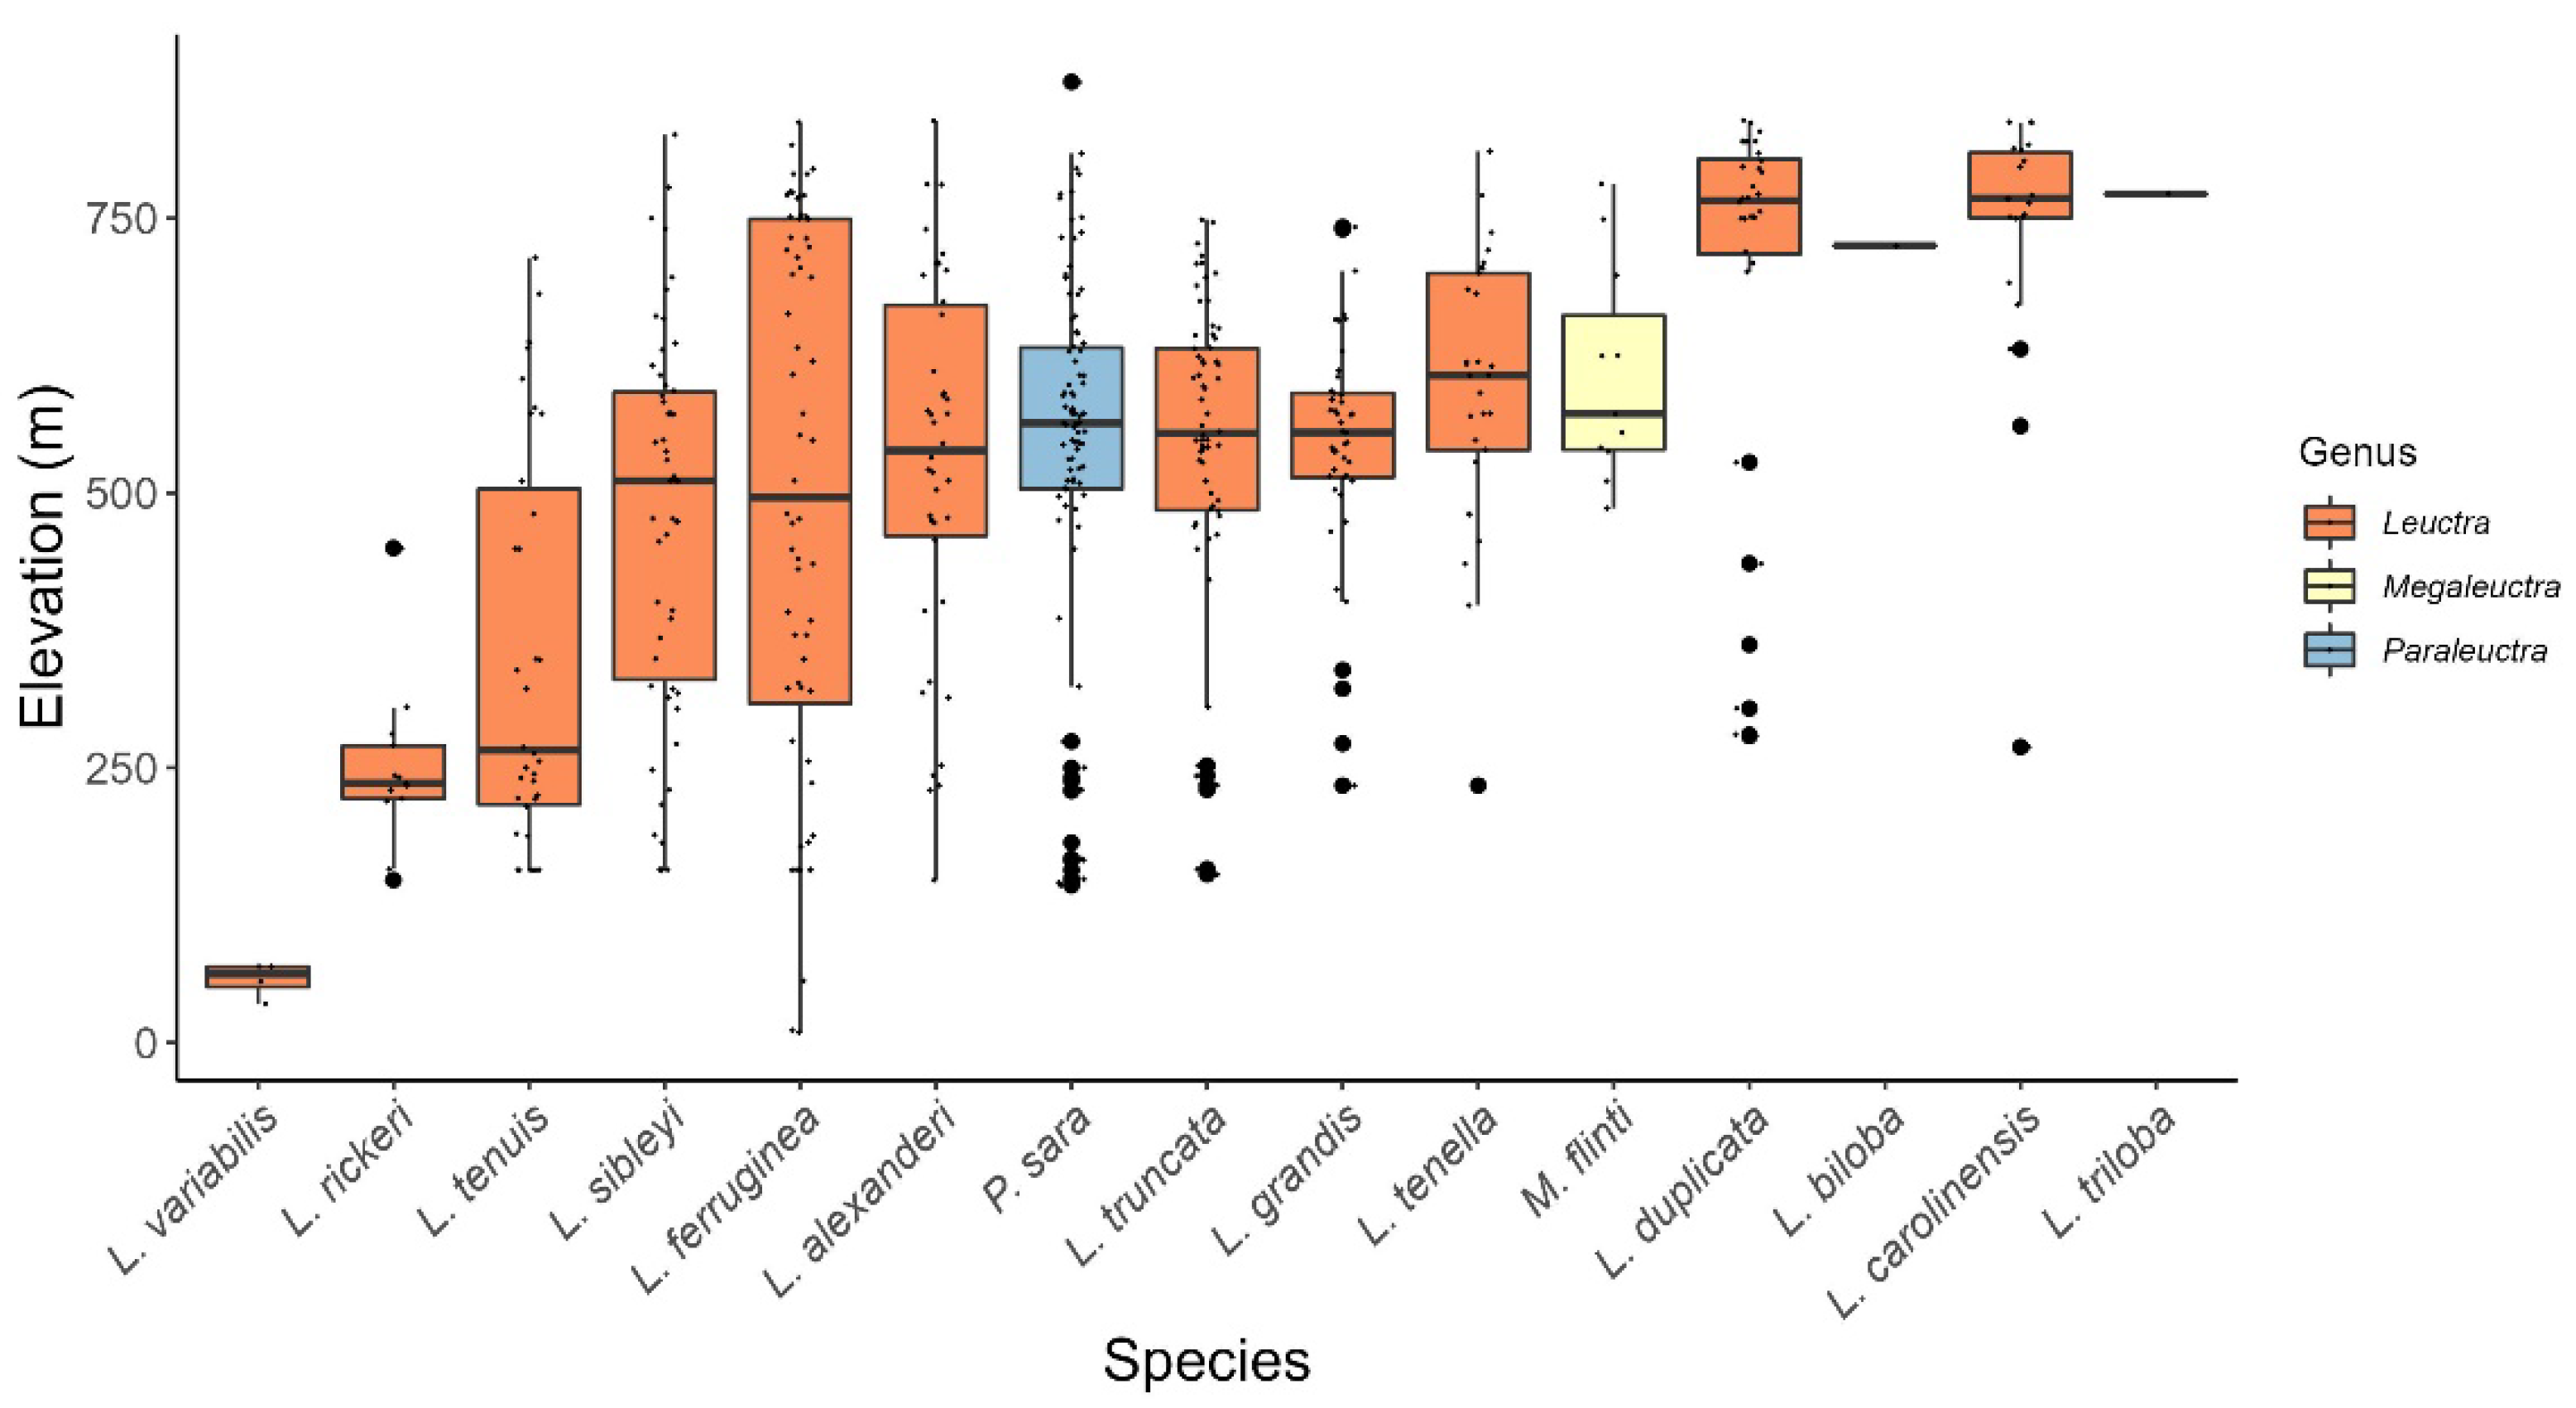
Three genera and thirteen species are represented in Maryland. The most speciose, Leuctra, contains 11 species. Within the region, two species represent the remaining two genera, Megaleuctra Neave, 1934, and Paraleuctra Hanson, 1941. Collections of adults overall are recorded from a wide range of elevations (9–874 m ASL). One species, Leuctra. variabilis Hanson, 1941, is known only from bog habitats [53] in the Southeastern Plains ecoregion and is found at the lowest elevations for the family within the state (35–69 m ASL). The broadest elevation range (9–837 m ASL) is exhibited by L. ferruginea (Walker, 1852), which also has the longest adult presence, from early March to early October (Table 6). Leuctra carolinensis Claassen, 1923, L. duplicata Claassen, 1923, L. rickeri James, 1976, and L. tenella Provancher, 1878, have been observed from narrower elevation spans. Of the four, L. rickeri is found in lower-elevation (148–450) streams in the Ridge and Valley ecoregion (Figure 9). The remaining three are collected from higher elevations, ranging from 234 to 839 m ASL. The species in the remaining two genera, Megaleuctra flinti Baumann, 1973, and Paraleuctra sara (Claassen, 1937), are found in the Ridge and Valley and Central Appalachian ecoregions.
3.6.4. Nemouridae
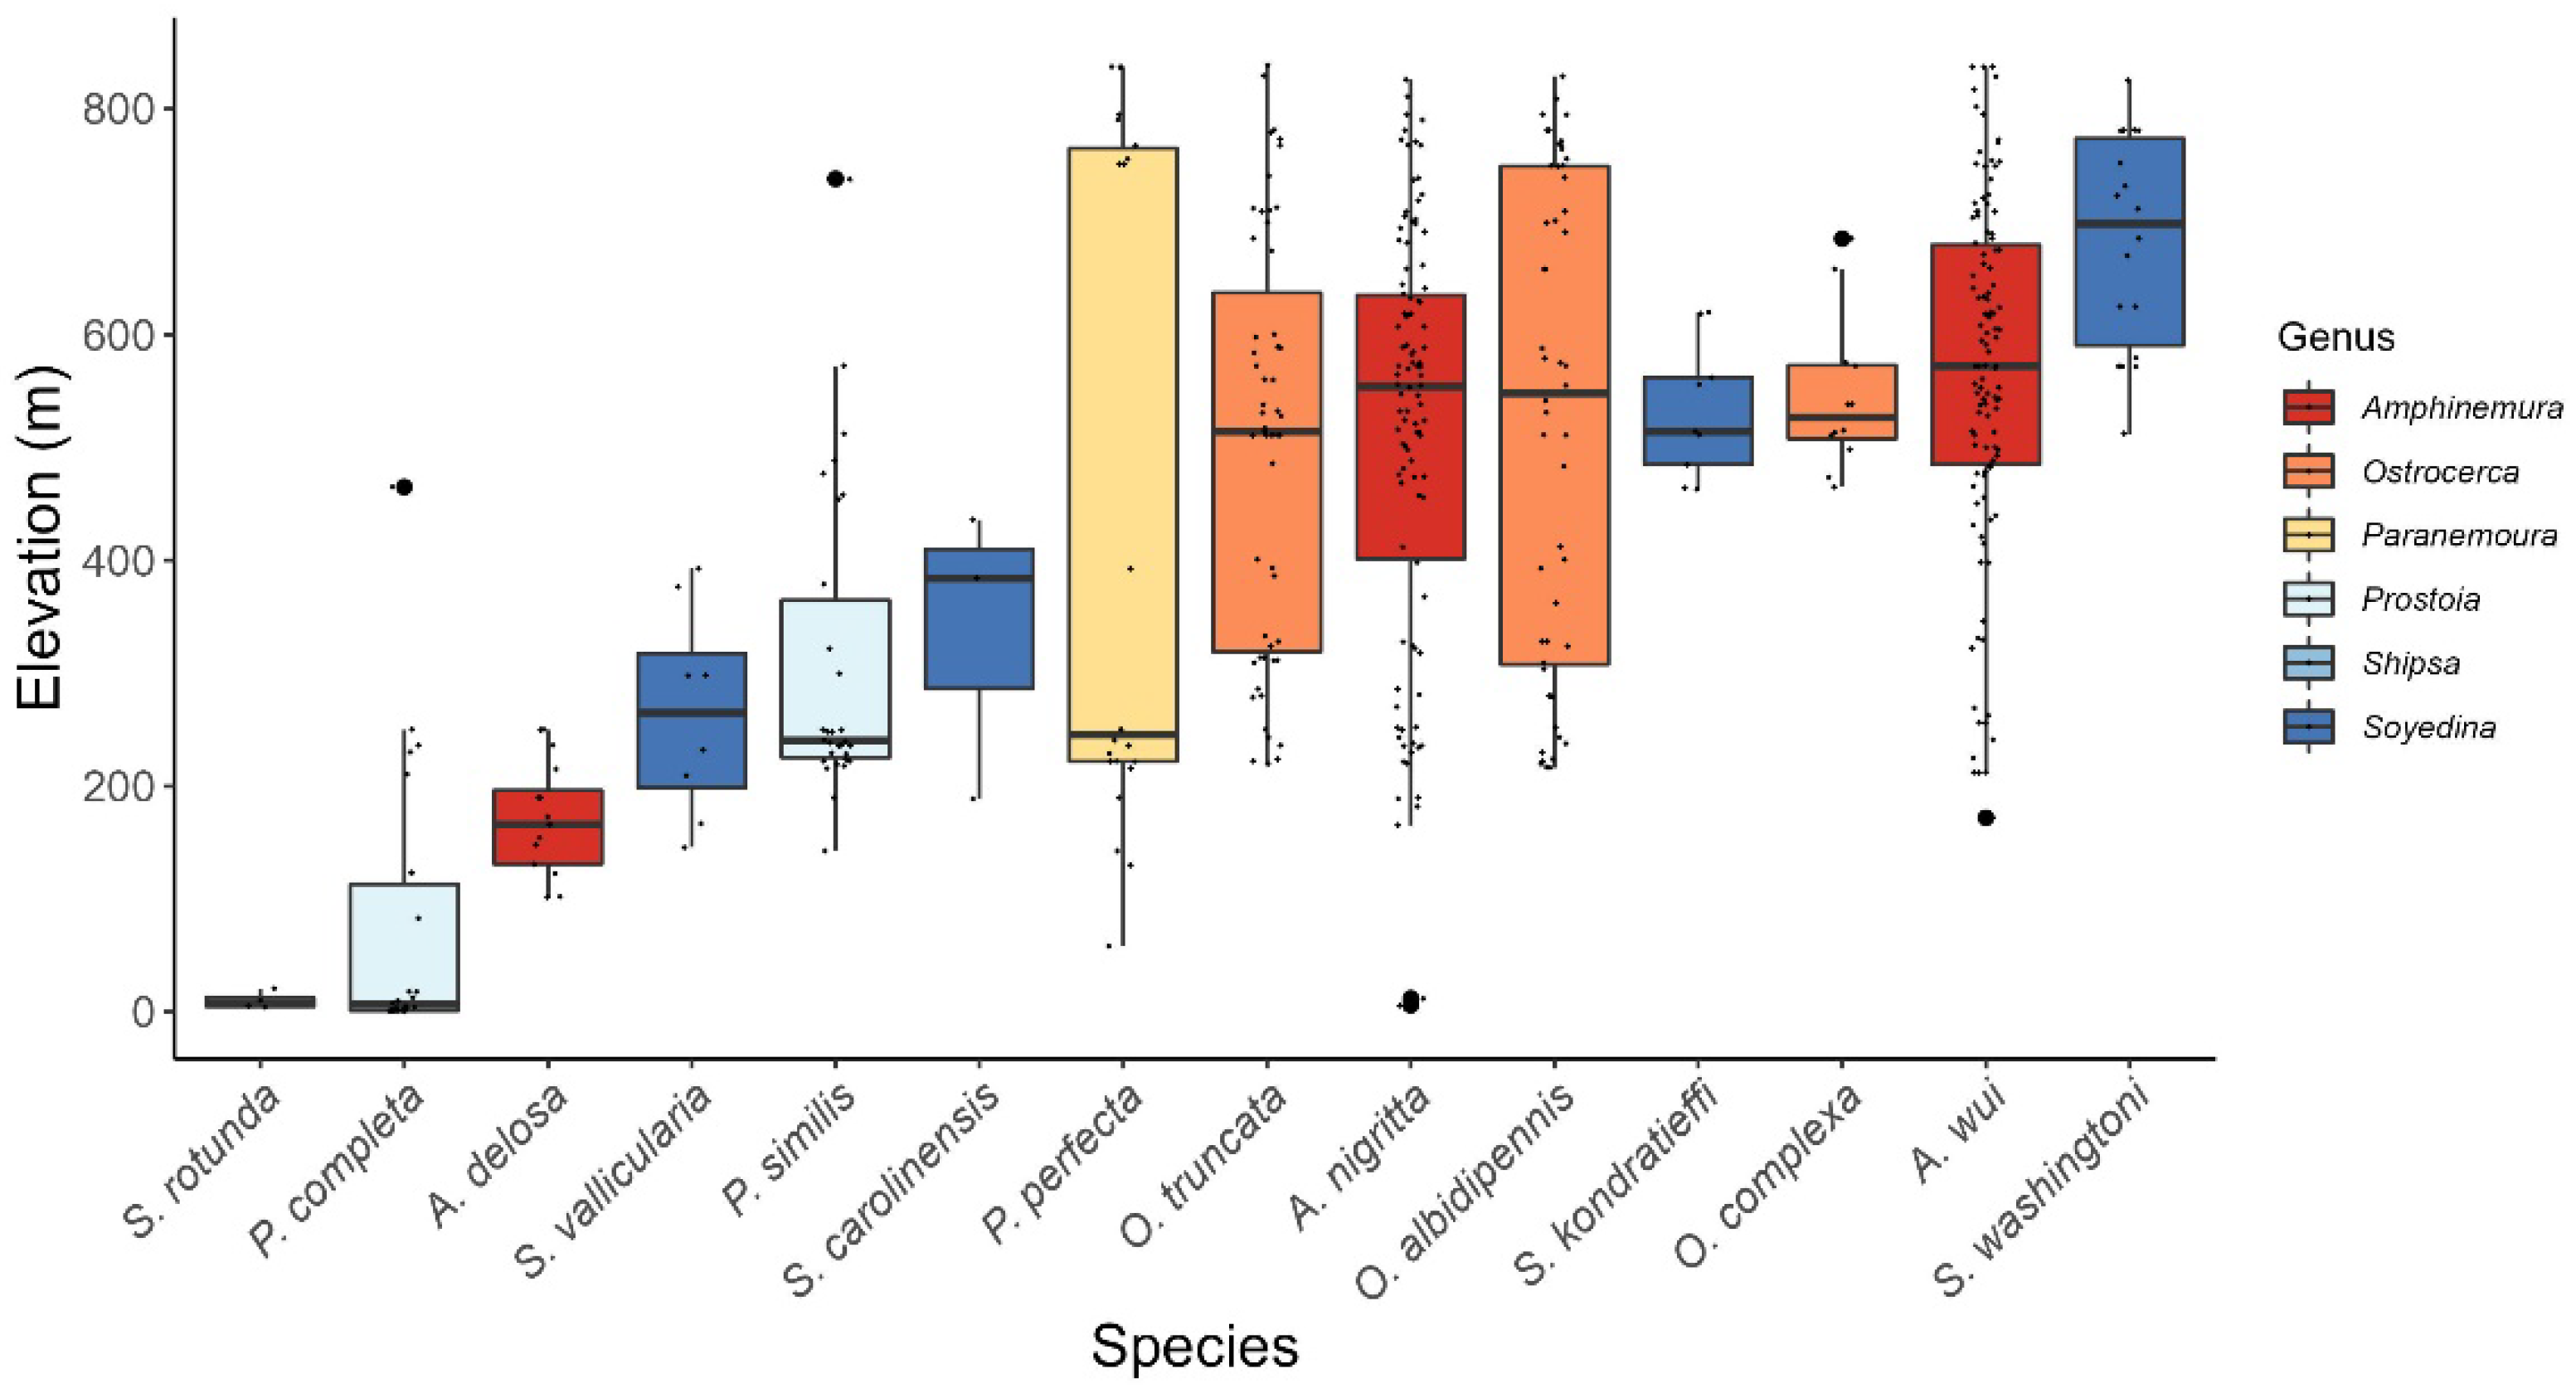
Six genera with fourteen species are currently recorded from a broad range of habitats and elevations (1–839 m ASL). Adult presence ranges from late February to early September (Table 7). Two species, S. rotunda and Prostoia completa (Walker, 1852), are known from low-elevation streams from the Northern Piedmont east to the Middle Atlantic Coastal Plain. Soyedina kondratieffi Baumann and Grubbs, 1996, and Ostrocerca complexa (Claassen, 1937) have the most restricted range within the state, known from springs and headwater streams in the Savage River drainage basin. Both species have a similar elevation range (463–685 m ASL) (Figure 10). The remainder of species in this family are known from a broader range of elevations and distributions. For example, Amphinemura wui (Claassen, 1936) adults are recorded from early March extending to early September within the Appalachian counties.
3.6.5. Peltoperlidae
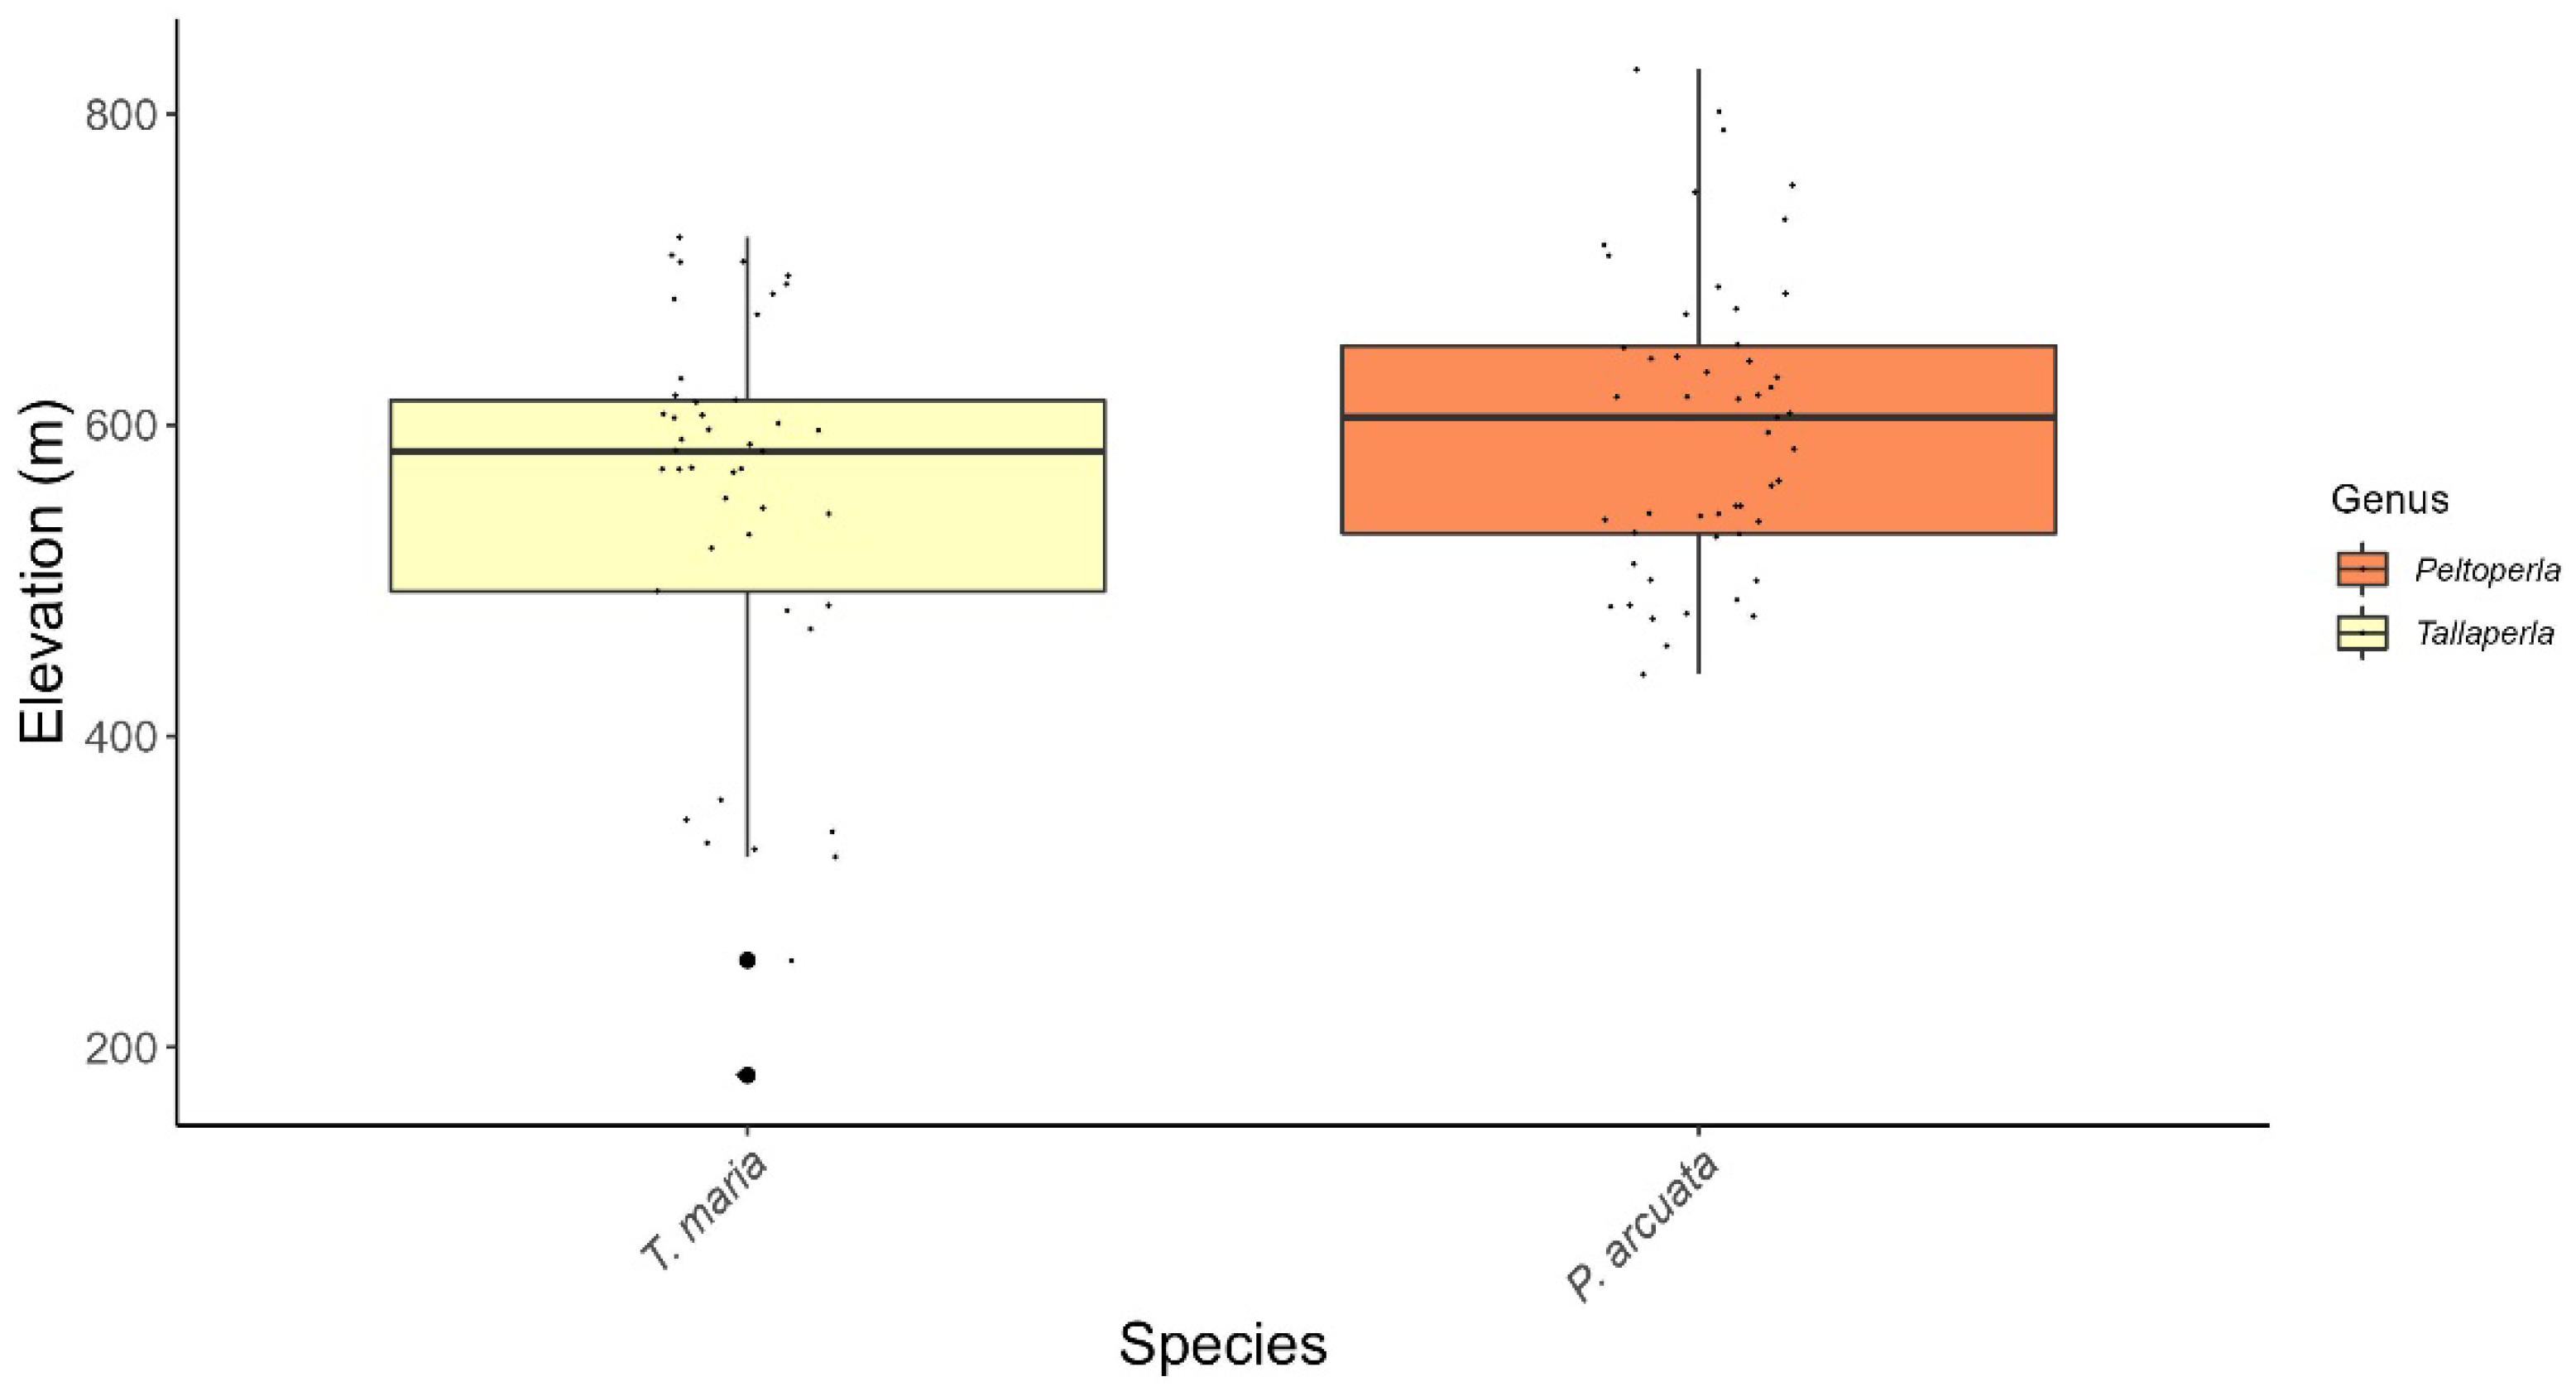
Three species in two genera have been recorded from Maryland. Peltoperla arcuata Needham, 1905, and T. maria are commonly collected in small to medium, rocky bottom streams within the four westernmost counties. Collections of both species are restricted to elevations above 182 m ASL (Figure 11). Collections of T. maria range from late May to late June, whereas collections of P. arcuata range from mid-June to mid-August (Table 8). Discussion of T. elisa can be found under “Anticipated Faunal Deletions”.
3.6.6. Perlidae
Perlidae is the most diverse family in Maryland, comprising 25 species in 9 genera. The most commonly recorded genus, Acroneuria Pictet, 1841, composes 45% of all perlid collection records. The second most collected genus, Perlesta, accounts for 26% of records. This family has been recorded from a wide range of elevations (4–874 m ASL), yet the majority of species are known from streams 250 m ASL or lower (Figure 12). Only 6 of the 25 species have been collected above this elevation. The broadest range of elevations recorded for a single species is P. nelsoni Stark, 1989 (79–637 m ASL). Paragnetina media (Walker, 1852) has the longest recorded adult presence, spanning from late June to early September. Adult collections have largely occurred during the summer months, but overall adult presence spans from mid-April through mid-September (Table 9).
3.6.7. Perlodidae
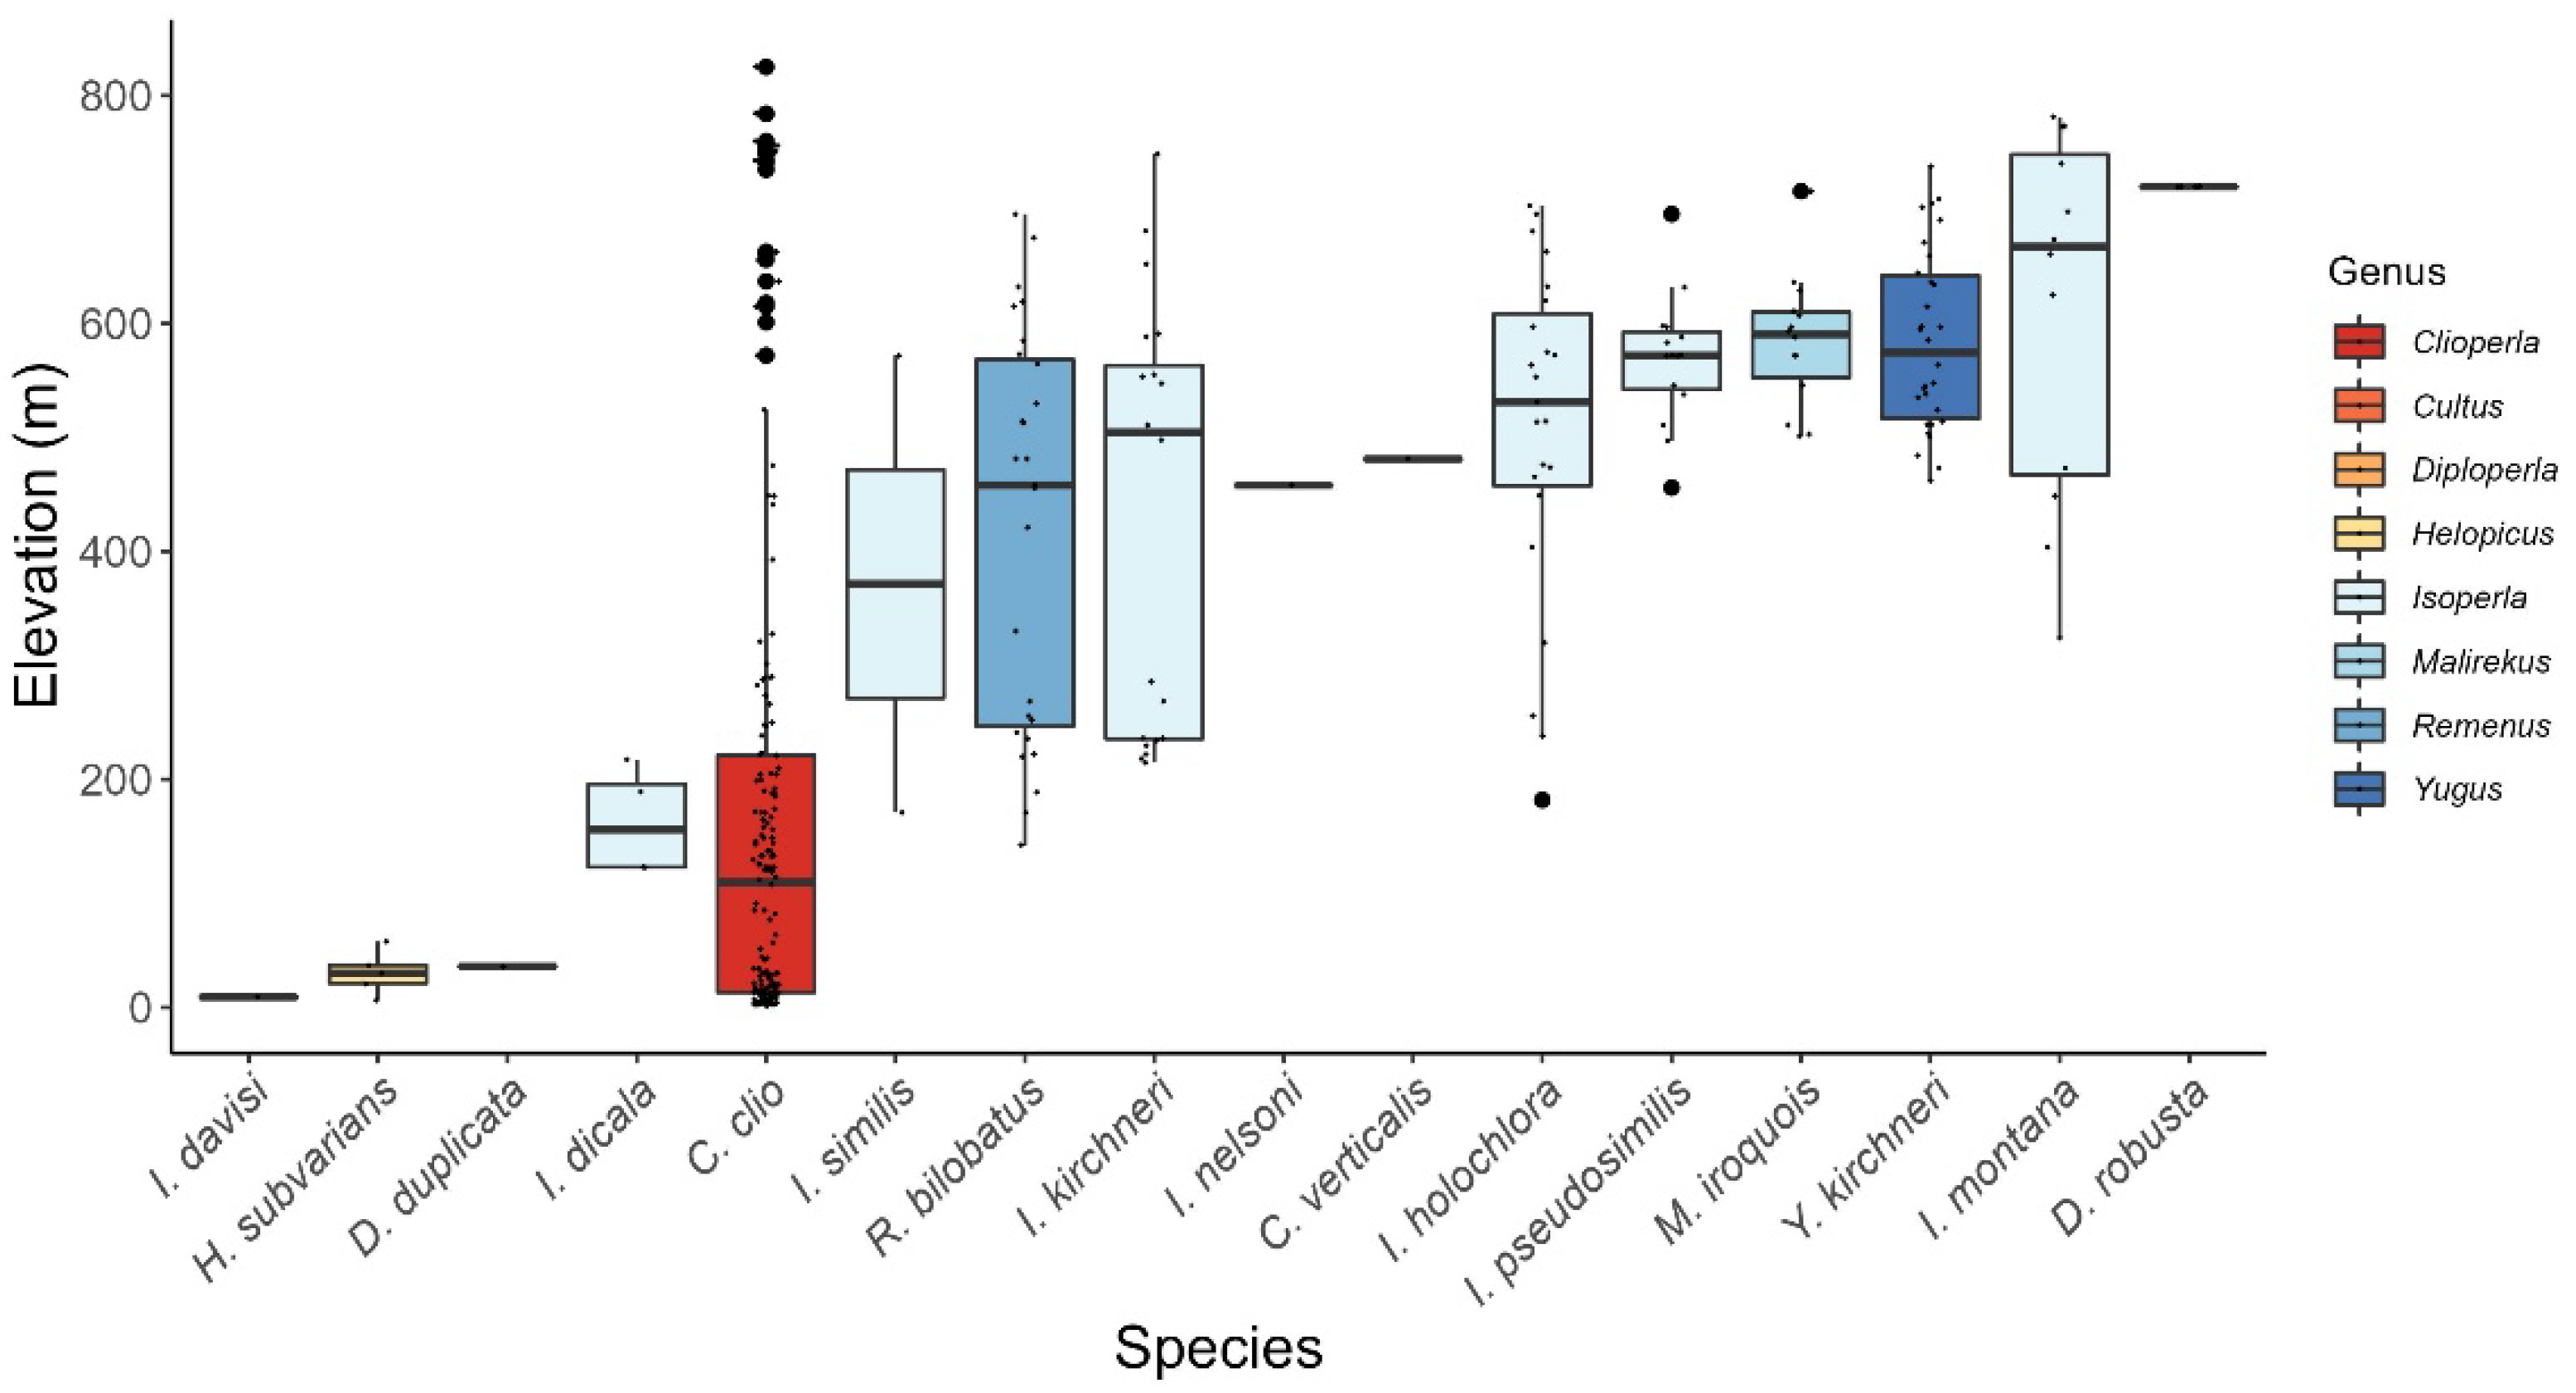
The Perlodidae are known from a diverse assemblage in Maryland, with 19 species from 9 genera. Collections of adult perlodids are recorded from a broad range of elevations (1–874 m ASL) and from late winter through late summer. The most commonly collected was Clioperla clio (Newman, 1839), a widespread and commonly collected eastern Nearctic species (Figure 13). Three species, Diploperla duplicata (Banks, 1920), H. subvarians, and I. davisi, have been recorded only in low-elevation streams (1–60 m ASL). The longest adult presence has been recorded from early March to late June for C. clio (Table 10). Adult presence for multiple species is known from only a brief period, likely a result of low sampling effort targeting each individual species. For example, Diploperla robusta Stark and Gaufin, 1974, Cultus verticalis (Banks, 1920), and I. davisi have only been recorded from single collection events. With the exception of C. clio and I. davisi, few perlodid collections are recorded east of the Piedmont ecoregion, with collections largely found in Garrett and Allegany counties that are reflective of sampling bias.
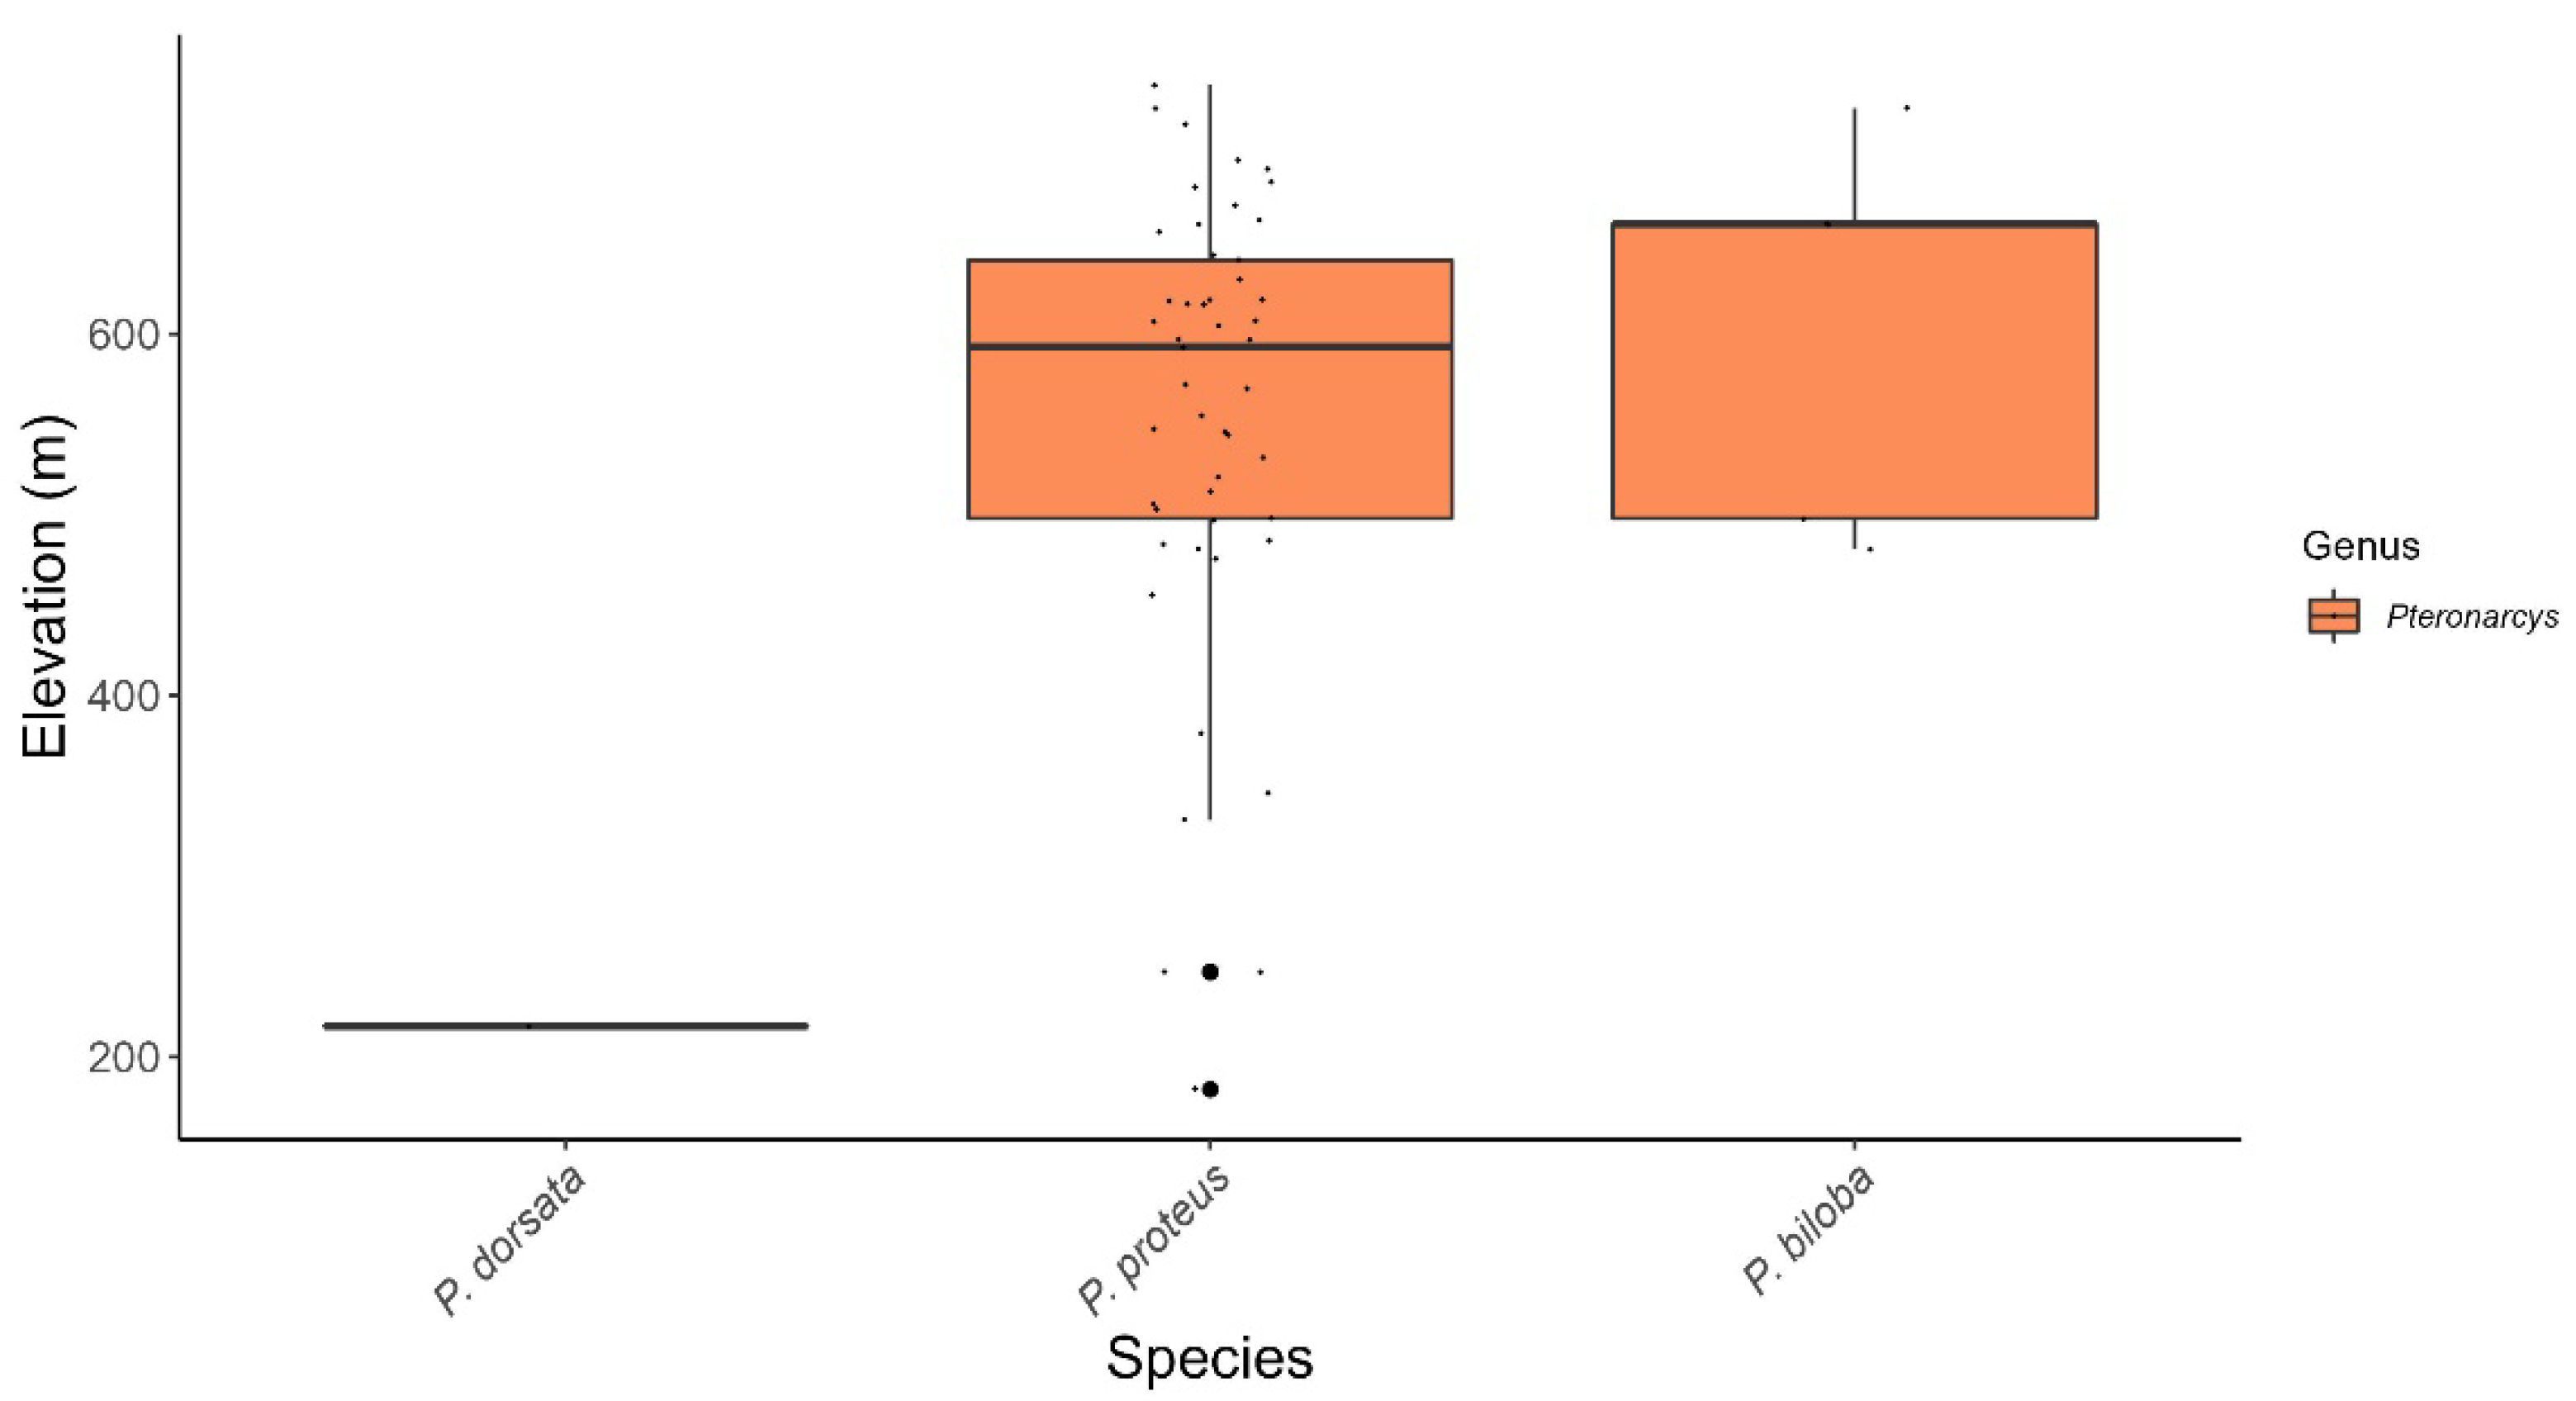
3.6.8. Pteronarcyidae
Although uncommonly collected as adults, three species are known from Maryland and have been collected from moderate- to high-elevation streams (182–725 m ASL) (Figure 14). Pteronarcys biloba Newman, 1838, and P. dorsata (Say, 1823) are presently known only from Garrett Co. and Washington Co., respectively, and both species have been collected as adults only in early June (Table 11). The more common species, P. proteus Newman, 1838, has been collected from early May to early July from the Northern Piedmont west to the central Appalachian ecoregions.
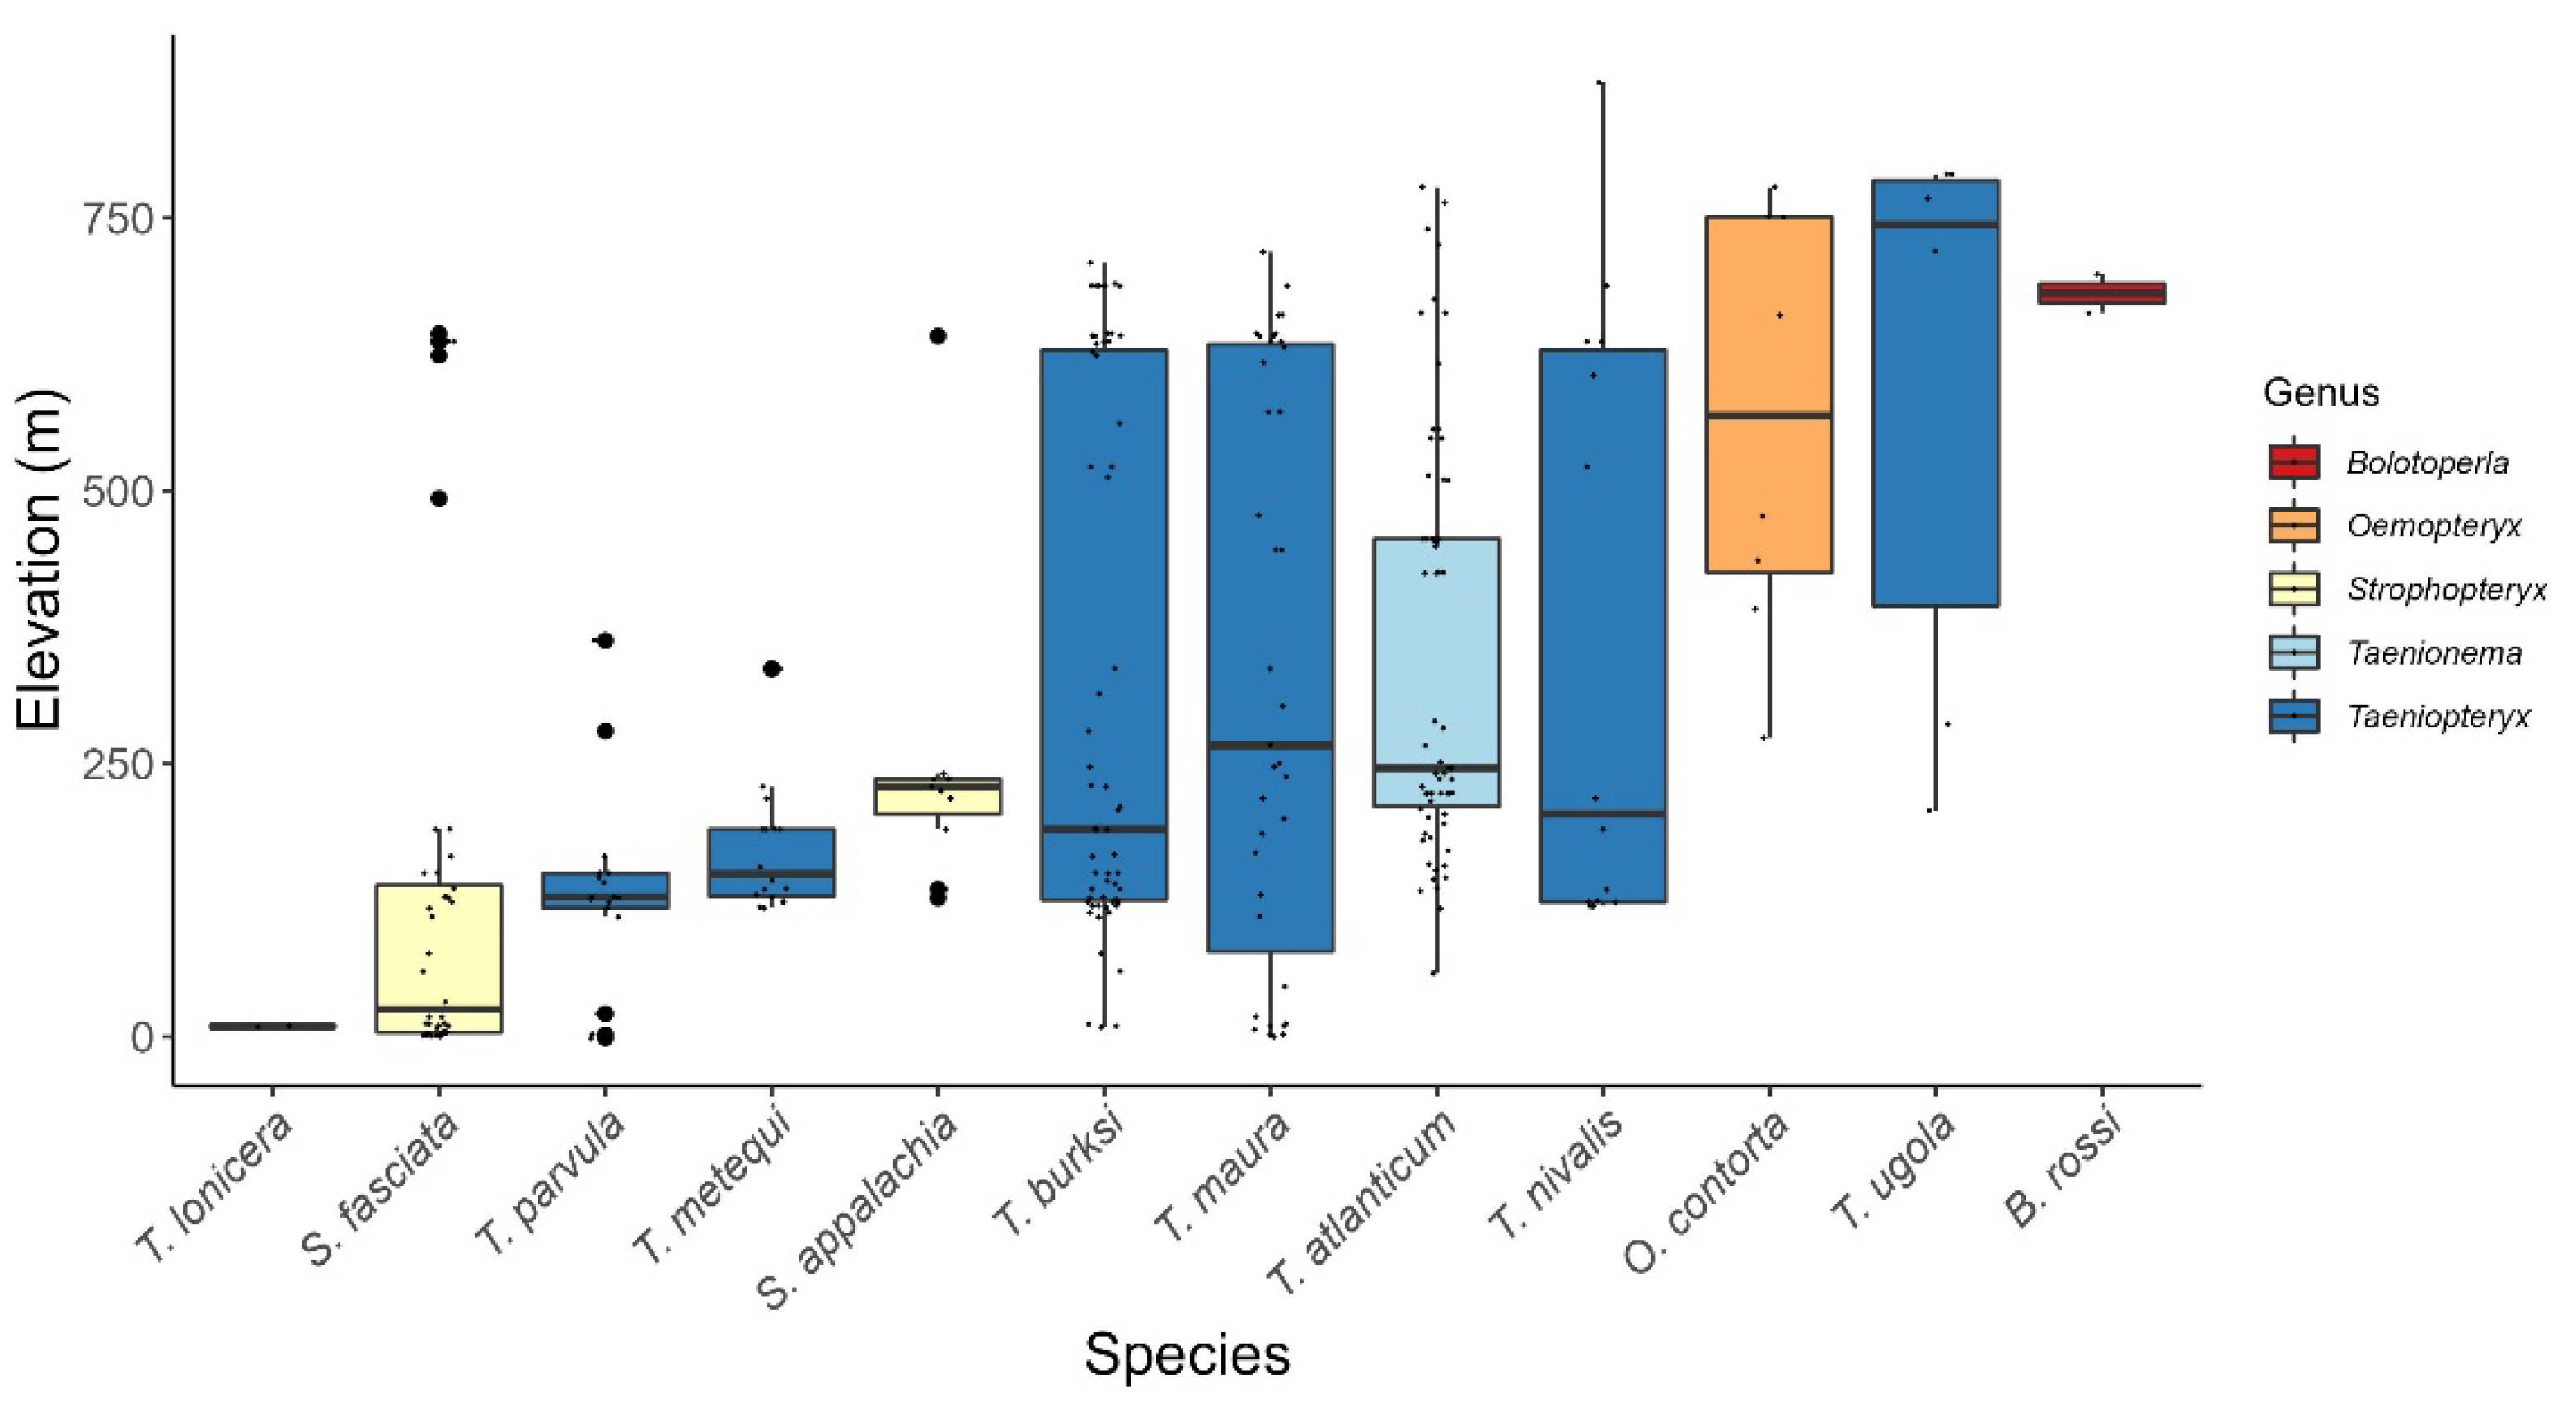
3.6.9. Taeniopterygidae
Adults have been collected from late December to mid-May and from low to high elevation streams (0–874 m ASL). Taeniopteryx nivalis Fitch, 1847, and Taenionema atlanticum Ricker and Ross, 1975, have the broadest ranges of elevation, 120–874 m ASL and 58–778 m ASL, respectively (Figure 15). Few of the reported Maryland species are known from limited elevation ranges. One, T. lonicera Ricker and Ross, 1968, is reported from two Coastal Plain streams with collection locations ranging in elevation from 9–10 m ASL. Comparatively, B. rossi is known from high-elevation streams (663–699 m ASL) solely from Garrett Co. The shortest adult presence is recorded for Oemopteryx contorta (Needham and Claassen, 1925), with collections from late February to mid-March (Table 12). T. burksi Ricker and Ross, 1968, an elevation generalist (9–709 m ASL), has been collected from late December to late April.
3.7. SGCN Distributional Trends
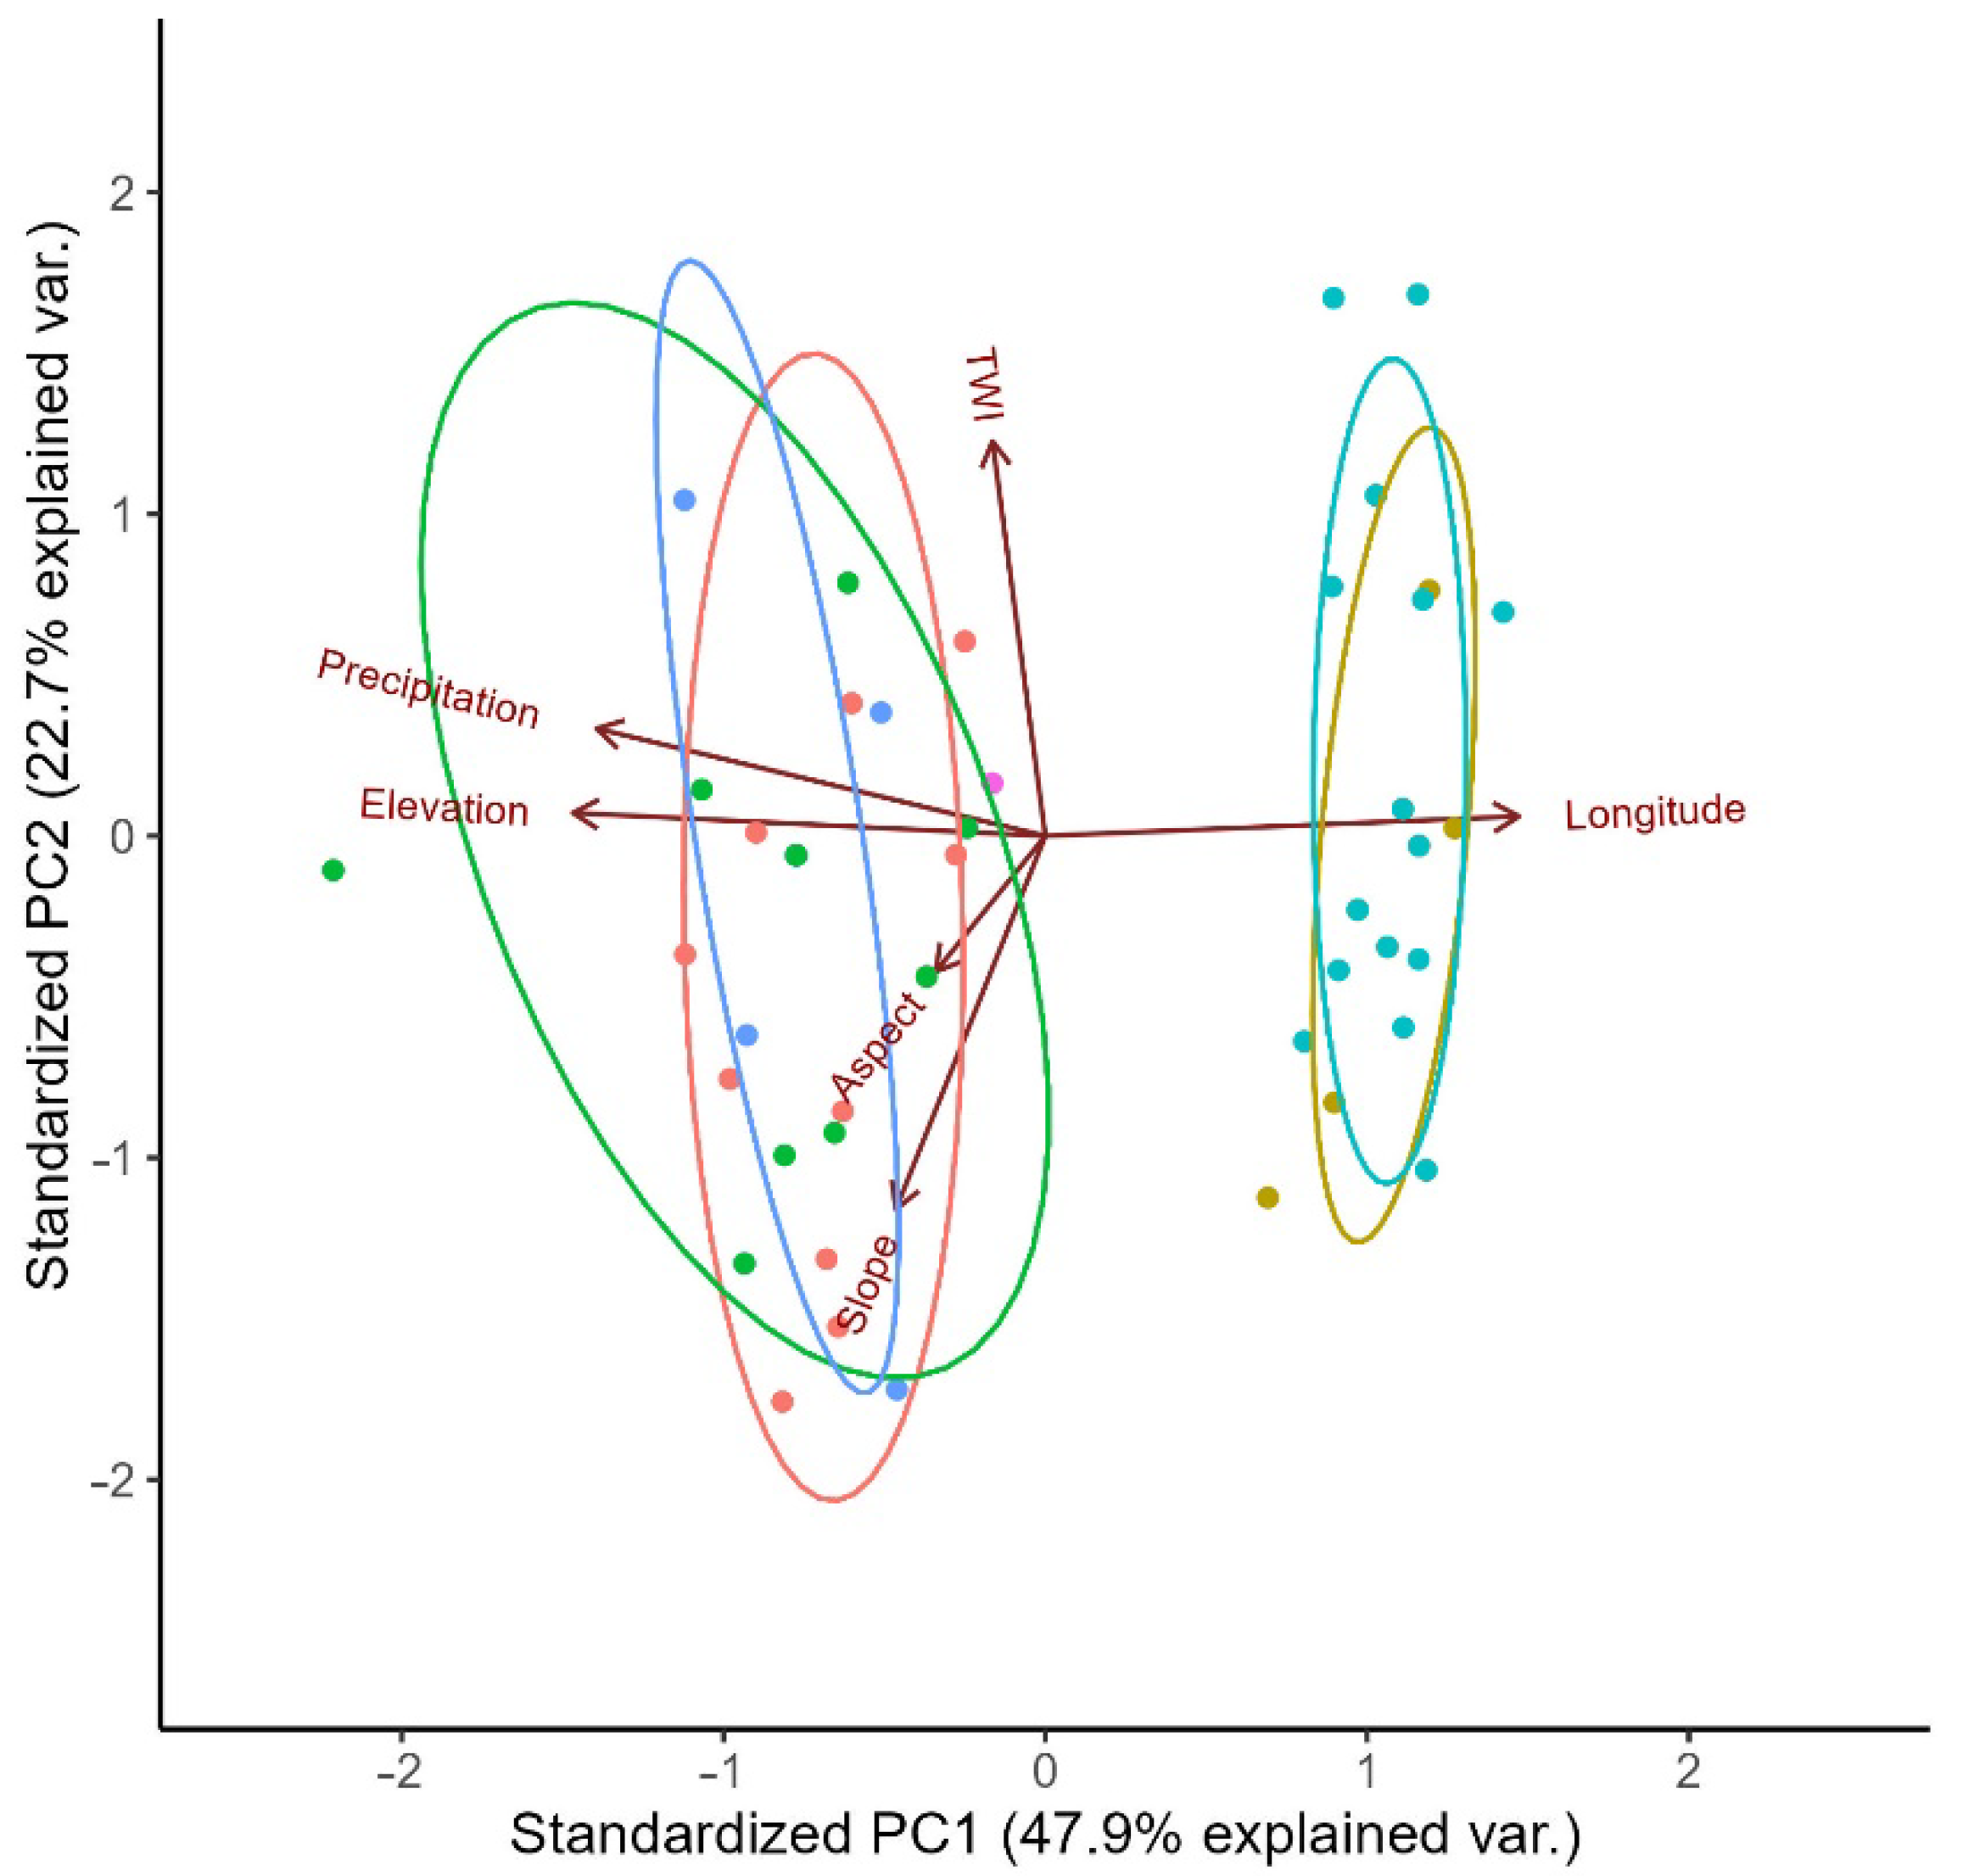
The most recent Maryland SWAP (published in 2016) listed six SGCNs [31] (Table 13). Four species, Alloperla aracoma Harper and Kirchner, 1978, M. flinti, S. pocahontas, and Utaperla gaspesiana Harper and Roy, 1975, are known from Garrett County. The remaining two species, A. biserrata and S. palerata, are present in Allegany County. These taxa appear to be restricted to their respective counties, with elevation and precipitation gradients strongly structuring PCA axis 1 (Figure 16). The SGCNs in Allegany and Garrett Counties have been recorded from mean elevations of 254 m ASL and 583 m ASL, respectively. The streams in Allegany County hosting SGCNs are found in a rain shadow formed by the higher-elevation summits to the west (Figure 16). Little is known about the habitat preference of each SGCN, but, with the exception of U. gaspesiana, they are found in springs, seeps, and first-order tributaries. The locality data associated with the Maryland record of U. gaspesiana does not mention a stream name but rather a state park (Big Run State Park) at the confluence of Big Run and the Savage River. Reports of this species’ habitat include medium-sized streams to large rivers [54].
The surrounding states of Delaware, Pennsylvania, Virginia, and West Virginia list a total of 55 SGCNs, 10 of which are present in Maryland yet not included in the Maryland SWAP (Table 14). Of the 10, A. frumi has the most restricted known distribution, spanning from eastern West Virginia to two high-elevation, first-order tributaries in far western Garrett County, Maryland.
3.8. Diversity Hotspots
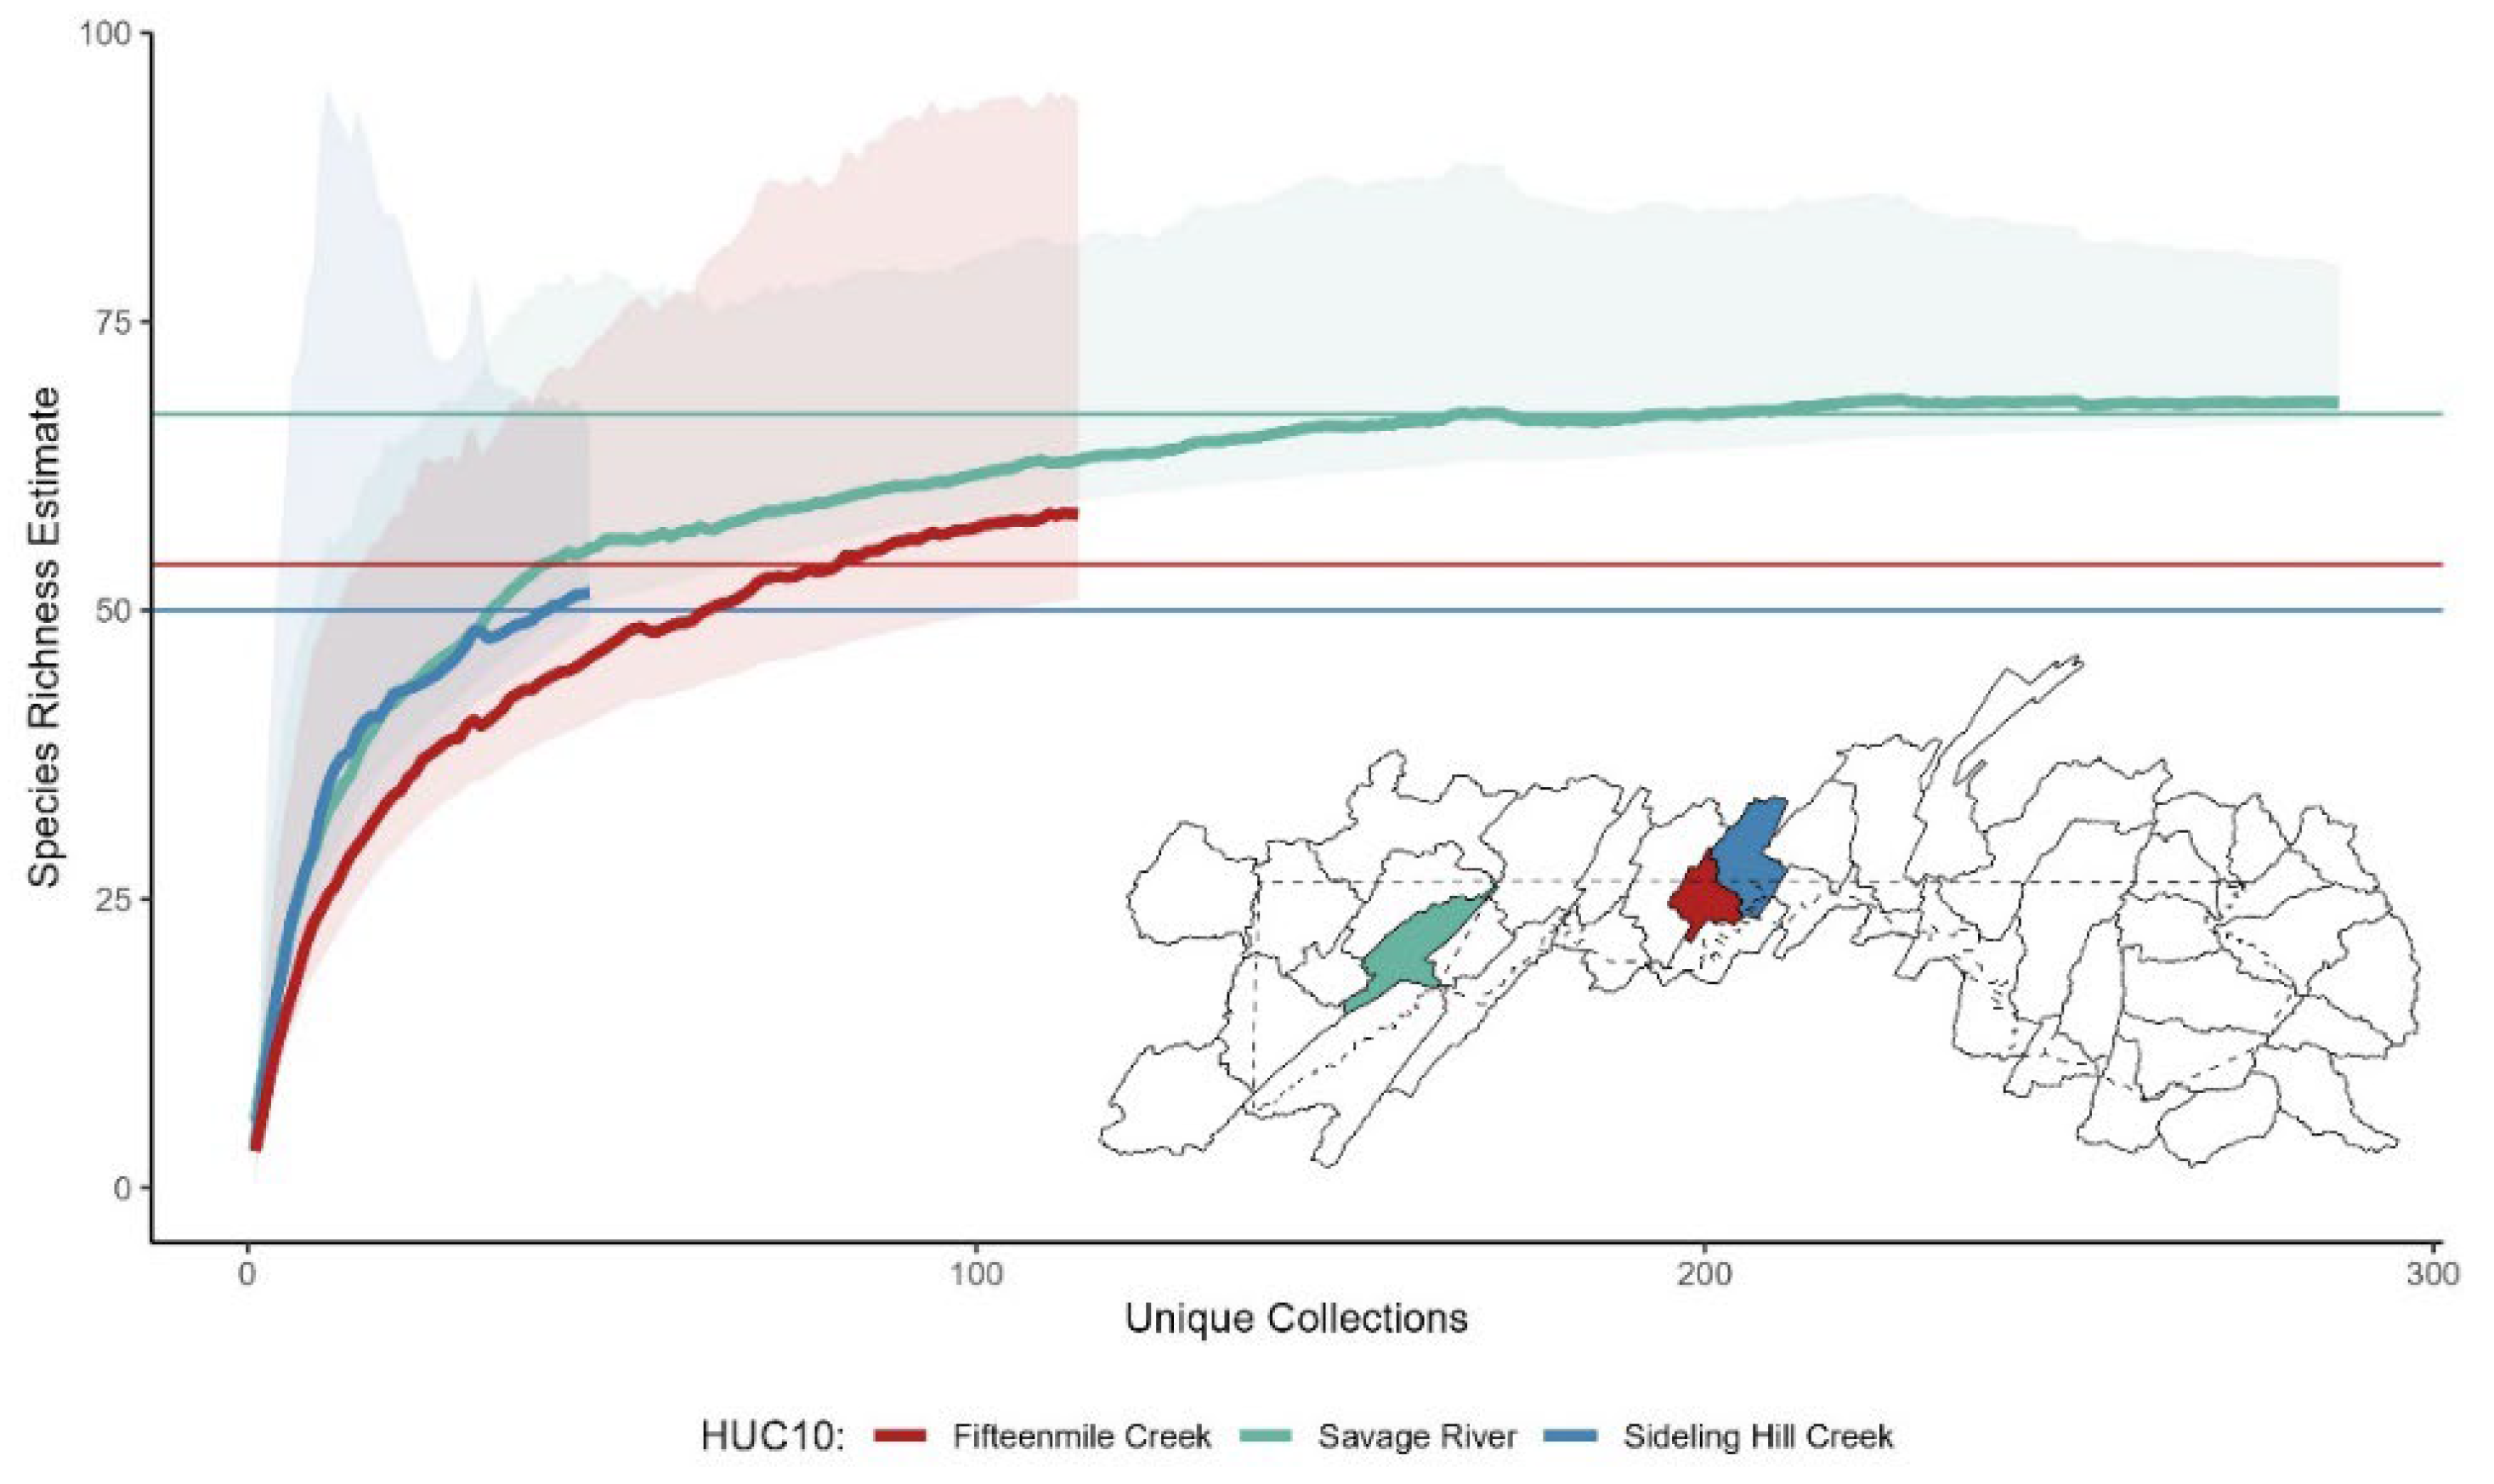
Three well-sampled catchments within Maryland host a diverse assemblage of stonefly fauna. The Savage River (HUC-10: 0207000201) in Garrett County has the highest reported species richness, with a total of 67 species recorded (Figure 2). Sideling Hill Creek (HUC-10: 0207000304) and Fifteenmile Creek (HUC-10: 0207000303) in neighboring Allegany County harbor 52 and 50 species, respectively. Of these three catchments, the Savage River is the most intensely sampled watershed in the state, accounting for 34% of the total available Maryland records (n = 1279). All three catchments are found within largely protected landscapes with public conservation lands (e.g., Garrett, Green Ridge, Potomac, and Savage River state forests) comprising a large percentage of each basin. The inability to access proportionally fewer streams on private land may account for the discrepancy between the species richness of surrounding HUC-10s and that of these well-sampled watersheds. Both the Savage River and Sideling Hill drainage basins are nearing complete sampling, as Chao1 estimates of species richness are approaching horizontal asymptotes (Figure 17). The Chao1 estimate of species richness for the Savage River catchment was 68 ± 2.6, and the Sideling Hill Creek catchment estimate was 51.5 ± 3.5. In contrast, the Fifteenmile Creek drainage basin estimate of species richness was 58 ± 8.7, indicative of the necessity for more sampling to provide a more accurate estimate of species richness in this watershed (Figure 17).
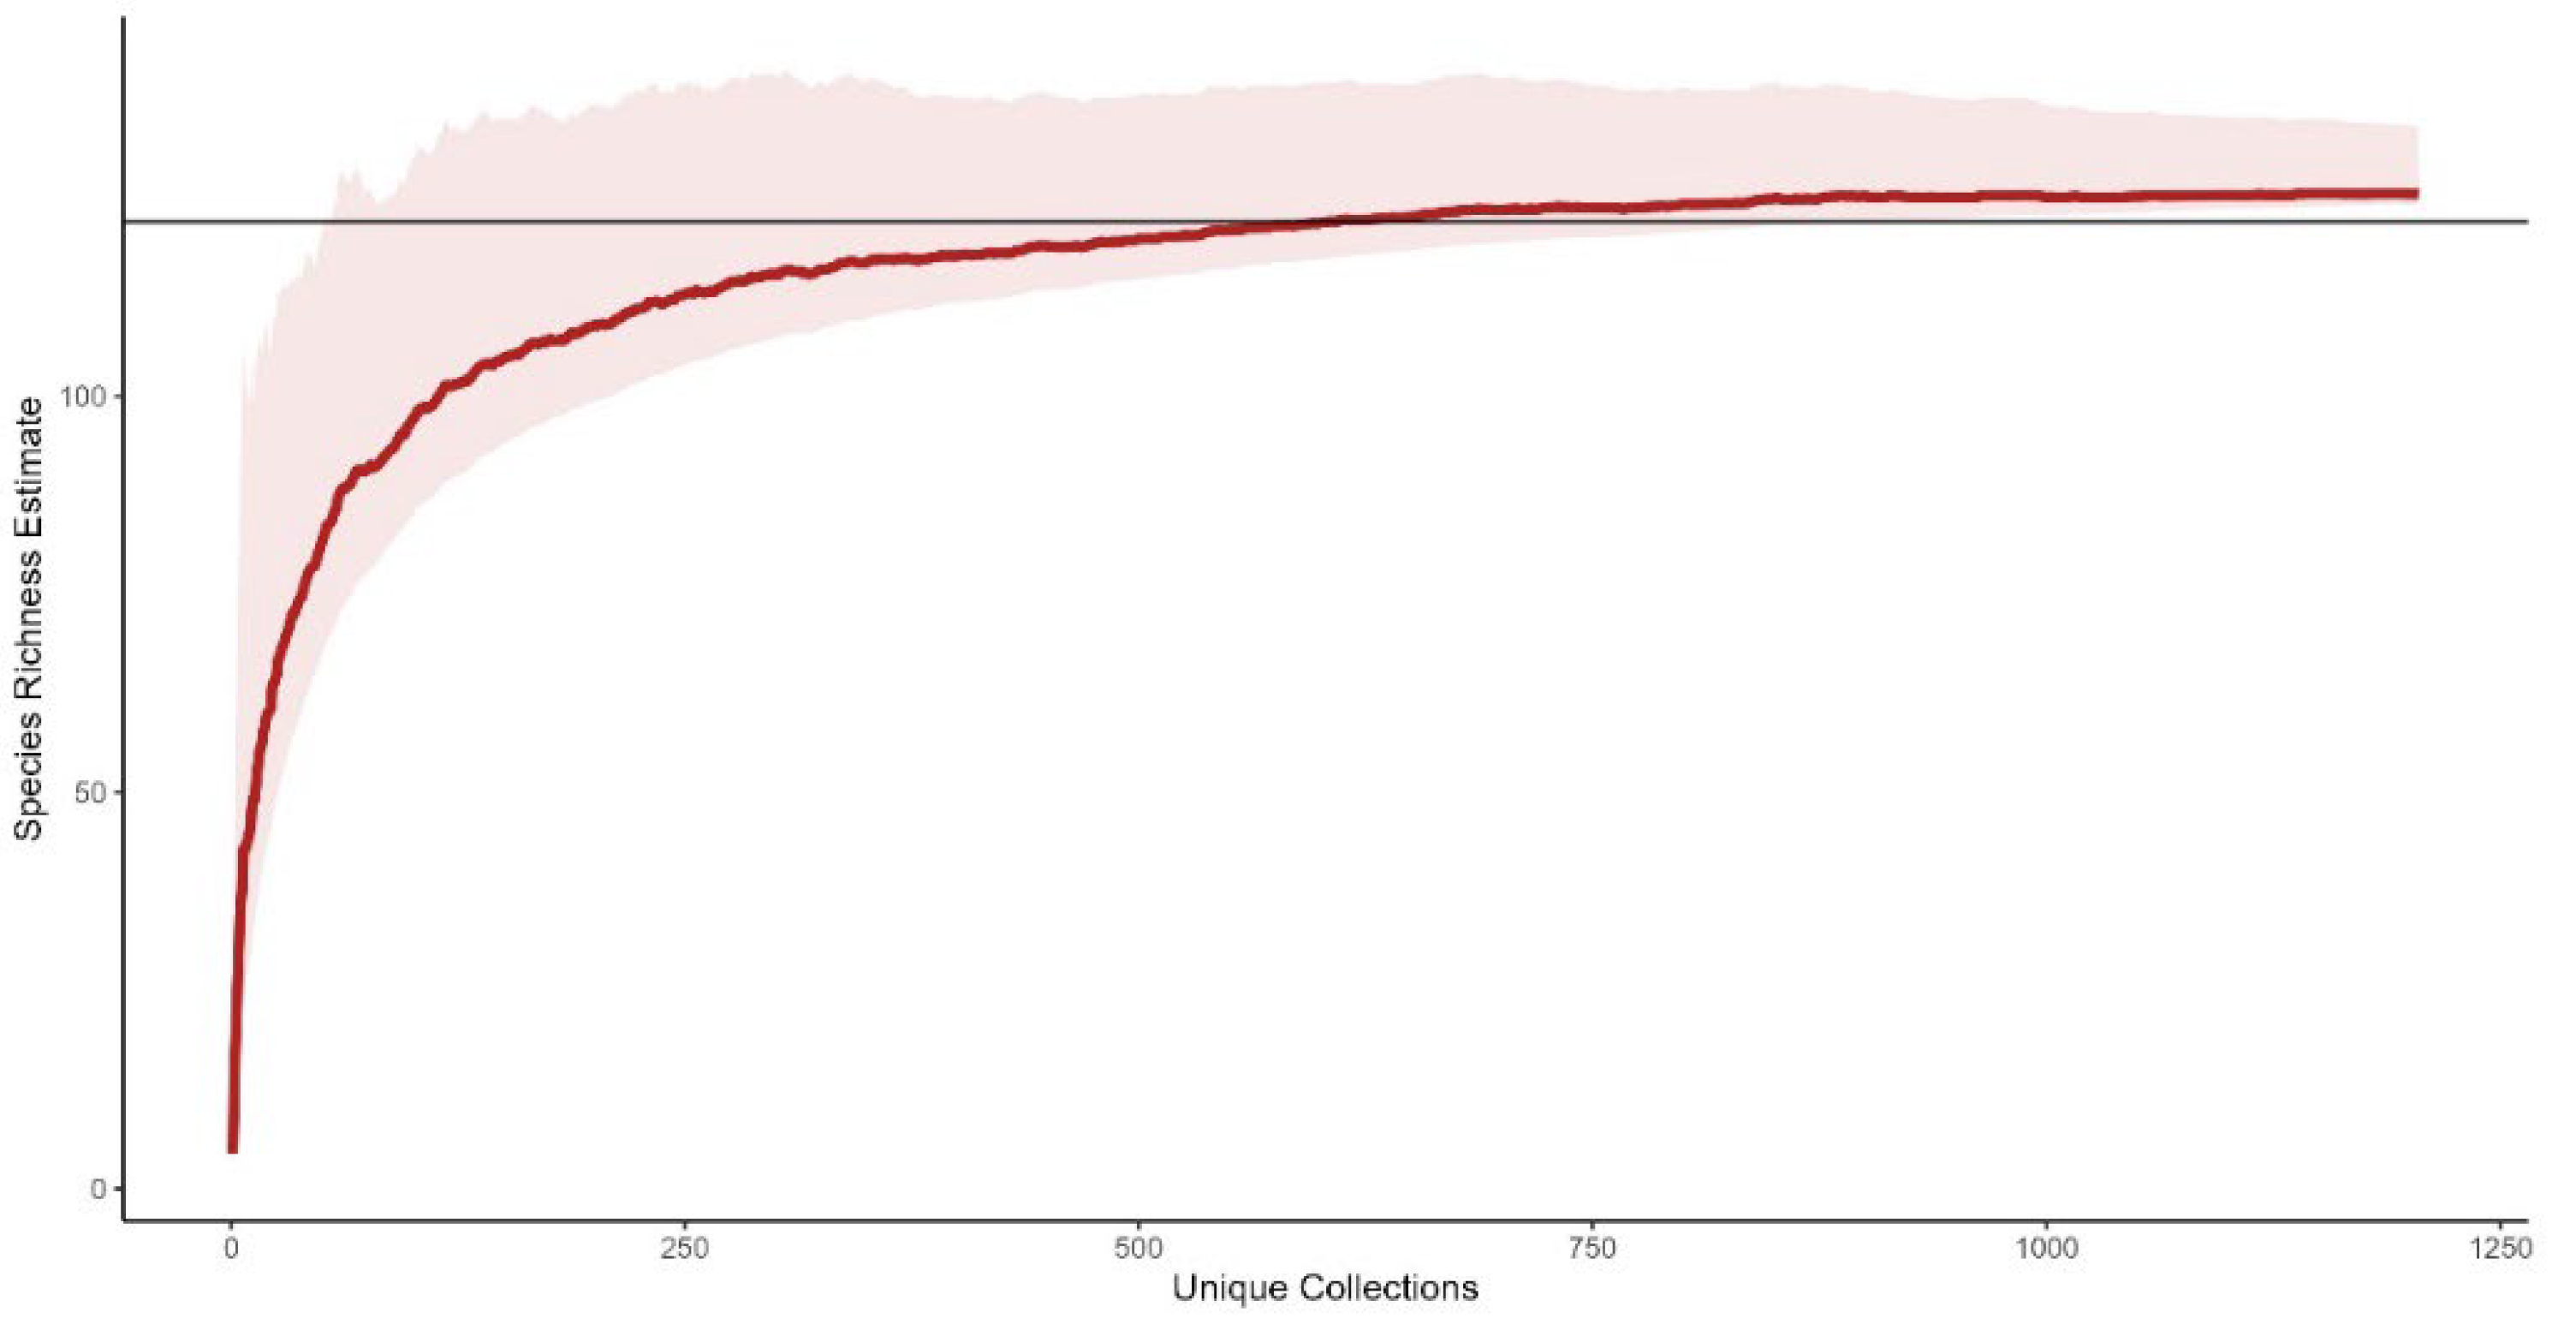
3.9. Maryland Species Richness Estimates
Estimates of species richness indicate that Maryland is approaching fully sampled; however, more species can be expected (Figure 18). The Chao1 estimate for Maryland was 125.5 ± 1.8. The observed Maryland species richness reported here (n = 122) suggests that potentially up to five more species can be discovered through additional collecting efforts.
4. Discussion
This is only the third distributional and ecological treatment of the stonefly fauna of a USA state, following the comprehensive works of the Ohio [10,55] and Indiana fauna [56]. The first Ohio treatment was predicated on the assessment of nearly 4100 specimen records of 102 species with adequate coverage of the entire state. The latter treatment built in an additional ca. 3700 records, providing for a more comprehensive coverage of the state. The Indiana treatment was based on nearly 6300 records [56]. In this study, the nearly 4100 Maryland records accumulated were for the ninth smallest USA state. Overall, the 7 new state records plus the literature record for H. subvarians increase the number of species known from Maryland from 114 [23] to 122. The increase in new state records speaks volumes to the continued need to study faunistic patterns, even in states or portions of states with what appears to be prior extensive sampling. Of the 8 new records, 5 were recovered from the Appalachian region of the state, where the second author had previously accumulated >1600 records during the 1990s. Additional collecting in regions historically overlooked has resulted in two new records. Future collecting efforts focused in these areas will undoubtedly increase the number of species known from the state.
Ecological treatments available for stoneflies often focus on the abundant species, and the remaining knowledge is inferred from related taxa [57] or from taxa sharing similar habitats [58]. Documenting elevation trends across species within a region aids in identifying potentially suitable habitat and can be the first step in the initial delineation of a species distribution [59]. Additionally, reporting these trends identifies patterns that can further support the separation of species [60]. Likewise, comparisons of the intrafamilial elevation trends elucidate similarities in habitats between species. For example, species of Alloperla and Sweltsa Ricker, 1943, have been noted as having comparable distributions [40]. Both A. aracoma and S. pocahontas share similar habitats at a narrow elevation range (Figure 8). Similarly, A. biserrata and S. palearata [40] share habitats at a lower elevation range (Figure 8). The use of elevation ranges can also provide support in separating interspecies habitat requirements [60]. Surdick [40] identified subtle differences in the morphology between S. palearata and S. pocahontas but distinct differences in the distribution, supported here with two disjunct, non-overlapping elevation ranges.
Faunistic studies, such as the one presented here, provide an initial approach to identifying candidate species for SGCN listing, in addition to increasing knowledge on the distribution and habitat requirements of currently listed species. Distributional studies should be supplemented with knowledge of the species’ natural history and ecological requirements. As knowledge of the majority of Maryland SGCN stoneflies is limited, it is imperative to continue research to best conserve appropriate habitat. Of the six species listed at the time of writing, only the habitat requirements of M. flinti are well known, as the genus is typical of thermally stable, unimpacted cold-water springs and seeps with larvae thought to be inhabiting the hyporheic region [61,62]. Focused studies on environmental tolerances and life history traits will further improve the efficiency of applied conservation efforts.
Maryland lies in a transitional region between the southern and northern Appalachian Mountains. As expected, the faunal assemblage of Maryland is compositionally similar to neighboring states (Figure 4: NMDS). The greatest similarity to the faunal assemblage of Maryland was between Pennsylvania and West Virginia. This is congruent with the results of Nelson [63], in which Maryland is nested within a clade containing New York, Pennsylvania, West Virginia, and Virginia. Nelson [63] included New York in this clade on the basis of geographic proximity. Of bordering states, Delaware is the most distinct from Maryland, likely as a result of comparatively far fewer collecting efforts. The only treatment of the Delaware fauna was a simple checklist of 38 species published over 40 years ago [64]. With the similarity in regional faunal assemblages identified, several additional species can be anticipated from neighboring states.
We recognize that the sampling bias is directed mainly at the Appalachian region of the state. Prior to this treatment, the only published study purposefully collecting east of the Appalachian Mountains in Maryland was by Kondratieff and Kirchner [65]. The authors synonymized a species described by Ross and Ricker [66] from Zekiah Swamp in Charles County. Hence, much more work is necessary to better understand basic distribution patterns of stoneflies in Maryland. For example, are other regional hotspots present in the state? If yes, this can aid conservation efforts to initiate or enhance the protection of intact, high-quality landscapes. We contend that three interrelated strategies could lead to a more comprehensive understanding of species-level distribution patterns across the state. One, as noted above, the southern and eastern portions of Maryland have been undersampled compared to the species-rich Appalachian Mountain region in the western panhandle (Figure 2). Of the 113 HUC-10 catchments within Maryland, 41% have zero stonefly records reported, the large majority of which are found outside the montane region of the state. Moreover, even the modest collecting efforts by the first author in southern Maryland during 2020–2021 yielded new state records of A. virginiana and I. davisi. We anticipate that focused collection efforts, namely, in protected landscapes (e.g., state parks) and light-trapping for the several additional species of Perlesta (e.g., P. bjostadi Kondratieff and Lenat, 2006, and P. robeli Kondratieff and Kirchner, 2003) known currently from the Coastal Plain regions of North Carolina and adjacent Virginia, will lead to additions to the state faunal list.
Two, specimen data that are present in collections but not yet examined need to be added. For example, we were unable to visit and examine material present in several collections, including but not limited to USNM, due to COVID-19 pandemic visitation restrictions. The small number of USNM records used in this study were limited only to those examined by the second author during a single day’s visit in 1996. Hence, an exhaustive approach similar to those of DeWalt et al. [10,55] and Newman et al. [56] is needed for a more comprehensive study of the Maryland fauna.
Three, Hogan [67] used distributional modeling in efforts to locate populations of several SGCN and non-listed, uncommon species in Maryland, including the new state records of A. simmonsi, as noted above. This was also successful for finding new localities of additional uncommon collected species, including A. aracoma, A. biserrata, M. flinti, S. palearata, S. pocahontas, and S. kondratieffi. This method could be incorporated for the strategic sampling of several additional species whose currently known distributions are near Maryland’s geographic borders (Table). For example, Alloperla stipitata Surdick, 2004, is currently known only from Blue Ridge Mountain streams in western and northern Virginia [40,60] and may likewise occur in similar landscapes and stream habitats in Maryland. Little overall is known about the distribution patterns of many stoneflies, particularly for rare and uncommonly encountered species.
This study emphasizes how moderate collecting efforts over several decades have substantially increased our knowledge of the stonefly diversity within the confines of a small state. Distributional studies of aquatic biodiversity, such as this one, aid aquatic biologists and state agencies by providing a baseline of intrastate species distributions upon which comparisons to future collections can be made. The reporting of uncommon species distributions can refine public land management decisions. Additionally, the identification of biodiverse or undersampled regions and reporting the locations of rare species will aid in the development of future conservation plans. Following previous iterative faunistic studies of the stonefly taxa of Maryland, a directive for future collections in understudied regions is introduced to further advance the knowledge of species distributions within the state. Focusing collecting efforts in the understudied regions (e.g., Atlantic Coastal Plain) of Maryland may increase the total number of species recorded from the state and expand known distributions. In conclusion, we present an updated checklist of 122 stoneflies for Maryland as a baseline for future assessments of aquatic biodiversity, identify regions of stonefly diversity, and advocate for future research in understudied regions.
Author Contributions
P.N.H. collected and identified specimens, managed specimen curation and storage, conducted data analyses, prepared images, and wrote and edited the text. S.A.G. conceived the project, collected and identified specimens, managed specimen curation and storage, and wrote and edited the text. All authors have read and agreed to the published version of the manuscript.
Funding
This research was funded in part by The Western Kentucky University Graduate School and Center for Biodiversity Studies.
Institutional Review Board Statement
Not applicable.
Informed Consent Statement
Not applicable.
Data Availability Statement
All occurrence data used in this publication are available at the data repository Dryad under the title “Data from Distributional trends and species richness of Maryland, USA stoneflies (Insecta: Plecoptera), with an emphasis on the Appalachian region” [68]. These data are available online at: https://doi.org/10.5061/dryad.hdr7sqvmg (accessed on 8 September 2022).
Acknowledgments
We thank Charlie H. Nelson (CHNC), John Rawlins (CMNH), and the late Nancy Adams (USNM) for making material available for study. In addition, we thank Neal Dziepack from the Maryland Department of Natural Resources for providing records of Bolotoperla rossi. We must also express our appreciation to Deborah Landau and the Maryland/DC Chapter of The Nature Conservancy for granting access to and allowing collections at the Sideling Hill Nature Preserve. Richard Jacobsen kindly provided housing for SAG and assisted with collecting during the 1990s. Zach Talbert provided housing for PNH in 2020.
Conflicts of Interest
The authors declare no conflict of interest. The funders had no role in the design of the study; in the collection, analyses, or interpretation of data; in the writing of the manuscript; or in the decision to publish the results.
References
- Tixier, G.; Guérold, F. Plecoptera Response to Acidification in Several Headwater Streams in the Vosges Mountains (Northeastern France). Biodivers. Conserv. 2005, 14, 1525–1539. [Google Scholar] [CrossRef]
- Hogg, I.D.; Williams, D.D. Response of Stream Invertebrates to a Global-Warming Thermal Regime: An Ecosystem-Level Manipulation. Ecology 1996, 77, 395–407. [Google Scholar] [CrossRef]
- Bálint, M.; Domisch, S.; Engelhardt, C.H.M.; Haase, P.; Lehrian, S.; Sauer, J.; Theissinger, K.; Pauls, S.U.; Nowak, C. Cryptic Biodiversity Loss Linked to Global Climate Change. Nat. Clim. Chang. 2011, 1, 313–318. [Google Scholar] [CrossRef]
- Sheldon, A.L. Possible Climate-Induced Shift of Stoneflies in a Southern Appalachian Catchment. Freshw. Sci. 2012, 31, 765–774. [Google Scholar] [CrossRef]
- Green, M.D.; Tronstad, L.M.; Giersch, J.J.; Shah, A.A.; Fallon, C.E.; Blevins, E.; Kai, T.R.; Muhlfeld, C.C.; Finn, D.S.; Hotaling, S. Stoneflies in the Genus Lednia (Plecoptera: Nemouridae): Sentinels of Climate Change Impacts on Mountain Stream Biodiversity. Biodivers. Conserv. 2022, 31, 353–377. [Google Scholar] [CrossRef]
- DeWalt, R.E.; Favret, C.; Webb, D.W. Just How Imperiled Are Aquatic Insects? A Case Study of Stoneflies (Plecoptera) in Illinois. Ann. Entomol. Soc. Am. 2005, 98, 941–950. [Google Scholar] [CrossRef]
- Bojková, J.; Komprdová, K.; Soldán, T.; Zahrádková, S. Species Loss of Stoneflies (Plecoptera) in the Czech Republic during the 20th Century. Freshw. Biol. 2012, 57, 2550–2567. [Google Scholar] [CrossRef]
- Pond, G.J. Biodiversity Loss in Appalachian Headwater Streams (Kentucky, USA): Plecoptera and Trichoptera Communities. Hydrobiologia 2012, 679, 97–117. [Google Scholar] [CrossRef]
- Master, L.L.; Stein, B.A.; Hammerson, G.A.K. Vanishing Assets: Conservation Status of U.S. Species. In Vanishing Assets: Conservation Status of U.S. Species; Oxford University Press: Oxford, UK, 2000. [Google Scholar]
- DeWalt, R.; Grubbs, S.; Armitage, B.; Baumann, R.; Clark, S.; Bolton, M. Atlas of Ohio Aquatic Insects: Volume II, Plecoptera. Biodivers. Data J. 2016, 4, e10723. [Google Scholar] [CrossRef]
- DeWalt, R.E.; Grubbs, S. Updates to the Stonefly Fauna of Illinois and Indiana. Illiesia 2011, 7, 31–50. [Google Scholar]
- Bojková, J.; Rádková, V.; Soldán, T.; Zahrádková, S. Trends in Species Diversity of Lotic Stoneflies (Plecoptera) in the Czech Republic over Five Decades. Insect Conserv. Divers. 2014, 7, 252–262. [Google Scholar] [CrossRef]
- Favret, C.; Dewalt, R.E. Comparing the Ephemeroptera and Plecoptera Specimen Databases at the Illinois Natural History Survey and Using Them to Document Changes in the Illinois Fauna. Ann. Entomol. Soc. Am. 2002, 95, 35–40. [Google Scholar] [CrossRef]
- Sauer, J.; Domisch, S.; Nowak, C.; Haase, P. Low Mountain Ranges: Summit Traps for Montane Freshwater Species under Climate Change. Biodivers. Conserv. 2011, 20, 3133–3146. [Google Scholar] [CrossRef]
- Grubbs, S.A. Evidence of Range Contraction and Increased Metapopulation Patchiness of the Rare Eastern Nearctic Karst Snowfly Allocapnia cunninghami Ross & Ricker, 1971. J. Insect Conserv. 2021, 25, 311–320. [Google Scholar] [CrossRef]
- Merritts, D.; Walter, R.; Rahnis, M.; Hartranft, J.; Cox, S.; Gellis, A.; Potter, N.; Hilgartner, W.; Langland, M.; Manion, L.; et al. Anthropocene Streams and Base-Level Controls from Historic Dams in the Unglaciated Mid-Atlantic Region, USA. Philos. Trans. R. Soc. A 2011, 369, 976–1009. [Google Scholar] [CrossRef]
- Costa, J.E. Effects of Agriculture on Erosion and Sedimentation in the Piedmont Province, Maryland. GSA Bull. 1975, 86, 1281–1286. [Google Scholar] [CrossRef]
- Buckley, G.L. The Environmental Transformation of an Appalachian Valley, 1850–1906. Geogr. Rev. 1998, 88, 175–198. [Google Scholar] [CrossRef]
- Morgan, R.P.; Cushman, S.F. Urbanization Effects on Stream Fish Assemblages in Maryland, USA. J. N. Am. Benthol. Soc. 2005, 24, 643–655. [Google Scholar] [CrossRef]
- Stark, B.P.; Szczytko, S.W.; Baumann, R.W. North American Stoneflies (Plecoptera): Systematics, Distribution, and Taxonomic References. Great Basin Nat. 1986, 46, 383–397. [Google Scholar]
- Duffield, R.M.; Nelson, C.H. Seasonal Emergence Patterns and Diversity of Plecoptera on Big Hunting Creek, Maryland, with a Checklist of the Stoneflies of Maryland. Proc. Entomol. Soc. Wash. 1990, 92, 120–126. [Google Scholar]
- Grubbs, S.A. New Records, Zoogeographic Notes, and a Revised Checklist of Stoneflies (Plecoptera) from Maryland. Trans. Am. Entomol. Soc. 1997, 123, 71–84. [Google Scholar]
- Grubbs, S.A. An Update on the Stonefly Fauna (Insecta, Plecoptera) of Maryland, Including New and Emended State Records and an Updated State Checklist. Illiesia 2018, 14, 65–80. [Google Scholar]
- Kondratieff, B.C.; Zuellig, R.E.; Kirchner, R.F.; Lenat, D.R. Three New Species of Perlesta (Plecoptera: Perlidae) from Eastern North America and Notes on New State Records. Illiesia 2006, 2, 31–38. [Google Scholar]
- Verdone, C.J.; Beaty, S.R.; Holland, V.B.; Kondratieff, B.C. A New Species of Zealeuctra Ricker, 1952 (Plecoptera: Leuctridae) from North Carolina, USA. Illiesia 2019, 15, 65–78. [Google Scholar]
- Lenat, D.R.; Zuellig, R.E.; Kondratieff, B.C.; Beaty, S.R. Distribution of Neoperla (Plecoptera: Perlidae) in North Carolina, with New State Records for Three Species. Illiesia 2009, 5, 164–168. [Google Scholar]
- Kondratieff, B.C.; Kirchner, R.F. Two New Species of Perlesta Banks (Plecoptera: Perlidae) from Eastern North America. Proc. Entomol. Soc. Wash. 2003, 105, 933–939. [Google Scholar]
- Kondratieff, B.C.; Zuellig, R.E.; Kirchner, R.F.; Lenat, D.R. Two New Species of Perlesta (Plecoptera: Perlidae) from Eastern North America. Proc. Entomol. Soc. Wash. 2008, 110, 668–673. [Google Scholar] [CrossRef]
- Rosenberg, D.M.; Resh, V.H. (Eds.) Freshwater Biomonitoring and Benthic Macroinvertebrates, 1st ed.; Springer: Berlin/Heidelberg, Germany, 1993. [Google Scholar]
- Houghton, D.C.; Holzenthal, R.W. Historical and Contemporary Biological Diversity of Minnesota Caddisflies: A Case Study of Landscape-Level Species Loss and Trophic Composition Shift. J. N. Am. Benthol. Soc. 2010, 29, 480–495. [Google Scholar] [CrossRef]
- Maryland Department of Natural Resources Maryland State Wildlife Action Plan; Maryland Department of Natural Resources: Annapolis, MD, USA, 2016.
- ESRI. ArcGIS Pro; ESRI: Redlands, CA, USA, 2021. [Google Scholar]
- USGS. USGS 3D Elevation Program; USGS: Washington, DC, USA, 2020. Available online: https://www.usgs.gov/3d-elevation-program (accessed on 25 June 2022).
- Oregon State University. PRISM Climate Group; Oregon State University: Corvallis, OR, USA, 2014; Available online: https://prism.oregonstate.edu (accessed on 4 February 2022).
- DeWalt, R.E.; Maehr, M.D.; Hopkins, H.; Neu-Becker, U.; Stueber, G. Plecoptera Species File Online. 2022. Available online: http://Plecoptera.SpeciesFile.org (accessed on 23 August 2022).
- R Core Team. R: A Langauge and Environment for Statistical Computing; R Foundation for Statistical Computing: Vienna, Austria, 2022. [Google Scholar]
- Colwell, R.K. EstimateS: Statistical Estimation of Species Richness and Shared Species from Samples; Department of Ecology & Evolutionary Biology, University of Connecticut: Stor, CT, USA, 2019. [Google Scholar]
- South, E.J.; Skinner, R.K.; DeWalt, R.E.; Davis, M.A.; Johnson, K.P.; Teslenko, V.A.; Lee, J.J.; Malison, R.L.; Hwang, J.M.; Bae, Y.J.; et al. A New Family of Stoneflies (Insecta: Plecoptera), Kathroperlidae, Fam. n., with a Phylogenomic Analysis of the Paraperlinae (Plecoptera: Chloroperlidae). Insect Syst. Divers. 2021, 5, 1. [Google Scholar] [CrossRef]
- Hood, R.W.; Kirchner, R.F.; Earle, J.I. A New State Record Of Allocapnia simmonsi Kondratieff and Voshell (Plecoptera: Capniidae) From West Virginia, USA, with Additional Records From Pennsylvaniaand Virginia. Ent. News 2008, 119, 303–305. [Google Scholar] [CrossRef]
- Surdick, R.F. Chloroperlidae (The Sallflies). In The Stoneflies (Plecoptera) of Eastern North America. Volume II. Chloroperlidae, Perlidae, and Perlodidae (Perlodinae); Bulletin of the Ohio Biological Series; Ohio Biological Survey: Columbus, OH, USA, 2004; Volume 14, pp. 1–60. [Google Scholar]
- Szczytko, S.W.; Kondratieff, B.C. A Review of the Eastern Nearctic Isoperlinae (Plecoptera: Perlodidae) with the Description of Twenty-Two New Species. Monogr. Illiesia 2015, 1, 1–289. [Google Scholar]
- Verdone, C.J.; Kondratieff, B. A New Species of Isoperla Banks (Plecoptera: Perlodidae) from the Appalachian Mountains, Virginia & West Virginia, U.S.A. Illiesia 2016, 12, 74–85. [Google Scholar]
- Stark, B.P.; Harrison, A.B.; Kondratieff, B.C.; Baumann, R.W.; Nye, K.C. Distribution of the Smoky Willowfly, Bolotoperla rossi (Frison) (Plecoptera: Taeniopterygidae) in Eastern North America. Illiesia 2016, 12, 15–20. [Google Scholar]
- Needham, J.G.; Claassen, P.W. A Monograph of the Plecoptera or Stoneflies of America North of Mexico; The Thomas Say Foundation of the Entomological Society of America, LaFayette, Ind.: LaFayette, LA, USA, 1925; Volume II, pp. 1–397. [Google Scholar]
- Banks, N. New Neuropteroid Insects. Bull. Mus. Comp. Zool. 1920, 64, 266–291. [Google Scholar]
- Stark, B.P.; Ray, D.H. A Revision of the Genus Helopicus (Plecoptera: Perlodidae). Freshw. Invertebr. Biol. 1983, 2, 16–27. [Google Scholar] [CrossRef]
- Kondratieff, B.C. Perlodidae-Perlodinae (The Springflies). In The Stoneflies (Plecoptera) of Eastern North America. Volume II. Chloroperlidae, Perlidae, and Perlodidae (Perlodinae); Bulletin of the Ohio Biological Series; Ohio Biological Survey: Columbus, OH, USA, 2004; Volume 14, pp. 149–190. [Google Scholar]
- Grubbs, S.A.; Baumann, R.W. The Nearctic Species Shipsa rotunda (Claassen, 1923) (Plecoptera: Nemouridae). J. Insect Biodivers. 2021, 23, 50–63. [Google Scholar] [CrossRef]
- Kirchner, R.F. Plecoptera Records from West Virginia. Ent. News 1978, 89, 206. [Google Scholar]
- Stark, B.P. The Tallaperla maria Complex of Eastern North America (Plecoptera: Peltoperlidae). J. Kans. Entomol. Soc. 1983, 56, 398–410. [Google Scholar]
- Earle, J.I. New Records and Clarifications of the Pennsylvania Stonefly (Plecoptera) Fauna, with an Annotated List of the Stoneflies of Pennsylvania, U.S.A. Ent. News 2004, 115, 191–200. [Google Scholar]
- Frison, T.H. Studies of North American Plecoptera, with Special Reference to the Fauna of Illinois; Bulletin of the Illinois Natural History Survey: Champaign, IL, USA, 1942; Volume 22, pp. 231–355. [Google Scholar]
- Nelson, C.H.; Hamilton, R., IV; Duffield, R.M. Confirmed Records of Leuctra variabilis and Alloperla usa in Maryland (Plecoptera: Leuctridae, Chloroperlidae), with Additional Comments on the Former Species. Ent. News 2002, 113, 137–139. [Google Scholar]
- Myers, L.W.; Kondratieff, B.C.; Mhuc, T.B.; Ruiter, D.E. The Mayflies (Ephemeroptera), Stoneflies (Plecoptera), and Caddisflies (Trichoptera) of the Adirondack Park (New York State). Trans. Am. Entomol. Soc. 2011, 137, 63–140. [Google Scholar] [CrossRef]
- DeWalt, R.; Cao, Y.; Tweddale, T.; Grubbs, S.; Hinz, L.; Pessino, M.; Robinson, J. Ohio USA Stoneflies (Insecta, Plecoptera): Species Richness Estimation, Distribution of Functional Niche Traits, Drainage Affiliations, and Relationships to Other States. ZooKeys 2012, 178, 1–26. [Google Scholar] [CrossRef] [PubMed]
- Newman, E.A.; DeWalt, R.E.; Grubbs, S.A. Plecoptera (Insecta) Diversity in Indiana: A Watershed-Based Analysis. Diversity 2021, 13, 672. [Google Scholar] [CrossRef]
- Peckarsky, B.L. A Review of the Distribution, Ecology, and Evolution of the North American Species of Acroneuria and Six Related Genera (Plecoptera: Perlidae). J. Kans. Entomol. Soc. 1979, 52, 787–809. [Google Scholar]
- McRoberts, T.; Grubbs, S. Effects of Stream Permanence on Stonefly (Insecta, Plecoptera) Community Structure at Mammoth Cave National Park, Kentucky, USA. Biodivers. Data J. 2021, 9, e62242. [Google Scholar] [CrossRef]
- Judson, S.W.; Nelson, C.R. Diversity, Phenology, and Elevational Distribution of Ephemeroptera, Plecoptera, and Trichoptera in American Fork Canyon, Utah. West. N. Am. Nat. 2010, 70, 526–540. [Google Scholar] [CrossRef]
- Grubbs, S.A.; Baumann, R.W. Alloperla clarki sp. nov. (Plecoptera: Chloroperlidae), a New Species from the Eastern Nearctic with Discussion of a New Species Group. Zootaxa 2019, 4624, 241–255. [Google Scholar] [CrossRef]
- Baumann, R.W.; Stark, B.P. The Genus Megaleuctra Neave (Plecoptera: Leuctridae) in North America. Illiesia 2013, 9, 65–93. [Google Scholar]
- Baumann, R.W. New Megaleuctra from the Eastern United States (Plecoptera: Leuctridae). Ent. News 1973, 84, 247–250. [Google Scholar]
- Nelson, C.H. Hierarchical Relationships of North American States and Provinces: An Area Cladistic Analysis Based on the Distribution of Stoneflies (Insecta: Plecoptera). Illiesia 2008, 4, 176–204. [Google Scholar]
- Lake, R.W. Distribution of the Stoneflies (Plecoptera) of Delaware. Ent. News 1980, 91, 43–48. [Google Scholar]
- Kondratieff, B.C.; Kirchner, R.F. Notes on the Winter Stonefly Genus Allocapnia (Plecoptera: Capniidae). Proc. Entomol. Soc. Wash. 1982, 84, 240–244. [Google Scholar]
- Ross, H.H.; Ricker, W.E. The Classification, Evolution, and Dispersal of the Winter Stonefly Genus Allocapnia; University of Illinois Press: Urbana, IL, USA, 1971; pp. 1–192. ISBN 978-0-252-00140-6. [Google Scholar]
- Hogan, P.N. Predictive Distributional Modeling of Rare and Uncommon Stoneflies (Insecta: Plecoptera) of the Central Appalachian Mountains Using Maximum Entropy. In Masters Theses & Specialist Projects; Western Kentucky University: Bowling Green, KY, USA, 2021. [Google Scholar]
- Hogan, P.N.; Grubbs, S.A. Data from Distributional trends and species richness of Maryland, USA stoneflies (Insecta: Plecoptera), with an emphasis on the Appalachian region. In Dryad, Dataset; Dryad: Castro Valley, CA, USA, 2022. [Google Scholar] [CrossRef]
Figure 1.
Surface topography of Maryland with United States Geological Survey Hydrologic Unit Code (HUC)-8 watersheds of Maryland overlaid.
Figure 1.
Surface topography of Maryland with United States Geological Survey Hydrologic Unit Code (HUC)-8 watersheds of Maryland overlaid.

Figure 2.
Species richness for United States Geological Survey Hydrologic Unit Code (HUC)-10 catchments of Maryland with georeferenced collection locations.
Figure 2.
Species richness for United States Geological Survey Hydrologic Unit Code (HUC)-10 catchments of Maryland with georeferenced collection locations.

Figure 3.
Species richness among stoneflies families represented in Maryland.

Figure 4.
Non-metric Multi-Dimensional Scaling plot of regional stonefly assemblages for eastern United States of America (USA) states. Black circles represent USA states and are labeled with abbreviations of USA postal codes. Maryland (MD) is highlighted with a red circle and red text.
Figure 4.
Non-metric Multi-Dimensional Scaling plot of regional stonefly assemblages for eastern United States of America (USA) states. Black circles represent USA states and are labeled with abbreviations of USA postal codes. Maryland (MD) is highlighted with a red circle and red text.

Figure 5.
Boxplot of stonefly family elevation trends in Maryland. Boxes represent the interquartile range, while vertical lines extend to the minimum and maximum values. The horizontal line within the interquartile range represents the median elevation. Outliers are shown with large, solid circles. Small, individual points overlaid on each boxplot illustrate the distribution of observations.

Figure 6.
Boxplot of longitude associated with collection locations for each Maryland stonefly family. Boxes represent the interquartile range, while vertical lines extend to the minimum and maximum values. The horizontal line within the interquartile range represents the median longitude. Outliers are shown with large, solid circles. Small, individual points overlaid on each boxplot illustrate the distribution of observations.

Figure 7.
Elevation boxplots for Capniidae species recorded from Maryland. Boxes represent the interquartile range, while vertical lines extend to the minimum and maximum values. The horizontal line within the interquartile range represents the median elevation. Outliers are shown with large, solid circles. Small, individual points overlaid on each boxplot illustrate the distribution of observations.

Figure 8.
Elevation boxplots for Chloroperlidae species recorded from Maryland. Boxes represent the interquartile range, while vertical lines extend to the minimum and maximum values. The horizontal line within the interquartile range represents the median elevation. Outliers are shown with large, solid circles. Small, individual points overlaid on each boxplot illustrate the distribution of observations.

Figure 9.
Elevation boxplots for Leuctridae species recorded from Maryland. Boxes represent the interquartile range, while vertical lines extend to the minimum and maximum values. The horizontal line within the interquartile range represents the median elevation. Outliers are shown with large, solid circles. Small, individual points overlaid on each boxplot illustrate the distribution of observations.

Figure 10.
Elevation boxplots for Nemouridae species recorded from Maryland. Boxes represent the interquartile range, while vertical lines extend to the minimum and maximum values. The horizontal line within the interquartile range represents the median elevation. Outliers are shown with large, solid circles. Small, individual points overlaid on each boxplot illustrate the distribution of observations.

Figure 11.
Elevation boxplots for Peltoperlidae species recorded from Maryland. Boxes represent the interquartile range, while vertical lines extend to the minimum and maximum values. The horizontal line within the interquartile range represents the median elevation. Outliers are shown with large, solid circles. Small, individual points overlaid on each boxplot illustrate the distribution of observations.

Figure 12.
Elevation boxplots for Perlidae species recorded from Maryland. Boxes represent the interquartile range, while vertical lines extend to the minimum and maximum values. The horizontal line within the interquartile range represents the median elevation. Outliers are shown with large, solid circles. Small, individual points overlaid on each boxplot illustrate the distribution of observations.

Figure 13.
Elevation boxplots for Perlodidae species recorded from Maryland. Boxes represent the interquartile range, while vertical lines extend to the minimum and maximum values. The horizontal line within the interquartile range represents the median elevation. Outliers are shown with large, solid circles. Small, individual points overlaid on each boxplot illustrate the distribution of observations.

Figure 14.
Elevation boxplots for Pteronarcyidae species recorded from Maryland. Boxes represent the interquartile range, while vertical lines extend to the minimum and maximum values. The horizontal line within the interquartile range represents the median elevation. Outliers are shown with large, solid circles. Small, individual points overlaid on each boxplot illustrate the distribution of observations.

Figure 15.
Elevation boxplots for Taeniopteryigidae species recorded from Maryland. Boxes represent the interquartile range, while vertical lines extend to the minimum and maximum values. The horizontal line within the interquartile range represents the median elevation. Outliers are shown with large, solid circles. Small, individual points overlaid on each boxplot illustrate the distribution of observations.

Figure 16.
Principal Component Analysis (PCA) of Maryland’s listed Species of Greatest Conservation Need stoneflies with ordination of topographic and climatic variables. Percentage of variation that each PCA axis explains accompanies the x- and y-axes.
Figure 16.
Principal Component Analysis (PCA) of Maryland’s listed Species of Greatest Conservation Need stoneflies with ordination of topographic and climatic variables. Percentage of variation that each PCA axis explains accompanies the x- and y-axes.

Figure 17.
Chao1 species richness estimates for the three most speciose USGS HUC-10s in Maryland. Horizontal lines indicate observed species richness for each USGS HUC-10. For each estimate, 95% confidence intervals are provided. Locations of each selected HUC-10 within the four westernmost counties of Maryland are represented in an inset map.

Figure 18.
Chao1 species richness estimate for Maryland. Black horizontal line indicates current observed species richness (n = 122). A 95% confidence interval is provided.
Figure 18.
Chao1 species richness estimate for Maryland. Black horizontal line indicates current observed species richness (n = 122). A 95% confidence interval is provided.


Table 1.
Sources of Maryland stonefly collection records with institution name or collector, coden, and number of records and species represented from each source.
Table 1.
Sources of Maryland stonefly collection records with institution name or collector, coden, and number of records and species represented from each source.
| Collection Source | Coden | Records | Species |
|---|---|---|---|
| Charles H. Nelson Collection | CHNC | 43 | 9 |
| Carnegie Museum of Natural History | CMNH | 2 | 1 |
| Illinois Natural History Survey | INHS | 250 | 42 |
| Literature Records | 260 | 68 | |
| Maryland Biological Stream Survey 1 | MBSS | 231 | 5 |
| Phillip N. Hogan Collection | PNHC | 58 | 27 |
| Rebecca F. Surdick Collection 2 | RFSC | 154 | 33 |
| United States National Museum | USNM | 61 | 31 |
| Western Kentucky University Collection | WKUC | 3052 | 107 |
| Total | 4084 |
1 Records are for larval stoneflies collected in a statewide biomonitoring sampling protocol, identified to genus. Only monotypic genera were included. 2 Collections are referenced from correspondence between Rebecca Surdick and SAG during the 1990s.
Table 2.
Updated checklist of Maryland stoneflies. New state records species are indicated with an asterisk (*).
Table 2.
Updated checklist of Maryland stoneflies. New state records species are indicated with an asterisk (*).
| Family | Species | Family | Species |
|---|---|---|---|
| Capniidae | Allocapnia aurora | Peltoperlidae | Peltoperla arcuata |
| Allocapnia curiosa | Tallaperla elisa | ||
| Allocapnia frisoni | Tallaperla maria | ||
| Allocapnia frumi | Perlidae | Acroneuria abnormis | |
| Allocapnia granulata | Acroneuria arenosa | ||
| Allocapnia harperi | Acroneuria carolinensis | ||
| Allocapnia illinoensis | Acroneuria filicis | ||
| Allocapnia maria | Acroneuria frisoni | ||
| Allocapnia nivicola | Acroneuria lycorias | ||
| Allocapnia pygmaea | Agnetina annulipes | ||
| Allocapnia recta | Agnetina capitata | ||
| Allocapnia rickeri | Agnetina flavescens | ||
| Allocapnia simmonsi * | Attaneuria ruralis | ||
| Allocapnia virginiana * | Eccoptura xanthenes | ||
| Allocapnia vivipara | Hansonoperla appalachia | ||
| Allocapnia wrayi | Neoperla catharae | ||
| Allocapnia zola | Neoperla robisoni | ||
| Paracapnia angulata | Neoperla stewarti | ||
| Chloroperlidae | Alloperla aracoma | Paragnetina immarginata | |
| Alloperla atlantica | Paragnetina media | ||
| Alloperla biserrata | Perlesta ephelida | ||
| Alloperla chloris | Perlesta mihucorum | ||
| Alloperla imbecilla | Perlesta nelsoni | ||
| Alloperla petasata * | Perlesta placida | ||
| Alloperla usa | Perlesta teaysia | ||
| Haploperla brevis | Perlesta sp. MD-5 | ||
| Suwalia marginata | Perlinella drymo | ||
| Sweltsa hoffmani | Perlinella ephyre | ||
| Sweltsa lateralis | Perlodidae | Clioperla clio | |
| Sweltsa onkos | Cultus verticalis | ||
| Sweltsa palearata | Diploperla duplicata | ||
| Sweltsa pocahontas | Diploperla robusta | ||
| Utaperla gaspesiana | Helopicus subvarians * | ||
| Leuctridae | Leuctra alexanderi | Isogenoides hansoni | |
| Leuctra carolinensis | Isoperla burksi | ||
| Leuctra duplicata | Isoperla davisi * | ||
| Leuctra ferruginea | Isoperla dicala | ||
| Leuctra grandis | Isoperla gibbsae | ||
| Leuctra rickeri | Isoperla holochlora | ||
| Leuctra sibleyi | Isoperla kirchneri | ||
| Leuctra tenella | Isoperla montana | ||
| Leuctra tenuis | Isoperla nelsoni * | ||
| Leuctra truncata * | Isoperla pseudosimilis | ||
| Leuctra variabilis | Isoperla similis | ||
| Megaleuctra flinti | Malirekus iroquois | ||
| Paraleuctra sara | Remenus bilobatus | ||
| Nemouridae | Amphinemura delosa | Yugus kirchneri | |
| Amphinemura nigritta | Pteronarcyidae | Pteronarcys biloba | |
| Amphinemura wui | Pteronarcys dorsata | ||
| Ostrocerca albidipennis | Pteronarcys proteus | ||
| Ostrocerca complexa | Taeniopterygidae | Bolotoperla rossi * | |
| Ostrocerca truncata | Oemopteryx contorta | ||
| Paranemoura perfecta | Strophopteryx appalachia | ||
| Prostoia completa | Strophopteryx fasciata | ||
| Prostoia similis | Taenionema atlanticum | ||
| Shipsa rotunda | Taeniopteryx burksi | ||
| Soyedina carolinensis | Taeniopteryx lonicera | ||
| Soyedina kondratieffi | Taeniopteryx maura | ||
| Soyedina vallicularia | Taeniopteryx metequi | ||
| Soyedina washingtoni | Taeniopteryx nivalis | ||
| Taeniopteryx parvula |
Table 3.
Recorded adult presence for Maryland stonefly families. Months are broken into three 10-day periods. Dark blue squares represent periods with positive collection data. Gray squares represent periods between positive collections when species may be collected.
Table 3.
Recorded adult presence for Maryland stonefly families. Months are broken into three 10-day periods. Dark blue squares represent periods with positive collection data. Gray squares represent periods between positive collections when species may be collected.
| Jan | Feb | Mar | Apr | May | Jun | Jul | Aug | Sept | Oct | Nov | Dec | |||||||||||||||||||||||||
|---|---|---|---|---|---|---|---|---|---|---|---|---|---|---|---|---|---|---|---|---|---|---|---|---|---|---|---|---|---|---|---|---|---|---|---|---|
| Family | 1 | 2 | 3 | 1 | 2 | 3 | 1 | 2 | 3 | 1 | 2 | 3 | 1 | 2 | 3 | 1 | 2 | 3 | 1 | 2 | 3 | 1 | 2 | 3 | 1 | 2 | 3 | 1 | 2 | 3 | 1 | 2 | 3 | 1 | 2 | 3 |
| Leuctridae | ||||||||||||||||||||||||||||||||||||
| Capniidae | ||||||||||||||||||||||||||||||||||||
| Taeniopterygidae | ||||||||||||||||||||||||||||||||||||
| Nemouridae | ||||||||||||||||||||||||||||||||||||
| Perlodidae | ||||||||||||||||||||||||||||||||||||
| Pteronarcyidae | ||||||||||||||||||||||||||||||||||||
| Chloroperlidae | ||||||||||||||||||||||||||||||||||||
| Perlidae | ||||||||||||||||||||||||||||||||||||
| Peltoperlidae | ||||||||||||||||||||||||||||||||||||
Table 4.
Recorded adult Capniidae presence in Maryland. Months are broken into three 10-day periods. Dark blue squares represent periods with collections. Gray squares represent periods when species may be collected.
Table 4.
Recorded adult Capniidae presence in Maryland. Months are broken into three 10-day periods. Dark blue squares represent periods with collections. Gray squares represent periods when species may be collected.
| Nov | Dec | Jan | Feb | Mar | Apr | May | |||||||||||||||
|---|---|---|---|---|---|---|---|---|---|---|---|---|---|---|---|---|---|---|---|---|---|
| Species | 1 | 2 | 3 | 1 | 2 | 3 | 1 | 2 | 3 | 1 | 2 | 3 | 1 | 2 | 3 | 1 | 2 | 3 | 1 | 2 | 3 |
| Allocapnia nivicola | 1 | 1 | 1 | 1 | |||||||||||||||||
| Allocapnia wrayi | 1 | 1 | 1 | 1 | |||||||||||||||||
| Allocapnia granulata | |||||||||||||||||||||
| Allocapnia recta | |||||||||||||||||||||
| Allocapnia virginiana | |||||||||||||||||||||
| Allocapnia rickeri | |||||||||||||||||||||
| Allocapnia pygmaea | |||||||||||||||||||||
| Allocapnia frisoni | |||||||||||||||||||||
| Allocapnia curiosa | |||||||||||||||||||||
| Allocapnia illinoensis | |||||||||||||||||||||
| Allocapnia maria | |||||||||||||||||||||
| Allocapnia aurora | |||||||||||||||||||||
| Allocapnia zola | |||||||||||||||||||||
| Allocapnia frumi | |||||||||||||||||||||
| Allocapnia simmonsi | |||||||||||||||||||||
| Allocapnia harperi | |||||||||||||||||||||
| Paracapnia angulata | |||||||||||||||||||||
| Allocapnia vivipara | |||||||||||||||||||||
Table 5.
Recorded adult Chloroperlidae presence in Maryland. Months are broken into three 10-day periods. Dark blue squares represent periods with collections. Gray squares represent periods when species may be collected.
Table 5.
Recorded adult Chloroperlidae presence in Maryland. Months are broken into three 10-day periods. Dark blue squares represent periods with collections. Gray squares represent periods when species may be collected.
| Apr | May | Jun | Jul | Aug | |||||||||||
|---|---|---|---|---|---|---|---|---|---|---|---|---|---|---|---|
| Species | 1 | 2 | 3 | 1 | 2 | 3 | 1 | 2 | 3 | 1 | 2 | 3 | 1 | 2 | 3 |
| Sweltsa pocahontas | |||||||||||||||
| Haploperla brevis | |||||||||||||||
| Sweltsa palearata | |||||||||||||||
| Utaperla gaspesiana | |||||||||||||||
| Sweltsa hoffmani | |||||||||||||||
| Sweltsa onkos | |||||||||||||||
| Alloperla imbecilla | |||||||||||||||
| Sweltsa lateralis | |||||||||||||||
| Alloperla biserrata | |||||||||||||||
| Alloperla aracoma | |||||||||||||||
| Alloperla usa | |||||||||||||||
| Alloperla atlantica | |||||||||||||||
| Alloperla petasata | |||||||||||||||
| Alloperla chloris | |||||||||||||||
| Suwallia marginata | |||||||||||||||
Table 6.
Recorded adult Leuctridae presence in Maryland. Months are broken into three 10-day periods. Dark blue squares represent periods with collections. Gray squares represent periods when species may be collected.
Table 6.
Recorded adult Leuctridae presence in Maryland. Months are broken into three 10-day periods. Dark blue squares represent periods with collections. Gray squares represent periods when species may be collected.
| Jan | Feb | Mar | Apr | May | Jun | Jul | Aug | Sept | Oct | Nov | Dec | |||||||||||||||||||||||||
|---|---|---|---|---|---|---|---|---|---|---|---|---|---|---|---|---|---|---|---|---|---|---|---|---|---|---|---|---|---|---|---|---|---|---|---|---|
| Species | 1 | 2 | 3 | 1 | 2 | 3 | 1 | 2 | 3 | 1 | 2 | 3 | 1 | 2 | 3 | 1 | 2 | 3 | 1 | 2 | 3 | 1 | 2 | 3 | 1 | 2 | 3 | 1 | 2 | 3 | 1 | 2 | 3 | 1 | 2 | 3 |
| Paraleuctra sara | ||||||||||||||||||||||||||||||||||||
| Leuctra ferruginea | ||||||||||||||||||||||||||||||||||||
| Leuctra duplicata | ||||||||||||||||||||||||||||||||||||
| Leuctra sibleyi | ||||||||||||||||||||||||||||||||||||
| Megaleuctra flinti | ||||||||||||||||||||||||||||||||||||
| Leuctra alexanderi | ||||||||||||||||||||||||||||||||||||
| Leuctra grandis | ||||||||||||||||||||||||||||||||||||
| Leuctra tenella | ||||||||||||||||||||||||||||||||||||
| Leuctra carolinensis | ||||||||||||||||||||||||||||||||||||
| Leuctra rickeri | ||||||||||||||||||||||||||||||||||||
| Leuctra variabilis | ||||||||||||||||||||||||||||||||||||
| Leuctra tenuis | ||||||||||||||||||||||||||||||||||||
Table 7.
Recorded adult Nemouridae presence in Maryland. Months are broken into three 10-day periods. Dark blue squares represent periods with collections. Gray squares represent periods when species may be collected.
Table 7.
Recorded adult Nemouridae presence in Maryland. Months are broken into three 10-day periods. Dark blue squares represent periods with collections. Gray squares represent periods when species may be collected.
| Feb | Mar | Apr | May | Jun | Jul | Aug | Sept | |||||||||||||||||
|---|---|---|---|---|---|---|---|---|---|---|---|---|---|---|---|---|---|---|---|---|---|---|---|---|
| Species | 1 | 2 | 3 | 1 | 2 | 3 | 1 | 2 | 3 | 1 | 2 | 3 | 1 | 2 | 3 | 1 | 2 | 3 | 1 | 2 | 3 | 1 | 2 | 3 |
| Prostoia completa | ||||||||||||||||||||||||
| Shipsa rotunda | ||||||||||||||||||||||||
| Soyedina washingtoni | ||||||||||||||||||||||||
| Soyedina vallicularia | ||||||||||||||||||||||||
| Paranemoura perfecta | ||||||||||||||||||||||||
| Prostoia similis | ||||||||||||||||||||||||
| Soyedina carolinensis | ||||||||||||||||||||||||
| Amphinemura wui | ||||||||||||||||||||||||
| Soyedina kondratieffi | ||||||||||||||||||||||||
| Ostrocerca truncata | ||||||||||||||||||||||||
| Ostrocerca albidipennis | ||||||||||||||||||||||||
| Amphinemura nigritta | ||||||||||||||||||||||||
| Ostrocerca complexa | ||||||||||||||||||||||||
| Amphinemura delosa | ||||||||||||||||||||||||
Table 8.
Recorded adult Peltoperlidae presence in Maryland. Months are broken into three 10-day periods. Dark blue squares represent periods with collections. Gray squares represent periods when species may be collected.
Table 8.
Recorded adult Peltoperlidae presence in Maryland. Months are broken into three 10-day periods. Dark blue squares represent periods with collections. Gray squares represent periods when species may be collected.
| May | Jun | Jul | Aug | |||||||||
|---|---|---|---|---|---|---|---|---|---|---|---|---|
| Species | 1 | 2 | 3 | 1 | 2 | 3 | 1 | 2 | 3 | 1 | 2 | 3 |
| Tallaperla maria | ||||||||||||
| Peltoperla arcuata | ||||||||||||
Table 9.
Recorded adult Perlidae presence in Maryland. Months are broken into three 10-day periods. Dark blue squares represent periods with collections. Gray squares represent periods when species may be collected.
Table 9.
Recorded adult Perlidae presence in Maryland. Months are broken into three 10-day periods. Dark blue squares represent periods with collections. Gray squares represent periods when species may be collected.
| Apr | May | Jun | Jul | Aug | Sept | |||||||||||||
|---|---|---|---|---|---|---|---|---|---|---|---|---|---|---|---|---|---|---|
| Species | 1 | 2 | 3 | 1 | 2 | 3 | 1 | 2 | 3 | 1 | 2 | 3 | 1 | 2 | 3 | 1 | 2 | 3 |
| Acroneuria lycorias | ||||||||||||||||||
| Hansonoperla appalachia | ||||||||||||||||||
| Acroneuria carolinensis | ||||||||||||||||||
| Agnetina capitata | ||||||||||||||||||
| Acroneuria abnormis | ||||||||||||||||||
| Acroneuria frisoni | ||||||||||||||||||
| Agnetina flavescens | ||||||||||||||||||
| Perlesta mihucorum | ||||||||||||||||||
| Agnetina annulipes | ||||||||||||||||||
| Acroneuria arenosa | ||||||||||||||||||
| Perlesta ephelida | ||||||||||||||||||
| Attaneuria ruralis | ||||||||||||||||||
| Eccoptura xanthenes | ||||||||||||||||||
| Perlinella ephyre | ||||||||||||||||||
| Neoperla stewarti | ||||||||||||||||||
| Perlesta placida | ||||||||||||||||||
| Perlesta teaysia | ||||||||||||||||||
| Paragnetina media | ||||||||||||||||||
| Neoperla robisoni | ||||||||||||||||||
| Paragnetina immarginata | ||||||||||||||||||
| Perlesta MD-5 | ||||||||||||||||||
| Perlesta nelsoni | ||||||||||||||||||
| Acroneuria filicis | ||||||||||||||||||
| Neoperla catharae | ||||||||||||||||||
Table 10.
Recorded adult Perlodidae presence in Maryland. Months are broken into three 10-day periods. Dark blue squares represent periods with collections. Gray squares represent periods when species may be collected.
Table 10.
Recorded adult Perlodidae presence in Maryland. Months are broken into three 10-day periods. Dark blue squares represent periods with collections. Gray squares represent periods when species may be collected.
| Mar | Apr | May | Jun | Jul | Aug | Sept | |||||||||||||||
|---|---|---|---|---|---|---|---|---|---|---|---|---|---|---|---|---|---|---|---|---|---|
| Species | 1 | 2 | 3 | 1 | 2 | 3 | 1 | 2 | 3 | 1 | 2 | 3 | 1 | 2 | 3 | 1 | 2 | 3 | 1 | 2 | 3 |
| Clioperla clio | |||||||||||||||||||||
| Helopicus subvarians | |||||||||||||||||||||
| Isoperla similis | |||||||||||||||||||||
| Diploperla robusta | |||||||||||||||||||||
| Isoperla pseudosimilis | |||||||||||||||||||||
| Isoperla montana | |||||||||||||||||||||
| Malirekus iroquois | |||||||||||||||||||||
| Isoperla dicala | |||||||||||||||||||||
| Isoperla kirchneri | |||||||||||||||||||||
| Yugus kirchneri | |||||||||||||||||||||
| Isoperla holochlora | |||||||||||||||||||||
| Remenus bilobatus | |||||||||||||||||||||
| Diploperla duplicata | |||||||||||||||||||||
| Isoperla davisi | |||||||||||||||||||||
| Isoperla burksi | |||||||||||||||||||||
| Cultus verticalis | |||||||||||||||||||||
| Isoperla nelsoni | |||||||||||||||||||||
Table 11.
Recorded adult Pteronarcyidae presence in Maryland. Months are broken into three 10-day periods. Dark blue squares represent periods with collections. Gray squares represent periods when species may be collected.
Table 11.
Recorded adult Pteronarcyidae presence in Maryland. Months are broken into three 10-day periods. Dark blue squares represent periods with collections. Gray squares represent periods when species may be collected.
| Mar | Apr | May | Jun | Jul | |||||||||||
|---|---|---|---|---|---|---|---|---|---|---|---|---|---|---|---|
| Species | 1 | 2 | 3 | 1 | 2 | 3 | 1 | 2 | 3 | 1 | 2 | 3 | 1 | 2 | 3 |
| Pteronarcys proteus | |||||||||||||||
| Pteronarcys biloba | |||||||||||||||
| Pteronarcys dorsata | |||||||||||||||
Table 12.
Recorded adult Taeniopterygidae presence in Maryland. Months are broken into three 10-day periods. Dark blue squares represent periods with collections. Gray squares represent periods when species may be collected.
Table 12.
Recorded adult Taeniopterygidae presence in Maryland. Months are broken into three 10-day periods. Dark blue squares represent periods with collections. Gray squares represent periods when species may be collected.
| Dec | Jan | Feb | Mar | Apr | May | |||||||||||||
|---|---|---|---|---|---|---|---|---|---|---|---|---|---|---|---|---|---|---|
| Species | 1 | 2 | 3 | 1 | 2 | 3 | 1 | 2 | 3 | 1 | 2 | 3 | 1 | 2 | 3 | 1 | 2 | 3 |
| Taeniopteryx lonicera | ||||||||||||||||||
| Taeniopteryx nivalis | ||||||||||||||||||
| Taeniopteryx maura | ||||||||||||||||||
| Taeniopteryx burksi | ||||||||||||||||||
| Taeniopteryx parvula | ||||||||||||||||||
| Strophopteryx fasciata | ||||||||||||||||||
| Taeniopteryx ugola | ||||||||||||||||||
| Taeniopteryx metequi | ||||||||||||||||||
| Oemopteryx contorta | ||||||||||||||||||
| Strophopteryx appalachia | ||||||||||||||||||
| Taenionema atlanticum | ||||||||||||||||||
Table 13.
Maryland Species of Greatest Conservation Need (SGCN)-listed stoneflies. USGS Hydrologic Unit Code (HUC)-8 drainage basins where species are known to be present are noted in addition to the number of available Maryland records. Elevation data of unique collection localities within Maryland are provided per species.
| Family | Species | HUC-8 Present | Occurrence Records | Elevation Range (m ASL) |
|---|---|---|---|---|
| Chloroperlidae | Alloperla aracoma | 02070002 | 14 | 483–676 |
| Alloperla biserrata | 02070003 | 17 | 167–395 | |
| Sweltsa palearata | 02070003 | 37 | 161–338 | |
| Sweltsa pocahontas | 02070002 | 15 | 515–742 | |
| Utaperla gaspesiana | 02070002 | 1 | 456 | |
| Leuctridae | Megaleuctra flinti | 05020006, 02070002 | 22 | 463–814 |
Table 14.
Stonefly Species of Greatest Conservation Need (SGCNs) listed in USA states adjacent to Maryland with recorded presence within Maryland yet are not listed on the Maryland State Wildlife Action Plan (SWAP). USGS Hydrologic Unit Code (HUC)-8 basins with known Maryland presence are indicated. Number of Maryland records and elevation of collection localities are provided. State abbreviations are as follows: Delaware (DE), Pennsylvania (PA), Virginia (VA), and West Virginia (WV).
| Family | Species | MD HUC-8 Present | States with SGCN status | Occurrence Records | Elevation Range (m ASL) |
|---|---|---|---|---|---|
| Capniidae | Allocapnia frumi | 05020006 | WV | 4 | 756–769 |
| Allocapnia harperi | 02070002 | PA | 20 | 418–828 | |
| Allocapnia illinoensis | 02070002 | VA | 4 | 170–768 | |
| Allocapnia simmonsi | 02070004 | PA and VA | 2 | 123 | |
| Leuctridae | Leuctra variabilis | 02060004, 02070010, and 02070011 | PA | 6 | 36–76 |
| Nemouridae | Ostrocerca complexa | 02070002 | VA, WV | 13 | 466–687 |
| Perlidae | Attaneuria ruralis | 02070003, 02070004, 02070008, and 05020006 | VA | 7 | 30–118 |
| Hansonoperla appalachia | 02070002 | PA, VA, and WV | 2 | 456 | |
| Perlinella drymo | 02070008 | PA | 1 | 30 | |
| Taeniopterygidae | Bolotoperla rossi | 05020006 | VA | 2 | 663–700 |
Publisher’s Note: MDPI stays neutral with regard to jurisdictional claims in published maps and institutional affiliations. |
© 2022 by the authors. Licensee MDPI, Basel, Switzerland. This article is an open access article distributed under the terms and conditions of the Creative Commons Attribution (CC BY) license (https://creativecommons.org/licenses/by/4.0/).
Share and Cite
MDPI and ACS Style
Hogan, P.N.; Grubbs, S.A. Distributional Trends and Species Richness of Maryland, USA, Stoneflies (Insecta: Plecoptera), with an Emphasis on the Appalachian Region. Ecologies 2022, 3, 395-421. https://doi.org/10.3390/ecologies3030029
AMA Style
Hogan PN, Grubbs SA. Distributional Trends and Species Richness of Maryland, USA, Stoneflies (Insecta: Plecoptera), with an Emphasis on the Appalachian Region. Ecologies. 2022; 3(3):395-421. https://doi.org/10.3390/ecologies3030029
Chicago/Turabian StyleHogan, Phillip N., and Scott A. Grubbs. 2022. "Distributional Trends and Species Richness of Maryland, USA, Stoneflies (Insecta: Plecoptera), with an Emphasis on the Appalachian Region" Ecologies 3, no. 3: 395-421. https://doi.org/10.3390/ecologies3030029