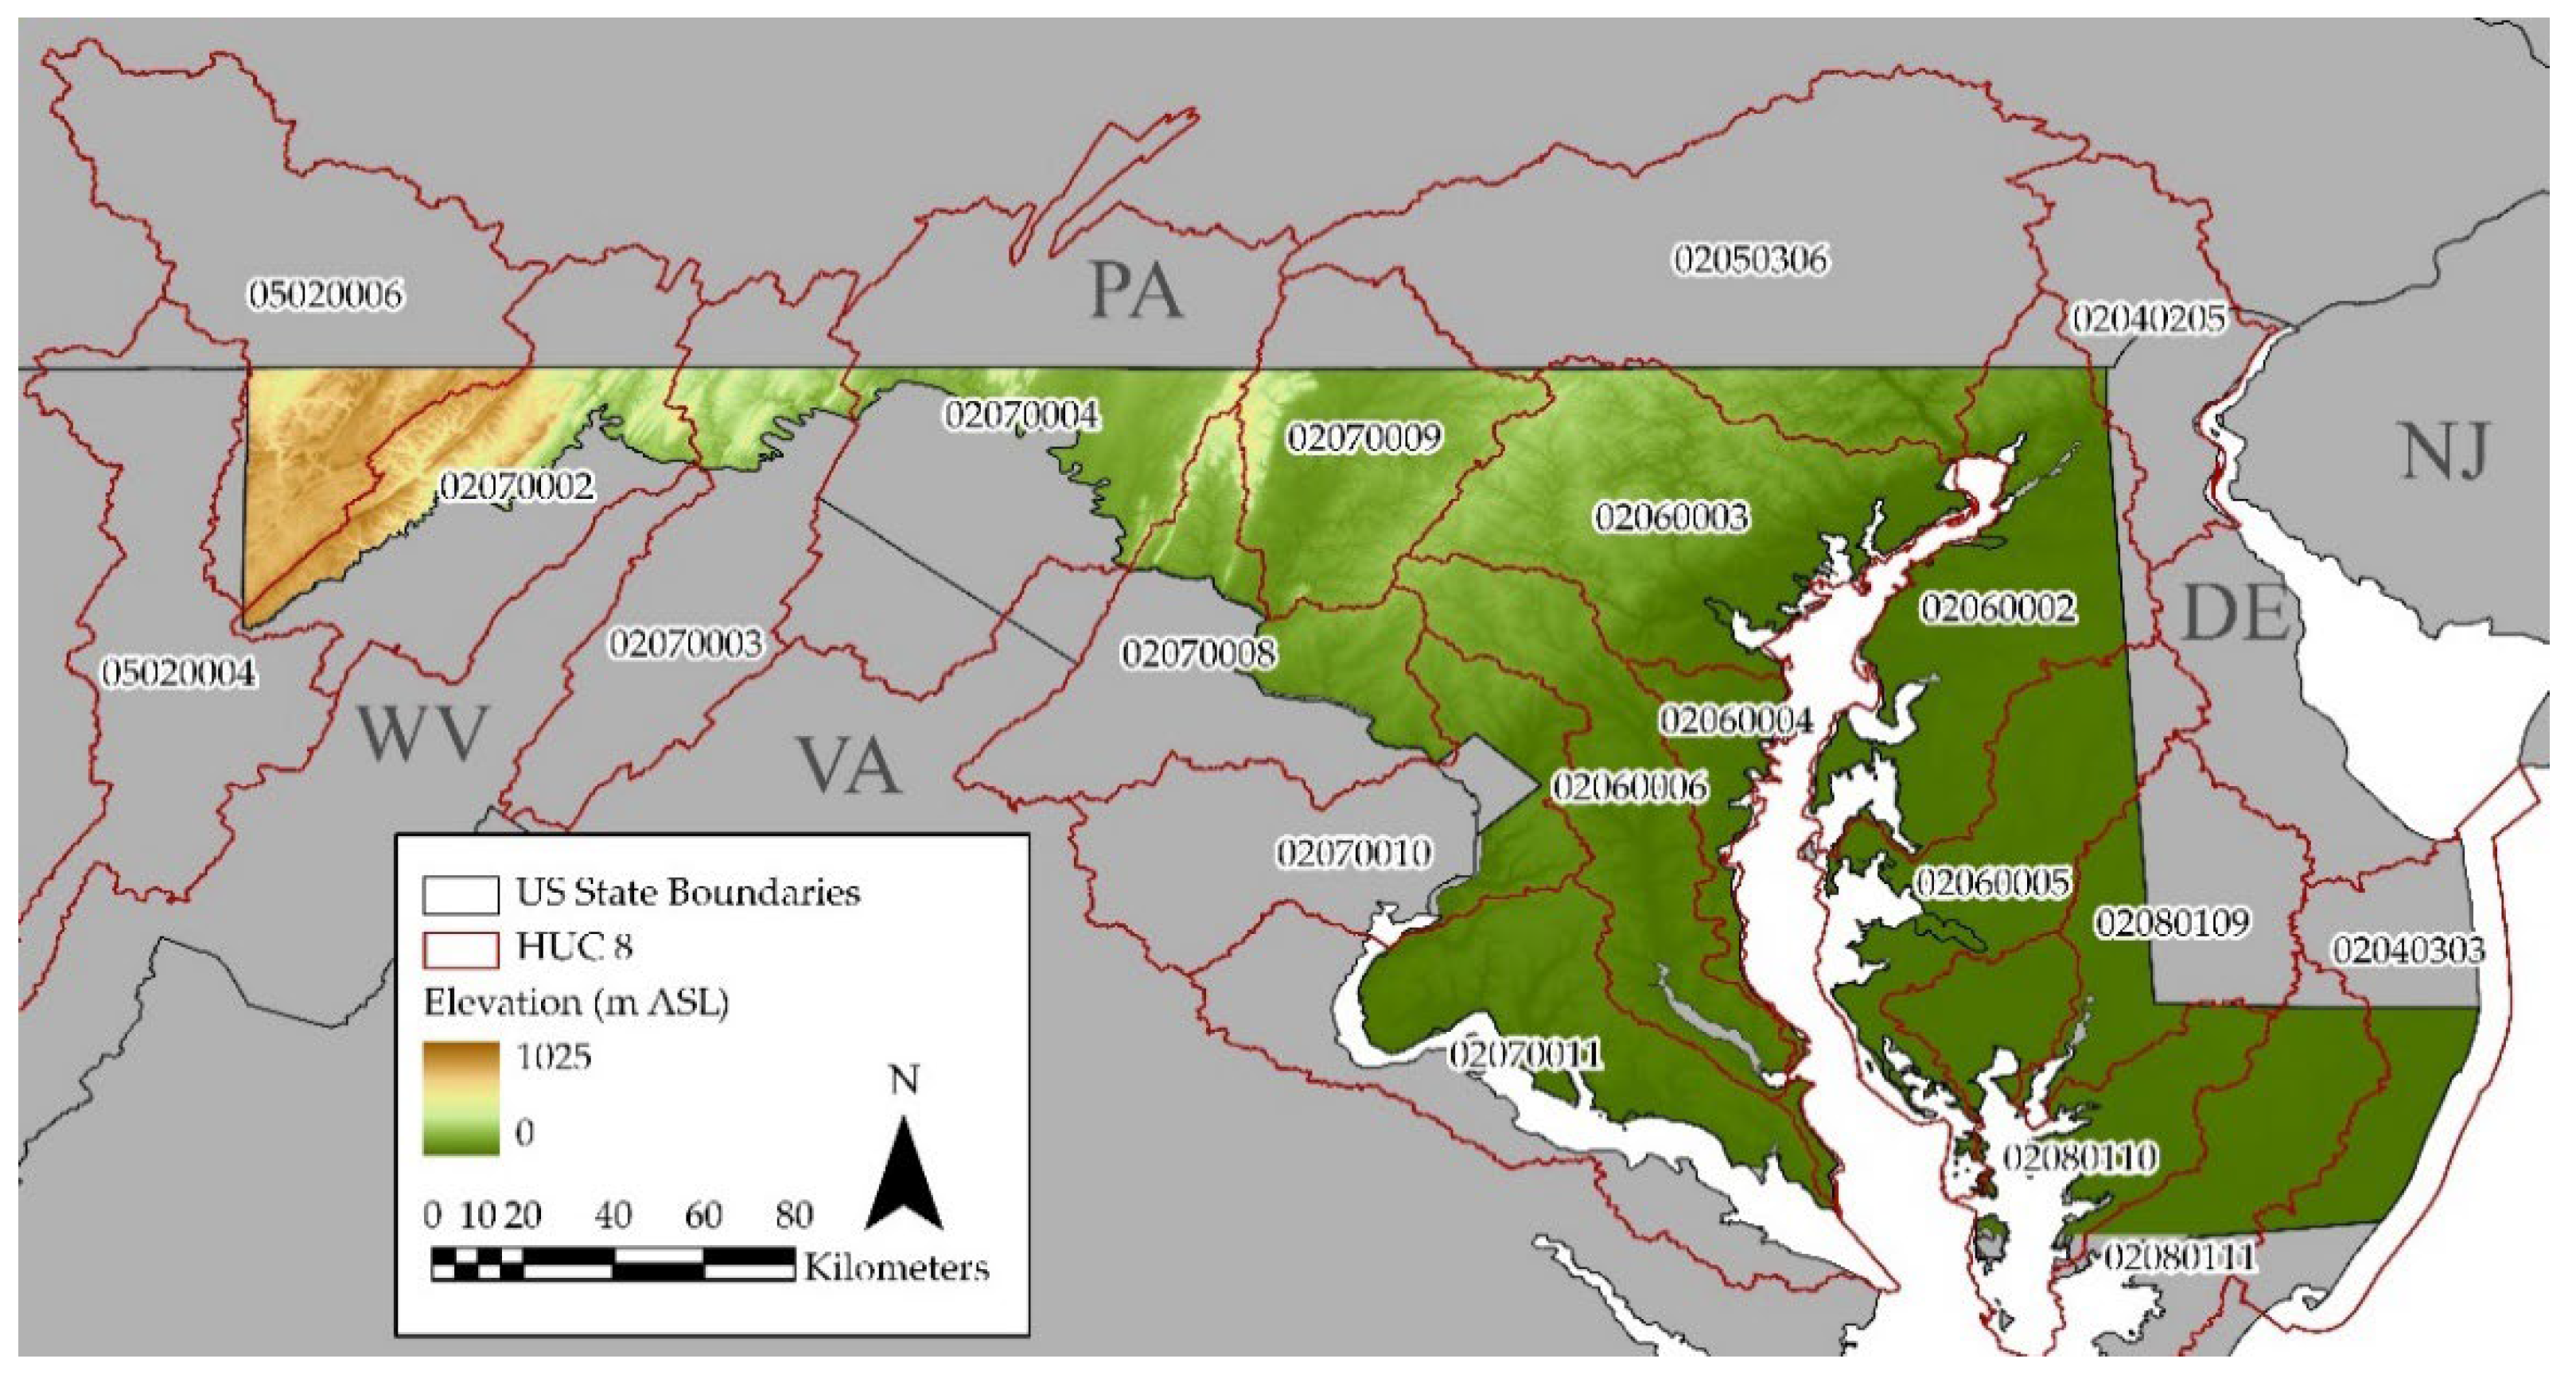
Figure 1.
Surface topography of Maryland with United States Geological Survey Hydrologic Unit Code (HUC)-8 watersheds of Maryland overlaid.
Figure 1.
Surface topography of Maryland with United States Geological Survey Hydrologic Unit Code (HUC)-8 watersheds of Maryland overlaid.
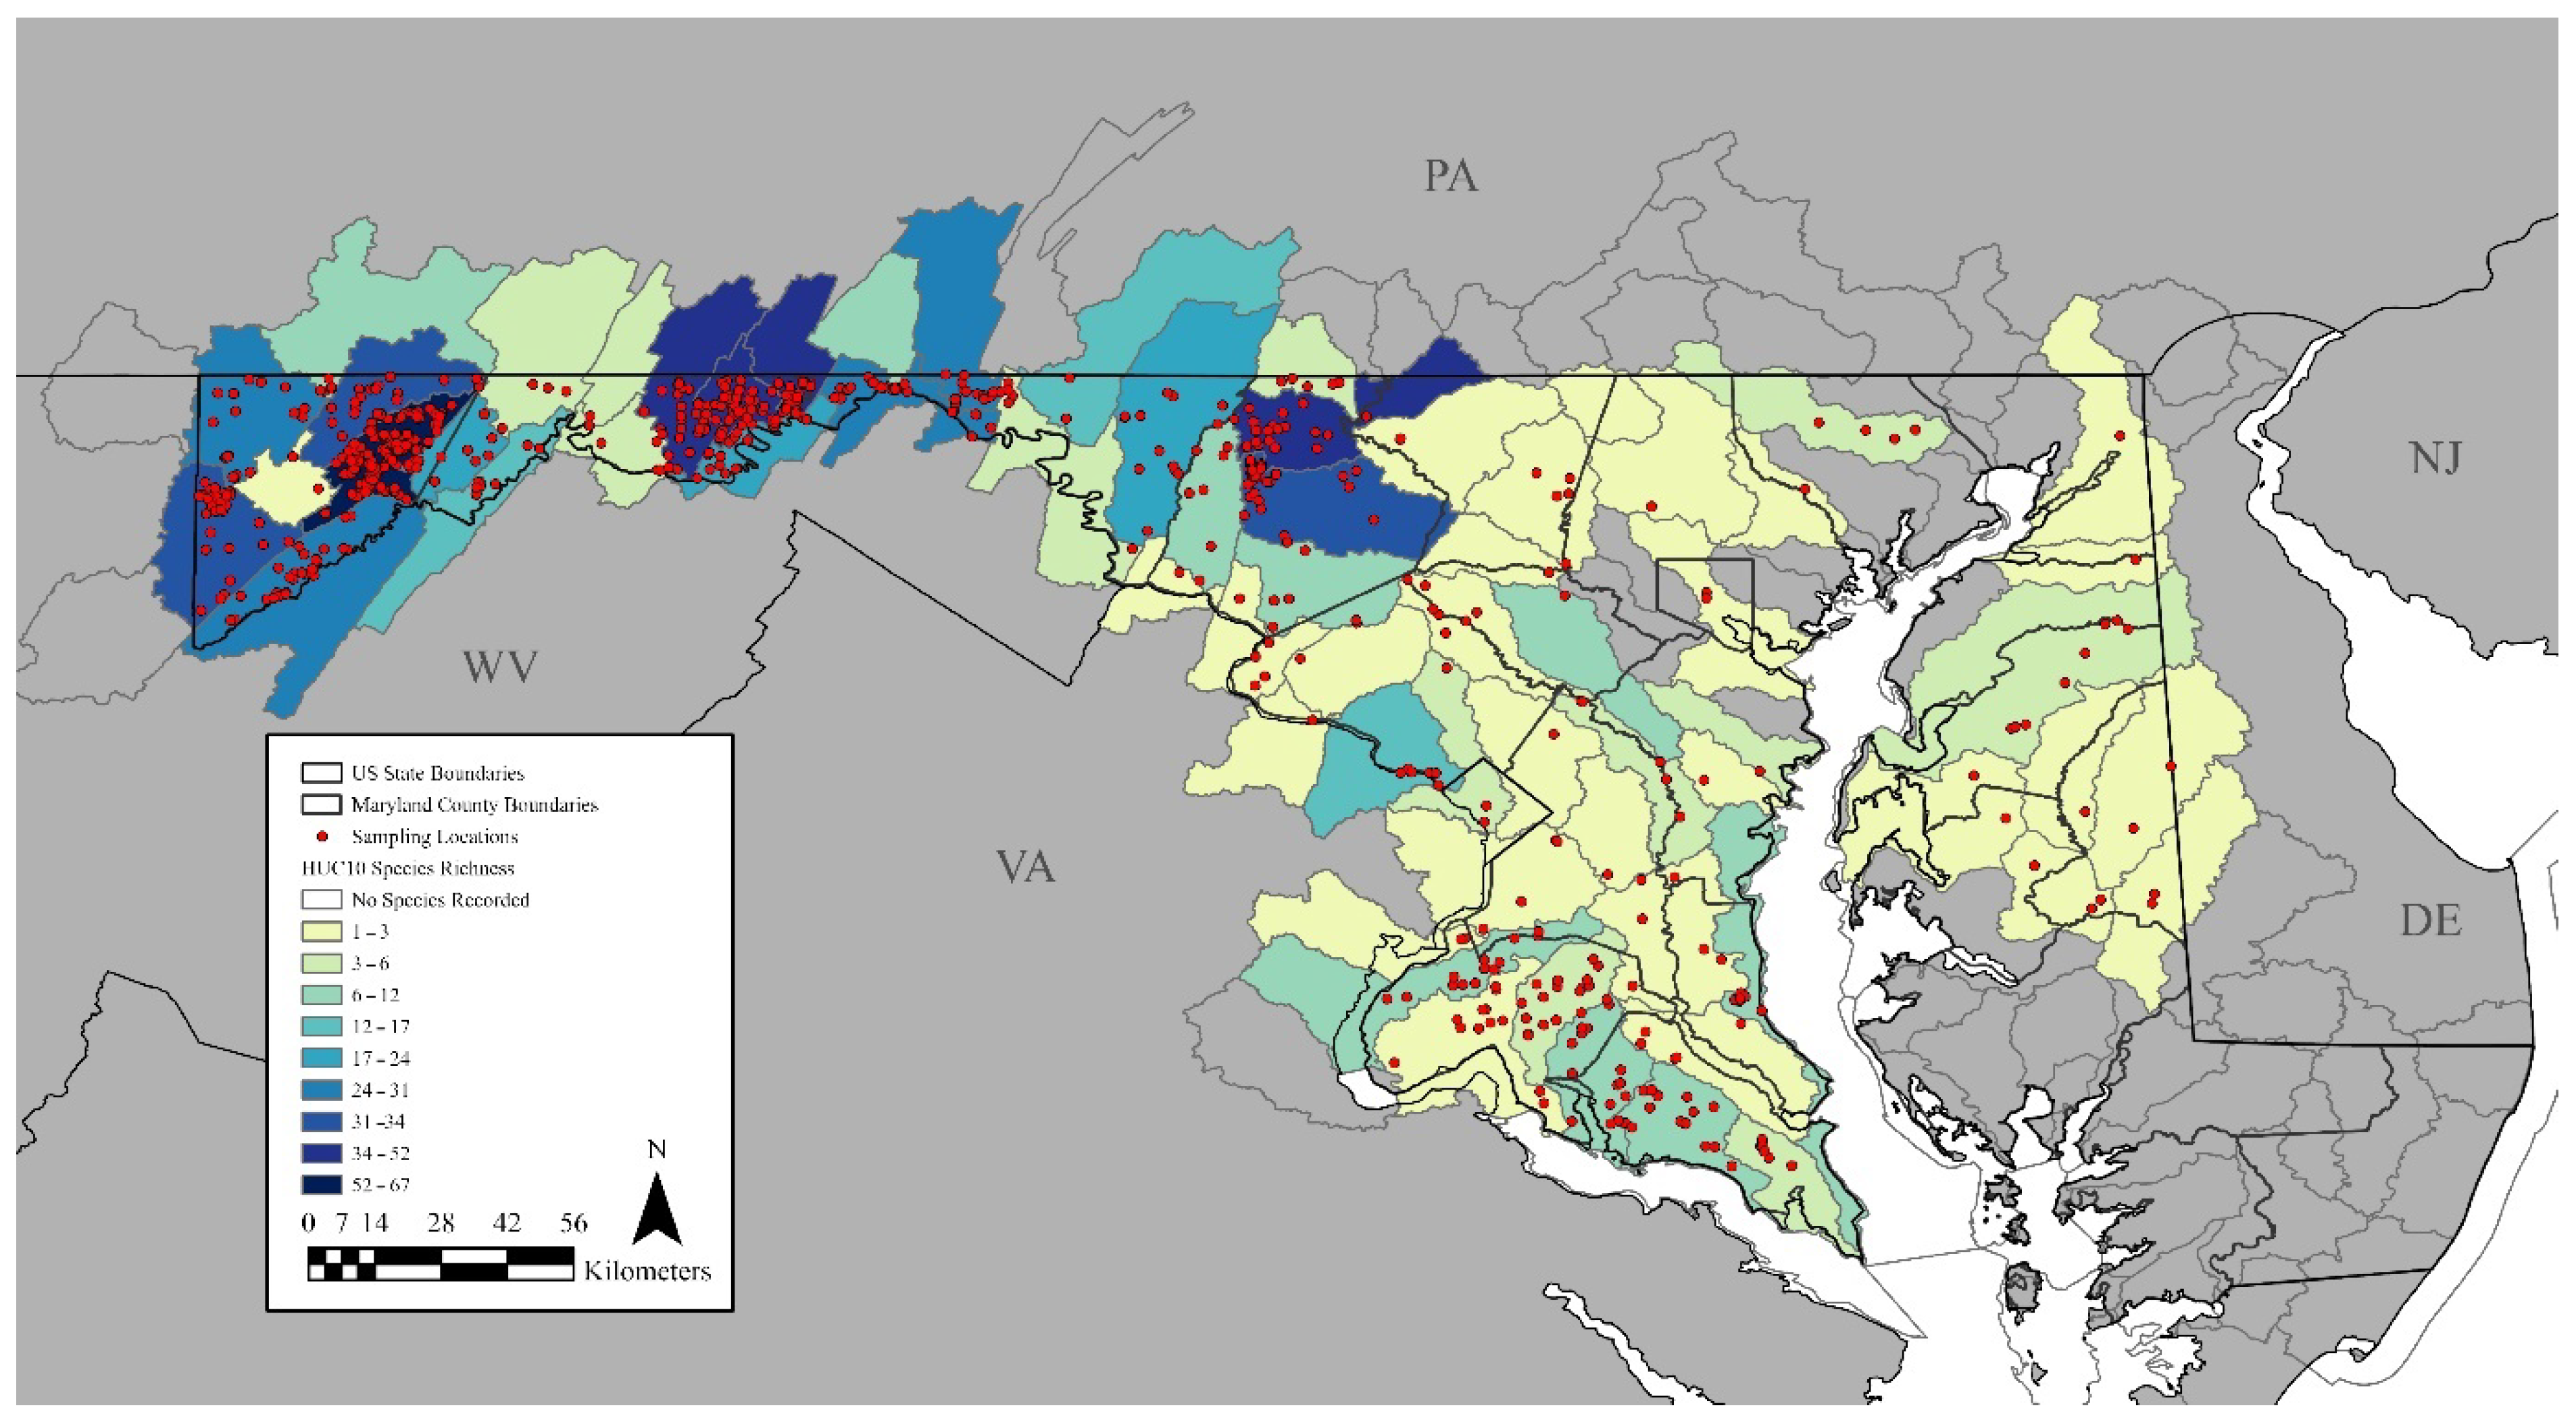
Figure 2.
Species richness for United States Geological Survey Hydrologic Unit Code (HUC)-10 catchments of Maryland with georeferenced collection locations.
Figure 2.
Species richness for United States Geological Survey Hydrologic Unit Code (HUC)-10 catchments of Maryland with georeferenced collection locations.
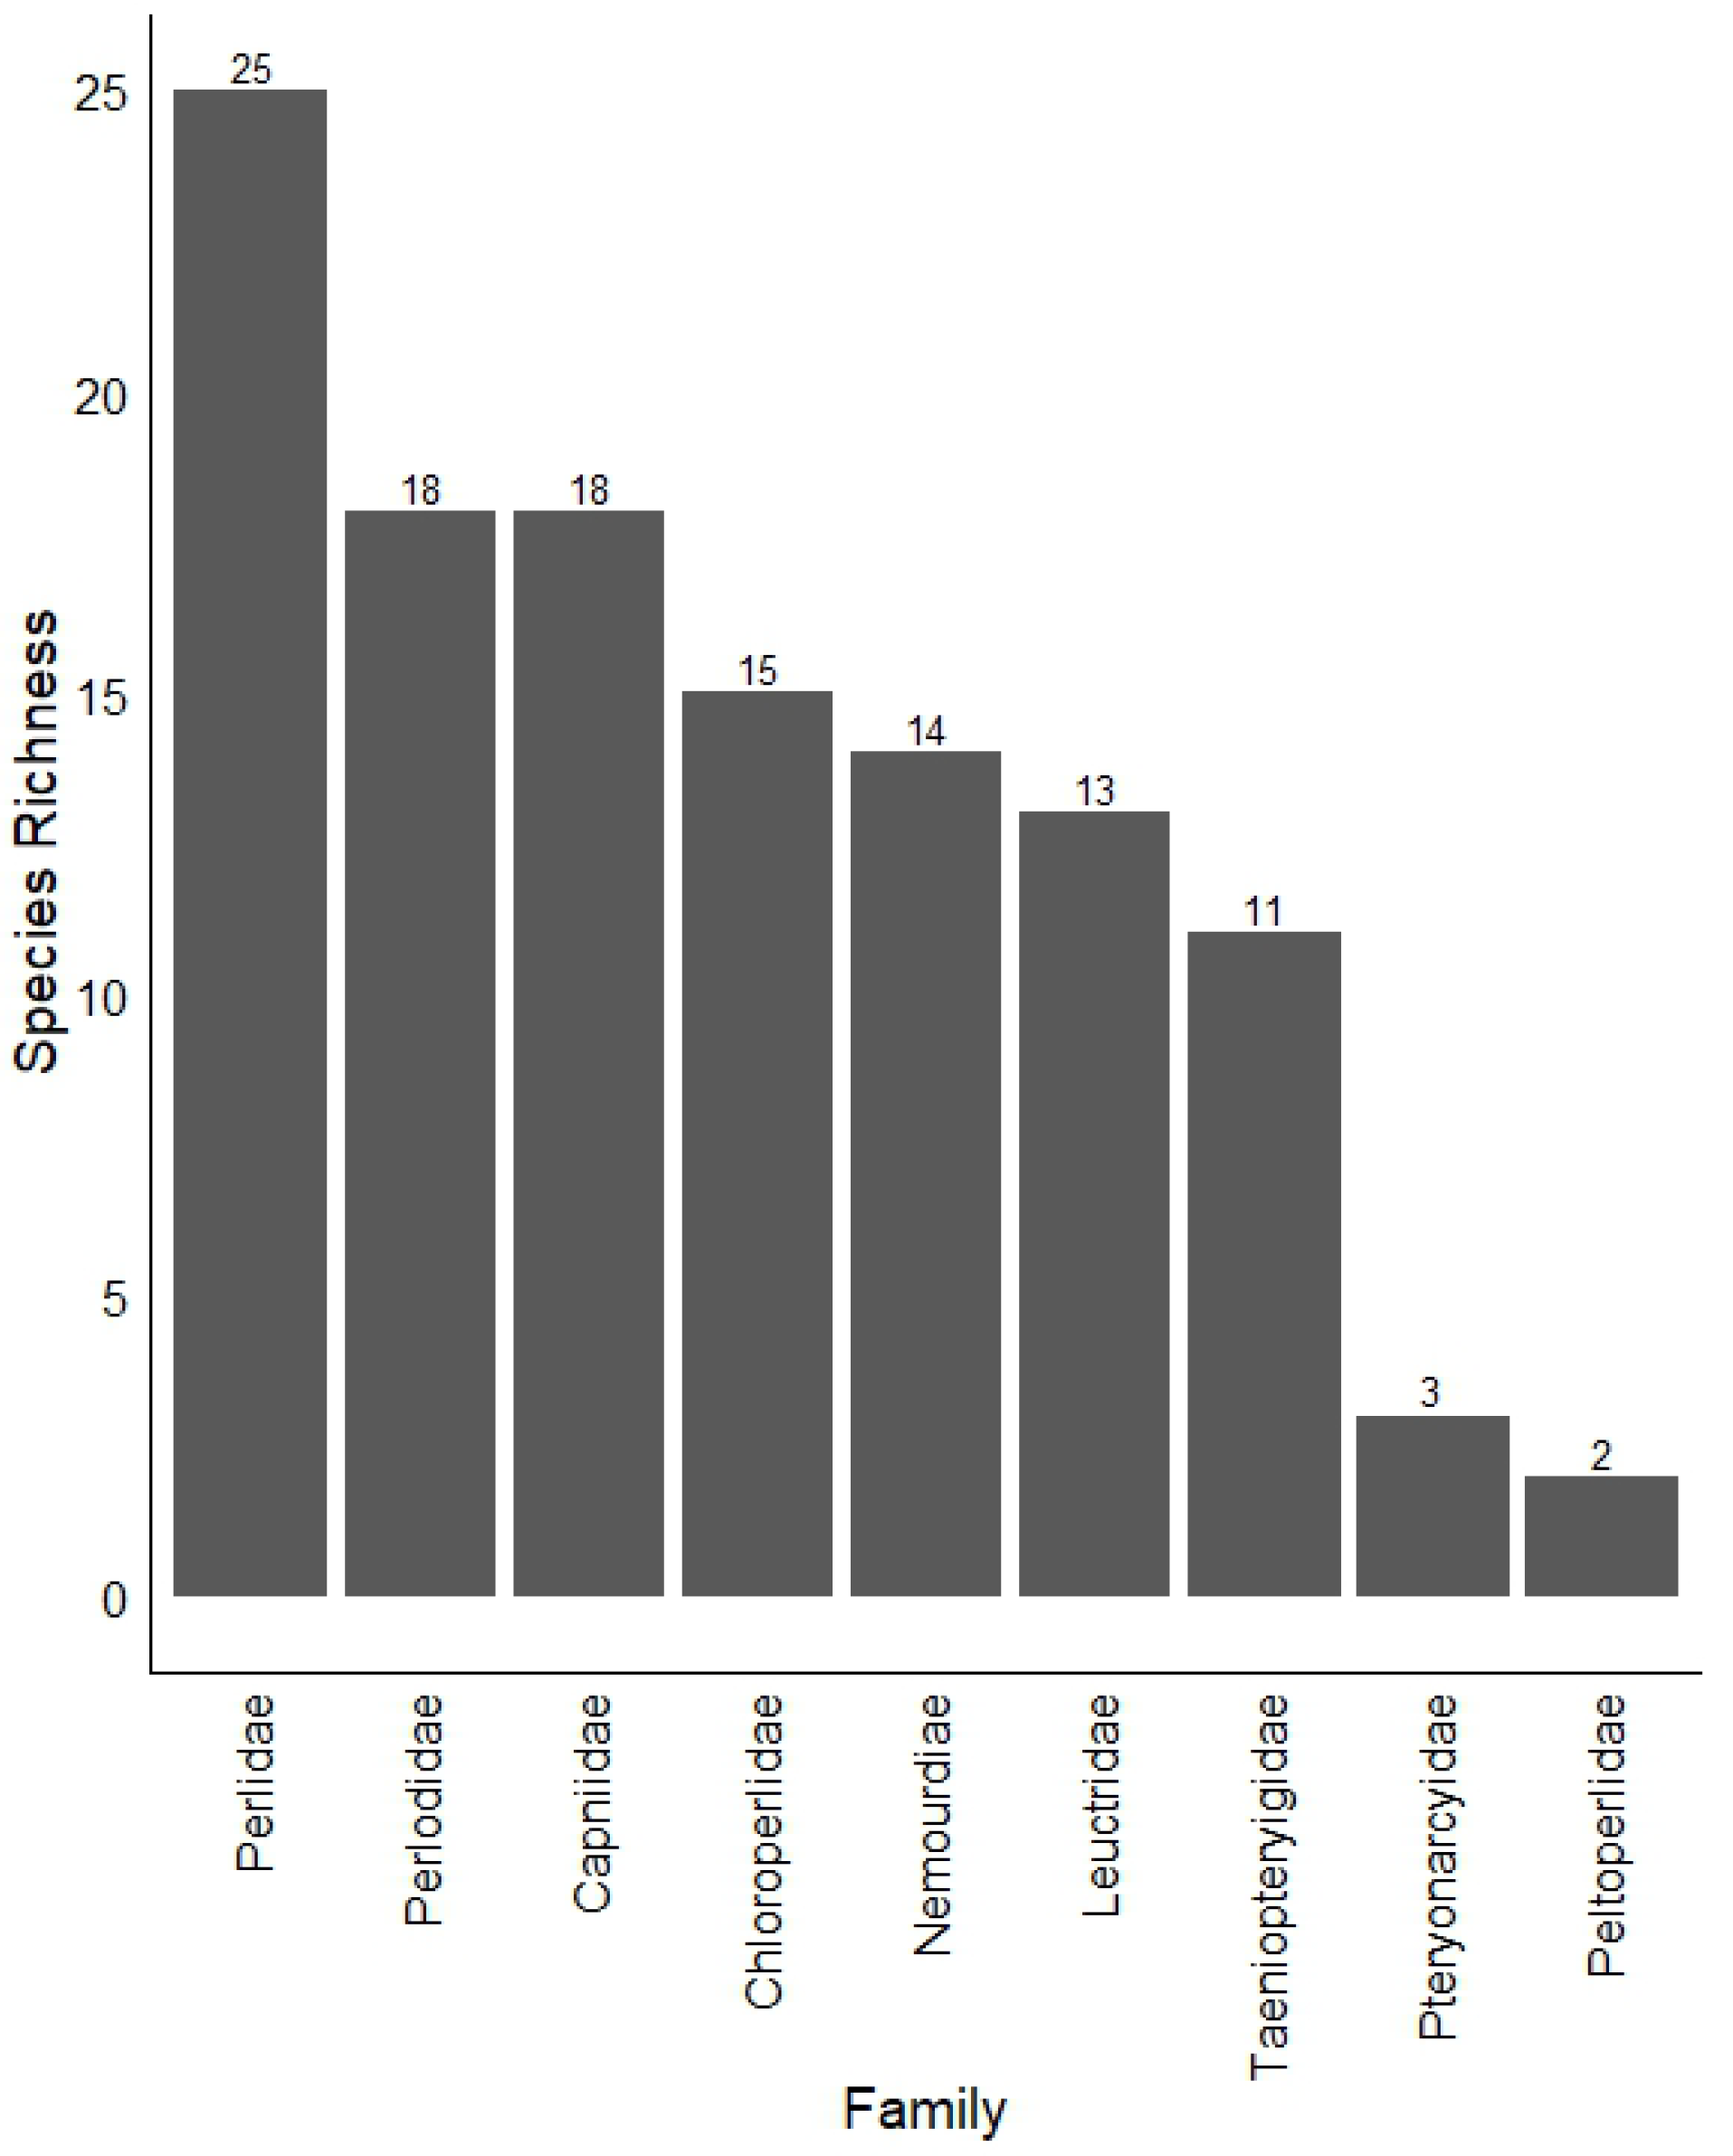
Figure 3.
Species richness among stoneflies families represented in Maryland.
Figure 3.
Species richness among stoneflies families represented in Maryland.
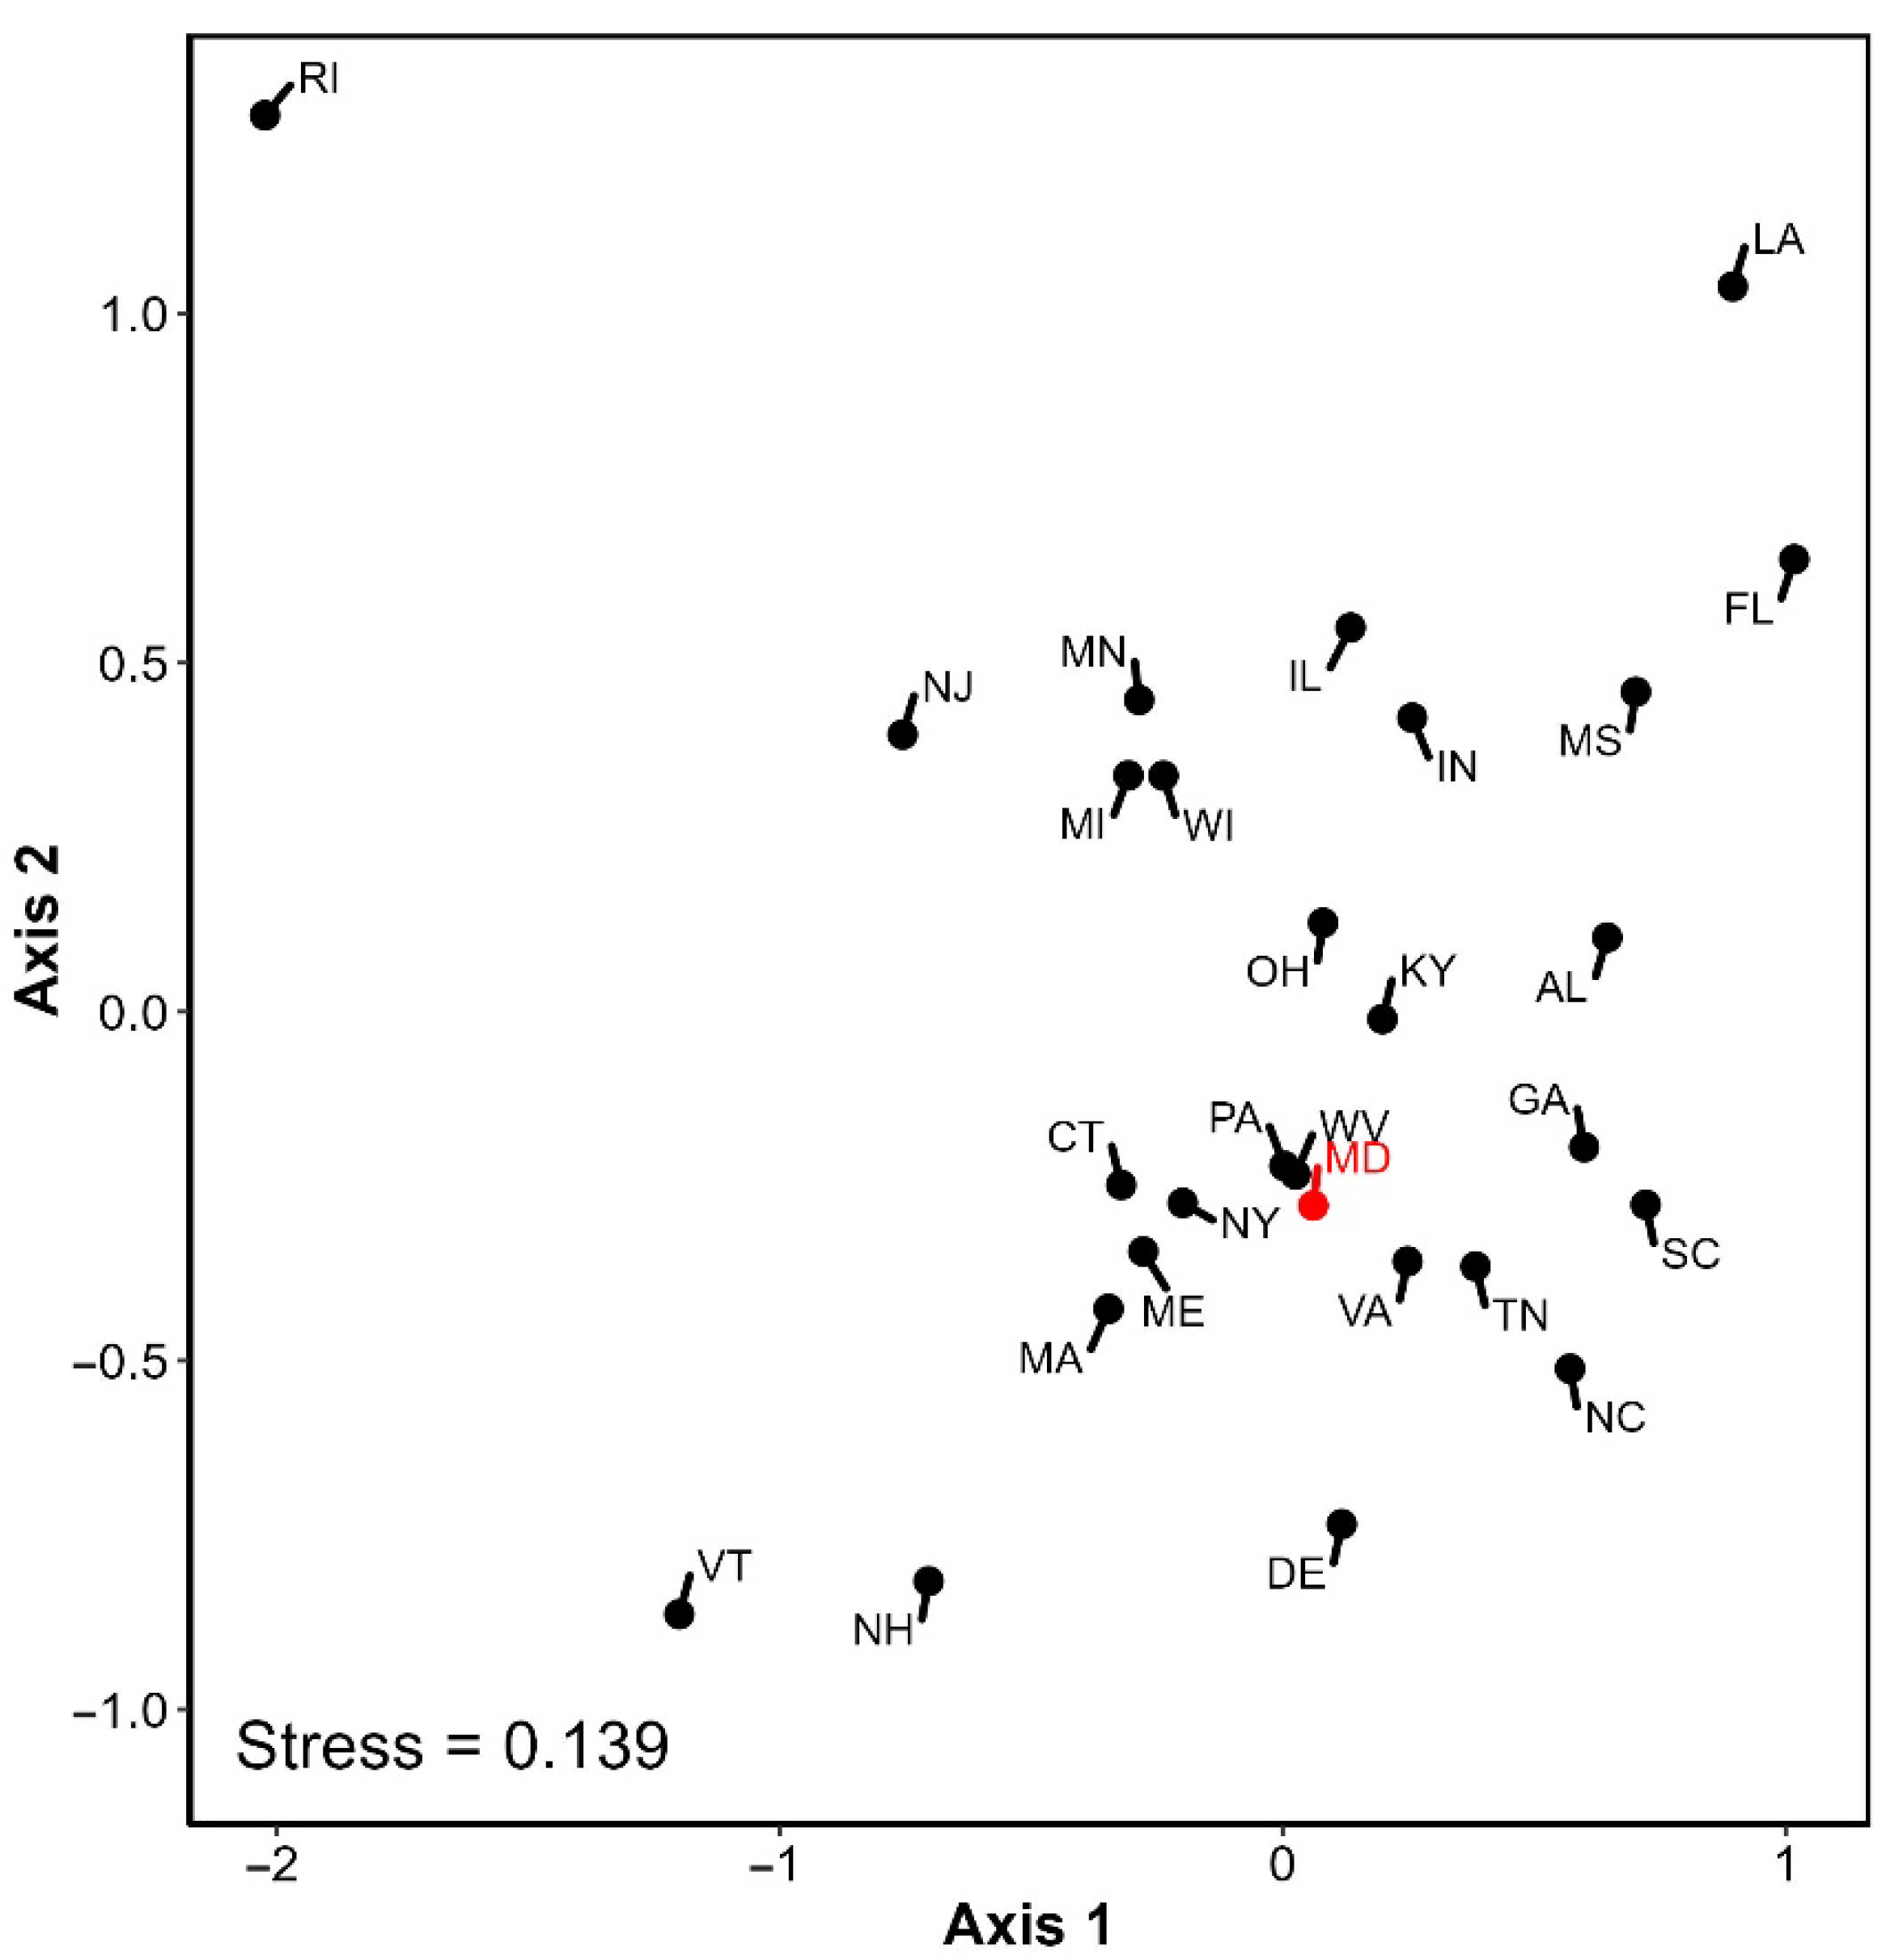
Figure 4.
Non-metric Multi-Dimensional Scaling plot of regional stonefly assemblages for eastern United States of America (USA) states. Black circles represent USA states and are labeled with abbreviations of USA postal codes. Maryland (MD) is highlighted with a red circle and red text.
Figure 4.
Non-metric Multi-Dimensional Scaling plot of regional stonefly assemblages for eastern United States of America (USA) states. Black circles represent USA states and are labeled with abbreviations of USA postal codes. Maryland (MD) is highlighted with a red circle and red text.
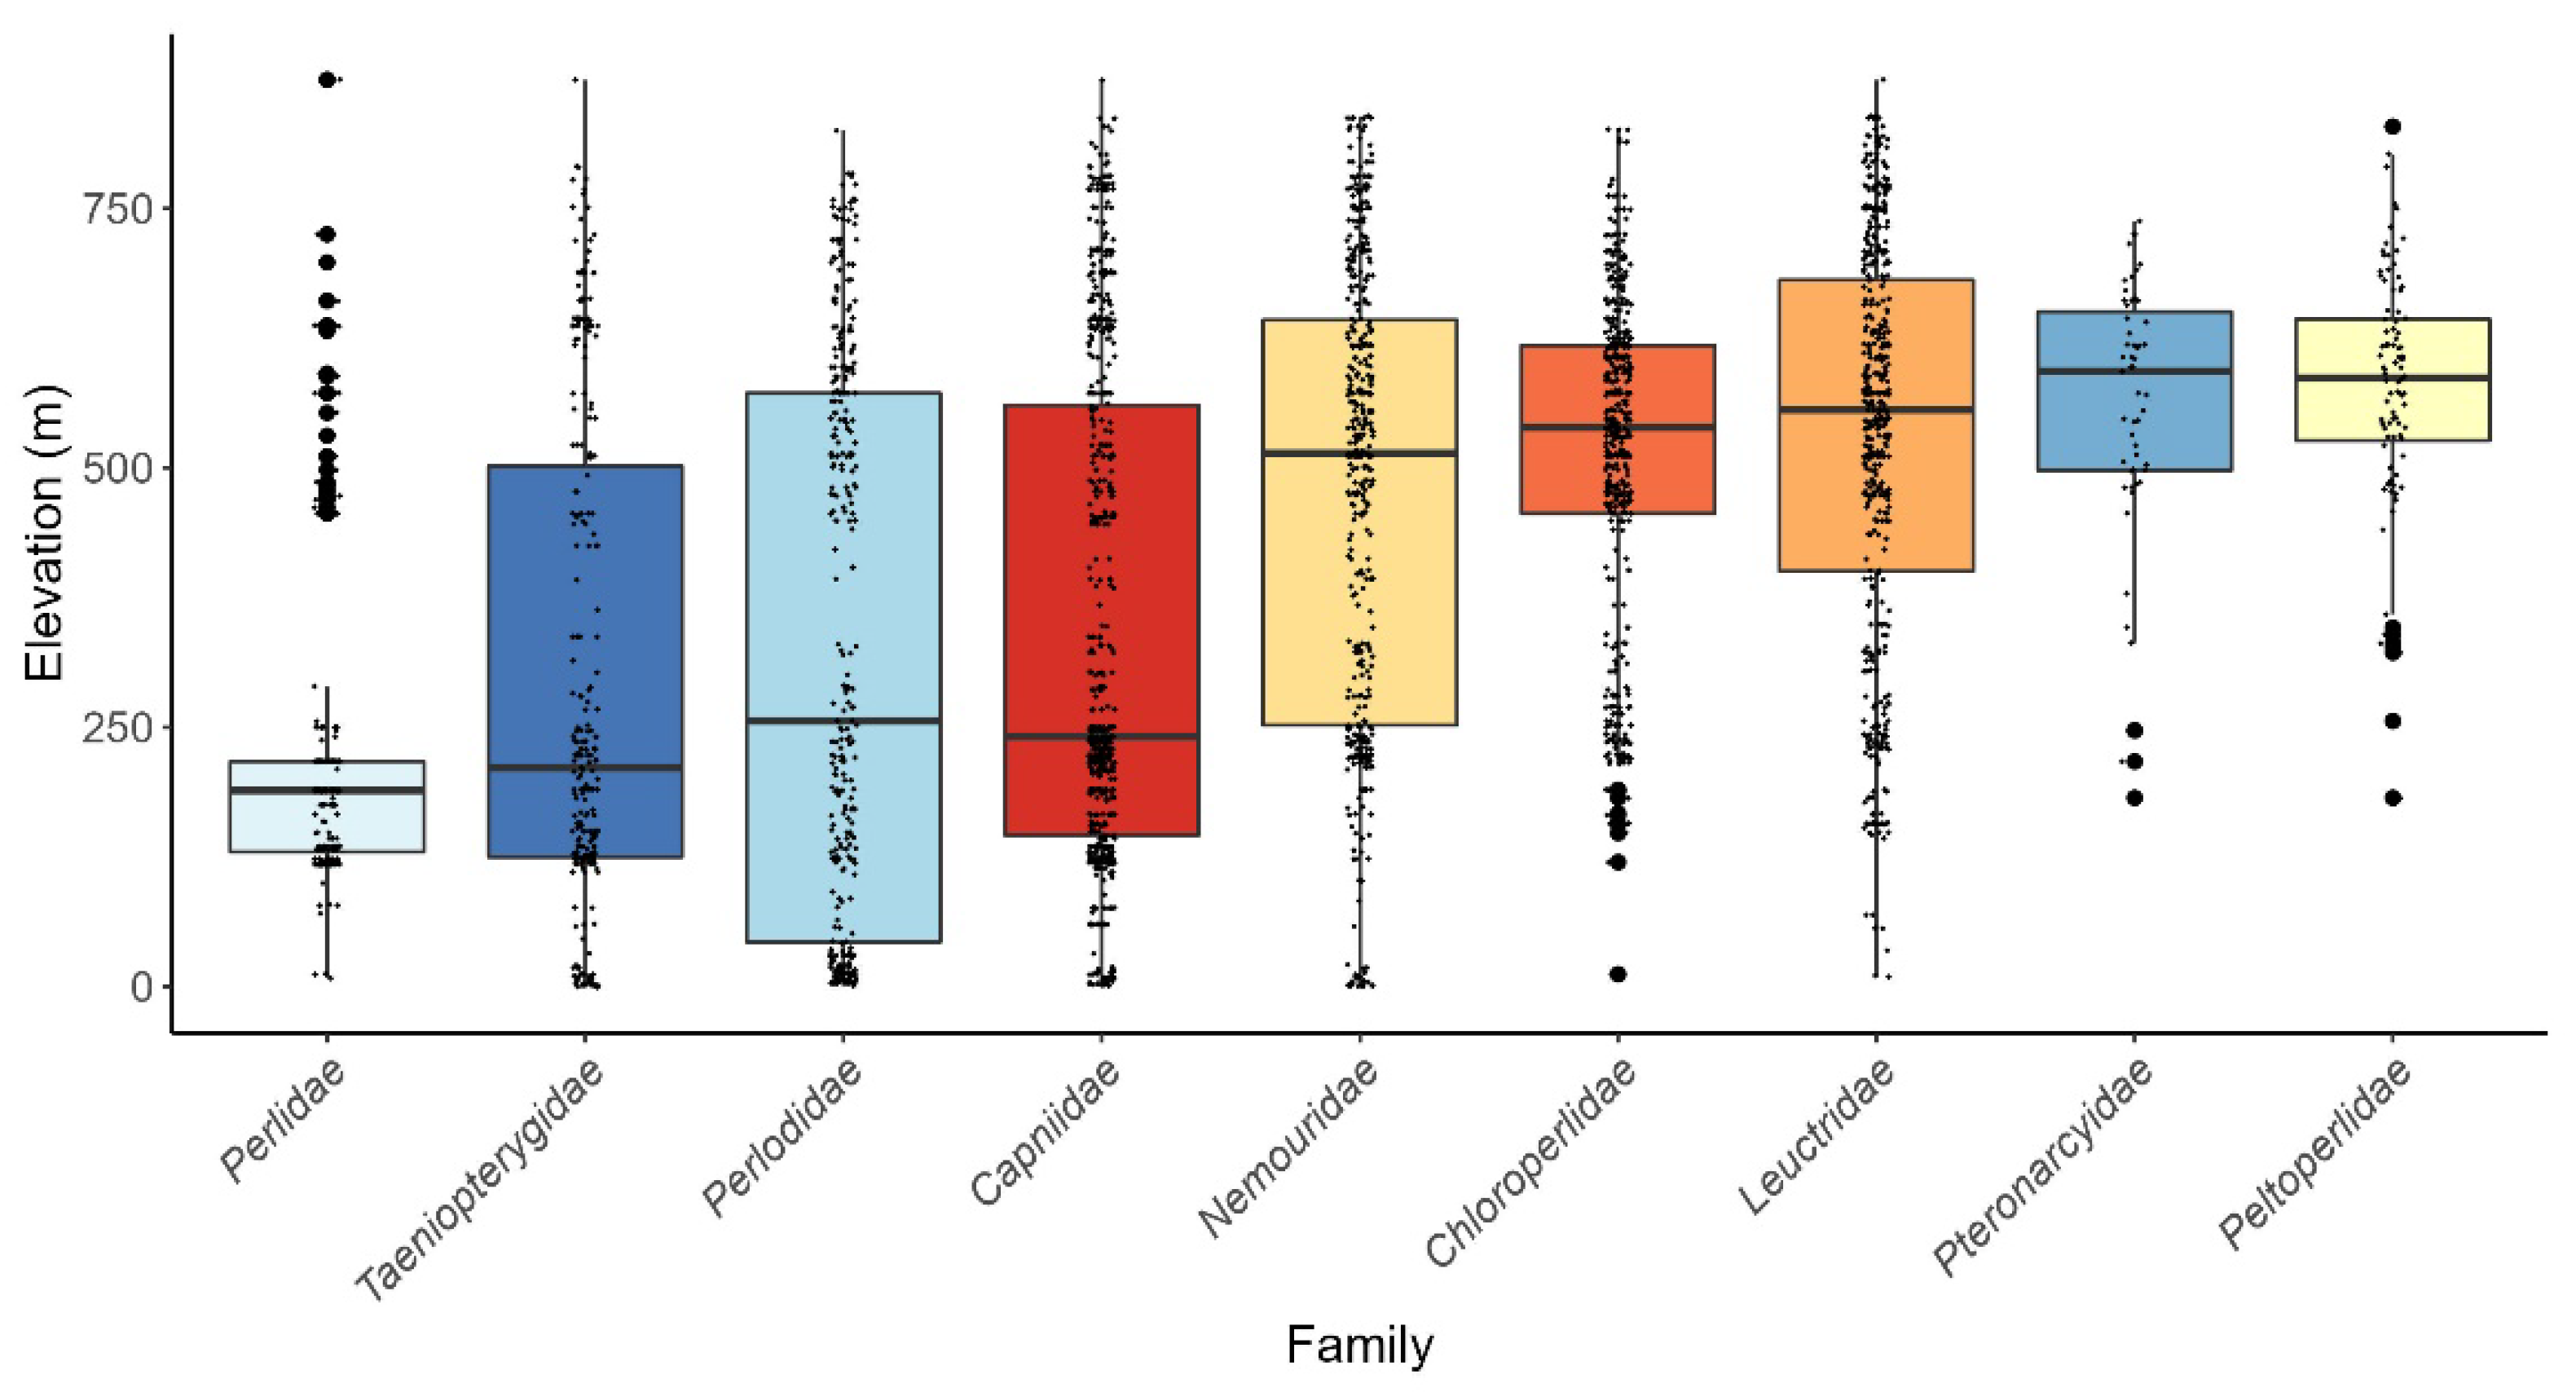
Figure 5.
Boxplot of stonefly family elevation trends in Maryland. Boxes represent the interquartile range, while vertical lines extend to the minimum and maximum values. The horizontal line within the interquartile range represents the median elevation. Outliers are shown with large, solid circles. Small, individual points overlaid on each boxplot illustrate the distribution of observations.
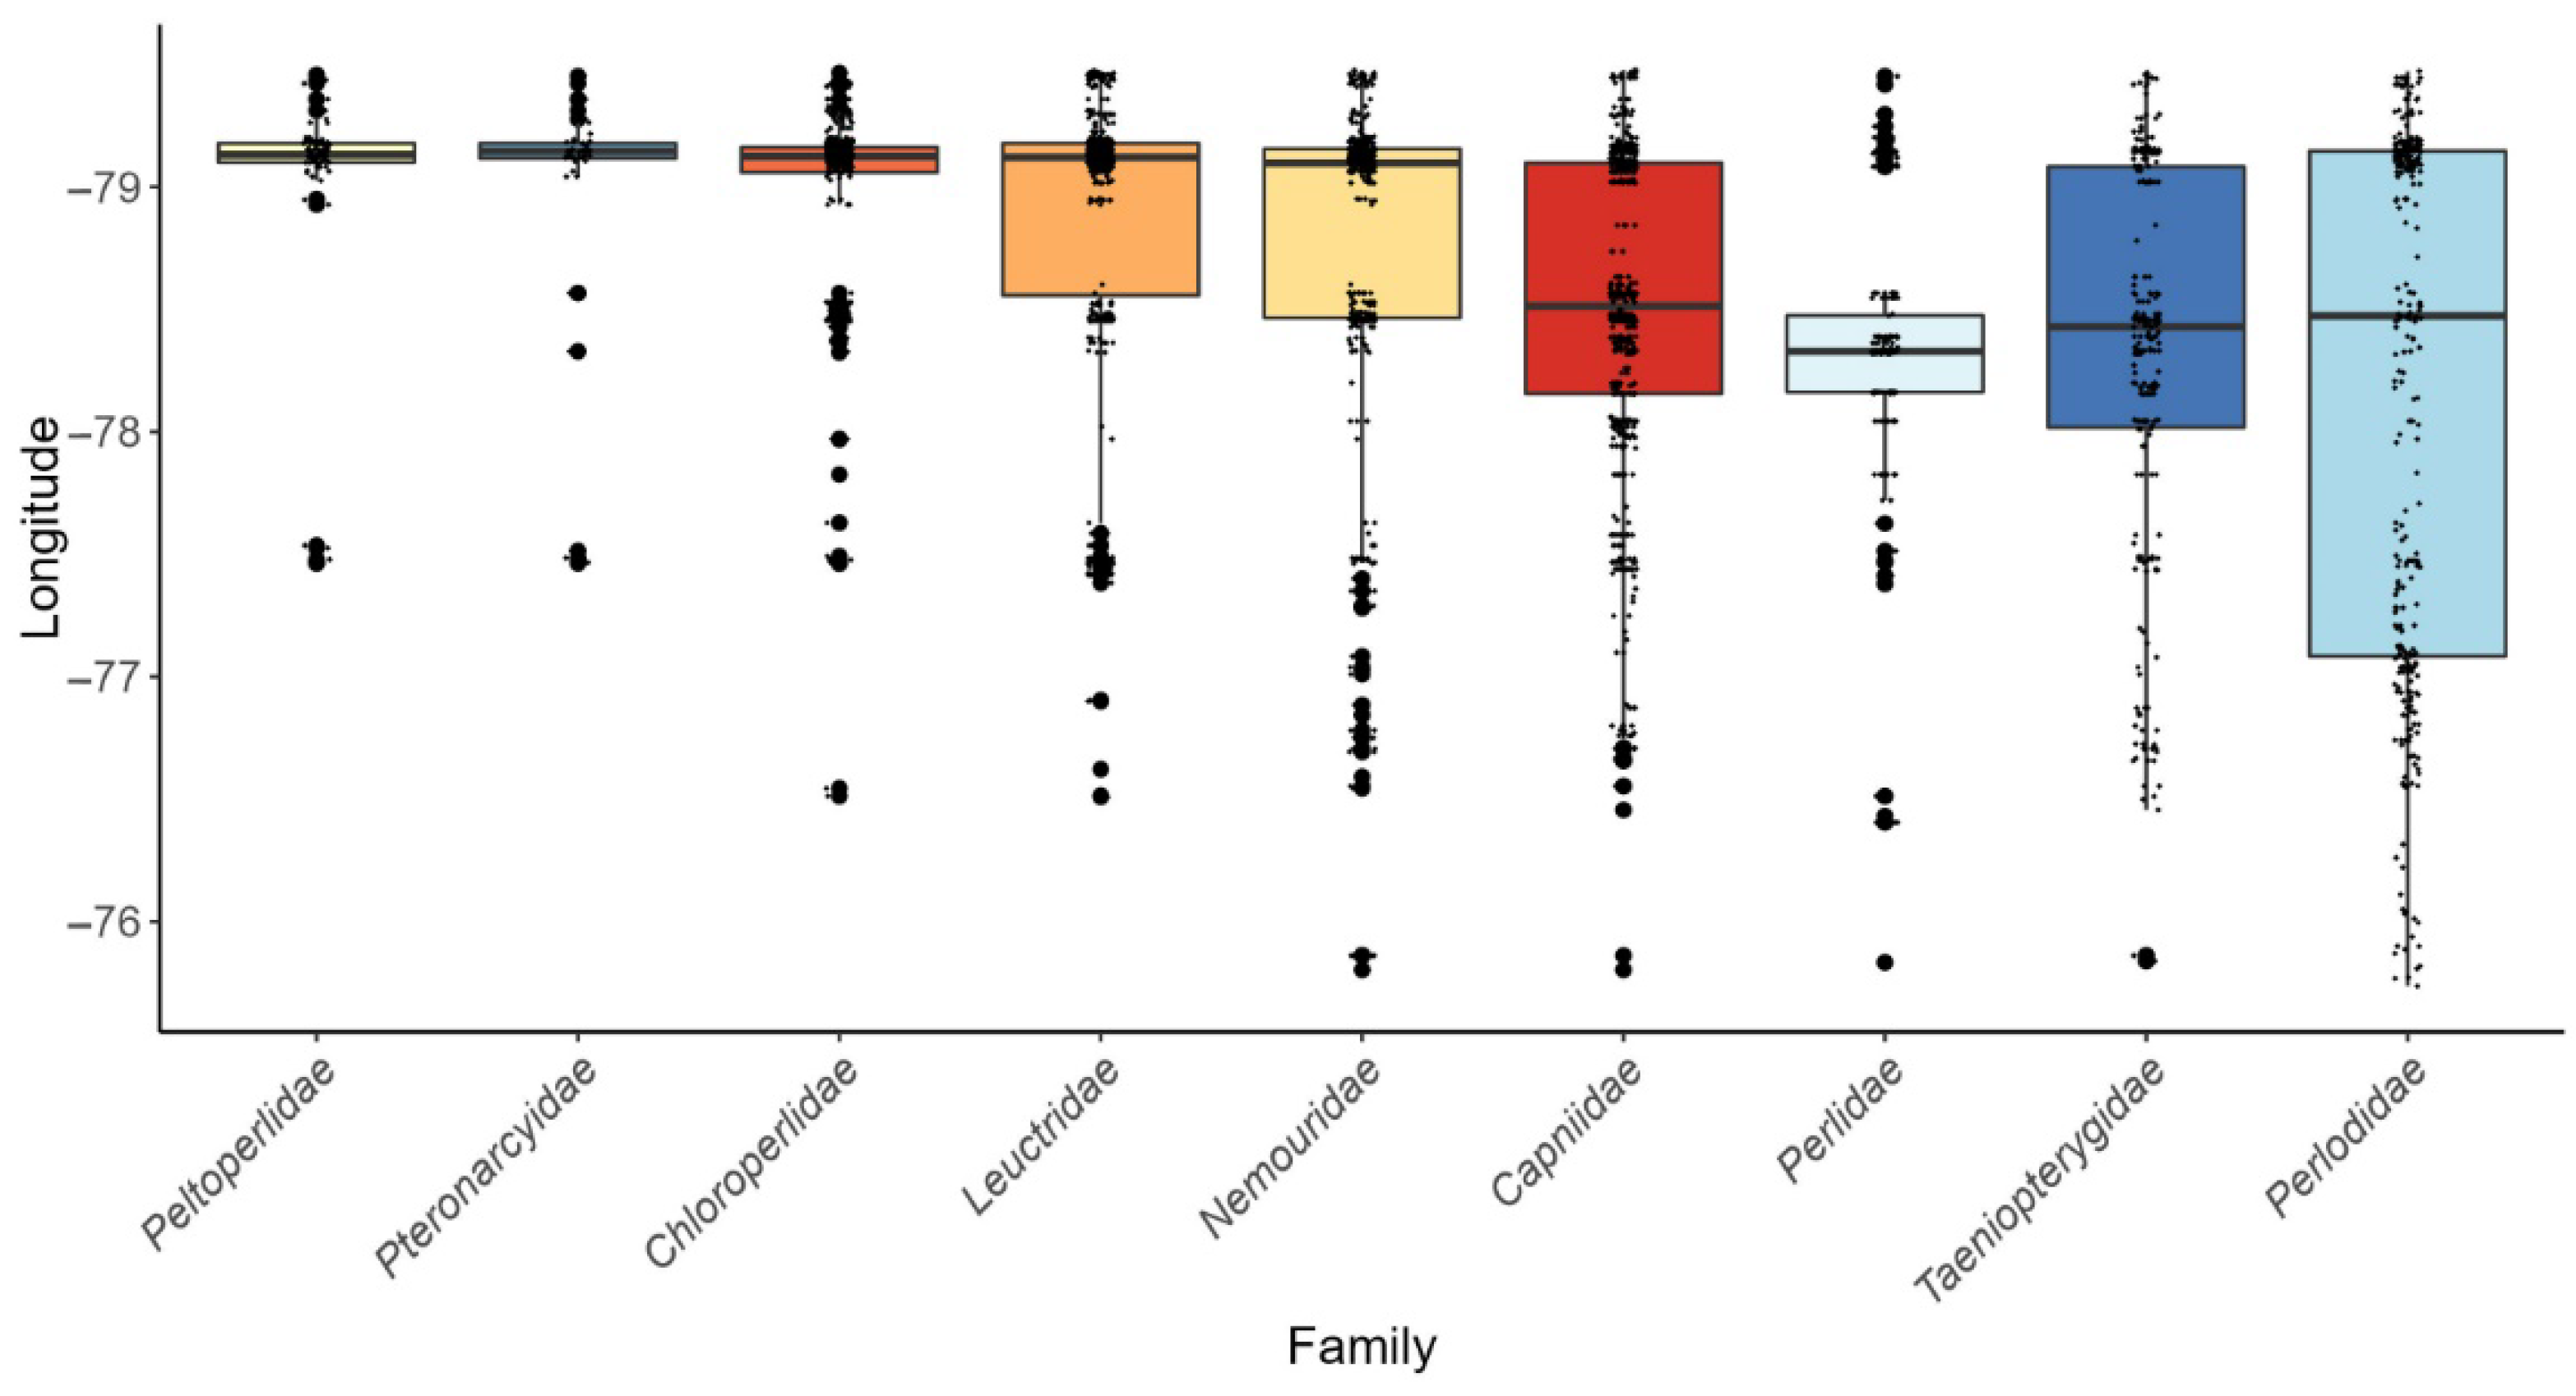
Figure 6.
Boxplot of longitude associated with collection locations for each Maryland stonefly family. Boxes represent the interquartile range, while vertical lines extend to the minimum and maximum values. The horizontal line within the interquartile range represents the median longitude. Outliers are shown with large, solid circles. Small, individual points overlaid on each boxplot illustrate the distribution of observations.
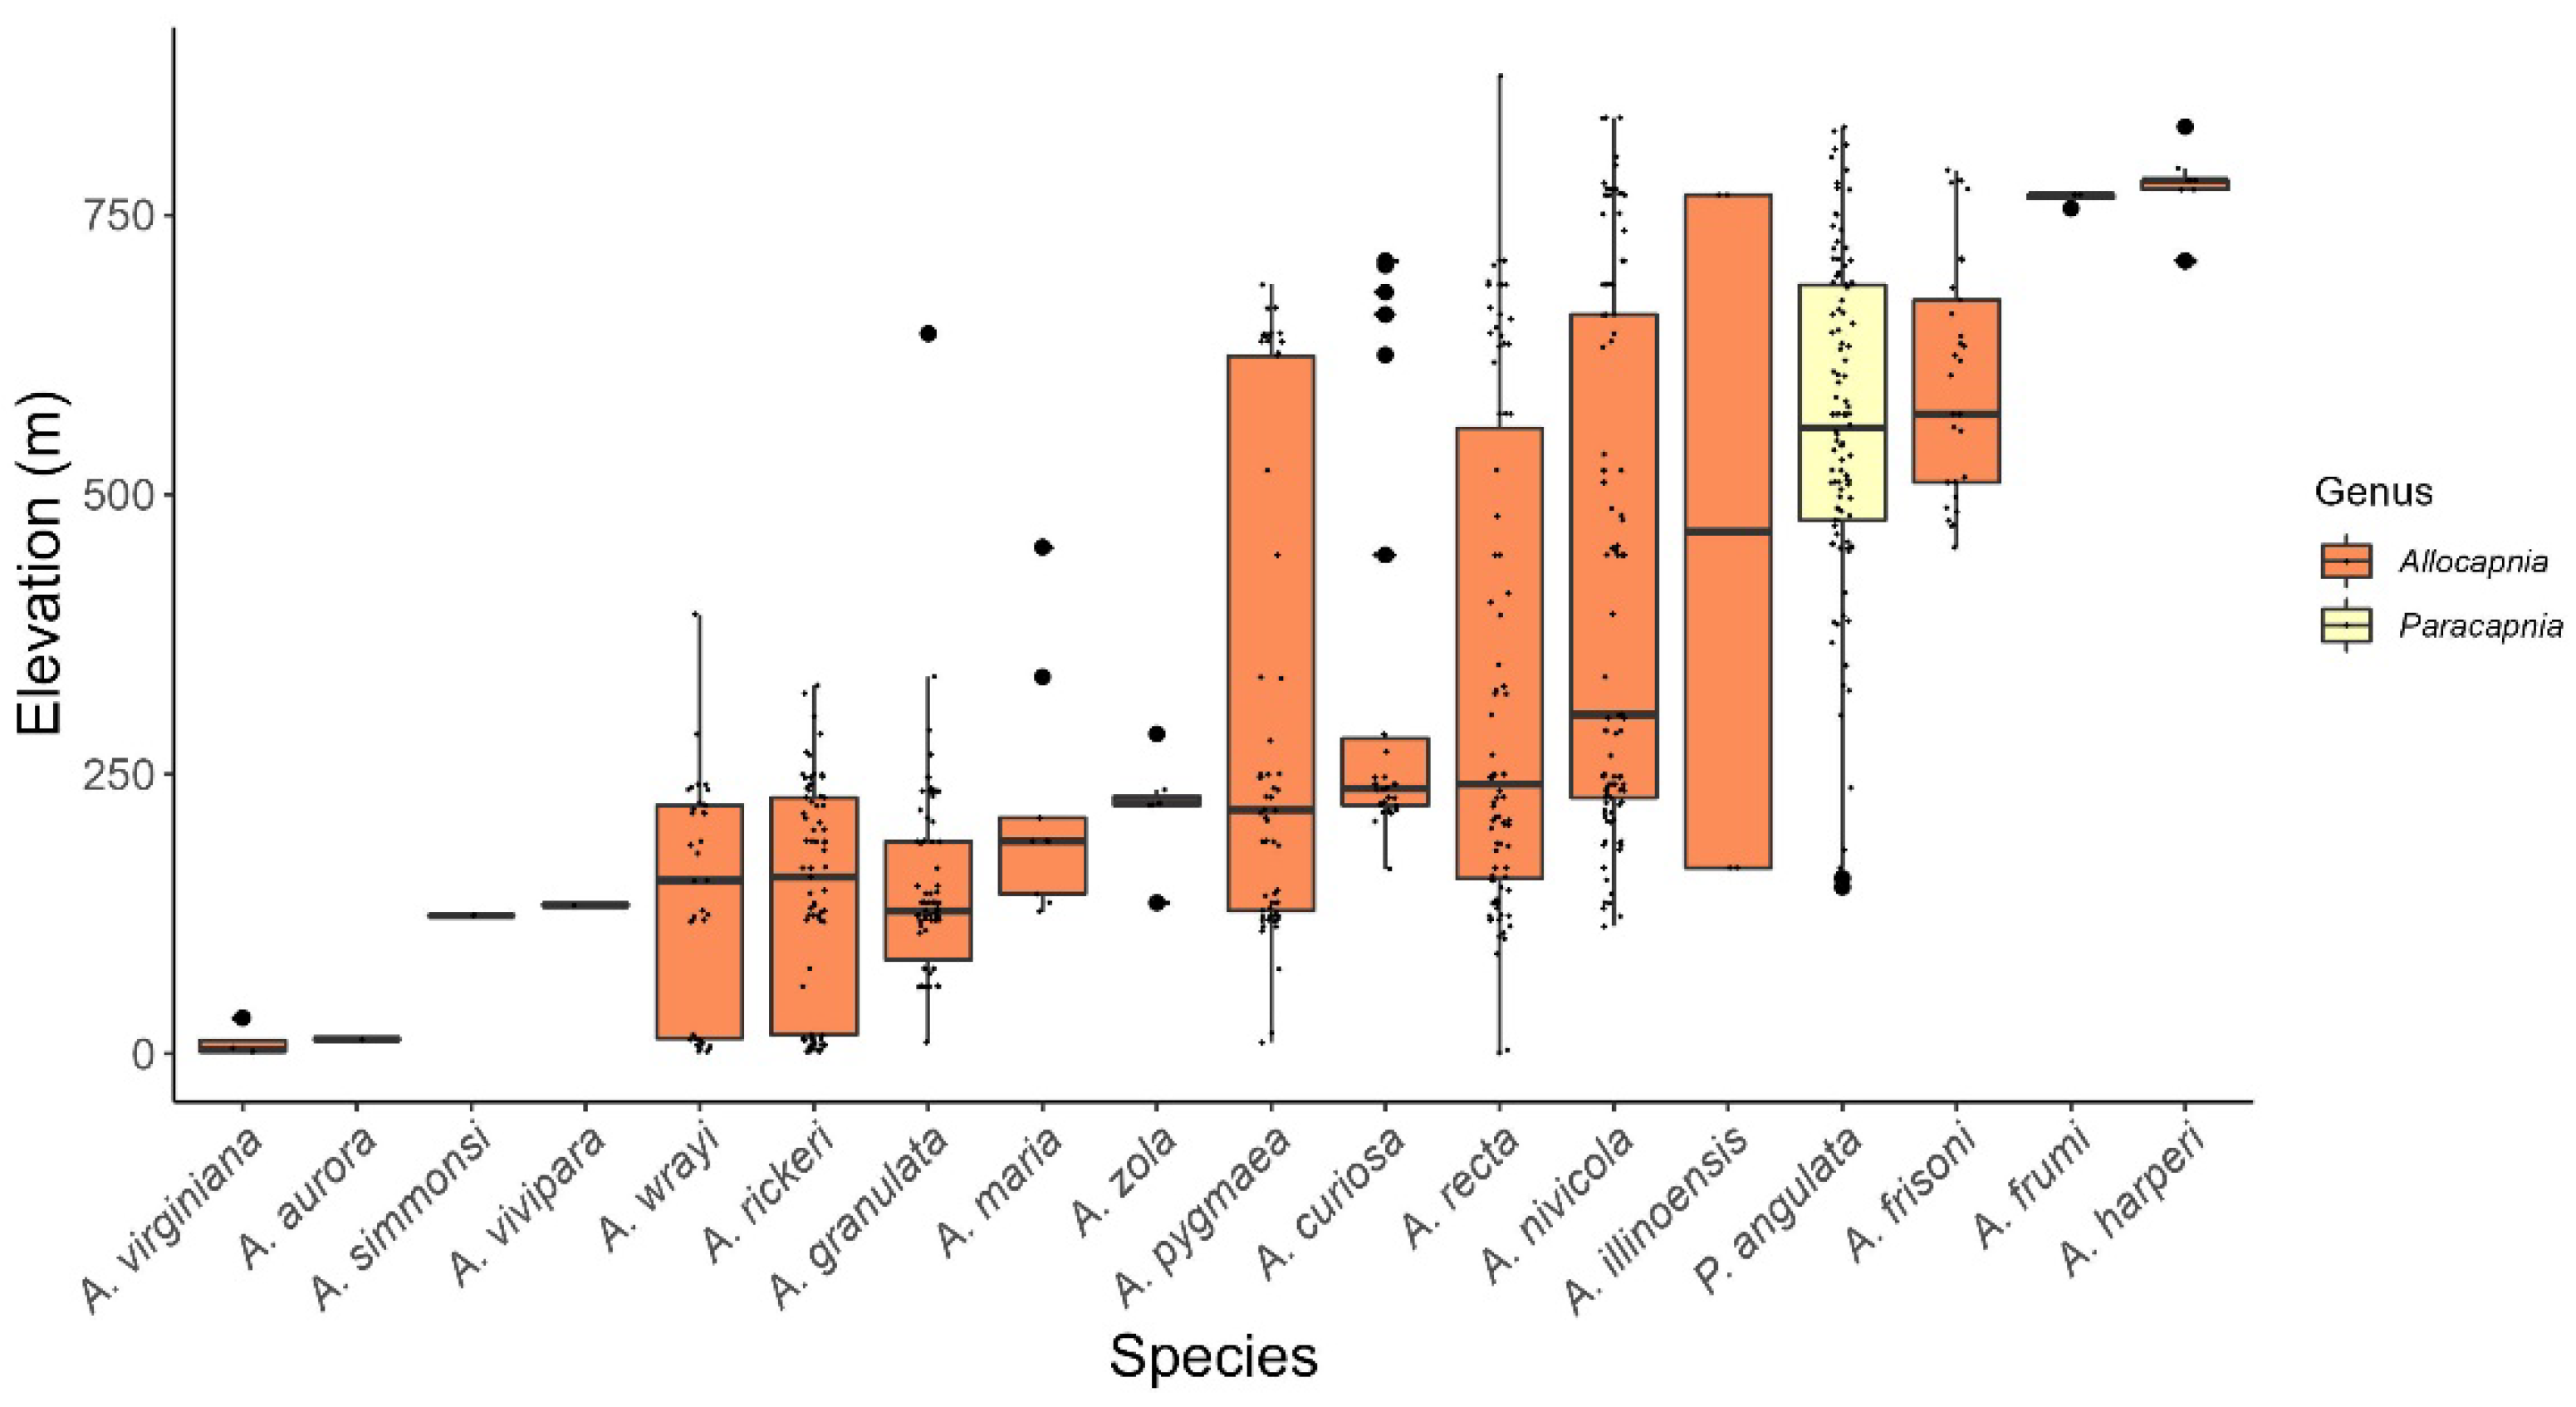
Figure 7.
Elevation boxplots for Capniidae species recorded from Maryland. Boxes represent the interquartile range, while vertical lines extend to the minimum and maximum values. The horizontal line within the interquartile range represents the median elevation. Outliers are shown with large, solid circles. Small, individual points overlaid on each boxplot illustrate the distribution of observations.
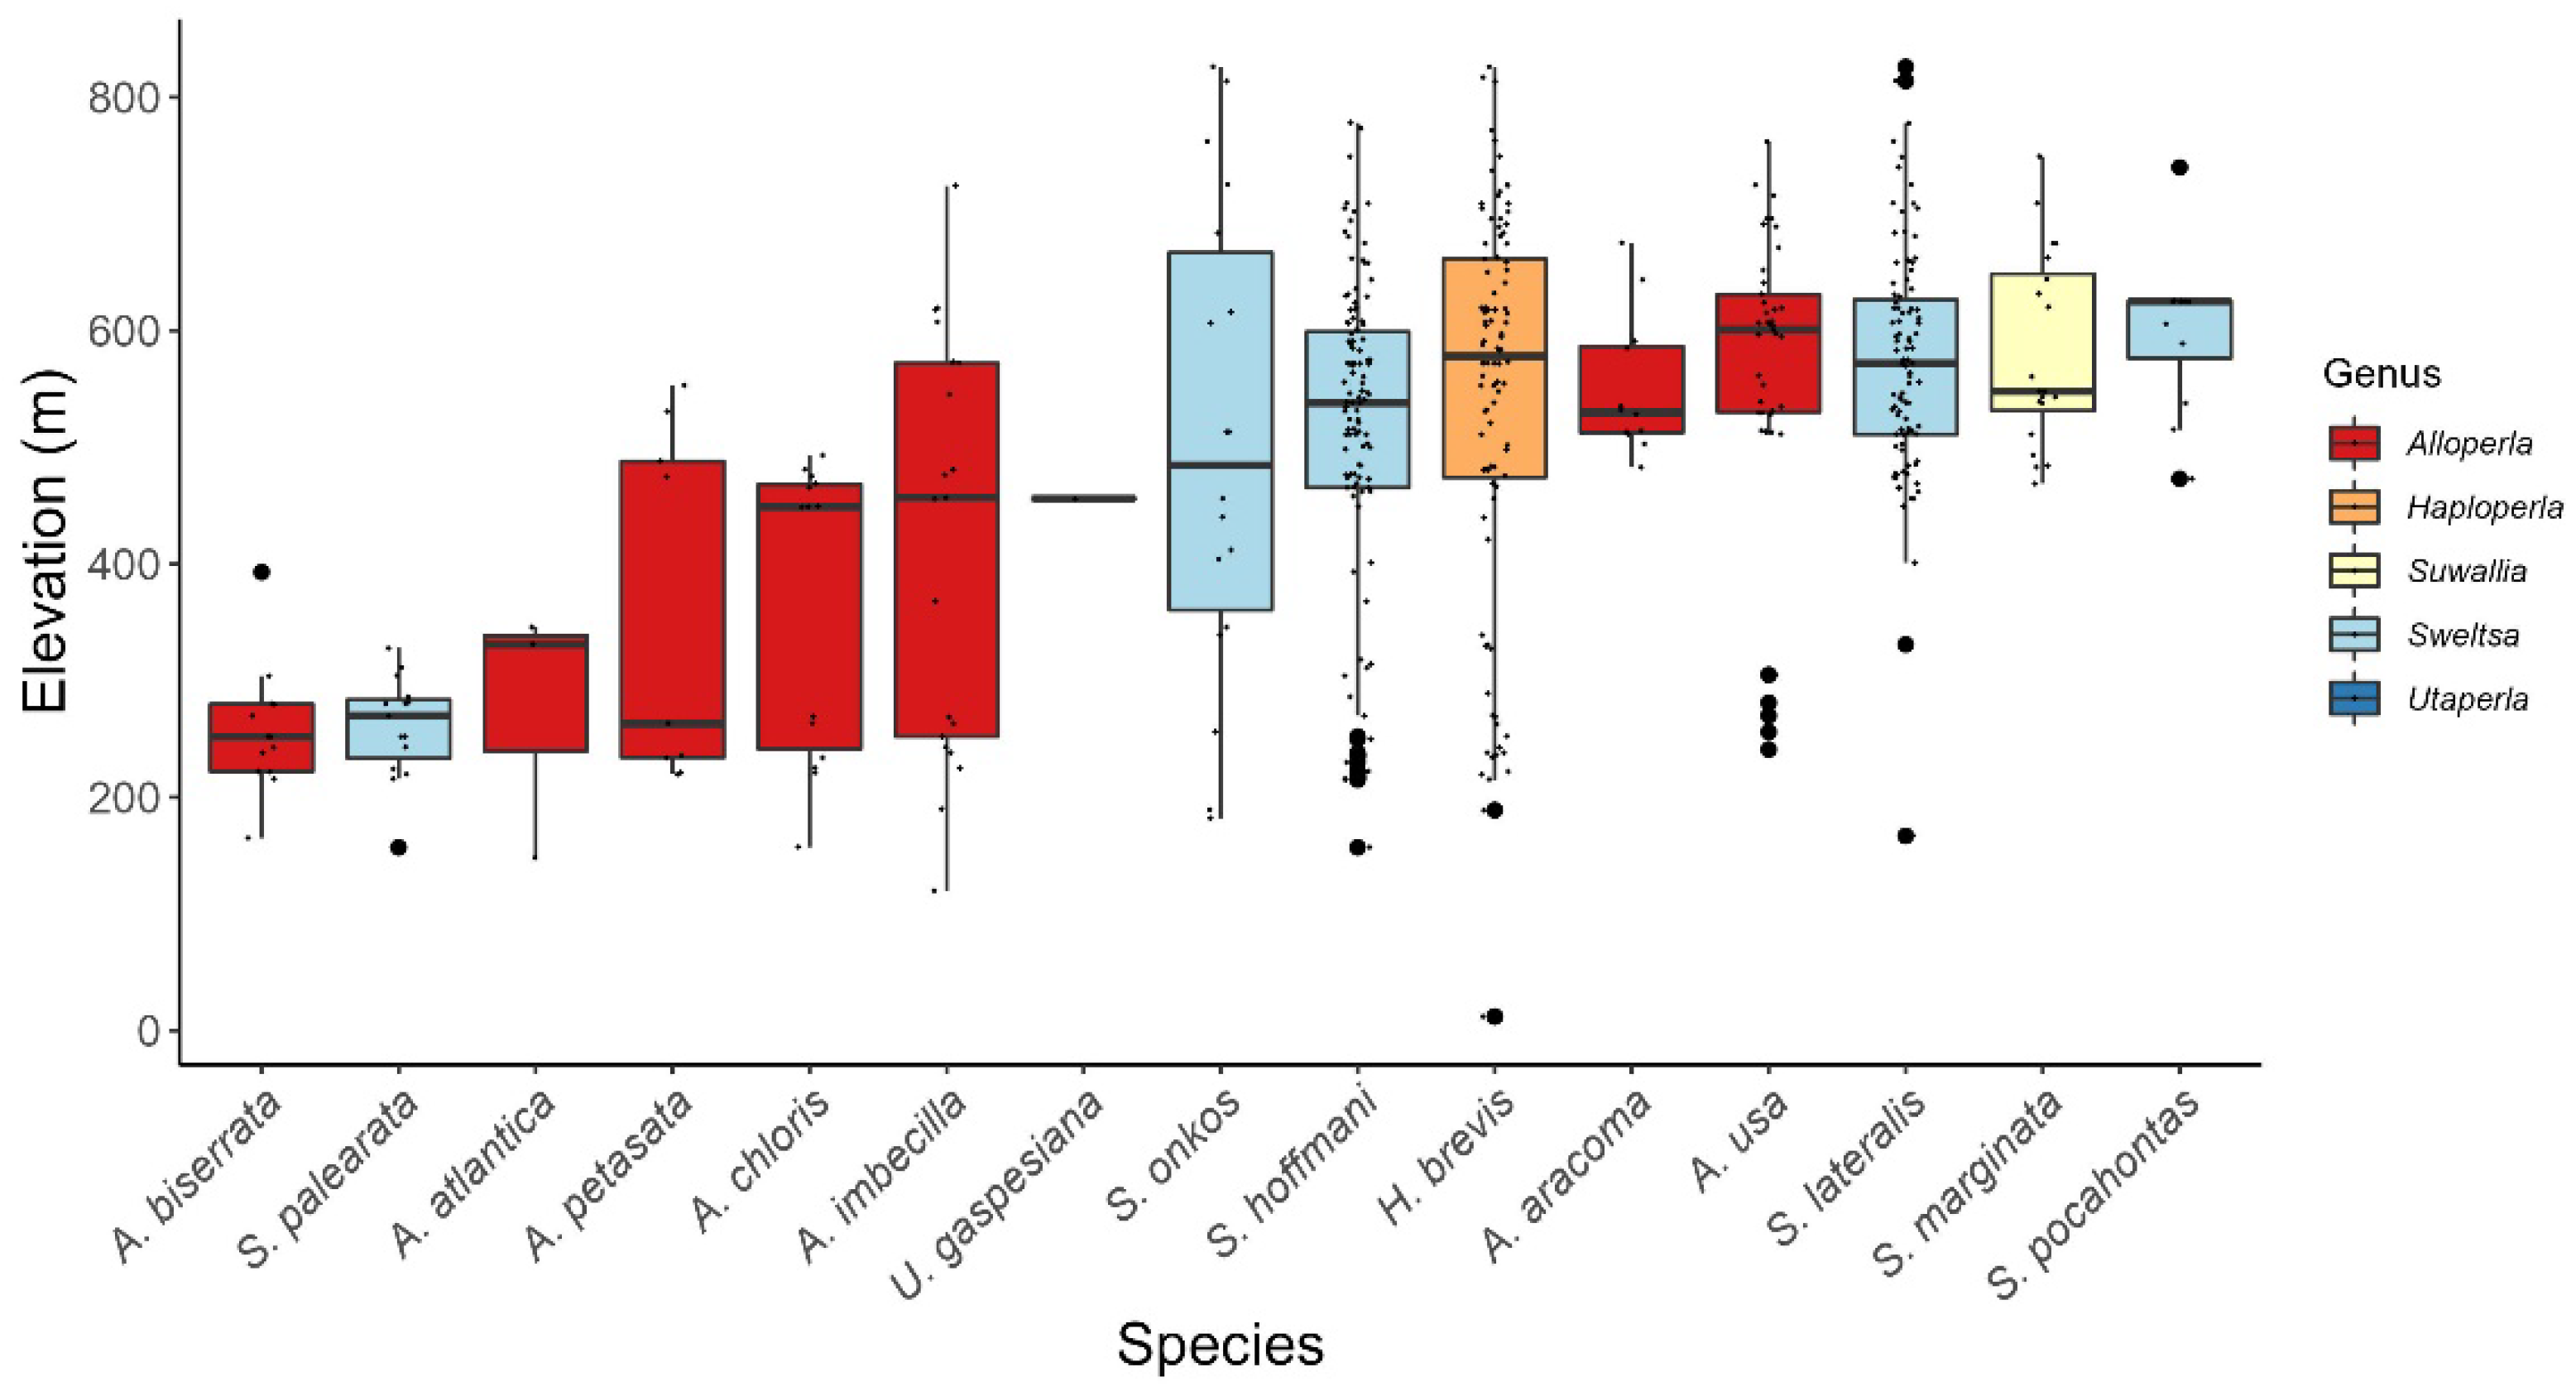
Figure 8.
Elevation boxplots for Chloroperlidae species recorded from Maryland. Boxes represent the interquartile range, while vertical lines extend to the minimum and maximum values. The horizontal line within the interquartile range represents the median elevation. Outliers are shown with large, solid circles. Small, individual points overlaid on each boxplot illustrate the distribution of observations.
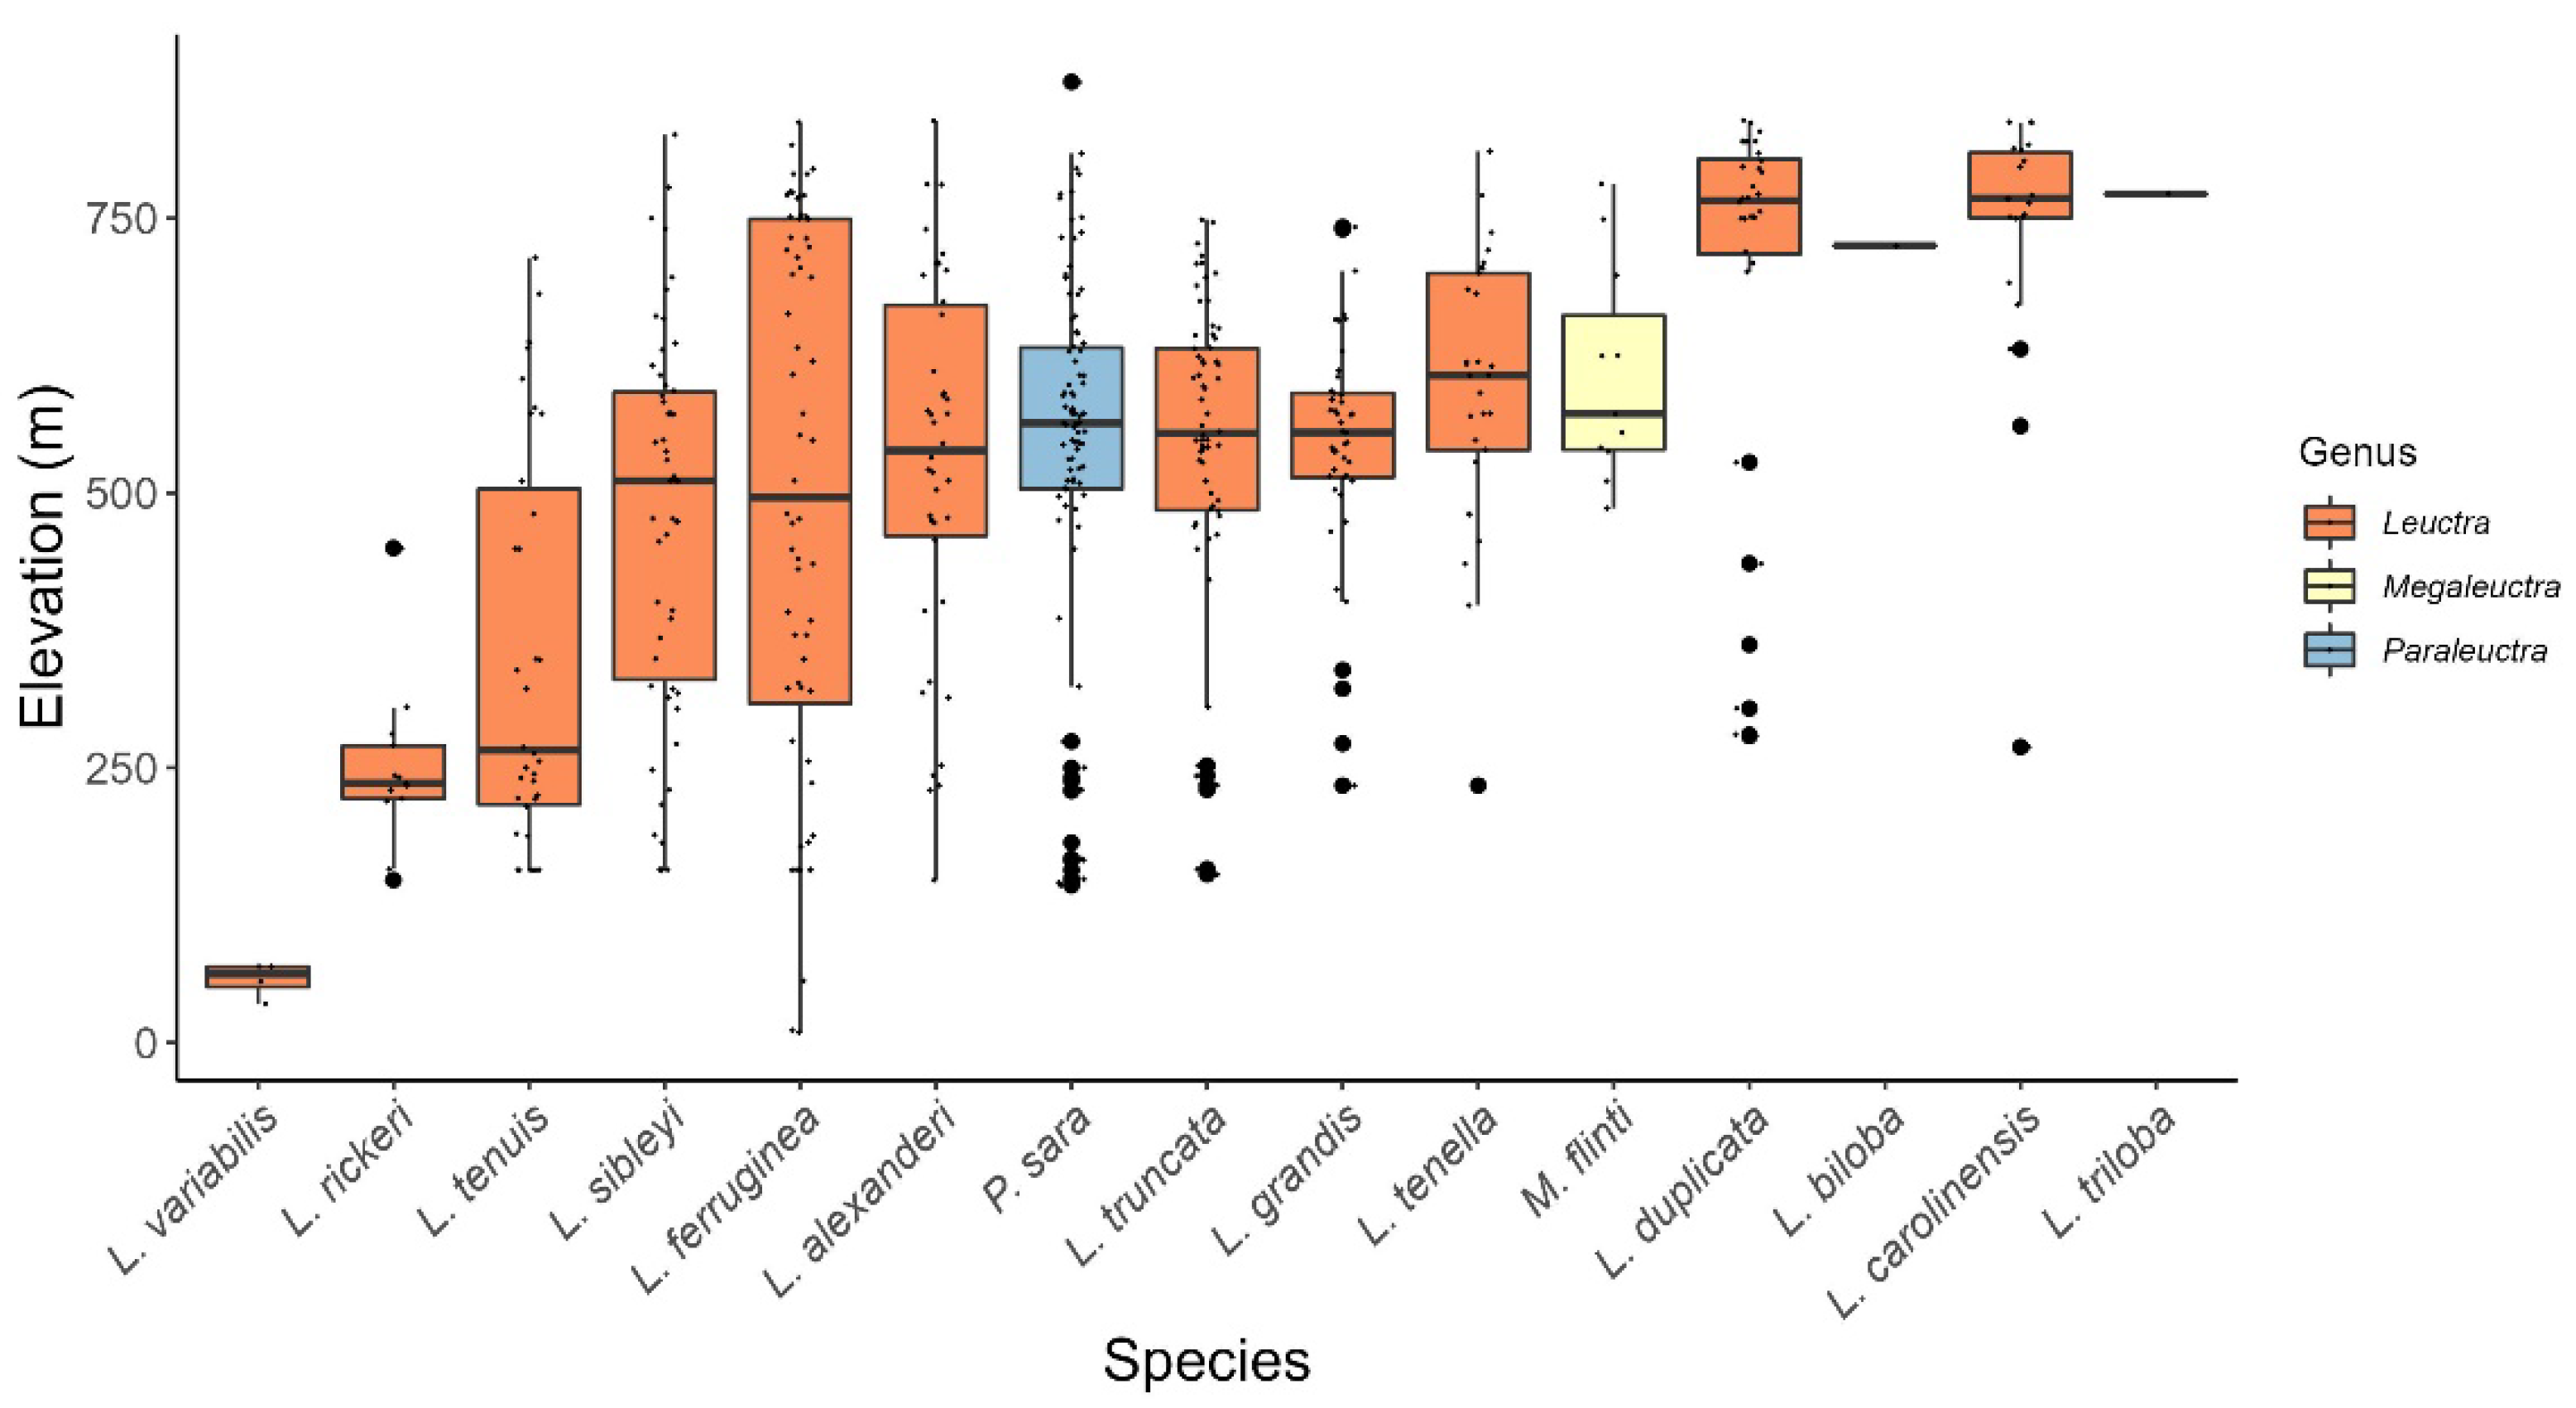
Figure 9.
Elevation boxplots for Leuctridae species recorded from Maryland. Boxes represent the interquartile range, while vertical lines extend to the minimum and maximum values. The horizontal line within the interquartile range represents the median elevation. Outliers are shown with large, solid circles. Small, individual points overlaid on each boxplot illustrate the distribution of observations.
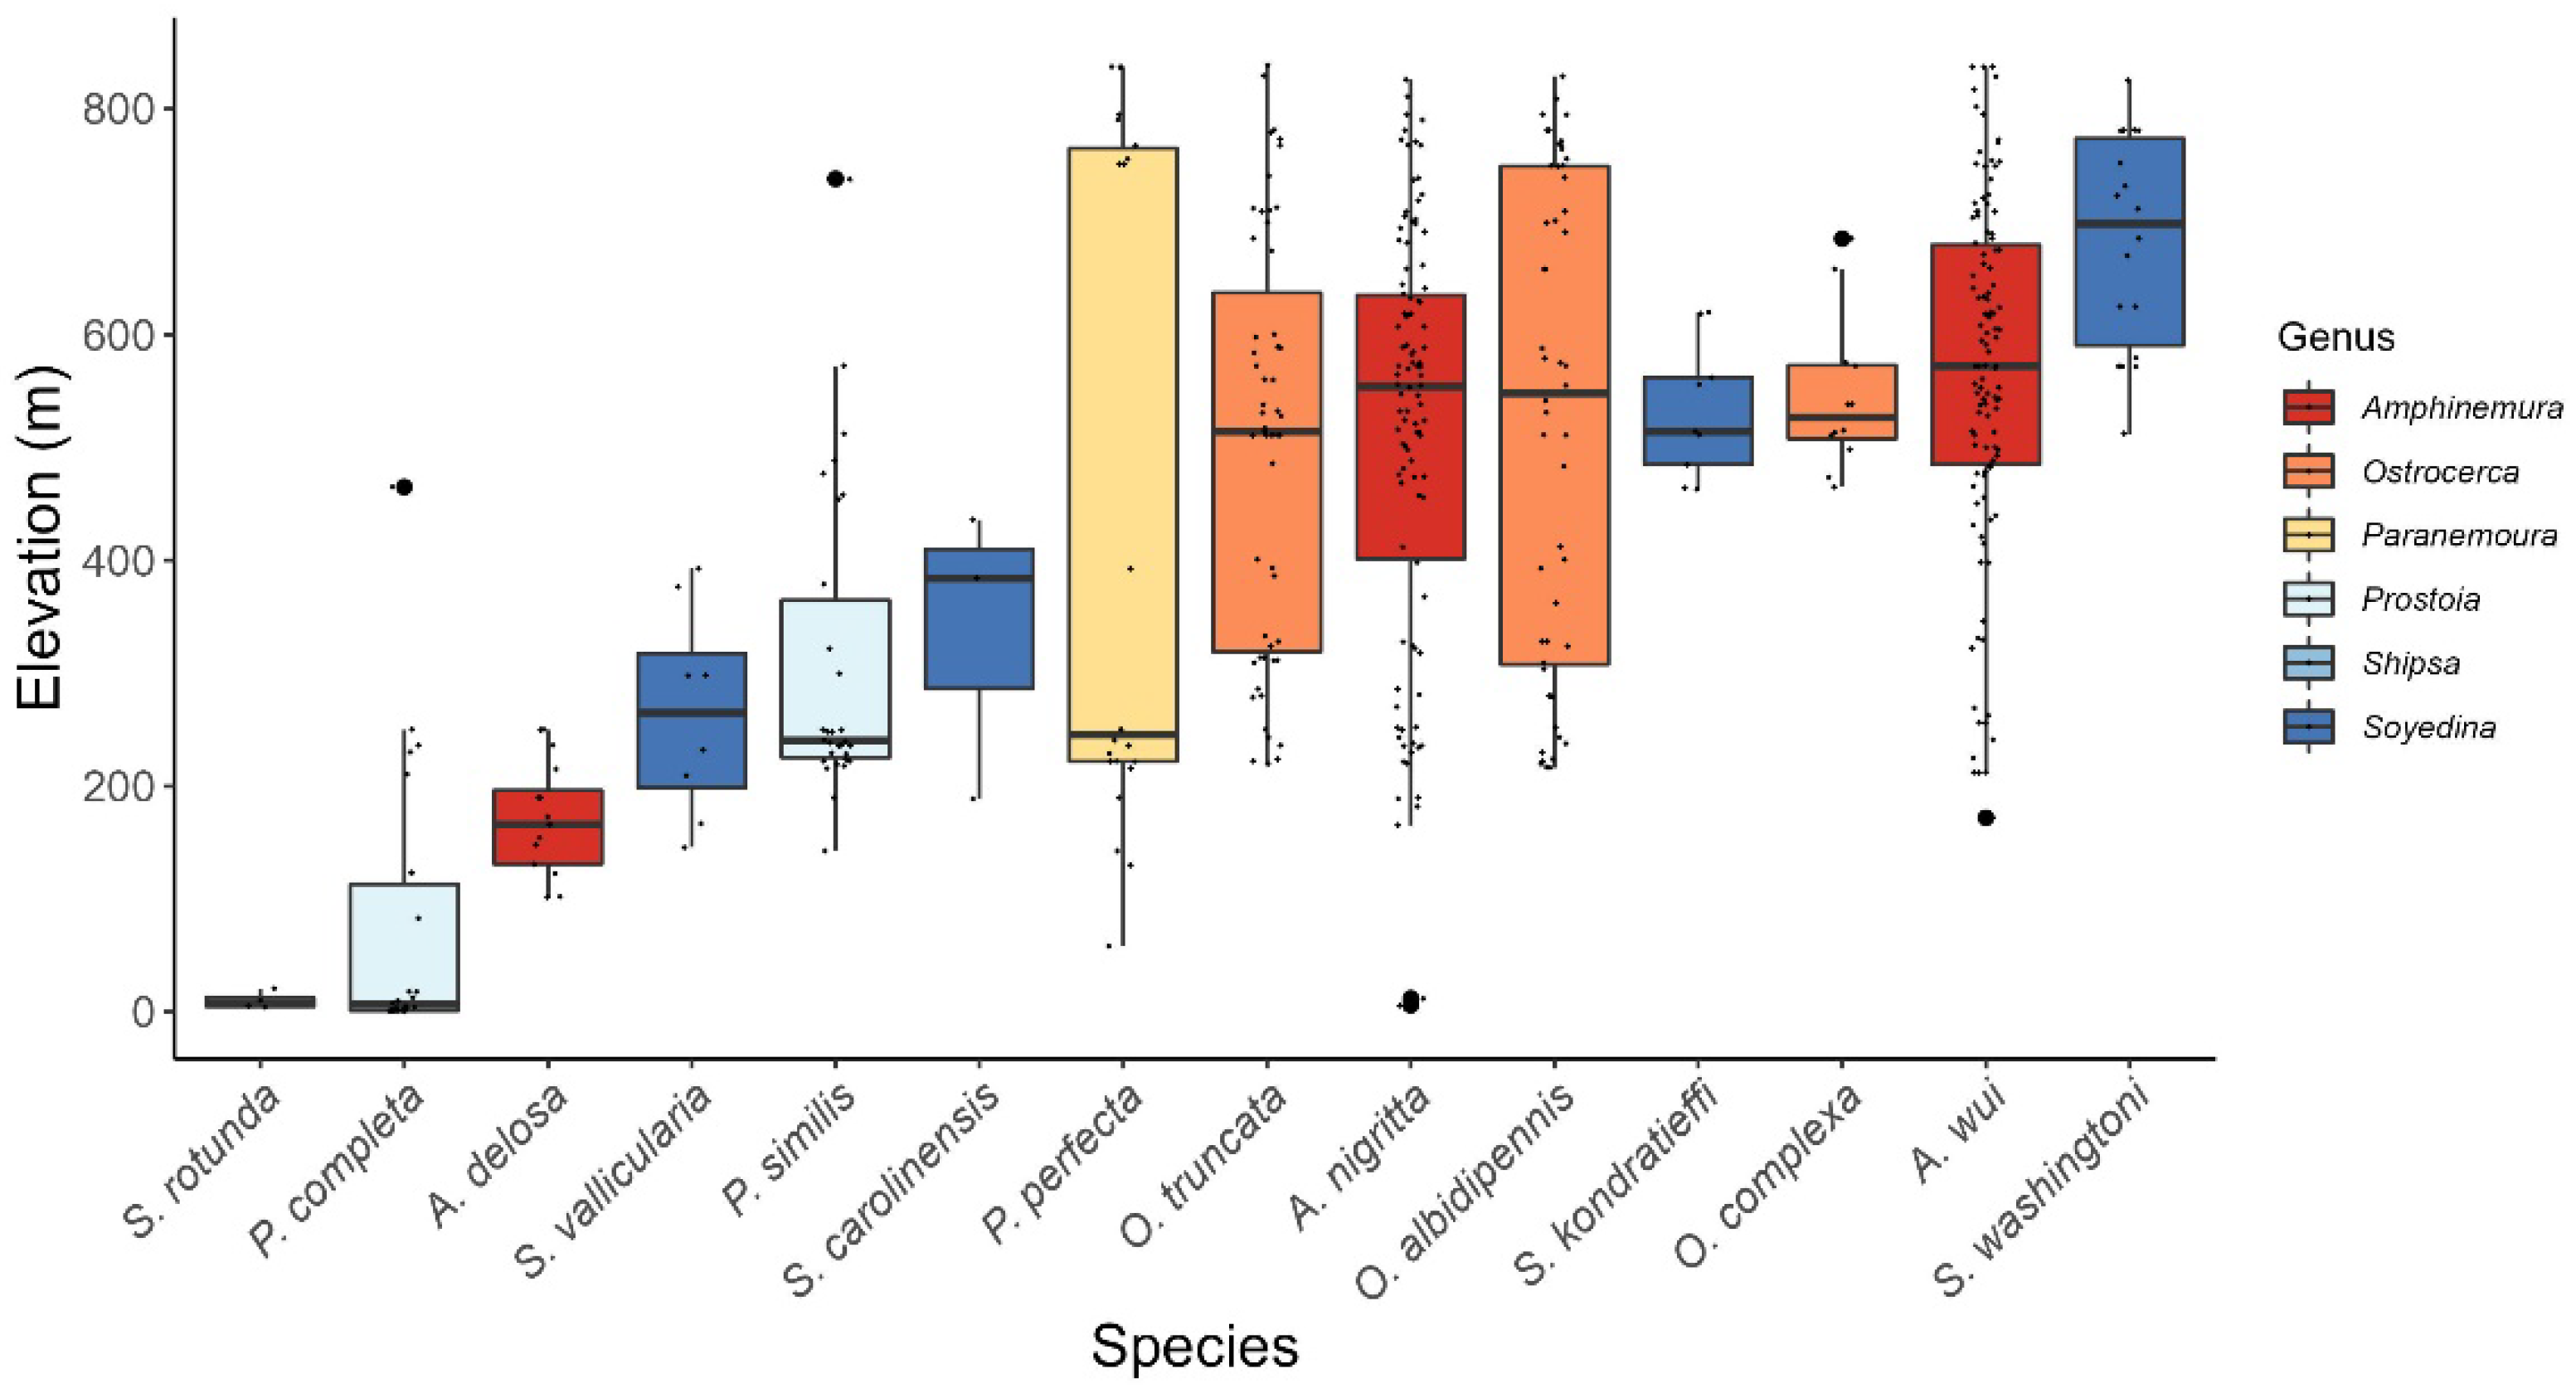
Figure 10.
Elevation boxplots for Nemouridae species recorded from Maryland. Boxes represent the interquartile range, while vertical lines extend to the minimum and maximum values. The horizontal line within the interquartile range represents the median elevation. Outliers are shown with large, solid circles. Small, individual points overlaid on each boxplot illustrate the distribution of observations.
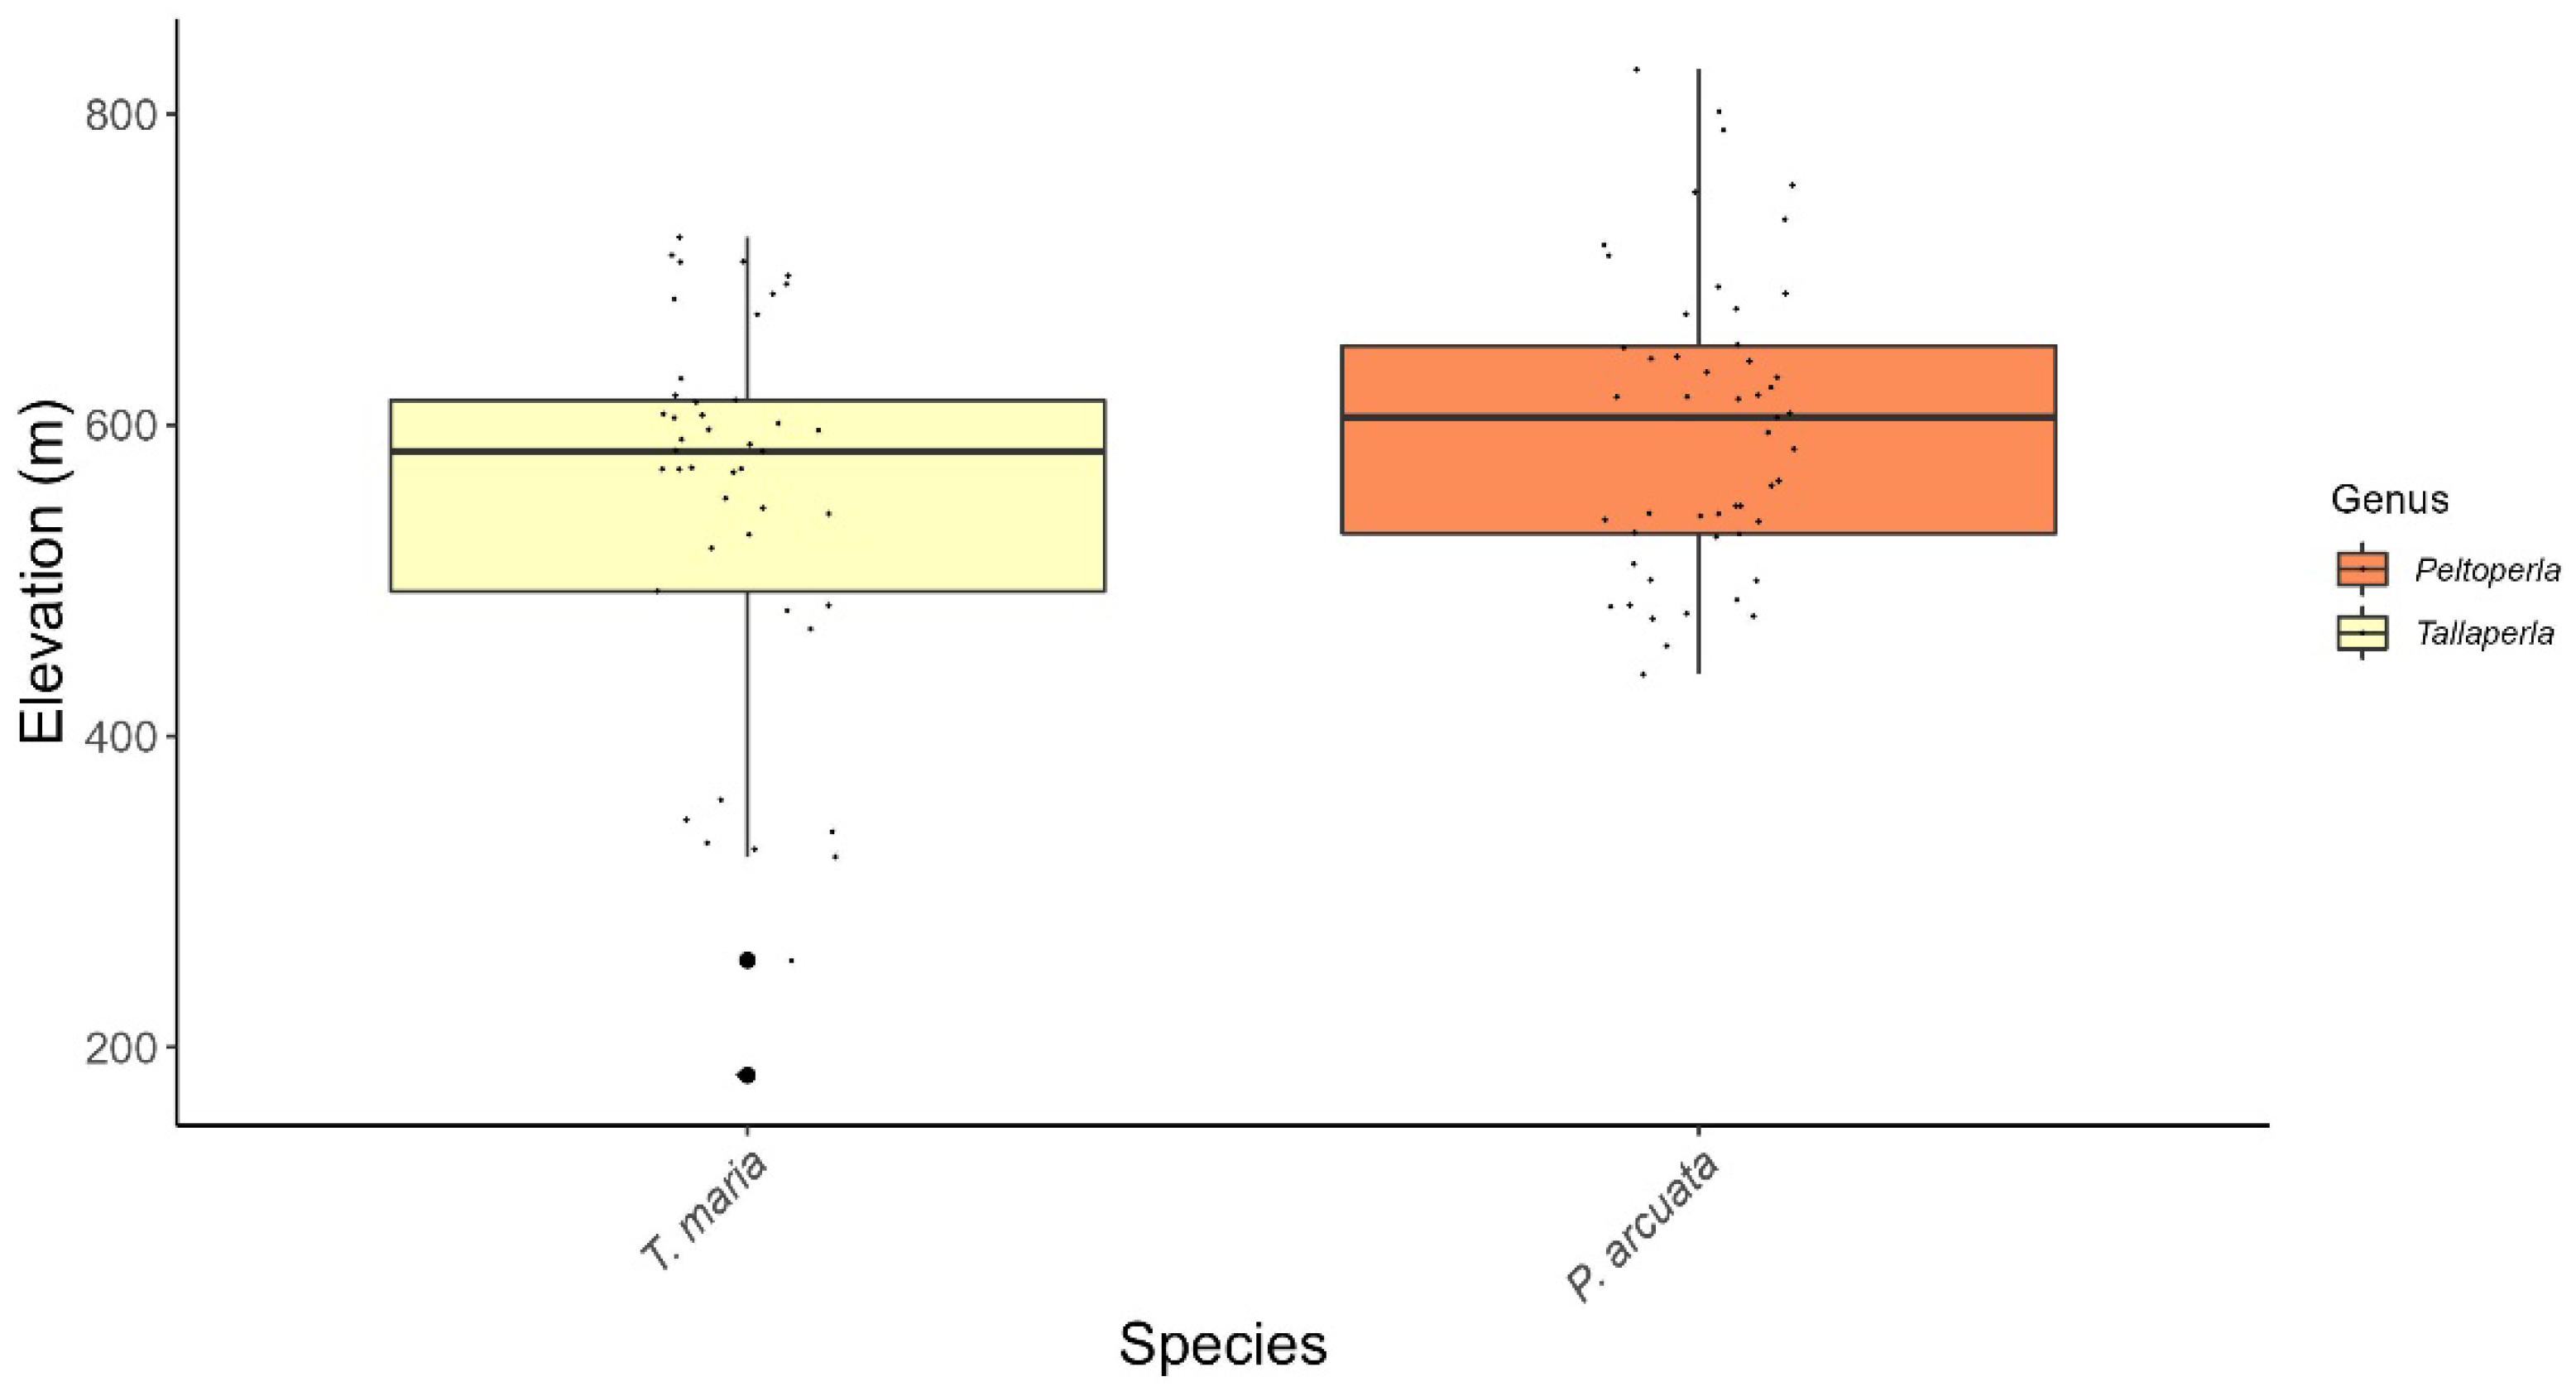
Figure 11.
Elevation boxplots for Peltoperlidae species recorded from Maryland. Boxes represent the interquartile range, while vertical lines extend to the minimum and maximum values. The horizontal line within the interquartile range represents the median elevation. Outliers are shown with large, solid circles. Small, individual points overlaid on each boxplot illustrate the distribution of observations.
Figure 12.
Elevation boxplots for Perlidae species recorded from Maryland. Boxes represent the interquartile range, while vertical lines extend to the minimum and maximum values. The horizontal line within the interquartile range represents the median elevation. Outliers are shown with large, solid circles. Small, individual points overlaid on each boxplot illustrate the distribution of observations.
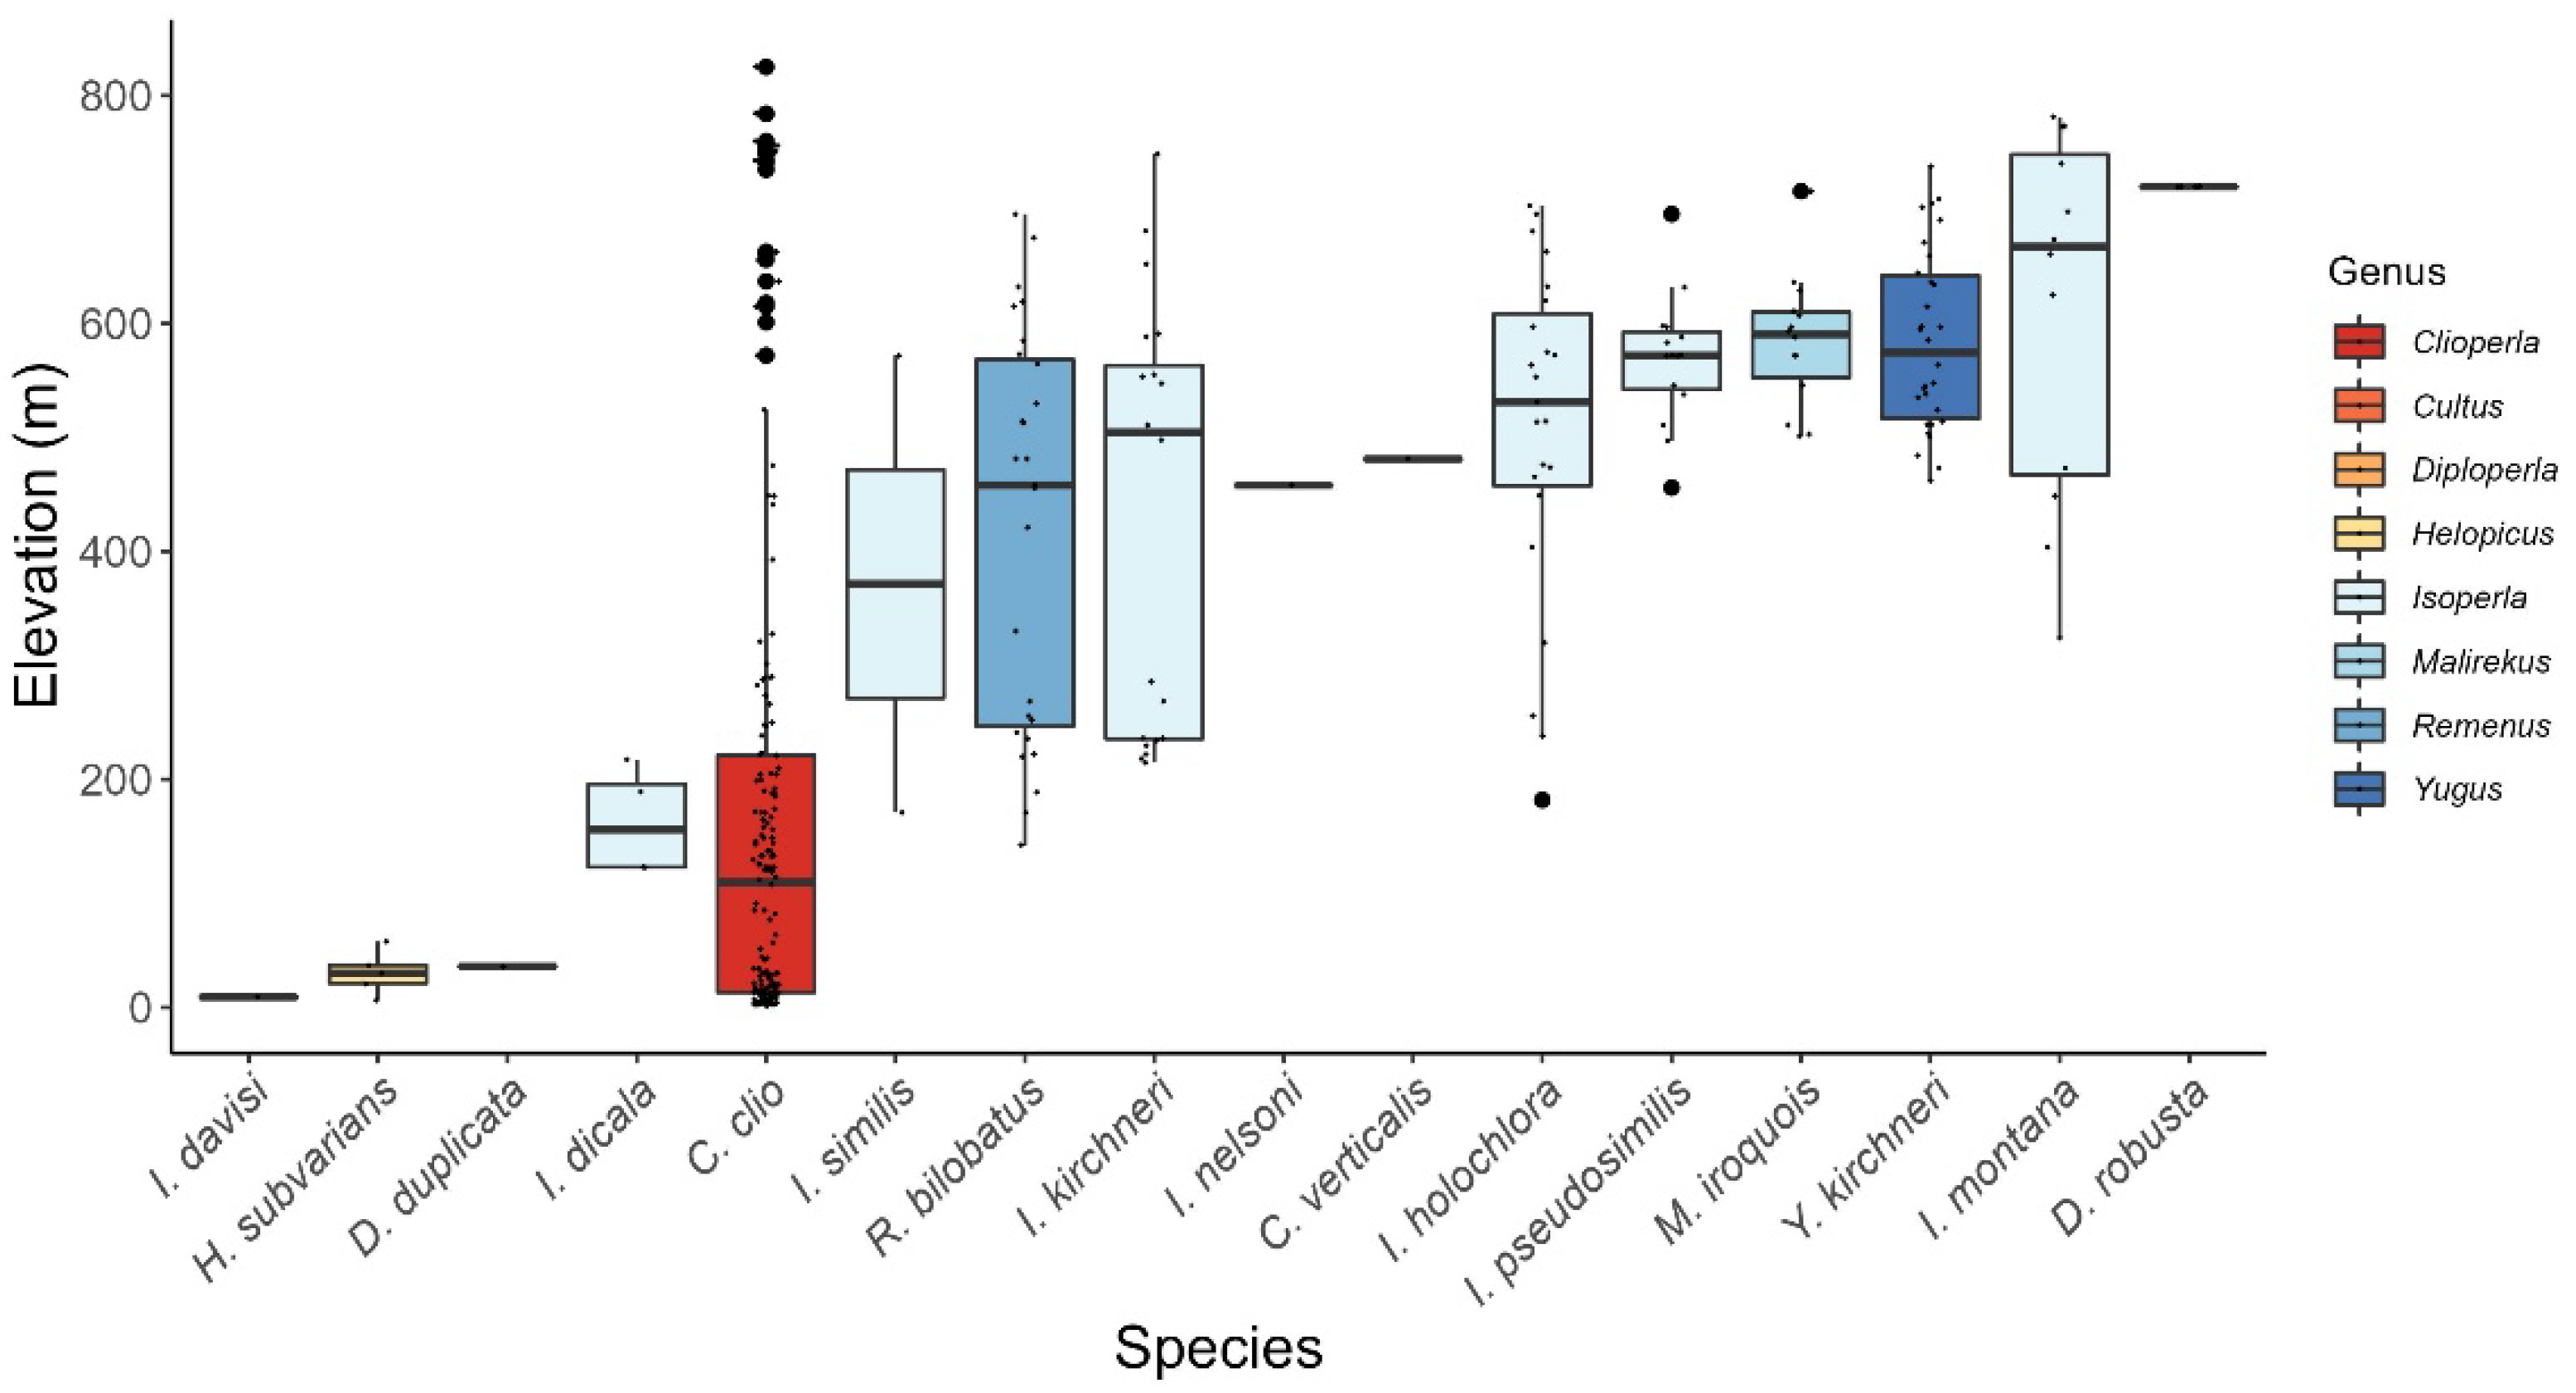
Figure 13.
Elevation boxplots for Perlodidae species recorded from Maryland. Boxes represent the interquartile range, while vertical lines extend to the minimum and maximum values. The horizontal line within the interquartile range represents the median elevation. Outliers are shown with large, solid circles. Small, individual points overlaid on each boxplot illustrate the distribution of observations.
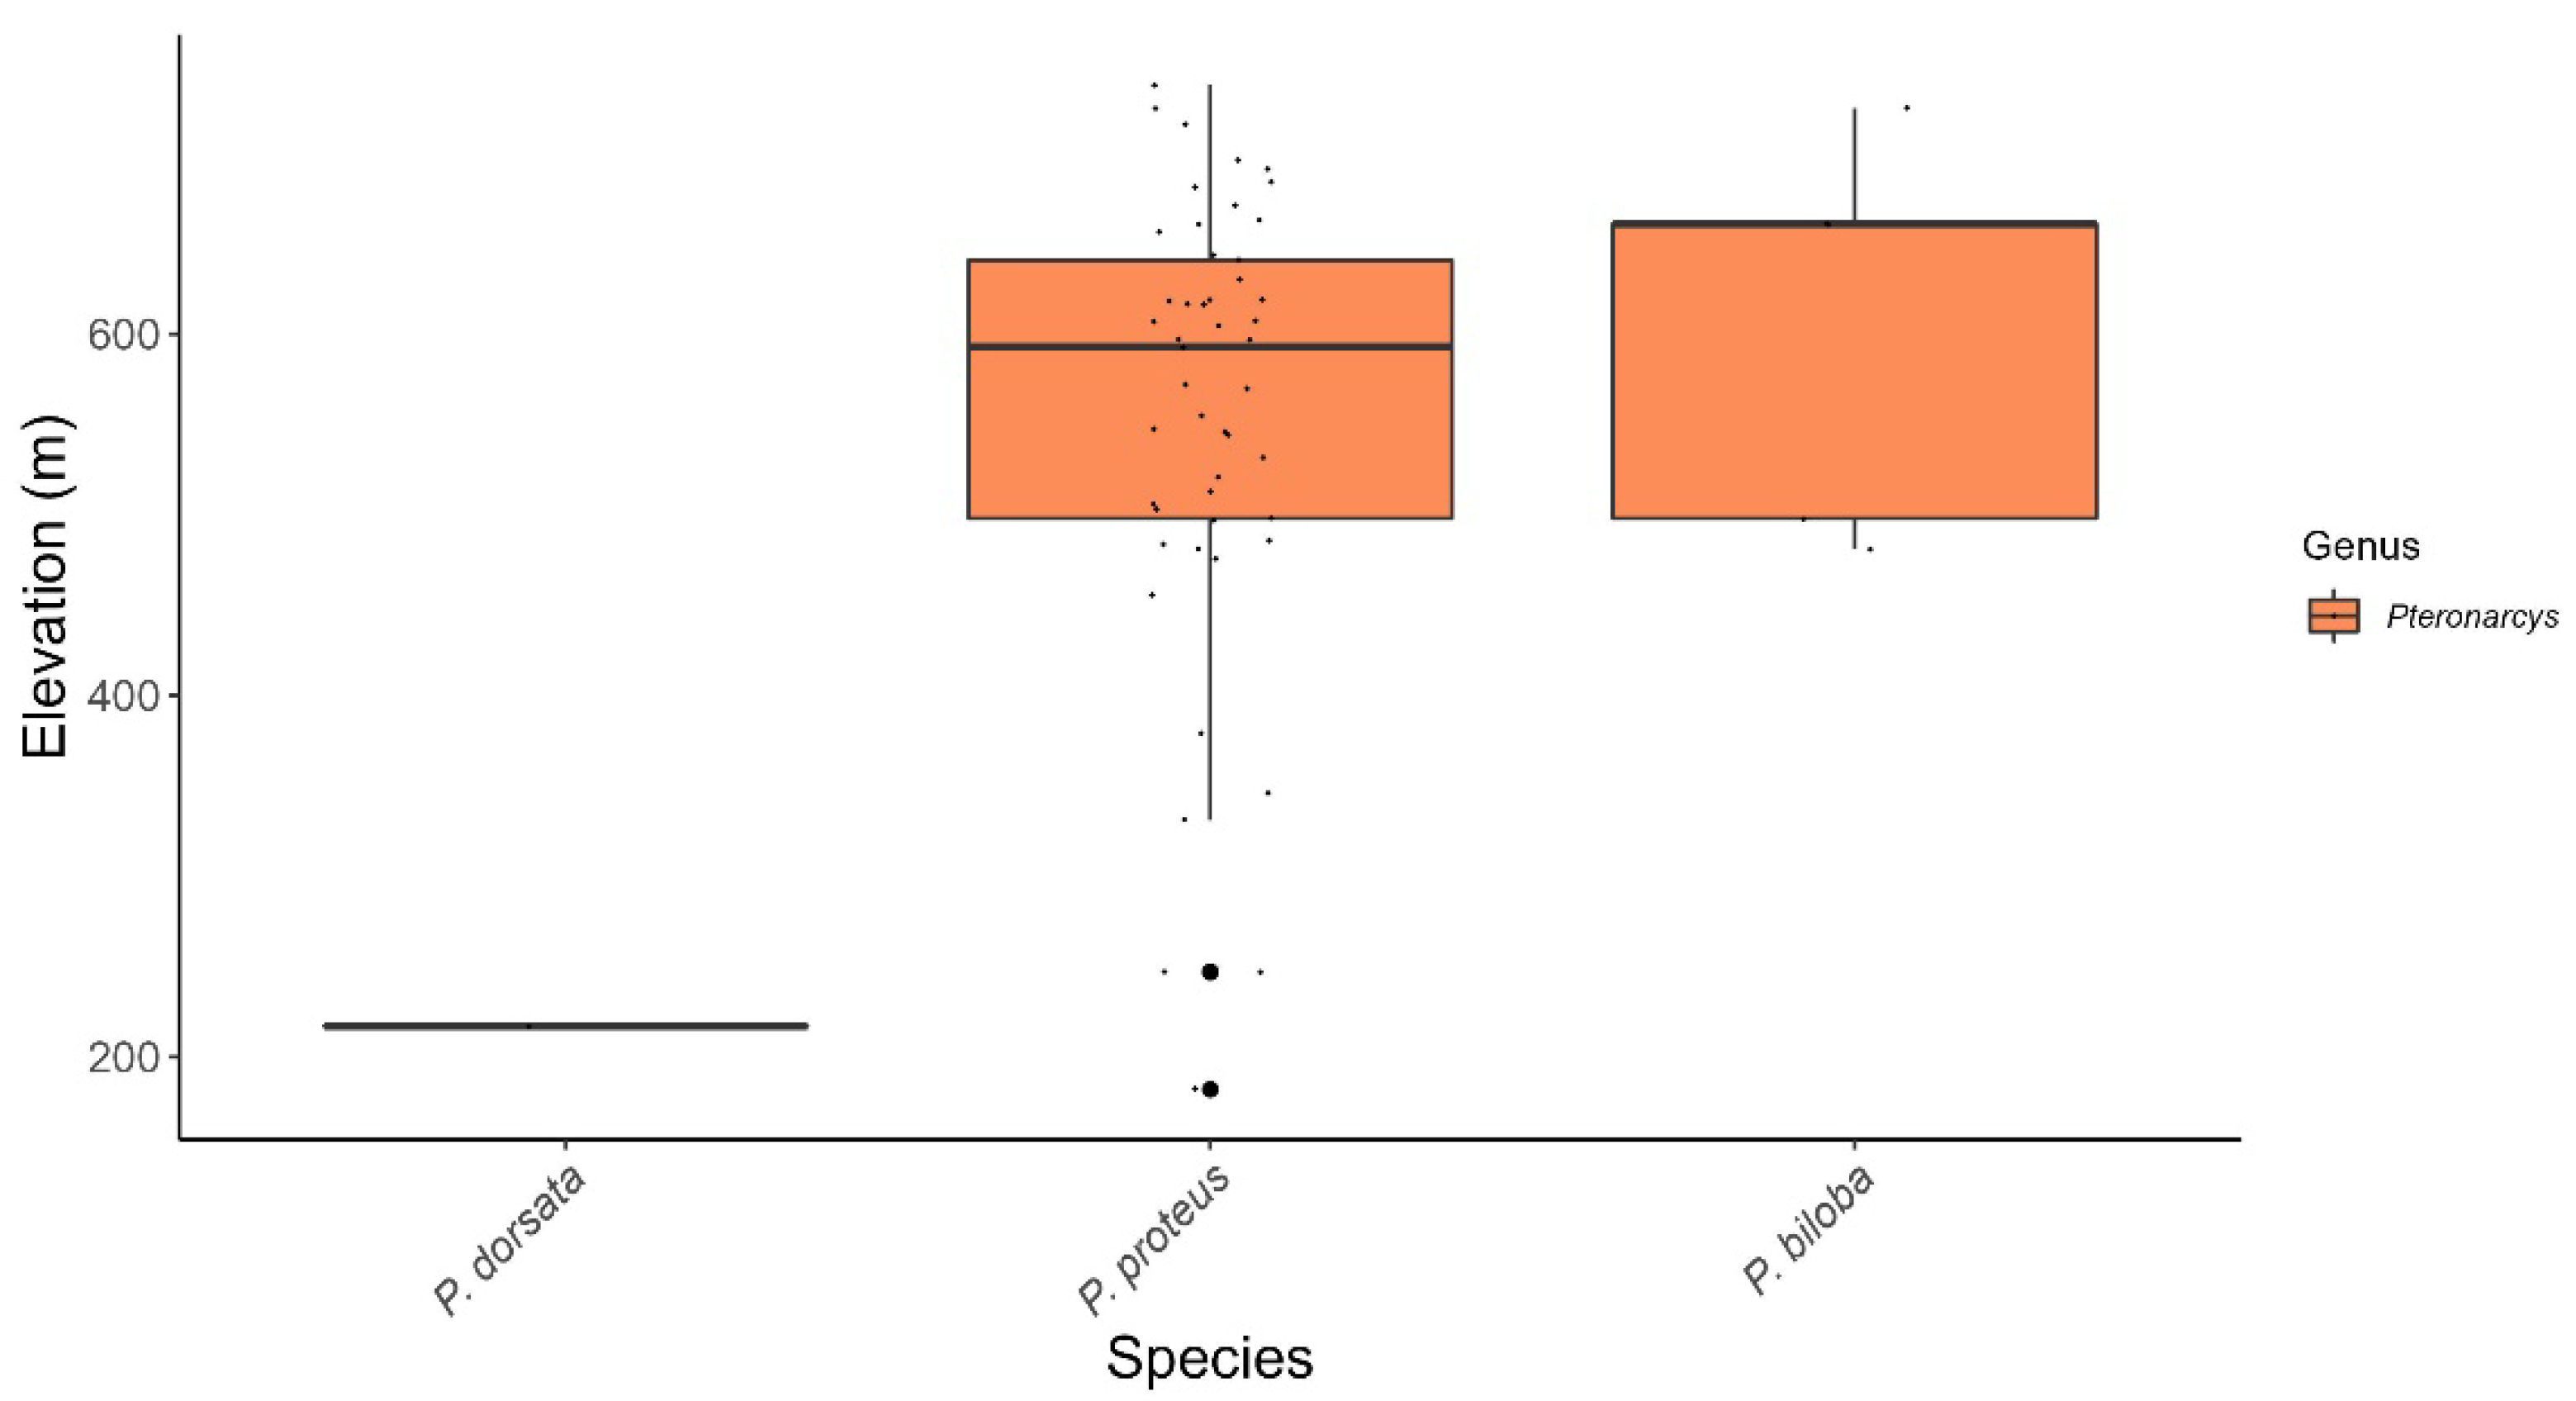
Figure 14.
Elevation boxplots for Pteronarcyidae species recorded from Maryland. Boxes represent the interquartile range, while vertical lines extend to the minimum and maximum values. The horizontal line within the interquartile range represents the median elevation. Outliers are shown with large, solid circles. Small, individual points overlaid on each boxplot illustrate the distribution of observations.
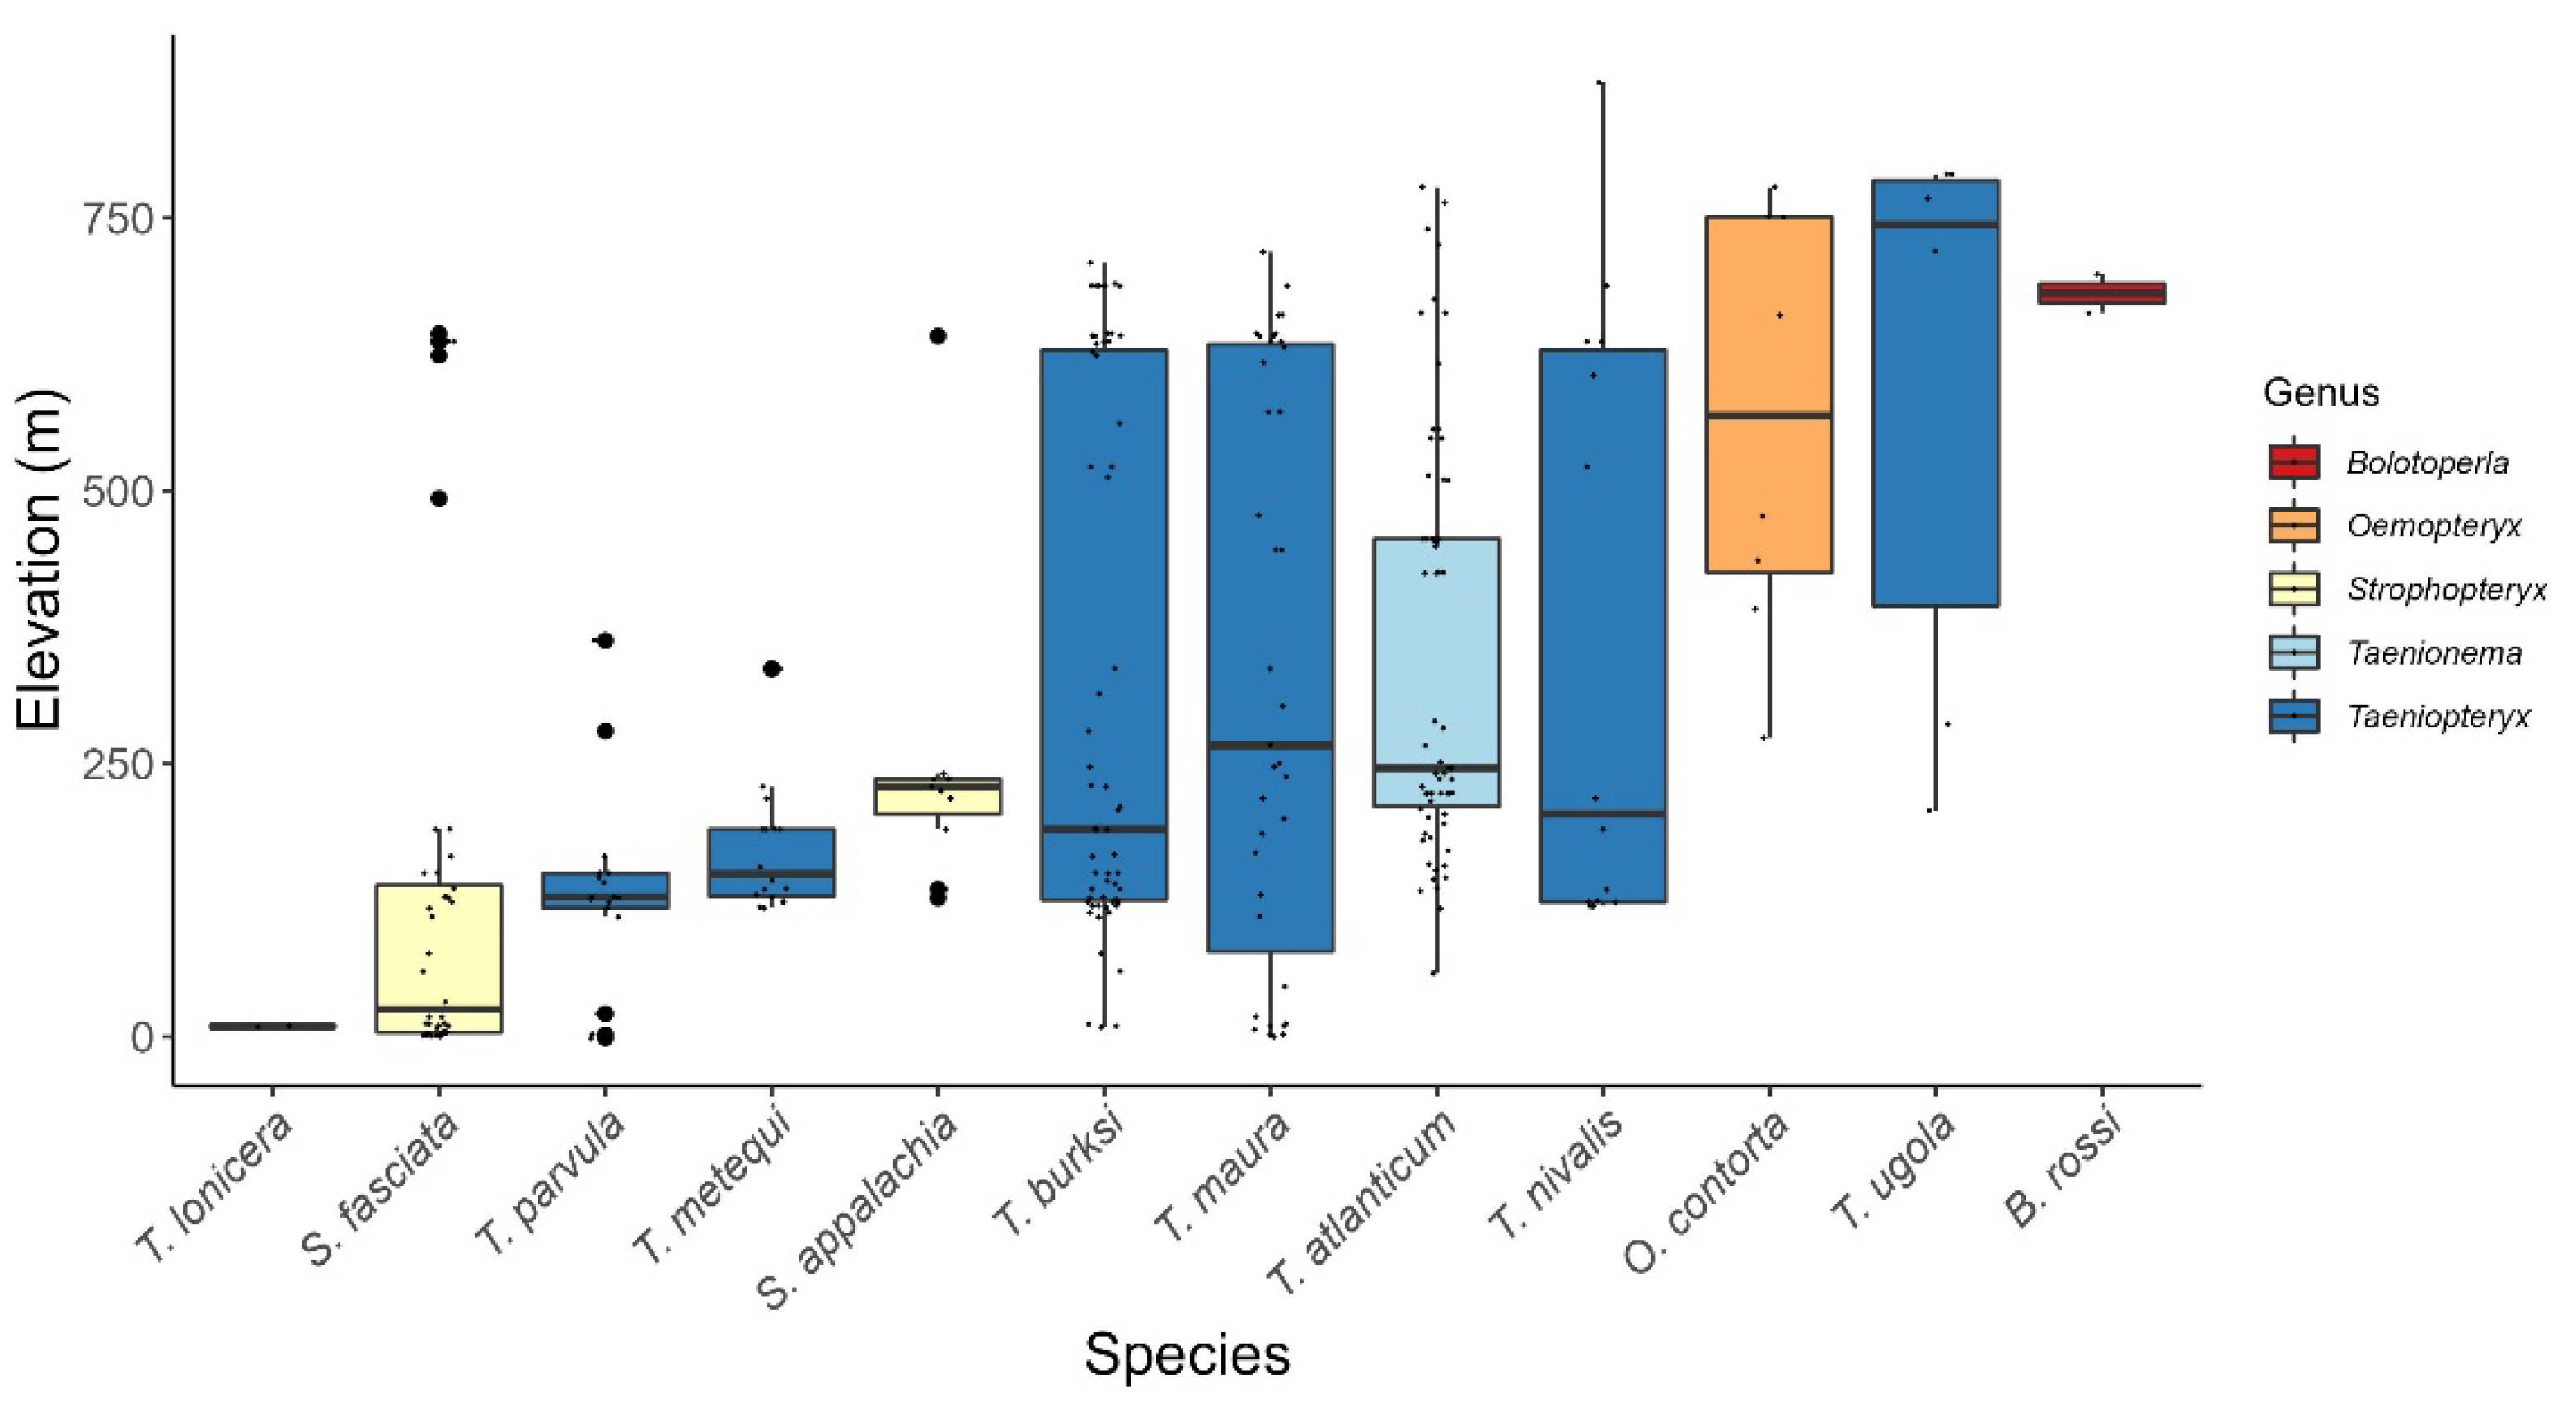
Figure 15.
Elevation boxplots for Taeniopteryigidae species recorded from Maryland. Boxes represent the interquartile range, while vertical lines extend to the minimum and maximum values. The horizontal line within the interquartile range represents the median elevation. Outliers are shown with large, solid circles. Small, individual points overlaid on each boxplot illustrate the distribution of observations.
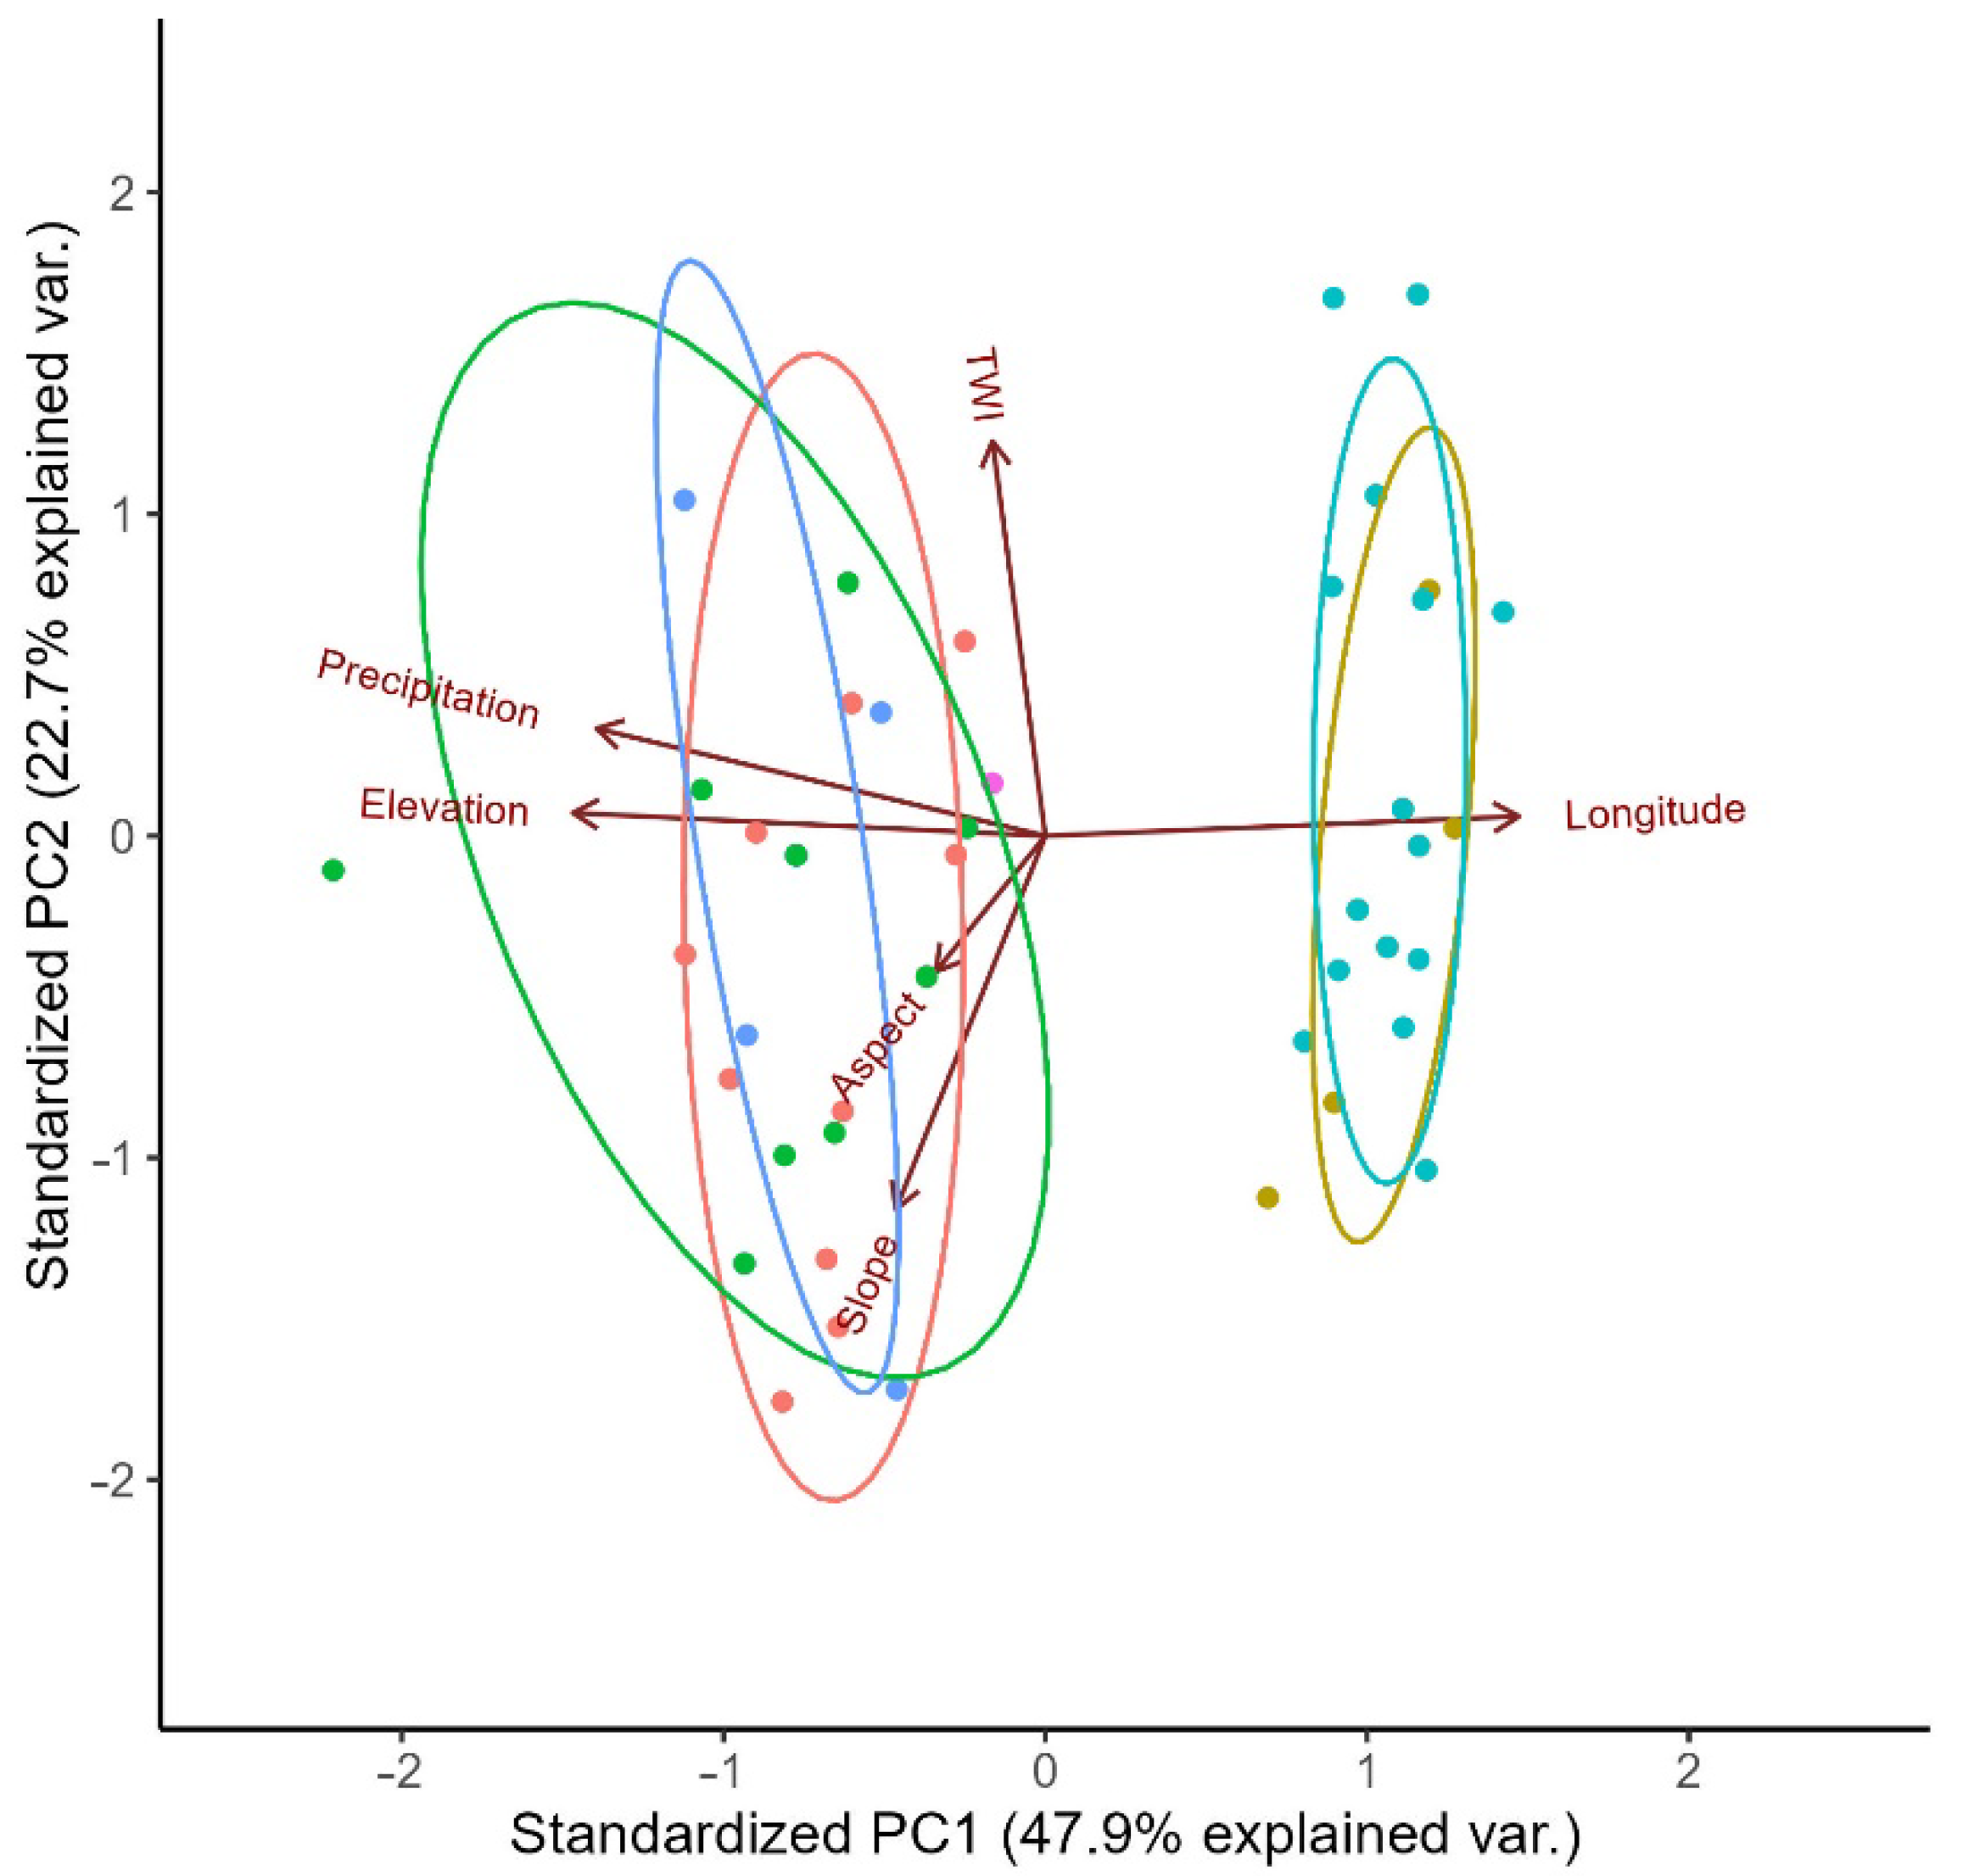
Figure 16.
Principal Component Analysis (PCA) of Maryland’s listed Species of Greatest Conservation Need stoneflies with ordination of topographic and climatic variables. Percentage of variation that each PCA axis explains accompanies the x- and y-axes.
Figure 16.
Principal Component Analysis (PCA) of Maryland’s listed Species of Greatest Conservation Need stoneflies with ordination of topographic and climatic variables. Percentage of variation that each PCA axis explains accompanies the x- and y-axes.
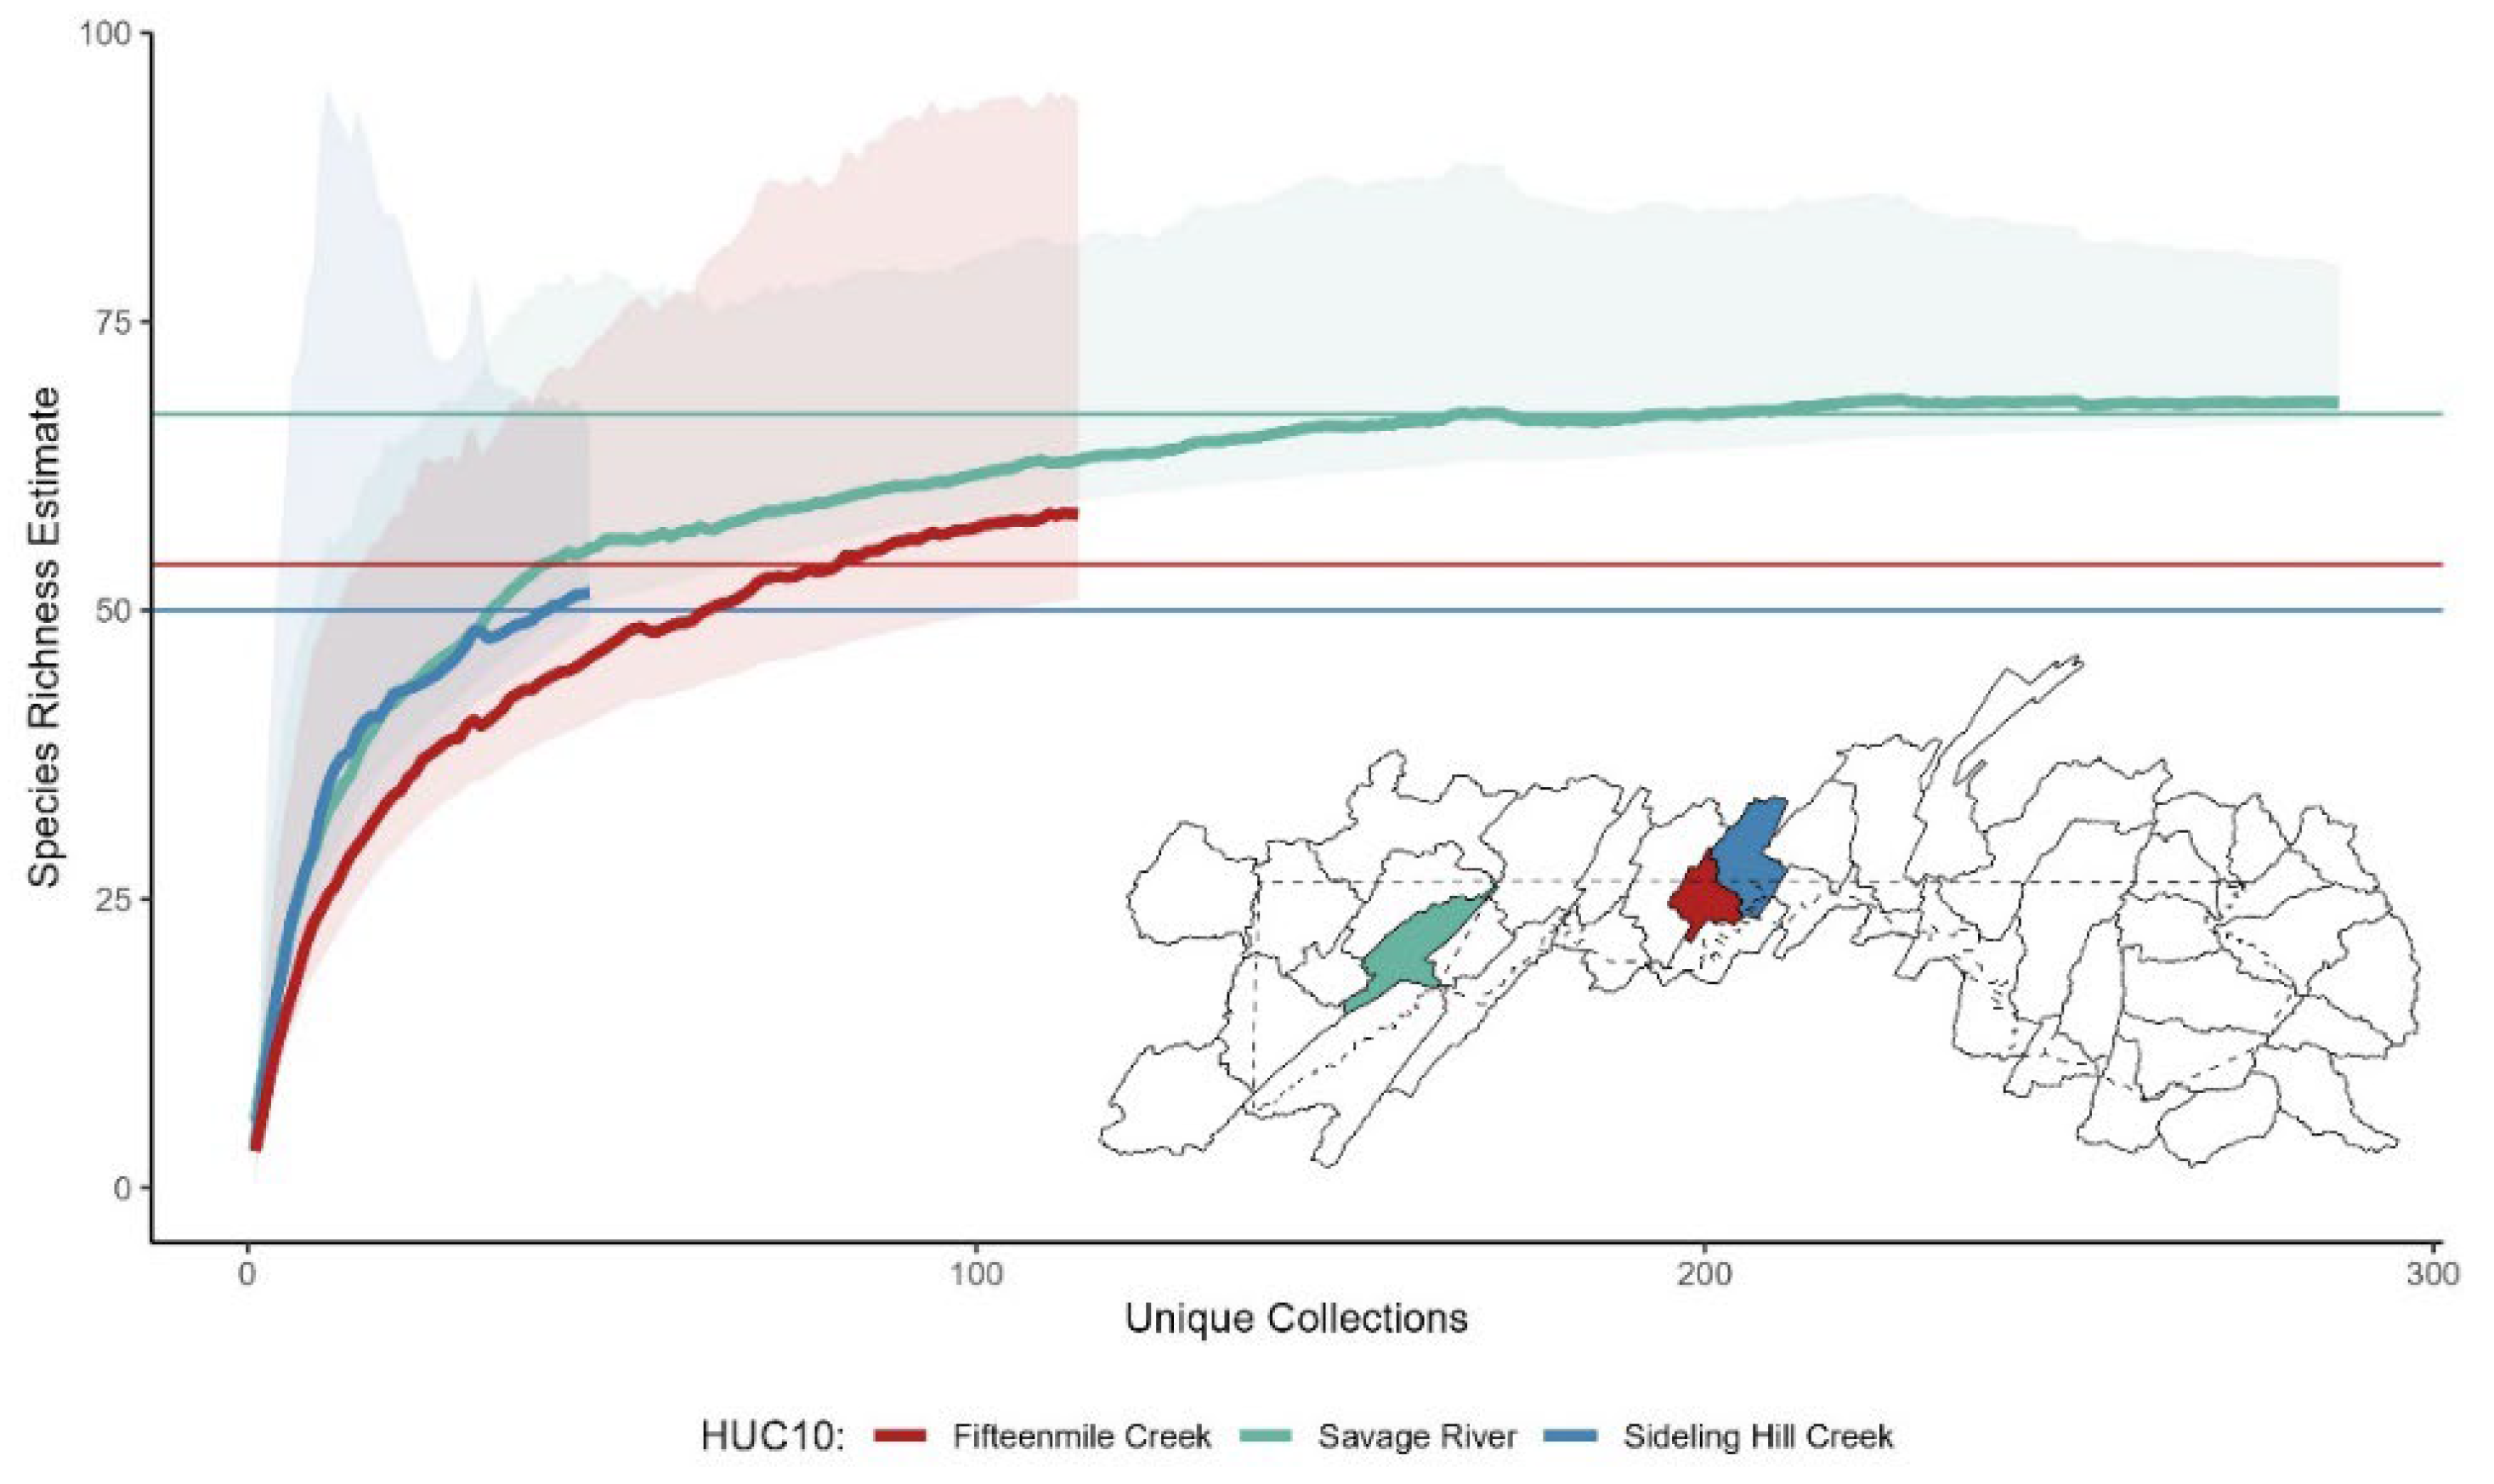
Figure 17.
Chao1 species richness estimates for the three most speciose USGS HUC-10s in Maryland. Horizontal lines indicate observed species richness for each USGS HUC-10. For each estimate, 95% confidence intervals are provided. Locations of each selected HUC-10 within the four westernmost counties of Maryland are represented in an inset map.
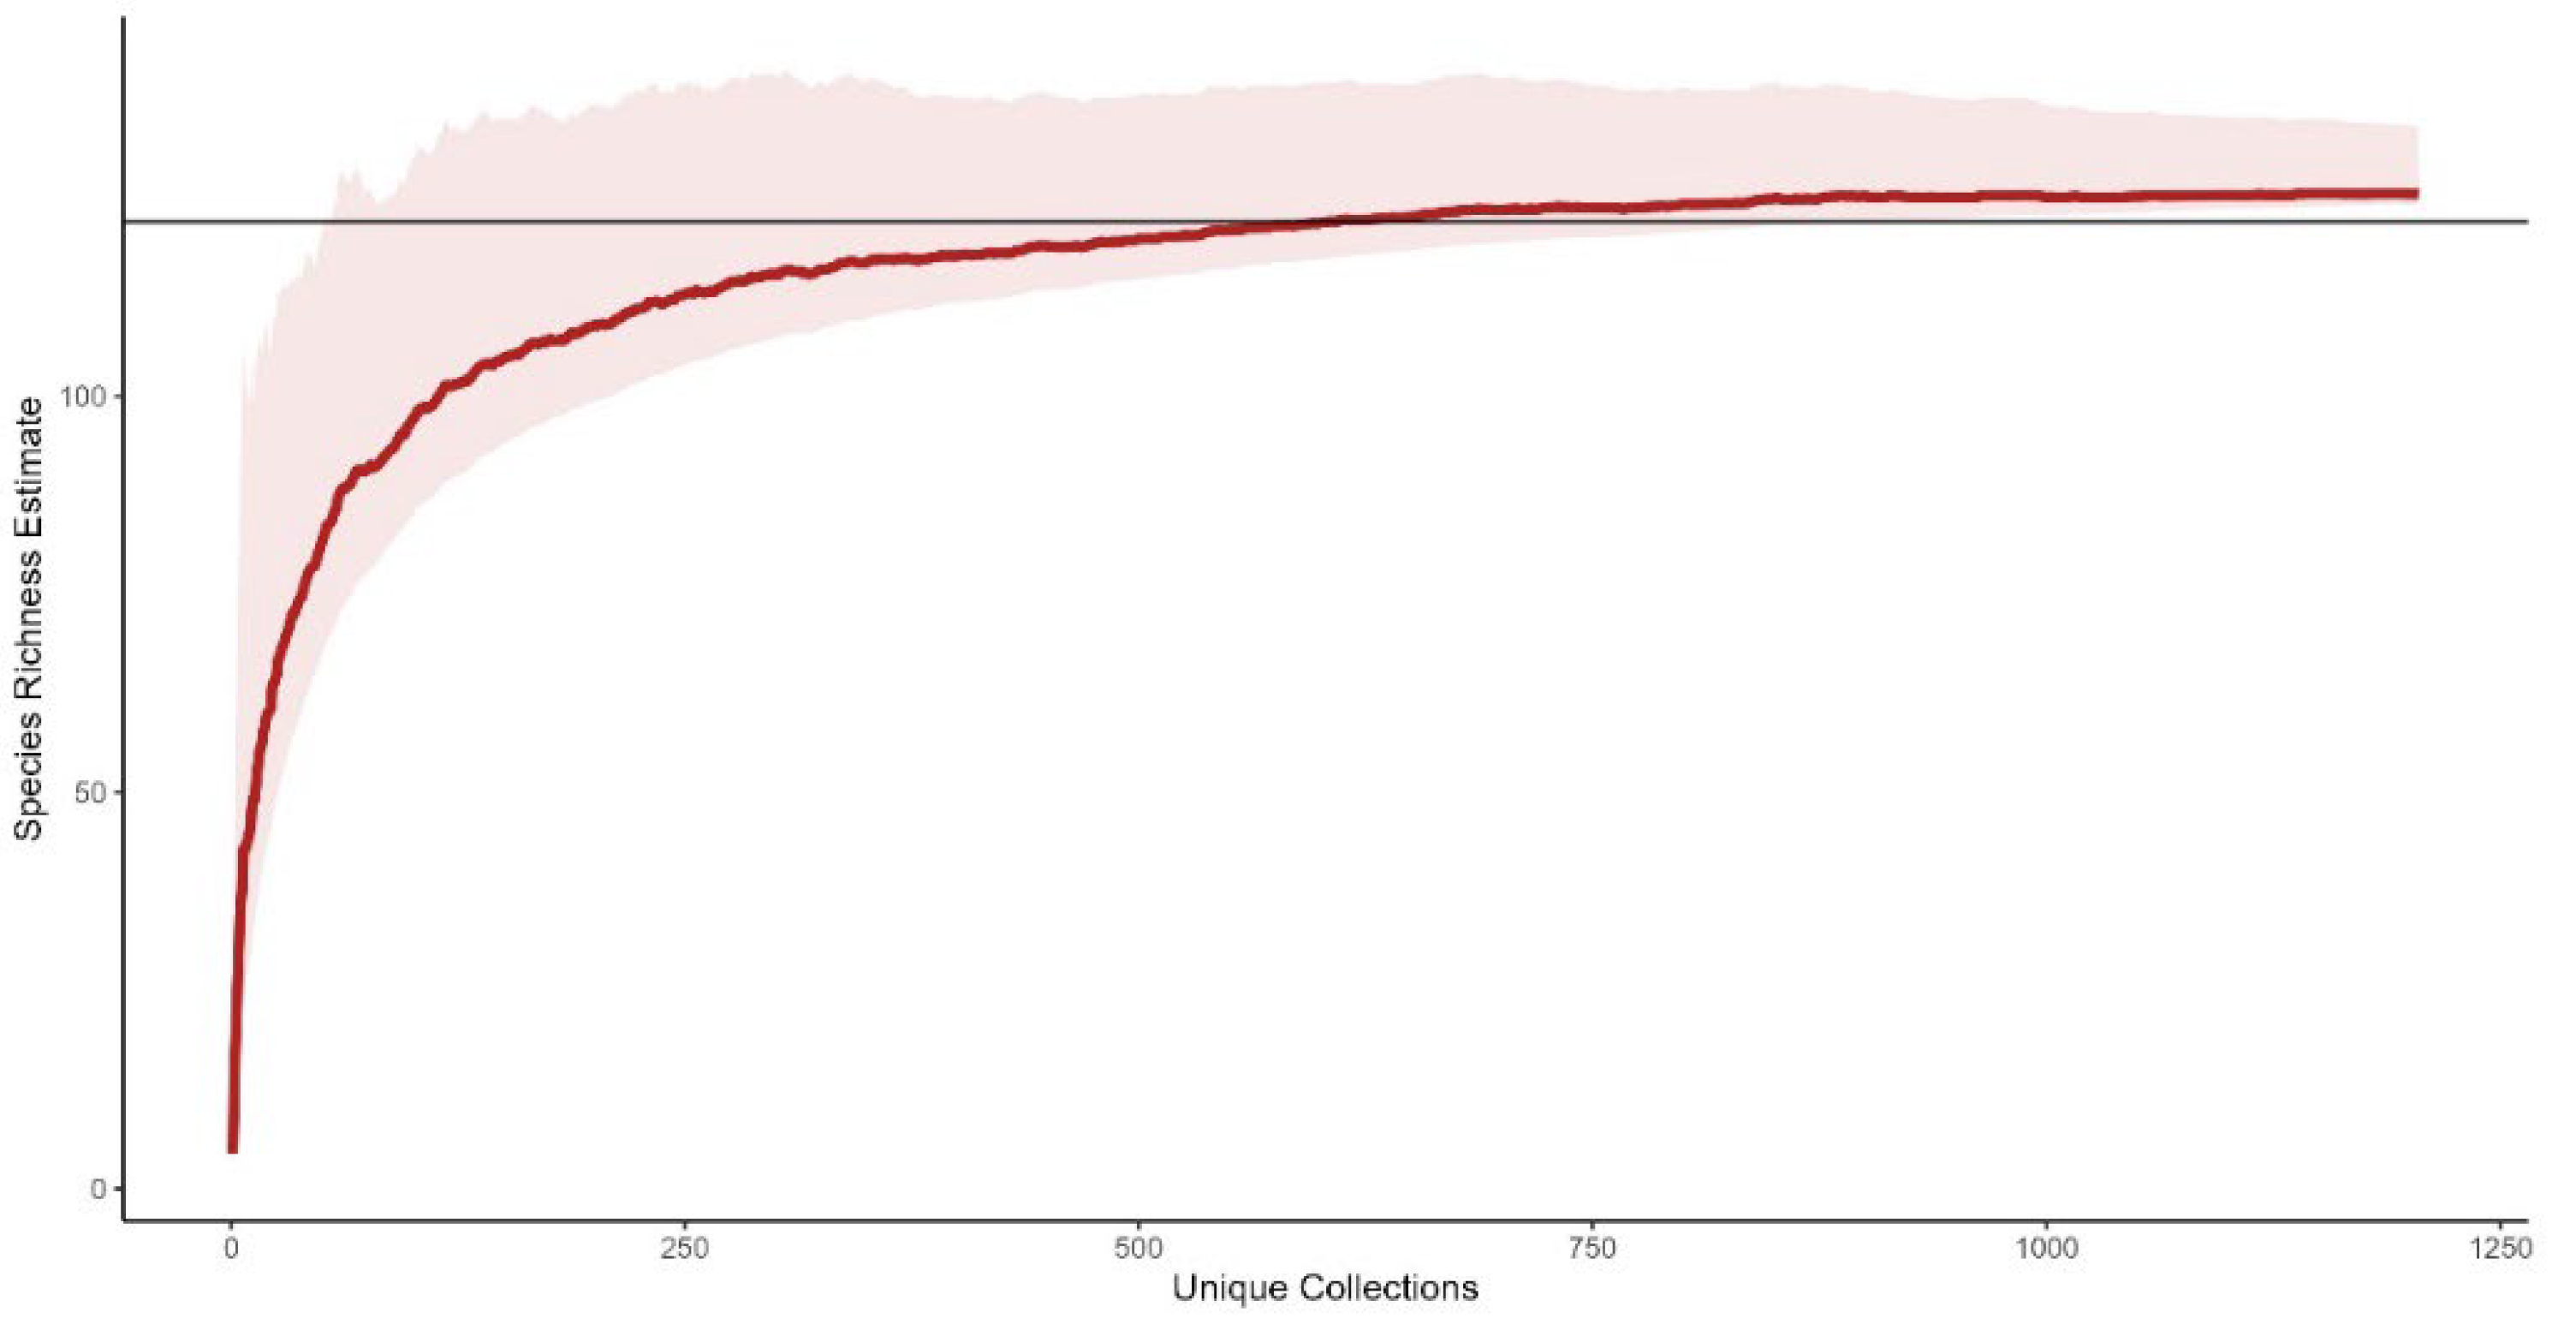
Figure 18.
Chao1 species richness estimate for Maryland. Black horizontal line indicates current observed species richness (n = 122). A 95% confidence interval is provided.
Figure 18.
Chao1 species richness estimate for Maryland. Black horizontal line indicates current observed species richness (n = 122). A 95% confidence interval is provided.
Table 1.
Sources of Maryland stonefly collection records with institution name or collector, coden, and number of records and species represented from each source.
Table 1.
Sources of Maryland stonefly collection records with institution name or collector, coden, and number of records and species represented from each source.
| Collection Source | Coden | Records | Species |
|---|
| Charles H. Nelson Collection | CHNC | 43 | 9 |
| Carnegie Museum of Natural History | CMNH | 2 | 1 |
| Illinois Natural History Survey | INHS | 250 | 42 |
| Literature Records | | 260 | 68 |
| Maryland Biological Stream Survey 1 | MBSS | 231 | 5 |
| Phillip N. Hogan Collection | PNHC | 58 | 27 |
| Rebecca F. Surdick Collection 2 | RFSC | 154 | 33 |
| United States National Museum | USNM | 61 | 31 |
| Western Kentucky University Collection | WKUC | 3052 | 107 |
| | Total | 4084 | |
Table 2.
Updated checklist of Maryland stoneflies. New state records species are indicated with an asterisk (*).
Table 2.
Updated checklist of Maryland stoneflies. New state records species are indicated with an asterisk (*).
| Family | Species | Family | Species |
|---|
| Capniidae | Allocapnia aurora | Peltoperlidae | Peltoperla arcuata |
| | Allocapnia curiosa | | Tallaperla elisa |
| | Allocapnia frisoni | | Tallaperla maria |
| | Allocapnia frumi | Perlidae | Acroneuria abnormis |
| | Allocapnia granulata | | Acroneuria arenosa |
| | Allocapnia harperi | | Acroneuria carolinensis |
| | Allocapnia illinoensis | | Acroneuria filicis |
| | Allocapnia maria | | Acroneuria frisoni |
| | Allocapnia nivicola | | Acroneuria lycorias |
| | Allocapnia pygmaea | | Agnetina annulipes |
| | Allocapnia recta | | Agnetina capitata |
| | Allocapnia rickeri | | Agnetina flavescens |
| | Allocapnia simmonsi * | | Attaneuria ruralis |
| | Allocapnia virginiana * | | Eccoptura xanthenes |
| | Allocapnia vivipara | | Hansonoperla appalachia |
| | Allocapnia wrayi | | Neoperla catharae |
| | Allocapnia zola | | Neoperla robisoni |
| | Paracapnia angulata | | Neoperla stewarti |
| Chloroperlidae | Alloperla aracoma | | Paragnetina immarginata |
| | Alloperla atlantica | | Paragnetina media |
| | Alloperla biserrata | | Perlesta ephelida |
| | Alloperla chloris | | Perlesta mihucorum |
| | Alloperla imbecilla | | Perlesta nelsoni |
| | Alloperla petasata * | | Perlesta placida |
| | Alloperla usa | | Perlesta teaysia |
| | Haploperla brevis | | Perlesta sp. MD-5 |
| | Suwalia marginata | | Perlinella drymo |
| | Sweltsa hoffmani | | Perlinella ephyre |
| | Sweltsa lateralis | Perlodidae | Clioperla clio |
| | Sweltsa onkos | | Cultus verticalis |
| | Sweltsa palearata | | Diploperla duplicata |
| | Sweltsa pocahontas | | Diploperla robusta |
| | Utaperla gaspesiana | | Helopicus subvarians * |
| Leuctridae | Leuctra alexanderi | | Isogenoides hansoni |
| | Leuctra carolinensis | | Isoperla burksi |
| | Leuctra duplicata | | Isoperla davisi * |
| | Leuctra ferruginea | | Isoperla dicala |
| | Leuctra grandis | | Isoperla gibbsae |
| | Leuctra rickeri | | Isoperla holochlora |
| | Leuctra sibleyi | | Isoperla kirchneri |
| | Leuctra tenella | | Isoperla montana |
| | Leuctra tenuis | | Isoperla nelsoni * |
| | Leuctra truncata * | | Isoperla pseudosimilis |
| | Leuctra variabilis | | Isoperla similis |
| | Megaleuctra flinti | | Malirekus iroquois |
| | Paraleuctra sara | | Remenus bilobatus |
| Nemouridae | Amphinemura delosa | | Yugus kirchneri |
| | Amphinemura nigritta | Pteronarcyidae | Pteronarcys biloba |
| | Amphinemura wui | | Pteronarcys dorsata |
| | Ostrocerca albidipennis | | Pteronarcys proteus |
| | Ostrocerca complexa | Taeniopterygidae | Bolotoperla rossi * |
| | Ostrocerca truncata | | Oemopteryx contorta |
| | Paranemoura perfecta | | Strophopteryx appalachia |
| | Prostoia completa | | Strophopteryx fasciata |
| | Prostoia similis | | Taenionema atlanticum |
| | Shipsa rotunda | | Taeniopteryx burksi |
| | Soyedina carolinensis | | Taeniopteryx lonicera |
| | Soyedina kondratieffi | | Taeniopteryx maura |
| | Soyedina vallicularia | | Taeniopteryx metequi |
| | Soyedina washingtoni | | Taeniopteryx nivalis |
| | | | Taeniopteryx parvula |
Table 3.
Recorded adult presence for Maryland stonefly families. Months are broken into three 10-day periods. Dark blue squares represent periods with positive collection data. Gray squares represent periods between positive collections when species may be collected.
Table 3.
Recorded adult presence for Maryland stonefly families. Months are broken into three 10-day periods. Dark blue squares represent periods with positive collection data. Gray squares represent periods between positive collections when species may be collected.
| | Jan | Feb | Mar | Apr | May | Jun | Jul | Aug | Sept | Oct | Nov | Dec |
|---|
| Family | 1 | 2 | 3 | 1 | 2 | 3 | 1 | 2 | 3 | 1 | 2 | 3 | 1 | 2 | 3 | 1 | 2 | 3 | 1 | 2 | 3 | 1 | 2 | 3 | 1 | 2 | 3 | 1 | 2 | 3 | 1 | 2 | 3 | 1 | 2 | 3 |
|---|
| Leuctridae | | | | | | | | | | | | | | | | | | | | | | | | | | | | | | | | | | | | |
| Capniidae | | | | | | | | | | | | | | | | | | | | | | | | | | | | | | | | | | | | |
| Taeniopterygidae | | | | | | | | | | | | | | | | | | | | | | | | | | | | | | | | | | | | |
| Nemouridae | | | | | | | | | | | | | | | | | | | | | | | | | | | | | | | | | | | | |
| Perlodidae | | | | | | | | | | | | | | | | | | | | | | | | | | | | | | | | | | | | |
| Pteronarcyidae | | | | | | | | | | | | | | | | | | | | | | | | | | | | | | | | | | | | |
| Chloroperlidae | | | | | | | | | | | | | | | | | | | | | | | | | | | | | | | | | | | | |
| Perlidae | | | | | | | | | | | | | | | | | | | | | | | | | | | | | | | | | | | | |
| Peltoperlidae | | | | | | | | | | | | | | | | | | | | | | | | | | | | | | | | | | | | |
Table 4.
Recorded adult Capniidae presence in Maryland. Months are broken into three 10-day periods. Dark blue squares represent periods with collections. Gray squares represent periods when species may be collected.
Table 4.
Recorded adult Capniidae presence in Maryland. Months are broken into three 10-day periods. Dark blue squares represent periods with collections. Gray squares represent periods when species may be collected.
| | Nov | Dec | Jan | Feb | Mar | Apr | May |
|---|
| Species | 1 | 2 | 3 | 1 | 2 | 3 | 1 | 2 | 3 | 1 | 2 | 3 | 1 | 2 | 3 | 1 | 2 | 3 | 1 | 2 | 3 |
|---|
| Allocapnia nivicola | | | 1 | 1 | 1 | 1 | | | | | | | | | | | | | | | |
| Allocapnia wrayi | | | 1 | 1 | 1 | 1 | | | | | | | | | | | | | | | |
| Allocapnia granulata | | | | | | | | | | | | | | | | | | | | | |
| Allocapnia recta | | | | | | | | | | | | | | | | | | | | | |
| Allocapnia virginiana | | | | | | | | | | | | | | | | | | | | | |
| Allocapnia rickeri | | | | | | | | | | | | | | | | | | | | | |
| Allocapnia pygmaea | | | | | | | | | | | | | | | | | | | | | |
| Allocapnia frisoni | | | | | | | | | | | | | | | | | | | | | |
| Allocapnia curiosa | | | | | | | | | | | | | | | | | | | | | |
| Allocapnia illinoensis | | | | | | | | | | | | | | | | | | | | | |
| Allocapnia maria | | | | | | | | | | | | | | | | | | | | | |
| Allocapnia aurora | | | | | | | | | | | | | | | | | | | | | |
| Allocapnia zola | | | | | | | | | | | | | | | | | | | | | |
| Allocapnia frumi | | | | | | | | | | | | | | | | | | | | | |
| Allocapnia simmonsi | | | | | | | | | | | | | | | | | | | | | |
| Allocapnia harperi | | | | | | | | | | | | | | | | | | | | | |
| Paracapnia angulata | | | | | | | | | | | | | | | | | | | | | |
| Allocapnia vivipara | | | | | | | | | | | | | | | | | | | | | |
Table 5.
Recorded adult Chloroperlidae presence in Maryland. Months are broken into three 10-day periods. Dark blue squares represent periods with collections. Gray squares represent periods when species may be collected.
Table 5.
Recorded adult Chloroperlidae presence in Maryland. Months are broken into three 10-day periods. Dark blue squares represent periods with collections. Gray squares represent periods when species may be collected.
| | Apr | May | Jun | Jul | Aug |
|---|
| Species | 1 | 2 | 3 | 1 | 2 | 3 | 1 | 2 | 3 | 1 | 2 | 3 | 1 | 2 | 3 |
|---|
| Sweltsa pocahontas | | | | | | | | | | | | | | | |
| Haploperla brevis | | | | | | | | | | | | | | | |
| Sweltsa palearata | | | | | | | | | | | | | | | |
| Utaperla gaspesiana | | | | | | | | | | | | | | | |
| Sweltsa hoffmani | | | | | | | | | | | | | | | |
| Sweltsa onkos | | | | | | | | | | | | | | | |
| Alloperla imbecilla | | | | | | | | | | | | | | | |
| Sweltsa lateralis | | | | | | | | | | | | | | | |
| Alloperla biserrata | | | | | | | | | | | | | | | |
| Alloperla aracoma | | | | | | | | | | | | | | | |
| Alloperla usa | | | | | | | | | | | | | | | |
| Alloperla atlantica | | | | | | | | | | | | | | | |
| Alloperla petasata | | | | | | | | | | | | | | | |
| Alloperla chloris | | | | | | | | | | | | | | | |
| Suwallia marginata | | | | | | | | | | | | | | | |
Table 6.
Recorded adult Leuctridae presence in Maryland. Months are broken into three 10-day periods. Dark blue squares represent periods with collections. Gray squares represent periods when species may be collected.
Table 6.
Recorded adult Leuctridae presence in Maryland. Months are broken into three 10-day periods. Dark blue squares represent periods with collections. Gray squares represent periods when species may be collected.
| | Jan | Feb | Mar | Apr | May | Jun | Jul | Aug | Sept | Oct | Nov | Dec |
|---|
| Species | 1 | 2 | 3 | 1 | 2 | 3 | 1 | 2 | 3 | 1 | 2 | 3 | 1 | 2 | 3 | 1 | 2 | 3 | 1 | 2 | 3 | 1 | 2 | 3 | 1 | 2 | 3 | 1 | 2 | 3 | 1 | 2 | 3 | 1 | 2 | 3 |
|---|
| Paraleuctra sara | | | | | | | | | | | | | | | | | | | | | | | | | | | | | | | | | | | | |
| Leuctra ferruginea | | | | | | | | | | | | | | | | | | | | | | | | | | | | | | | | | | | | |
| Leuctra duplicata | | | | | | | | | | | | | | | | | | | | | | | | | | | | | | | | | | | | |
| Leuctra sibleyi | | | | | | | | | | | | | | | | | | | | | | | | | | | | | | | | | | | | |
| Megaleuctra flinti | | | | | | | | | | | | | | | | | | | | | | | | | | | | | | | | | | | | |
| Leuctra alexanderi | | | | | | | | | | | | | | | | | | | | | | | | | | | | | | | | | | | | |
| Leuctra grandis | | | | | | | | | | | | | | | | | | | | | | | | | | | | | | | | | | | | |
| Leuctra tenella | | | | | | | | | | | | | | | | | | | | | | | | | | | | | | | | | | | | |
| Leuctra carolinensis | | | | | | | | | | | | | | | | | | | | | | | | | | | | | | | | | | | | |
| Leuctra rickeri | | | | | | | | | | | | | | | | | | | | | | | | | | | | | | | | | | | | |
| Leuctra variabilis | | | | | | | | | | | | | | | | | | | | | | | | | | | | | | | | | | | | |
| Leuctra tenuis | | | | | | | | | | | | | | | | | | | | | | | | | | | | | | | | | | | | |
Table 7.
Recorded adult Nemouridae presence in Maryland. Months are broken into three 10-day periods. Dark blue squares represent periods with collections. Gray squares represent periods when species may be collected.
Table 7.
Recorded adult Nemouridae presence in Maryland. Months are broken into three 10-day periods. Dark blue squares represent periods with collections. Gray squares represent periods when species may be collected.
| | Feb | Mar | Apr | May | Jun | Jul | Aug | Sept |
|---|
| Species | 1 | 2 | 3 | 1 | 2 | 3 | 1 | 2 | 3 | 1 | 2 | 3 | 1 | 2 | 3 | 1 | 2 | 3 | 1 | 2 | 3 | 1 | 2 | 3 |
|---|
| Prostoia completa | | | | | | | | | | | | | | | | | | | | | | | | |
| Shipsa rotunda | | | | | | | | | | | | | | | | | | | | | | | | |
| Soyedina washingtoni | | | | | | | | | | | | | | | | | | | | | | | | |
| Soyedina vallicularia | | | | | | | | | | | | | | | | | | | | | | | | |
| Paranemoura perfecta | | | | | | | | | | | | | | | | | | | | | | | | |
| Prostoia similis | | | | | | | | | | | | | | | | | | | | | | | | |
| Soyedina carolinensis | | | | | | | | | | | | | | | | | | | | | | | | |
| Amphinemura wui | | | | | | | | | | | | | | | | | | | | | | | | |
| Soyedina kondratieffi | | | | | | | | | | | | | | | | | | | | | | | | |
| Ostrocerca truncata | | | | | | | | | | | | | | | | | | | | | | | | |
| Ostrocerca albidipennis | | | | | | | | | | | | | | | | | | | | | | | | |
| Amphinemura nigritta | | | | | | | | | | | | | | | | | | | | | | | | |
| Ostrocerca complexa | | | | | | | | | | | | | | | | | | | | | | | | |
| Amphinemura delosa | | | | | | | | | | | | | | | | | | | | | | | | |
Table 8.
Recorded adult Peltoperlidae presence in Maryland. Months are broken into three 10-day periods. Dark blue squares represent periods with collections. Gray squares represent periods when species may be collected.
Table 8.
Recorded adult Peltoperlidae presence in Maryland. Months are broken into three 10-day periods. Dark blue squares represent periods with collections. Gray squares represent periods when species may be collected.
| | May | Jun | Jul | Aug |
|---|
| Species | 1 | 2 | 3 | 1 | 2 | 3 | 1 | 2 | 3 | 1 | 2 | 3 |
|---|
| Tallaperla maria | | | | | | | | | | | | |
| Peltoperla arcuata | | | | | | | | | | | | |
Table 9.
Recorded adult Perlidae presence in Maryland. Months are broken into three 10-day periods. Dark blue squares represent periods with collections. Gray squares represent periods when species may be collected.
Table 9.
Recorded adult Perlidae presence in Maryland. Months are broken into three 10-day periods. Dark blue squares represent periods with collections. Gray squares represent periods when species may be collected.
| | Apr | May | Jun | Jul | Aug | Sept |
|---|
| Species | 1 | 2 | 3 | 1 | 2 | 3 | 1 | 2 | 3 | 1 | 2 | 3 | 1 | 2 | 3 | 1 | 2 | 3 |
|---|
| Acroneuria lycorias | | | | | | | | | | | | | | | | | | |
| Hansonoperla appalachia | | | | | | | | | | | | | | | | | | |
| Acroneuria carolinensis | | | | | | | | | | | | | | | | | | |
| Agnetina capitata | | | | | | | | | | | | | | | | | | |
| Acroneuria abnormis | | | | | | | | | | | | | | | | | | |
| Acroneuria frisoni | | | | | | | | | | | | | | | | | | |
| Agnetina flavescens | | | | | | | | | | | | | | | | | | |
| Perlesta mihucorum | | | | | | | | | | | | | | | | | | |
| Agnetina annulipes | | | | | | | | | | | | | | | | | | |
| Acroneuria arenosa | | | | | | | | | | | | | | | | | | |
| Perlesta ephelida | | | | | | | | | | | | | | | | | | |
| Attaneuria ruralis | | | | | | | | | | | | | | | | | | |
| Eccoptura xanthenes | | | | | | | | | | | | | | | | | | |
| Perlinella ephyre | | | | | | | | | | | | | | | | | | |
| Neoperla stewarti | | | | | | | | | | | | | | | | | | |
| Perlesta placida | | | | | | | | | | | | | | | | | | |
| Perlesta teaysia | | | | | | | | | | | | | | | | | | |
| Paragnetina media | | | | | | | | | | | | | | | | | | |
| Neoperla robisoni | | | | | | | | | | | | | | | | | | |
| Paragnetina immarginata | | | | | | | | | | | | | | | | | | |
| Perlesta MD-5 | | | | | | | | | | | | | | | | | | |
| Perlesta nelsoni | | | | | | | | | | | | | | | | | | |
| Acroneuria filicis | | | | | | | | | | | | | | | | | | |
| Neoperla catharae | | | | | | | | | | | | | | | | | | |
Table 10.
Recorded adult Perlodidae presence in Maryland. Months are broken into three 10-day periods. Dark blue squares represent periods with collections. Gray squares represent periods when species may be collected.
Table 10.
Recorded adult Perlodidae presence in Maryland. Months are broken into three 10-day periods. Dark blue squares represent periods with collections. Gray squares represent periods when species may be collected.
| | Mar | Apr | May | Jun | Jul | Aug | Sept |
|---|
| Species | 1 | 2 | 3 | 1 | 2 | 3 | 1 | 2 | 3 | 1 | 2 | 3 | 1 | 2 | 3 | 1 | 2 | 3 | 1 | 2 | 3 |
|---|
| Clioperla clio | | | | | | | | | | | | | | | | | | | | | |
| Helopicus subvarians | | | | | | | | | | | | | | | | | | | | | |
| Isoperla similis | | | | | | | | | | | | | | | | | | | | | |
| Diploperla robusta | | | | | | | | | | | | | | | | | | | | | |
| Isoperla pseudosimilis | | | | | | | | | | | | | | | | | | | | | |
| Isoperla montana | | | | | | | | | | | | | | | | | | | | | |
| Malirekus iroquois | | | | | | | | | | | | | | | | | | | | | |
| Isoperla dicala | | | | | | | | | | | | | | | | | | | | | |
| Isoperla kirchneri | | | | | | | | | | | | | | | | | | | | | |
| Yugus kirchneri | | | | | | | | | | | | | | | | | | | | | |
| Isoperla holochlora | | | | | | | | | | | | | | | | | | | | | |
| Remenus bilobatus | | | | | | | | | | | | | | | | | | | | | |
| Diploperla duplicata | | | | | | | | | | | | | | | | | | | | | |
| Isoperla davisi | | | | | | | | | | | | | | | | | | | | | |
| Isoperla burksi | | | | | | | | | | | | | | | | | | | | | |
| Cultus verticalis | | | | | | | | | | | | | | | | | | | | | |
| Isoperla nelsoni | | | | | | | | | | | | | | | | | | | | | |
Table 11.
Recorded adult Pteronarcyidae presence in Maryland. Months are broken into three 10-day periods. Dark blue squares represent periods with collections. Gray squares represent periods when species may be collected.
Table 11.
Recorded adult Pteronarcyidae presence in Maryland. Months are broken into three 10-day periods. Dark blue squares represent periods with collections. Gray squares represent periods when species may be collected.
| | Mar | Apr | May | Jun | Jul |
|---|
| Species | 1 | 2 | 3 | 1 | 2 | 3 | 1 | 2 | 3 | 1 | 2 | 3 | 1 | 2 | 3 |
|---|
| Pteronarcys proteus | | | | | | | | | | | | | | | |
| Pteronarcys biloba | | | | | | | | | | | | | | | |
| Pteronarcys dorsata | | | | | | | | | | | | | | | |
Table 12.
Recorded adult Taeniopterygidae presence in Maryland. Months are broken into three 10-day periods. Dark blue squares represent periods with collections. Gray squares represent periods when species may be collected.
Table 12.
Recorded adult Taeniopterygidae presence in Maryland. Months are broken into three 10-day periods. Dark blue squares represent periods with collections. Gray squares represent periods when species may be collected.
| | Dec | Jan | Feb | Mar | Apr | May |
|---|
| Species | 1 | 2 | 3 | 1 | 2 | 3 | 1 | 2 | 3 | 1 | 2 | 3 | 1 | 2 | 3 | 1 | 2 | 3 |
|---|
| Taeniopteryx lonicera | | | | | | | | | | | | | | | | | | |
| Taeniopteryx nivalis | | | | | | | | | | | | | | | | | | |
| Taeniopteryx maura | | | | | | | | | | | | | | | | | | |
| Taeniopteryx burksi | | | | | | | | | | | | | | | | | | |
| Taeniopteryx parvula | | | | | | | | | | | | | | | | | | |
| Strophopteryx fasciata | | | | | | | | | | | | | | | | | | |
| Taeniopteryx ugola | | | | | | | | | | | | | | | | | | |
| Taeniopteryx metequi | | | | | | | | | | | | | | | | | | |
| Oemopteryx contorta | | | | | | | | | | | | | | | | | | |
| Strophopteryx appalachia | | | | | | | | | | | | | | | | | | |
| Taenionema atlanticum | | | | | | | | | | | | | | | | | | |
Table 13.
Maryland Species of Greatest Conservation Need (SGCN)-listed stoneflies. USGS Hydrologic Unit Code (HUC)-8 drainage basins where species are known to be present are noted in addition to the number of available Maryland records. Elevation data of unique collection localities within Maryland are provided per species.
| Family | Species | HUC-8 Present | Occurrence Records | Elevation Range (m ASL) |
|---|
| Chloroperlidae | Alloperla aracoma | 02070002 | 14 | 483–676 |
| | Alloperla biserrata | 02070003 | 17 | 167–395 |
| | Sweltsa palearata | 02070003 | 37 | 161–338 |
| | Sweltsa pocahontas | 02070002 | 15 | 515–742 |
| | Utaperla gaspesiana | 02070002 | 1 | 456 |
| Leuctridae | Megaleuctra flinti | 05020006, 02070002 | 22 | 463–814 |
Table 14.
Stonefly Species of Greatest Conservation Need (SGCNs) listed in USA states adjacent to Maryland with recorded presence within Maryland yet are not listed on the Maryland State Wildlife Action Plan (SWAP). USGS Hydrologic Unit Code (HUC)-8 basins with known Maryland presence are indicated. Number of Maryland records and elevation of collection localities are provided. State abbreviations are as follows: Delaware (DE), Pennsylvania (PA), Virginia (VA), and West Virginia (WV).
| Family | Species | MD HUC-8 Present | States with SGCN status | Occurrence Records | Elevation Range (m ASL) |
|---|
| Capniidae | Allocapnia frumi | 05020006 | WV | 4 | 756–769 |
| | Allocapnia harperi | 02070002 | PA | 20 | 418–828 |
| | Allocapnia illinoensis | 02070002 | VA | 4 | 170–768 |
| | Allocapnia simmonsi | 02070004 | PA and VA | 2 | 123 |
| Leuctridae | Leuctra variabilis | 02060004, 02070010, and 02070011 | PA | 6 | 36–76 |
| Nemouridae | Ostrocerca complexa | 02070002 | VA, WV | 13 | 466–687 |
| Perlidae | Attaneuria ruralis | 02070003, 02070004, 02070008, and 05020006 | VA | 7 | 30–118 |
| | Hansonoperla appalachia | 02070002 | PA, VA, and WV | 2 | 456 |
| | Perlinella drymo | 02070008 | PA | 1 | 30 |
| Taeniopterygidae | Bolotoperla rossi | 05020006 | VA | 2 | 663–700 |


