
Plant Diversity Is More Important than Climate Factors in Driving Insect Richness Pattern along a Latitudinal Gradient


Abstract
:1. Introduction
2. Materials and Method
2.1. Study Site and Data Collection
2.2. Environmental Predictor Variables
2.3. Analyses
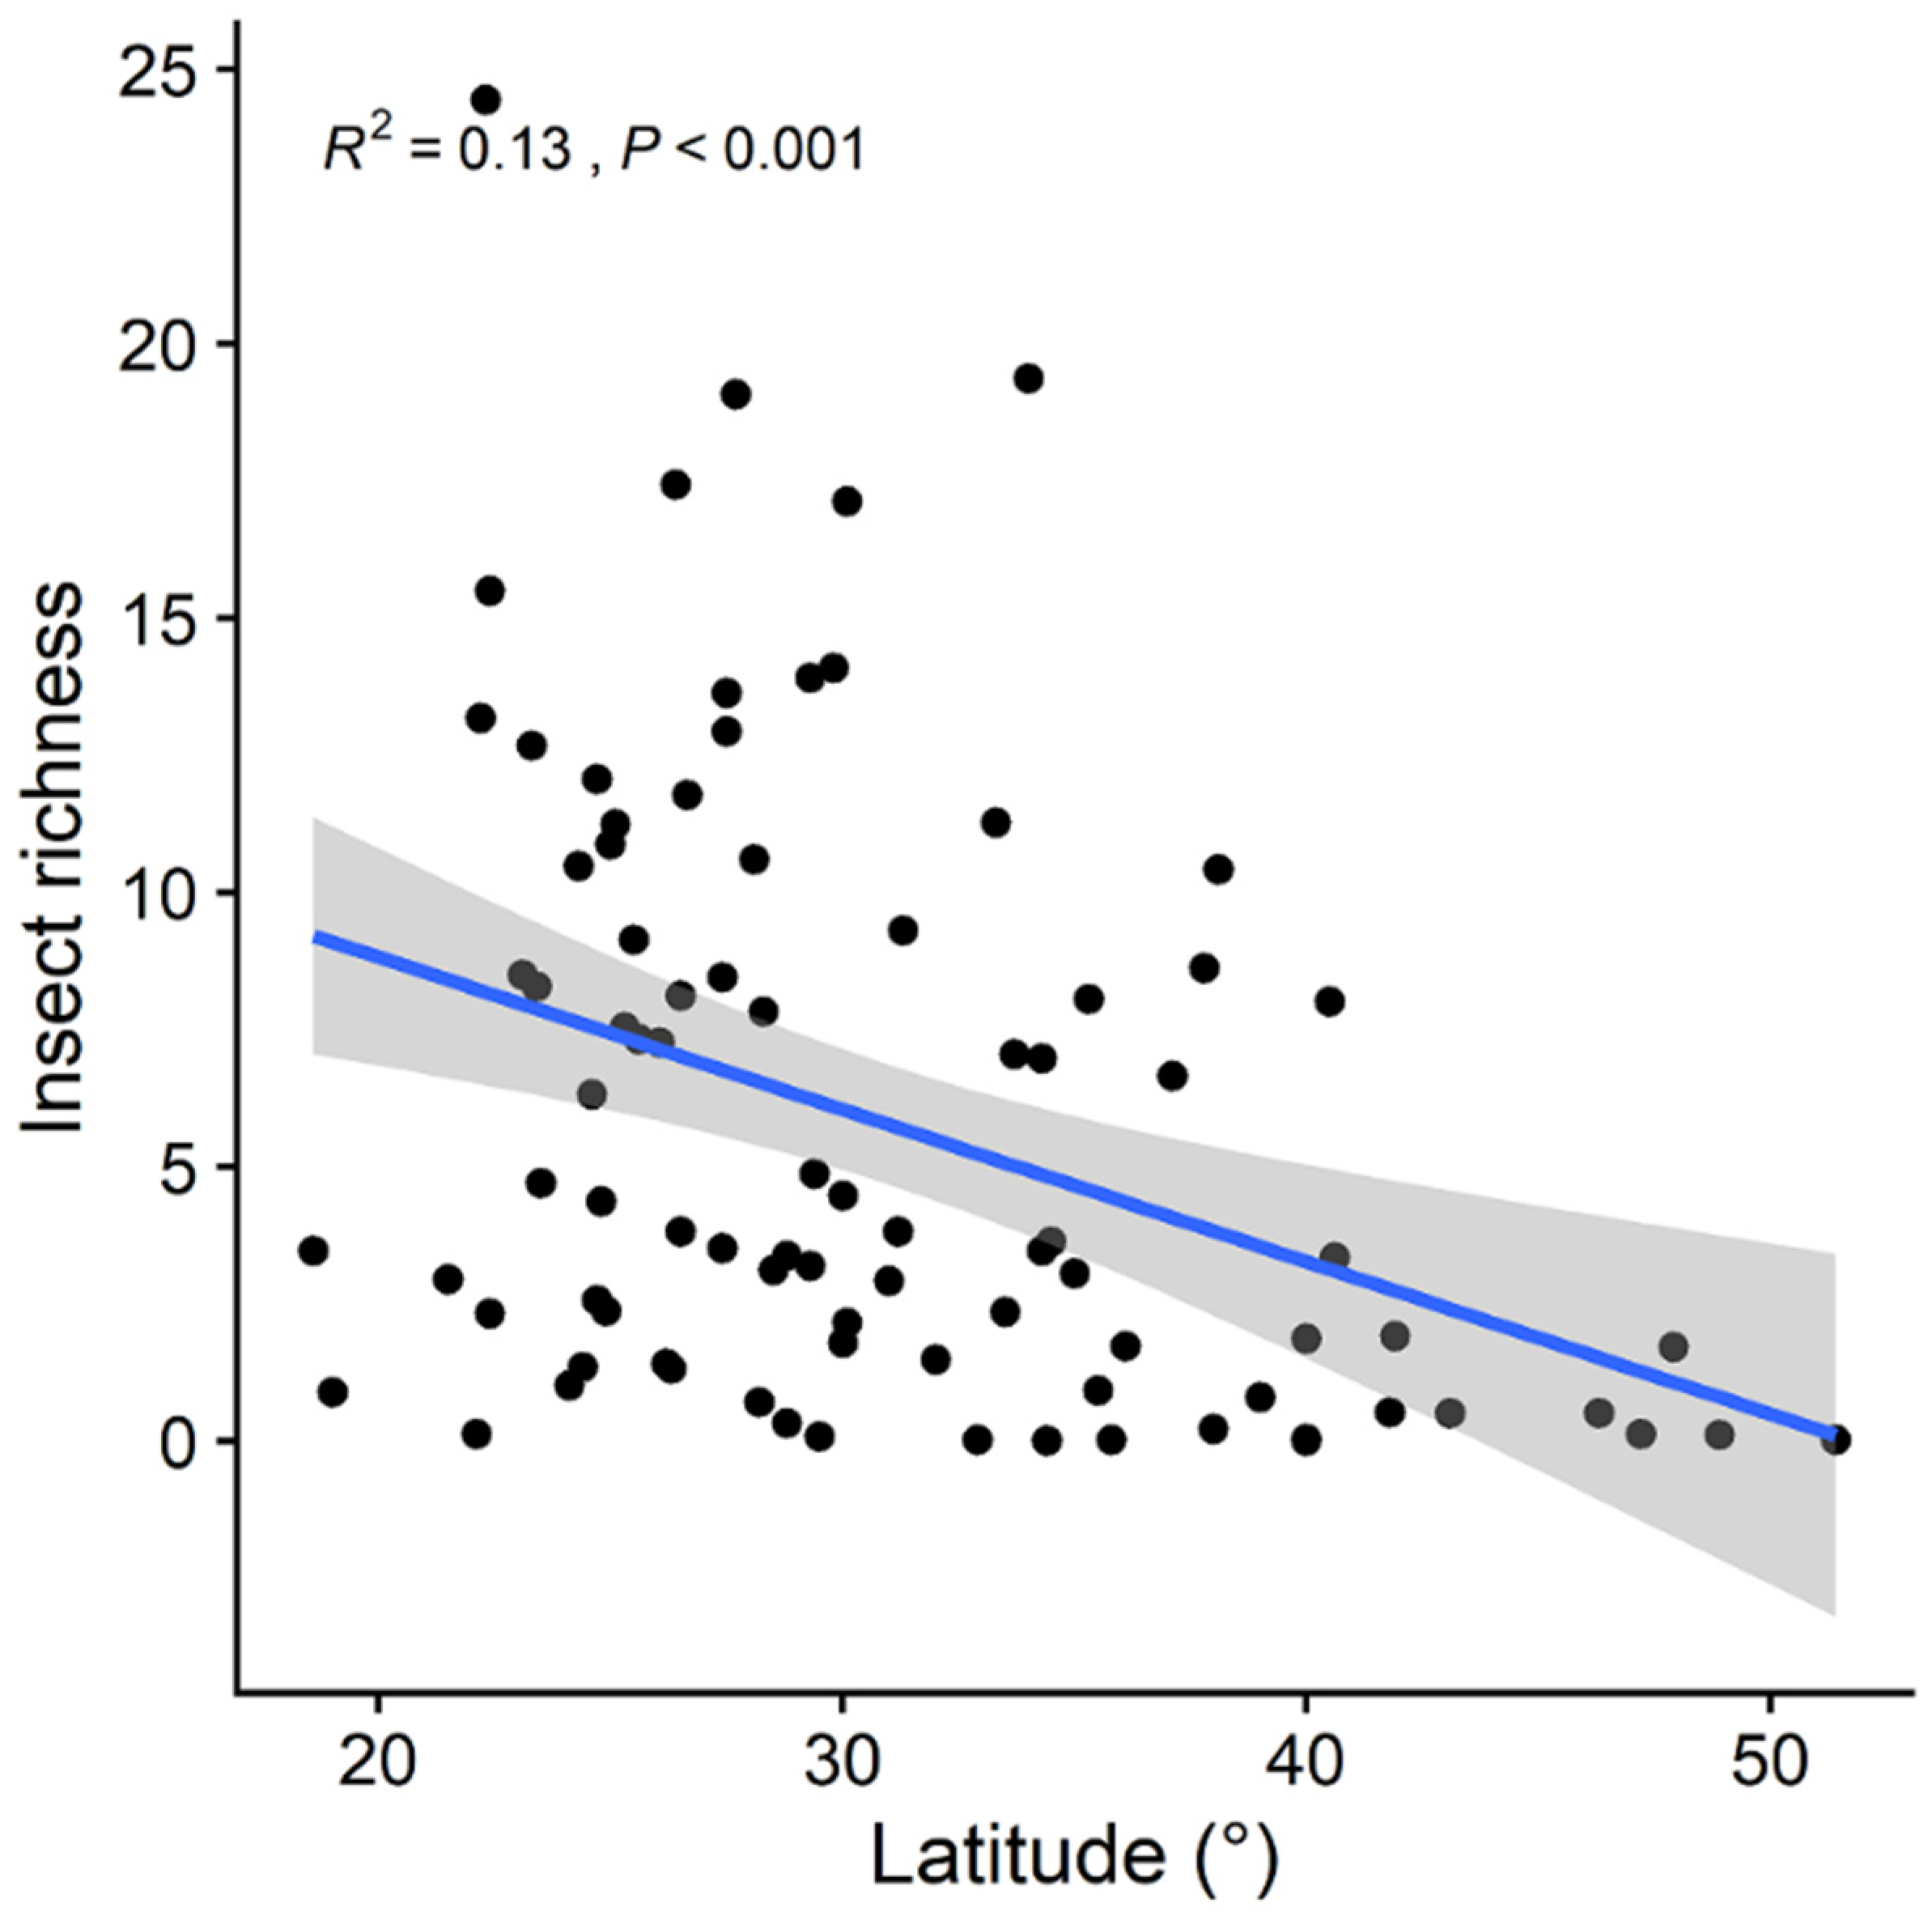
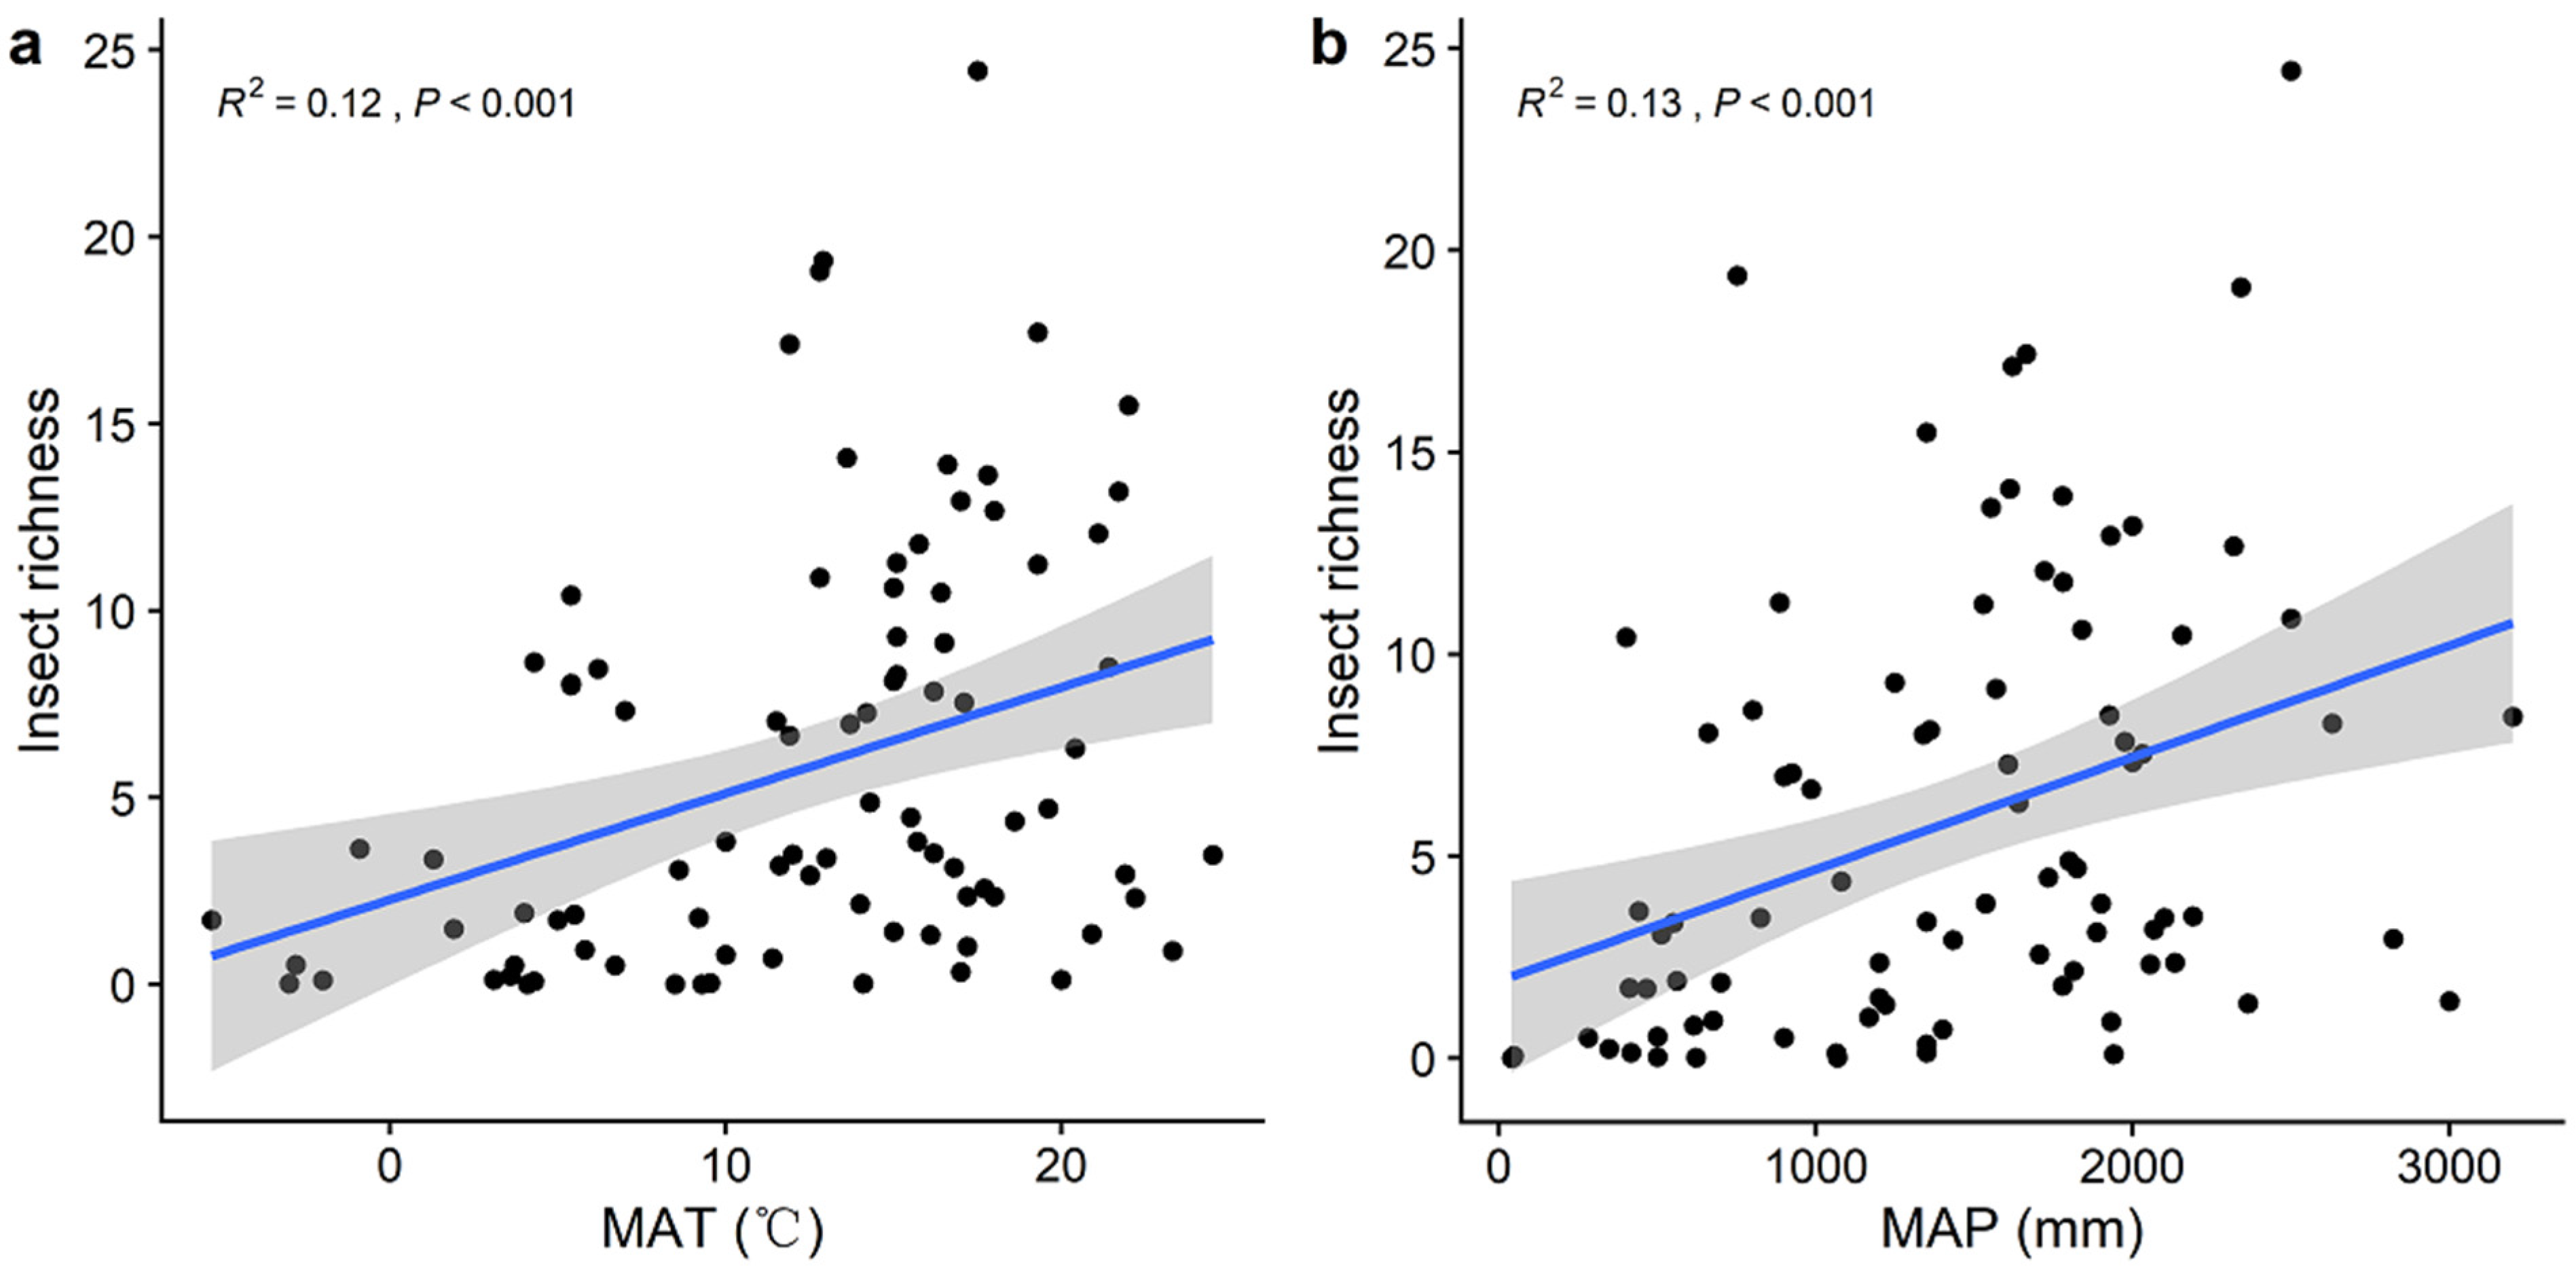
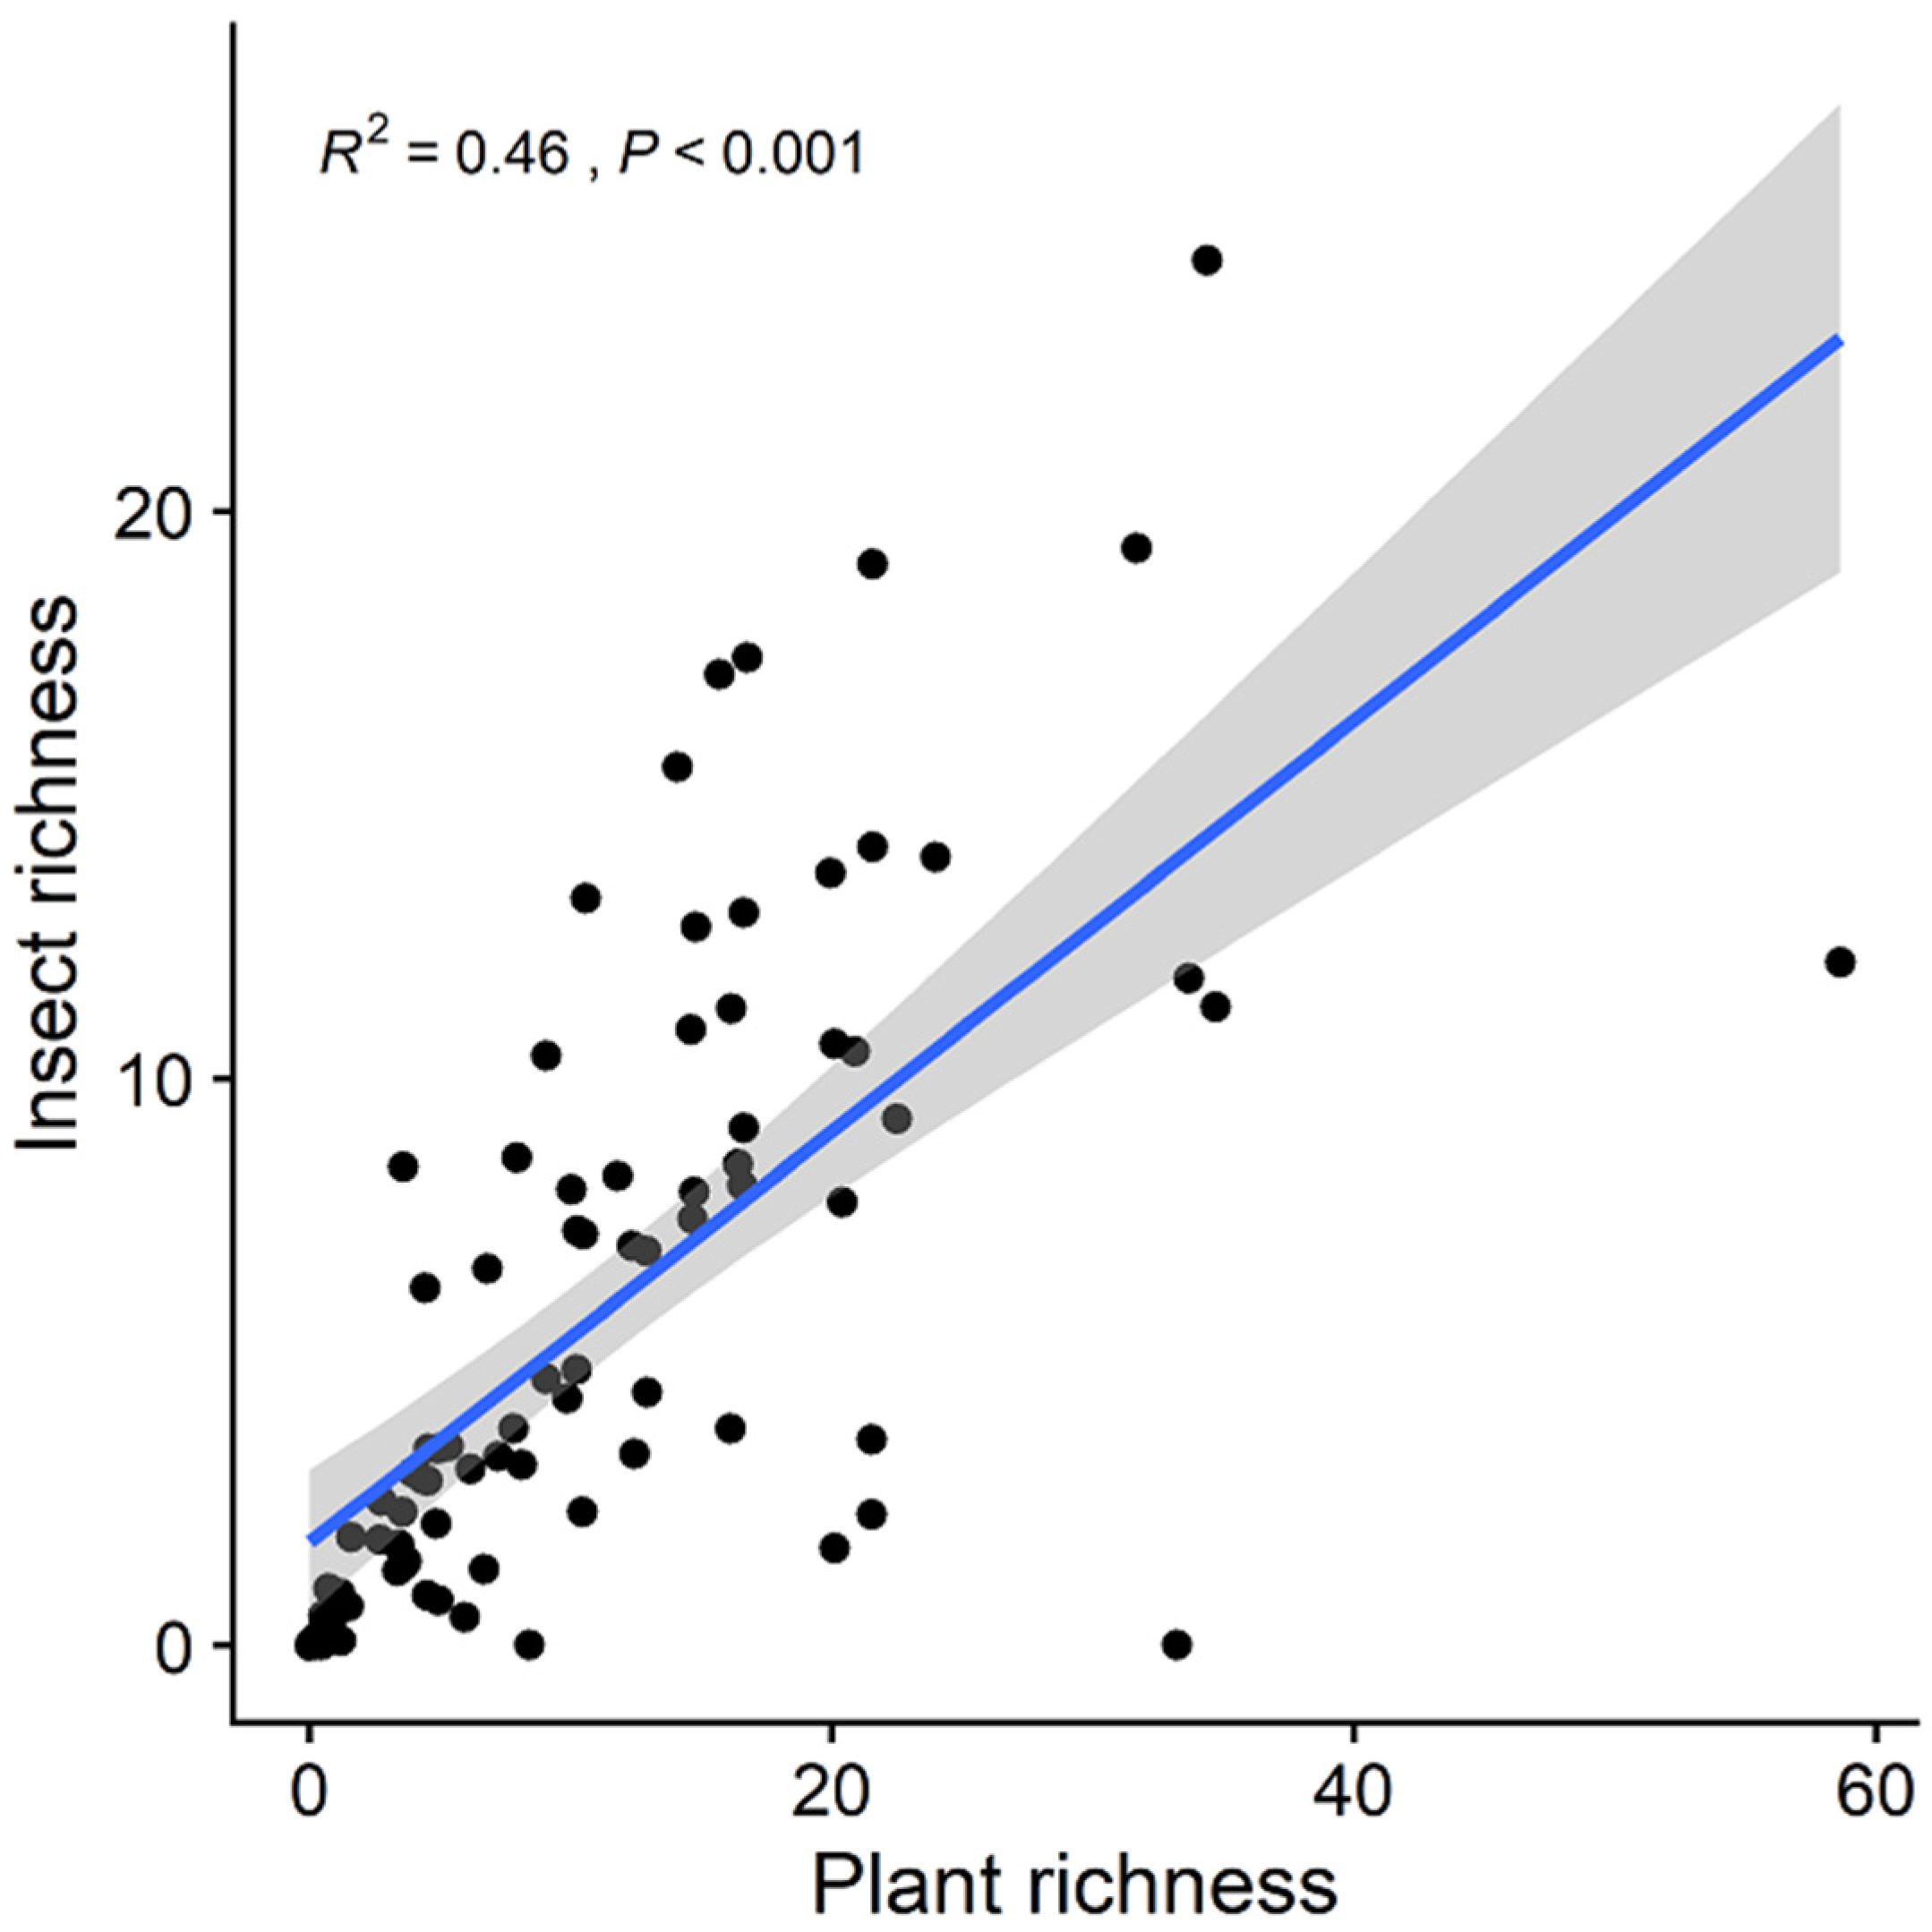
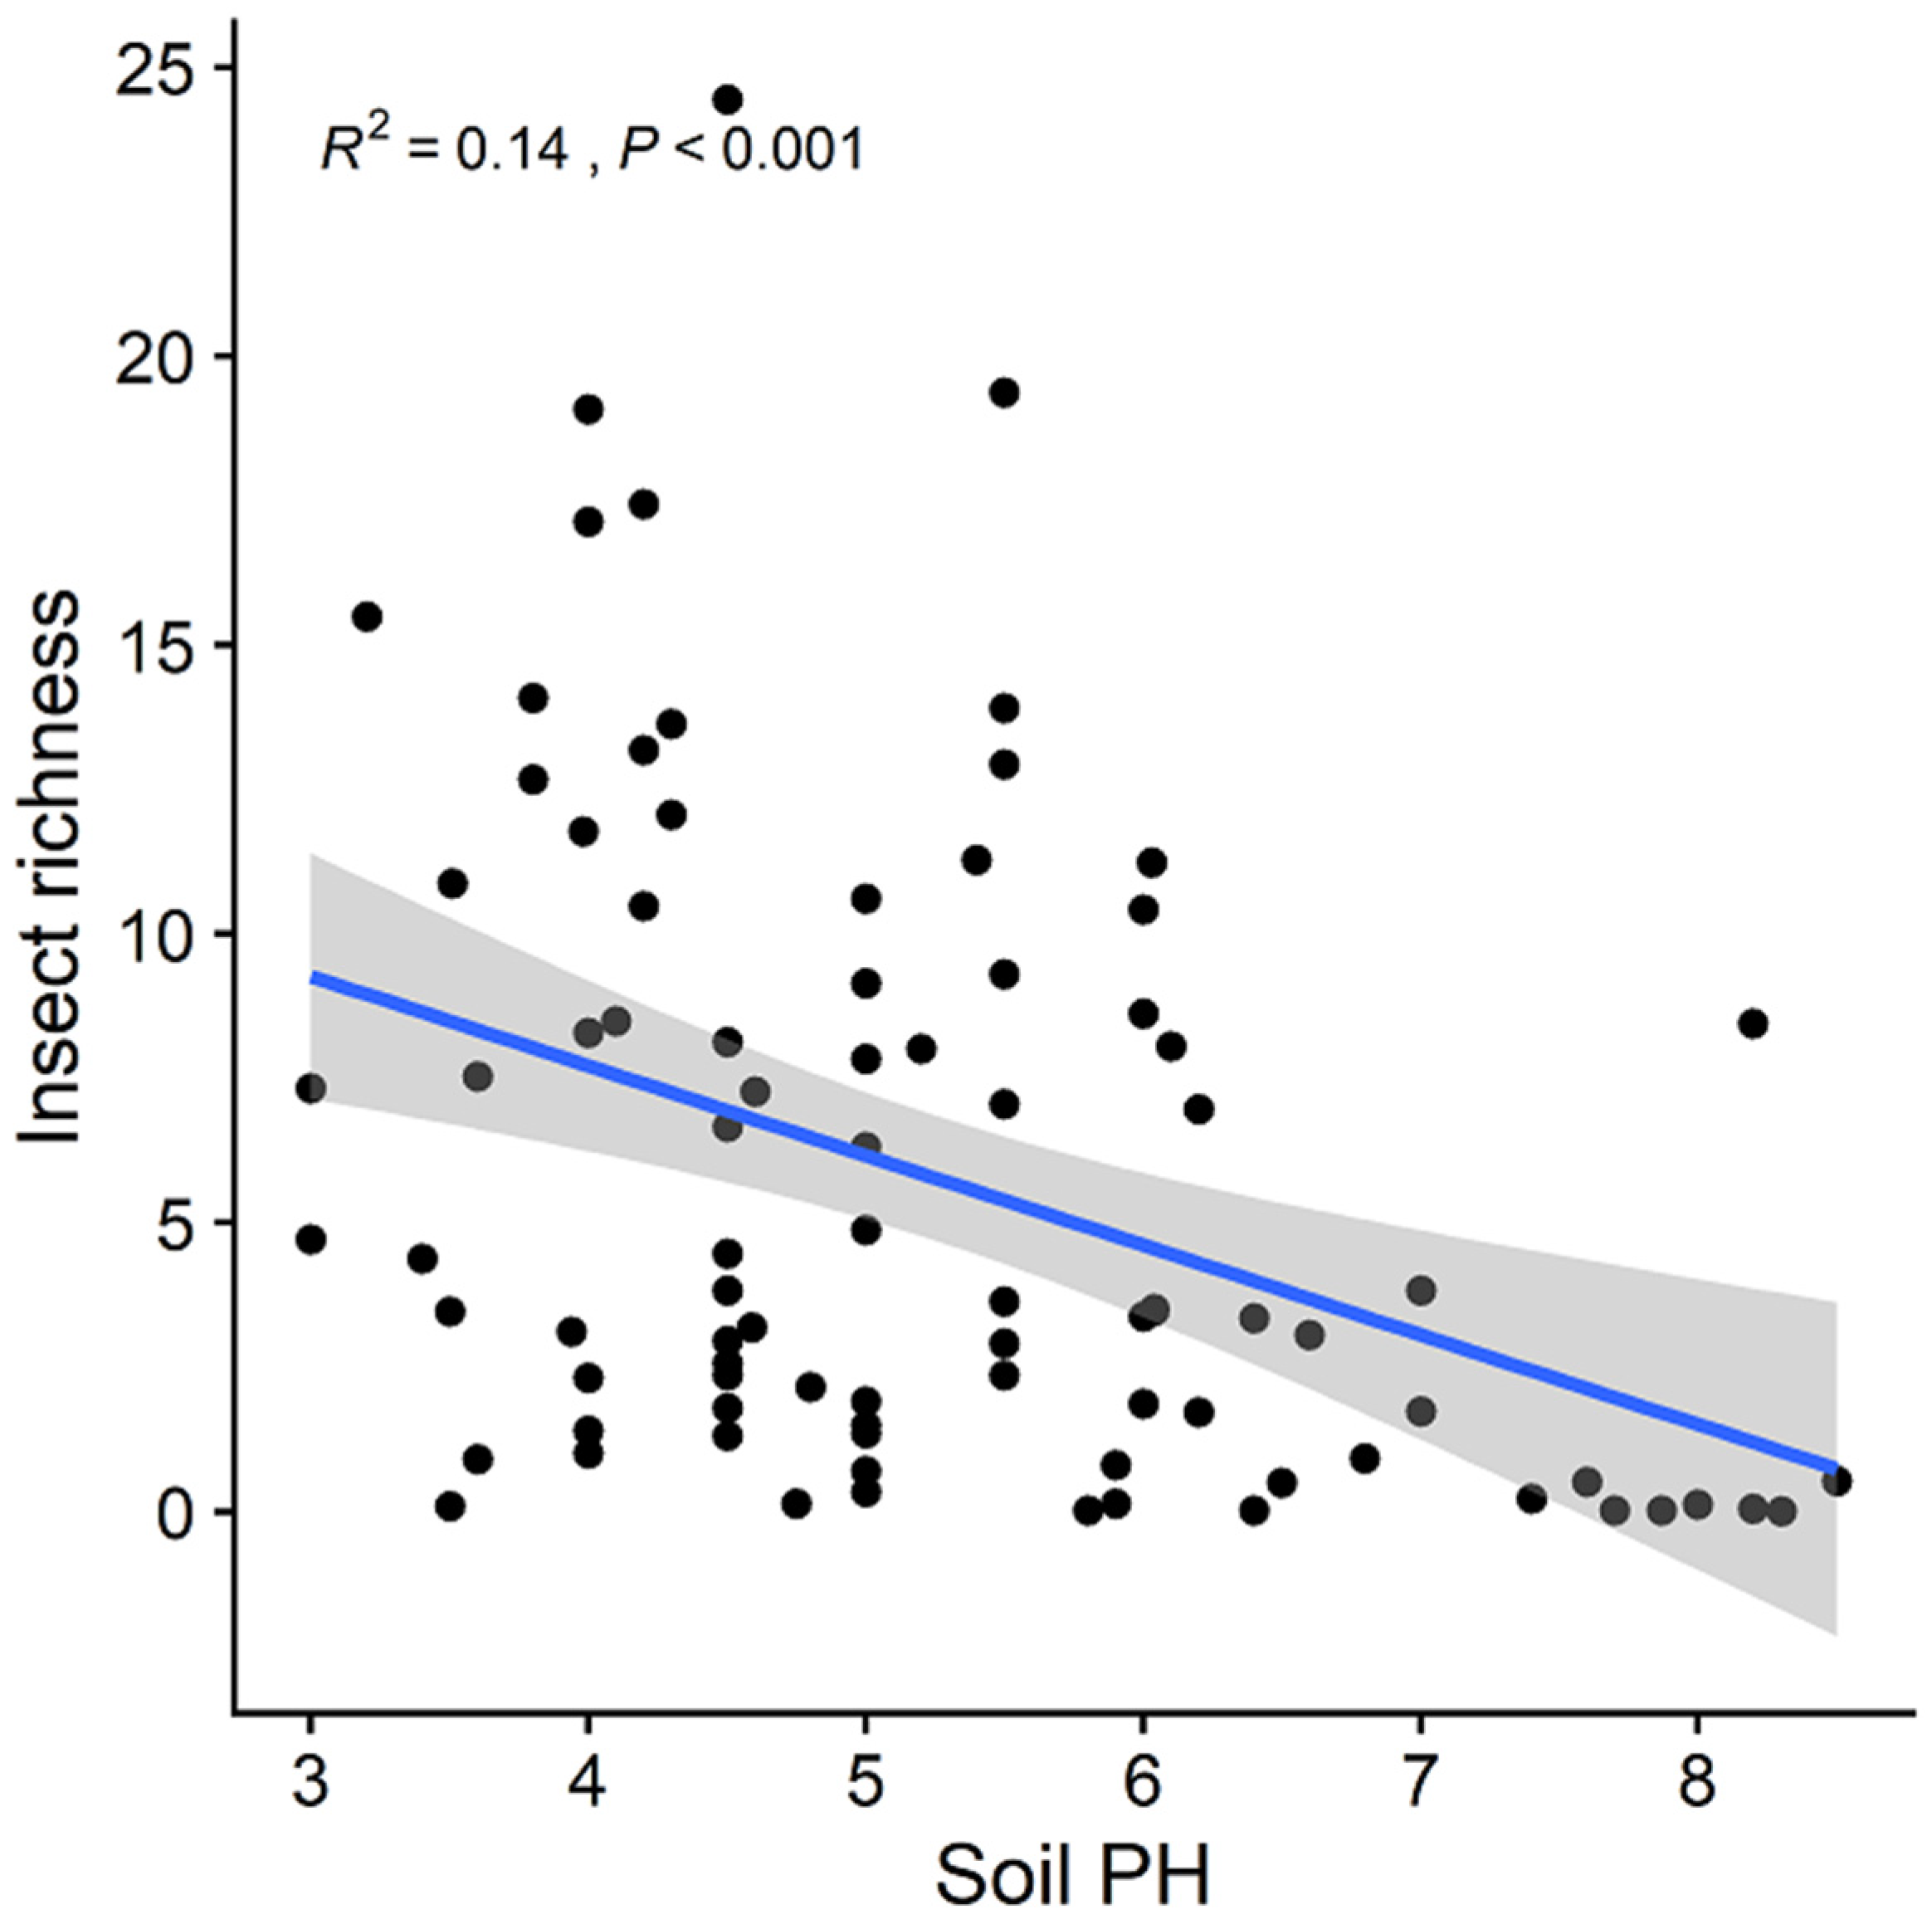
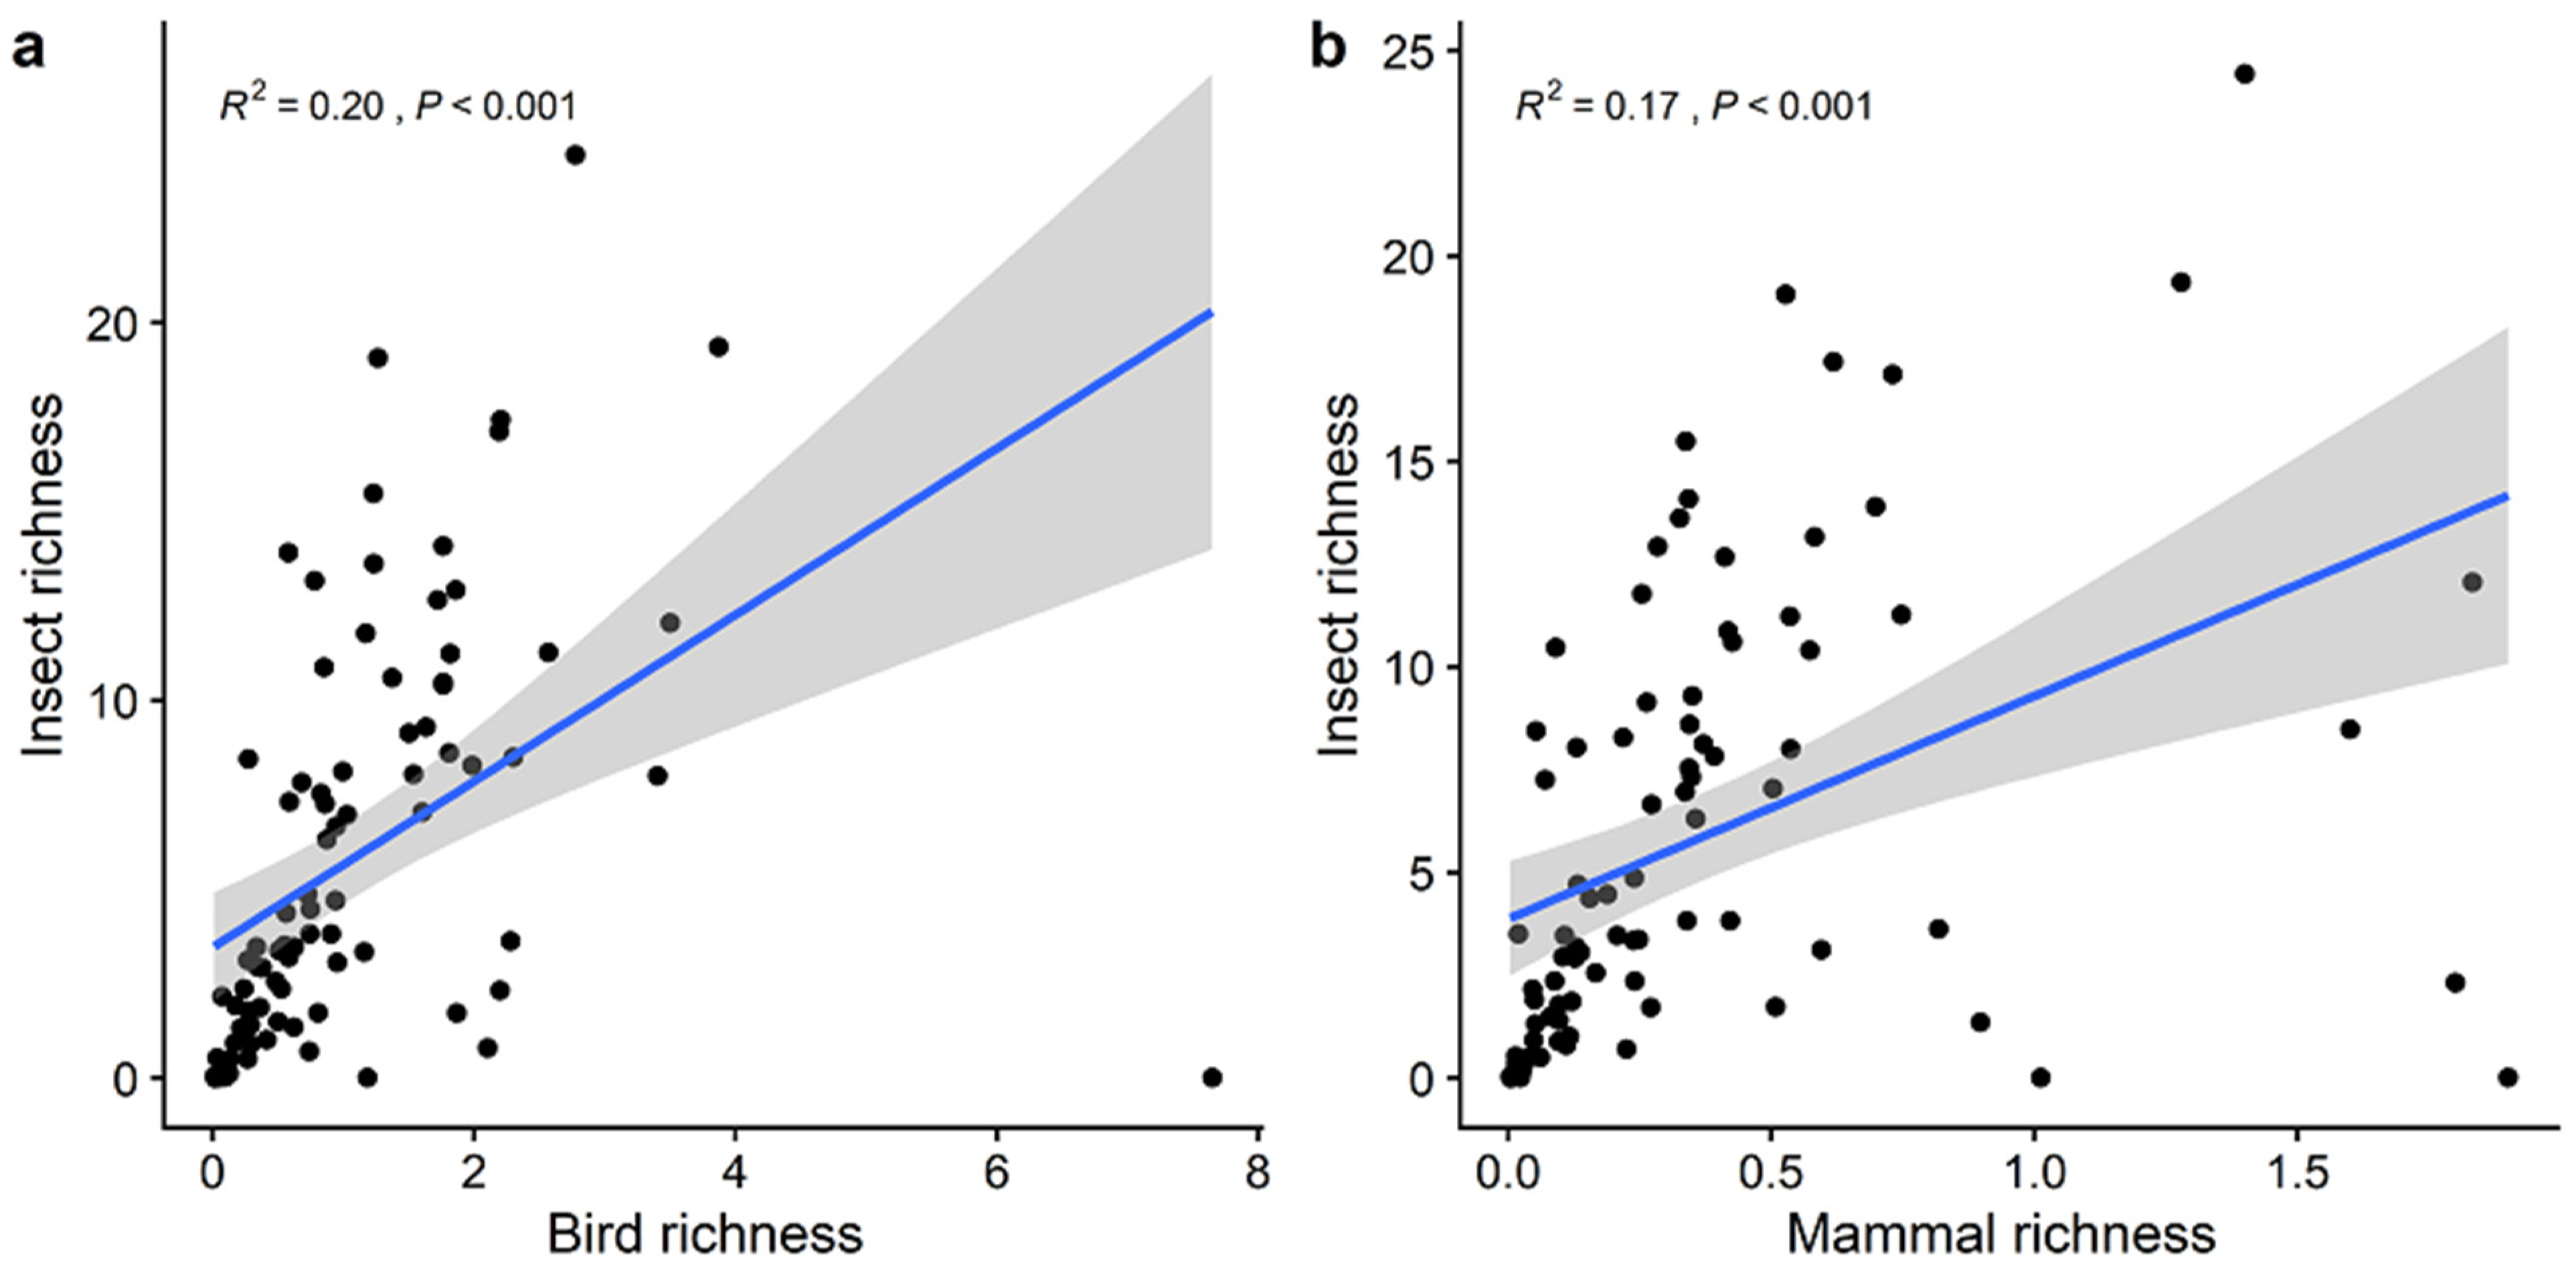
3. Results
4. Discussion
5. Conclusions
Supplementary Materials
Author Contributions
Funding
Institutional Review Board Statement
Informed Consent Statement
Data Availability Statement
Conflicts of Interest
Soil Data
References
- Ballard, M.; Goldstein, J.H.; Tallamy, D. Arthropod communities on native and nonnative early successional plants. Environ. Entomol. 2013, 42, 851–859. [Google Scholar] [CrossRef] [PubMed]
- Gao, J.; Zhang, X.; Luo, Z.; Lan, J.; Liu, Y. Elevational diversity gradients across seed plant taxonomic levels in the Lancang River Nature Reserve: Role of temperature, water and the mid-domain effect. J. For. Res. 2018, 29, 1121–1127. [Google Scholar] [CrossRef]
- Lomolino, M.V.; Riddle, B.R.; Whittaker, R.J.; Brown, J.H. BiogeograpHy; Sinauer Associates Inc.: Sunderland, MA, USA, 2010. [Google Scholar]
- Zellweger, F.; Roth, T.; Bugmann, H.; Bollmann, K. Beta diversity of plants, birds and butterflies is closely associated with climate and habitat structure. Glob. Ecol. Biogeogr. 2017, 26, 898–906. [Google Scholar] [CrossRef]
- Gao, J.; Liu, Y.H.; Marc, B. Habitat is more important than climate and animal richness at shaping latitudinal vari-ation in plant diversity in China. Biodivers. Conserv. 2018, 27, 3679–3691. [Google Scholar] [CrossRef]
- Chakraborty, A.; Shi, P.J.; Liu, Q.X.; Yang, Q.P.; Li, B. A commensal consumer-induced mediation effects on re-source-consumer interactions. Proc. Natl. Acad. Sci. India Sect. B Biol. Sci. 2013, 83, 385–404. [Google Scholar] [CrossRef]
- Misof, B.; Liu, S.; Meusemann, K.; Peters, R.S.; Donath, A.; Mayer, C.; Frandsen, P.B.; Ware, J.; Flouri, T.; Beutel, R.G.; et al. Phylogenomics resolves the timing and pattern of insect evolution. Science 2014, 346, 763–767. [Google Scholar] [CrossRef] [PubMed]
- Parmesan, C.; Yohe, G.A. Globally coherent fngerprint of climate change impacts across natural systems. Nature 2003, 421, 37–42. [Google Scholar] [CrossRef] [PubMed]
- Jump, A.S.; Huang, T.-J.; Chou, C.-H. Rapid altitudinal migration of mountain plants in Taiwan and its implications for high altitude biodiversity. Ecography 2012, 35, 204–210. [Google Scholar] [CrossRef]
- Wright, I.J.; Reich, P.B.; Westoby, M.; Ackerly, D.D.; Baruch, Z.; Bongers, F.; Cavender-Bares, J.; Chapin, T.; Cornelissen, J.H.C.; Diemer, M.; et al. The worldwide leaf economics spectrum. Nature 2004, 428, 821–827. [Google Scholar] [CrossRef] [PubMed]
- Heikkinen, R.K.; Luoto, M.; Kuussaari, M.; Pöyry, J. New insights into butterfly–environment relationships using partitioning methods. Proc. R. Soc. B Boil. Sci. 2005, 272, 2203–2210. [Google Scholar] [CrossRef] [PubMed] [Green Version]
- Fick, S.E.; Hijmans, R.J. WorldClim 2: New 1-km spatial resolution climate surfaces for global land areas. Int. J. Climatol. 2017, 37, 4302–4315. [Google Scholar] [CrossRef]
- Wiegand, T.; Gunatilleke, C.V.S.; Gunatilleke, I.A.U.N.; Huth, A. How individual species structure diversity in tropical forests. Proc. Natl. Acad. Sci. USA 2007, 104, 19029–19033. [Google Scholar] [CrossRef] [PubMed] [Green Version]
- Uddin, M.D.N.; Robinson, R.W. Responses of plant species diversity and soil physical-chemical-microbial properties to Phragmites australis invasion along a density gradient. Sci. Rep. 2017, 7, 11007. [Google Scholar] [CrossRef] [PubMed]
- Nyman, T.; Vikberg, V.; Smith, D.R.; Boevé, J.-L. How common is ecological speciation in plant-feeding insects? A ‘Higher’ Nematinae perspective. BMC Evol. Biol. 2010, 10, 266. [Google Scholar] [CrossRef] [Green Version]
- Golawski, A.; Golawska, S. Are the birds dangerous for insect pollinators? The relationship between hymenopterans and the red-backed shrike. J. Insect Conserv. 2013, 17, 1155–1160. [Google Scholar] [CrossRef] [Green Version]
- Eger, J.E., Jr.; Witz, J.A.; Hartstack, A.W., Jr.; Sterling, W.L. Survival of pupae of heliothis virescens and heliothis zea (lepidoptera: Noctuidae) at low temperatures. Can. Entomol. 1982, 114, 289–301. [Google Scholar] [CrossRef]
- Wiens, J.J.; Graham, C.H. Niche Conservatism: Integrating Evolution, Ecology, and Conservation Biology. Annu. Rev. Ecol. Evol. Syst. 2005, 36, 519–539. [Google Scholar] [CrossRef] [Green Version]
- Zhao, Z.-H.; Shi, P.-J.; Hui, C.; Ouyang, F.; Ge, F.; Li, B.-L. Solving the pitfalls of pitfall trapping: A two-circle method for density estimation of ground-dwelling arthropods. Methods Ecol. Evol. 2013, 4, 865–871. [Google Scholar] [CrossRef]
- Hawkins, B.A.; Field, R.; Cornell, H.V.; Currie, D.J.; Guégan, J.-F.; Kaufman, D.M.; Kerr, J.T.; Mittelbach, G.G.; Oberdorff, T.; O’Brien, E.M.; et al. Energy, Water, and Broad-Scale Geographic Patterns of Species Richness. Ecology 2003, 84, 3105–3117. [Google Scholar] [CrossRef] [Green Version]

| Variables | Predictors Included in the Best Model (Standardized Coefficient) | Adjusted R2 | p-Value | AICc |
|---|---|---|---|---|
| Climate | MAT, MAP | 0.127 | <0.05 | 23.5 |
| Biodiversity | Plant richness, Bird richness, Mammal richness | 0.632 | <0.01 | 19.6 |
| Soil | Soil pH | 0.141 | <0.01 | 14.8 |
| Insect Richness | |||
|---|---|---|---|
| Predictors | Estimates | CI | p |
| (Intercept) | 3.27 | (−2.94, 9.48) | 0.023 |
| MAT | −0.01 | (−0.17, 0.16) | 0.063 |
| MAP | 0.02 | (−0.02, 0.03) | 0.101 |
| Bird richness | 1.08 | (0.12, 2.04) | 0.028 |
| Mammal richness | −3.21 | (−6.31, −0.11) | 0.043 |
| Plant richness | 0.36 | (0.23, 0.48) | <0.001 |
| Soil pH | −0.59 | (−1.42, 0.24) | 0.159 |
Publisher’s Note: MDPI stays neutral with regard to jurisdictional claims in published maps and institutional affiliations. |
© 2022 by the authors. Licensee MDPI, Basel, Switzerland. This article is an open access article distributed under the terms and conditions of the Creative Commons Attribution (CC BY) license (https://creativecommons.org/licenses/by/4.0/).
Share and Cite
Peng, Y.; Gao, J.; Zhang, X. Plant Diversity Is More Important than Climate Factors in Driving Insect Richness Pattern along a Latitudinal Gradient. Ecologies 2022, 3, 30-37. https://doi.org/10.3390/ecologies3010004
Peng Y, Gao J, Zhang X. Plant Diversity Is More Important than Climate Factors in Driving Insect Richness Pattern along a Latitudinal Gradient. Ecologies. 2022; 3(1):30-37. https://doi.org/10.3390/ecologies3010004
Chicago/Turabian StylePeng, Yanling, Jie Gao, and Xing Zhang. 2022. "Plant Diversity Is More Important than Climate Factors in Driving Insect Richness Pattern along a Latitudinal Gradient" Ecologies 3, no. 1: 30-37. https://doi.org/10.3390/ecologies3010004
APA StylePeng, Y., Gao, J., & Zhang, X. (2022). Plant Diversity Is More Important than Climate Factors in Driving Insect Richness Pattern along a Latitudinal Gradient. Ecologies, 3(1), 30-37. https://doi.org/10.3390/ecologies3010004