Review

Ecosystem Services Research Trends: A Bibliometric Analysis from 2000–2020

by
Ruchira Gangahagedara
1,
Shyamantha Subasinghe
2,*,
Madhushan Lankathilake
3,
Wasantha Athukorala
4 and
Isurun Gamage
5
1
Postgraduate Institute of Humanities and Social Sciences, University of Peradeniya, Peradeniya 20400, Sri Lanka
2
Department of Geography, University of Peradeniya, Peradeniya 20400, Sri Lanka
3
Library, University of Colombo, Colombo 00700, Sri Lanka
4
Department of Economics and Statistics, University of Peradeniya, Peradeniya 20400, Sri Lanka
5
Graduate School of Humanities and Social Sciences, University of Tsukuba, Tennodai 111, Tsukuba 8571, Japan
*
Author to whom correspondence should be addressed.
Ecologies 2021, 2(4), 366-379; https://doi.org/10.3390/ecologies2040021
Submission received: 19 October 2021 / Revised: 24 November 2021 / Accepted: 1 December 2021 / Published: 4 December 2021

Abstract

:
The study of ecosystem services (ES) is becoming increasingly popular, as it plays an important role in human wellbeing, economic growth, and livelihoods. The primary goal of this research is to investigate the global trend in ES research using a rigorous systematic review of highly cited articles. The articles for this study were extracted from Science Citation Index Expanded (SCI-E), Emerging Sources Citation Index (ESCI), and Social Sciences Citation Index (SSCI) databases of Web of Science Core Collection (WoSCC) covering the period from 2000 to 2020. This study was limited to SCI-E, ESCI, and SSCI databases of the Web of Science. The term “ecosystem service/s” has been used as a research term to filter the study sample and eliminate other databases from the analysis. A citation level equal to or greater than 200 was used to further filtration of articles. This query could restrict to 128 articles that are highly cited in the selected period. Bibliometric analysis results show that, according to the author’s keywords, the “ecosystem service/s” keyword is highly connected to the “biodiversity”, “valuation”, “marine spatial planning”, and “conservation planning”. The U.S.A., Canada, China, France, and Australia are the leading countries in the cumulative number of highly cited articles and networks of co-authors. The U.S.A. is a strong contributor to ES research with China, Canada, and France. The most productive universities linked to the United States were the University of Minnesota, the University of California-Santa Barbara (UC Santa Barbara), and the Chinese Academy of Science. The most significant and compelling author is Halpern S Benjamin, who represents UC Santa Barbara. He has earned international recognition for a model he developed to analyze global data sets of anthropogenic drivers of ecological change in marine environments. The most accessed and studied fields in the ES are terrestrial, urban, and marine environments.

1. Introduction

The term ‘ecosystem service (ES)’ initially appeared in the 1980s [1]. Later, this concept gained international attention through the global ecosystem initiative Millennium Ecosystem Assessment [2]. In 2010, ES was included in the Aichi Targets framework of the Convention on Biological Diversity [3]. The Intergovernmental Science–Policy Platform on Biodiversity and Ecosystem Services (IPBES) eventually acknowledged this concept, which is now incorporated in the Sustainable Development Goals (SDGs) [4,5,6]. ES has become a key indicator of human wellbeing, as they support global economic prosperity and wellbeing [7]. ES are mainly classified as provisioning, regulating, supporting, and cultural services, which play a vital role in maintaining human wellbeing in many ways [2]. However, many anthropogenic factors greatly influence the hinder of the service rendered by the ES. According to Costanza et al., the worldwide value of ES fell from USD 4.3 trillion to −20.2 trillion yearly due to changes in land use from 1997 to 2011 [8]; this analysis also cautioned that around 60% of the ES utilized globally are unsustainable [2]. This developing trend of ES degradation may significantly affect the global eco-security [2,9]. In such a context, numerous studies have been conducted to address the functioning, assessment, and management of ES at regional and global levels [10,11]. Furthermore, it has the potential to uncover a large number of studies related to the consequences of climate change on ES [12,13].
Bibliometric analysis is an internationally recognized method for systematically and qualitatively evaluating research trends and networks of researchers [14]. Furthermore, this study provides a comprehensive direction and useful assistance to aspiring researchers who want to begin formative research in a particular topic [15]. The analysis paves the path for future studies, or else other reviews can combine with bibliometric research to develop a systematic and conceptual–theoretical review of the studying discipline [16,17]. The primary output of the bibliometric analysis is to summarize the research trend and scholarly network based on the keyword frequencies, trace the subject categories, and research institutions, active authors, productive countries, publications, influential journals, etc. [16,18]. We conducted the bibliometric analysis of this study based on highly cited articles related to the ES.
Identifying the qualities of a highly cited article on a certain topic is one of the standard components of previous bibliometric analysis [19,20]. With the presence of the worldwide arena, highly cited papers are regarded the most significant and collaborative efforts. The WoSCC database showcases more than 20,000 academic journals from 113 countries throughout 254 scientific areas, according to the 2021 journal citation report (JCR). The JCR report reveals that more than 14,000 journals published at the WoSCC database have at least one gold open access publication, including 4600 journal articles published as open access category. Therefore, we believe that selecting the WoSCC database is more suitable for this analysis. When discussing the global trends of ES, there is a considerable gap in the bibliometric analysis focused on scholarly networks. Consequently, the main objective of this study is to examine the global trends and ES research through a bibliometric analysis of highly cited articles from 2000 to 2020 found in the SCI-E, ESCI, and SSCI databases (WoSCC).

2. Materials and Methods

2.1. Data Collection

We used the Web of Science Core Collection (WoSCC) database to aggregate publications from 2000 to 2020. Data were retrieved on 5 October 2021 at 1.30 p.m. of Coordinated Universal (UTC) time (acceded from University of Tsukuba, Japan). We searched the WoSCC for all articles pertaining to ES research (SCI-E, SSCI, and ESCI). Articles found using the term “ecosystem service*” (asterisk symbol is used in WoSCC to broaden the search term covering ecosystem service and ecosystem services). The “Title” field and “articles” were filtered in the “document type” field to limit the search for articles only. The articles were published in English during the specified period were considered. Total citations equal to or greater than 200 were chosen to analyze the most cited articles in the study [9,20,21]. Subsequently, author(s) name and affiliation, subject categories, name of the journal (s), title(s), and published year were included in extracted articles for the bibliometric analysis.

2.2. Bibliometric Analysis Methods

VOS viewer software was used to assess the data that had been retrieved (www.vosviewer.com) (accessed on 5 October 2021). The researchers used a quantitative analysis approach, knowledge mapping, and a network analysis tool. The study was based on the author’s network strength, as well as the countries, keywords, and institutions. Through network analysis, the research clusters, scope, and structure of the discipline were discovered [22]. Modern research has shown that fractional counting is preferable over complete counting [23]. The fractional counting method provides standardized field results [23]. We used fractional counting as a part of our bibliometric analysis, which gave the following results. The co-authorship network was analyzed to reveal the highly cited articles of top countries, top institutions, and most productive authors. Meanwhile, we analyzed the co-occurrence network to identify the most frequent author’s keywords.

3. Results and Discussion

After filtering, we found 4949 articles. Accordingly, we were able to retrieve 128 highly cited articles. The selected number of articles represents 2.6% of the total articles. Figure 1 shows the distribution of the number of citations of 4949 articles published over the last two decades. From 2000 to 2005, the number of publications and citations related to ES remained minimal, counted as less than 5000, and the publication counted as less than 100. Between 2006 and 2015, the number of total citations and publications related to ES increased gradually. At the end of 2015, the number of total citations counted as more than 15,000, and the publications counted as 400. From 2015 to 2020, the total number of citations counted as more than 30,000, and the publication counted as more than 700. The year 2005 marked the milestone of the global attention to the ES, notably publishing the Millennium Ecosystem Assessment (MEA) report in 2005 and The Economics of Ecosystems and Biodiversity (TEEB) in 2010; these might be the reason for this historical paradigm shift [24]. This emerging trend popularized ES-related studies globally [25,26].
Table 1 shows bibliometric details of the top 10 out of 4949 articles published in ES research during the last two decades. The publication of Worm et al. [27] at Science journal leads the list with 2564 citations. Rey Benayas et al. [28], whose publication bears 887 citations at the same journal, placed seventh on the list. Ecological Economics journal is also on the list with two publications; that of Fisher et al. [29] placed fourth and carries 1497 citations, and that of Boyd and Banzhaf [30] placed seventh and carries 1049 citations. Ecological Economics, Science, and Proceedings of the National Academy of Science of the United States of America (PNAS), displayed the highest impact factor in the list; according to Zhang et al. [31] ES-related publications immensely help gain the highest impact factor of these journals. There are eight journals listed in the top 10 rankings of highly cited articles extracted. When analyzed, these top-ranking journals, along with 128 highly cited articles (selected according to the ≥200 thresholds), Ecological Economics journal accounts for 22 highly cited articles (i.e., 17.2% of the total), carrying the impact factor of 5.389 in 2020.
When analyzing the objectives of the top 10 articles in Table 1, Worm et al. [27] placed first of the list focused on marine ecosystem service. It examined how biodiversity loss affects the maritime ecosystem service across the temporal and spatial scale. Costanza et al. [32] focused on the environmental valuation on a global scale. At the same time, de Groot et al. [33] focused on the challenges involved in applying ecosystem service assessment and valuation. The study’s primary objective of Fisher et al. [29] is to provide a consistent definition for ecosystem service. Following such, Carpenter et al. [34] discussed the potential challenges faced in implementing Millennium Ecosystem Assessment.
Boyd and Banzhaf [30] examined the necessity of applying standardizing units for the accounting and procurement of ecosystem services as a nonmarket commodity. Further, this study focused on reasons for such “standardizing units” showing slow development. Rey Benayas et al. [28] studies focused on providing insights for ecological restoration through meta-analysis. The main objective of Mace et al.’s [35] study was to find out the relationship between ecosystem service and biodiversity. Isbell et al. [36] study focused on maintaining the ecosystem service to protect the plant diversity. Finally, the Kremen [37] study concentrated on the research plan, which includes Adaptive management, community structure, conservation planning, diversity–function, ecological economics, and ecosystem function to develop environmental policy and natural resource management plans.
When examining the literature of the top 10 articles listed in Table 1, more attention is gained by valuing ecosystem service globally. Next, the classifying and understanding or defining the ecosystem service earned more focused among them the studying of the marine ecosystem service across the temporal and spatial scale gain significant attention. The topics such as “restoration” and the “effects on biodiversity due to environmental degradation” were comparatively less focused at the top 10 ES publications. However, the impacts of climate change on ES, especially on the marine ecosystems and combined studies of valuing and restoring the marine ecosystem on a global scale are missing from the literature discussed in the top 10 articles.
Figure 2 shows the most productive journals which contain the highest number of total citations. Ecological Economics (established in 1989) is the most effective journal on the list. This journal focuses on transdisciplinary research within the purview of ecology and economics. Costanza et al. [32] are dominant in this journal. In contrast, from 2002 to 2014, this team contributes most of the highly cited articles to the journal, indicating the ES’s developing importance in this journal.
The next leading journal is PNAS, accounting for 14 articles (i.e., 10.9% of the total) and bearing an impact factor of 11.2 in 2020. Science and Global Environmental Change-Human and Policy Dimensions journals contributed four articles (i.e., 4% of the total each), however those journals bear 47.7 and 10.47 of impact factor, respectively. Ecosystem Services journal, established in 2012, dedicated to promoting publications related to the ES, accounts for six articles, including the article ‘Mapping ecosystem services for policy support and decision making in the European Union’ which bears 511 citations but is not listed in the top 10 list. According to McDonough K. et al. [26] this journal further expands its scope in ES as the journal is relatively new. Ecological Economics, Science, and PNAS journals are transdisciplinary journals that publish various research articles covering different disciplines. Therefore, unarguably justifies the reason for these journals to be ranked in the top ten list. On the other hand, these journals can absorb multidisciplinary research, including ES and conceptual development. Inevitably this trend proves that, more or less, ES in its nature is a multidisciplinary concept and is rapidly emerging in the transdisciplinary platform.
Commonly used author keywords or the top author keywords indicated scientists’ and researchers’ research priorities and directions in any given discipline, which can be generalized to the ES. According to Figure 3, 156 keywords are distributed among 22 clusters, where the most significant cluster shown in the middle in ash color consists of 22 keywords represents the period of 2000–2020. ES is the keyword has the highest number of occurrence (25 times) followed by biodiversity (6 times) and four other keywords (cultural ecosystem services, ecosystem service, marine spatial planning, and multifunctionality) with the occurrence of three times. Fourteen keywords have an occurrence of twice, whereas the other keywords have a unique occurrence. ES had the most potent link strength among all author keywords and was highly connected to biodiversity. The strength of the network displayed in Figure 3 shows the relationship between the clusters following such ES and biodiversity in Figure 3 indicates a close relationship between these two concepts. Additionally, many researchers regarding this link paid high interest to this linkage [38,39,40,41].
Climate change impact also shows a direct link to the ES. Compared to other links, it displayed a relatively more minor link strength, where a considerable gap is shown; therefore, it needs to expand the scope of ES research involving climate change impacts. In this analysis, keywords such as “landscape” did not appear in the author keywords network (Figure 3). The term “landscape” is associated with natural or cultural landscape in the ES research fraternity. Again, a considerable gap developed between ES research involving “landscape” is associated with natural and cultural domains. However, the keywords such as “land use”, “agriculture”, and “urban ecology”, also related to natural landscapes, agriculture, and agricultural biodiversity, may have a link to the ES of urban ecology which is missing, thus displayed a gap in research interest.
On the other hand, only a few keywords are presented and associated with cultural landscapes in the network. Emerging concepts such as “trade-off” and “synergy” are less focused on ecosystem research. Many empirical studies emphasized the importance of these concepts to be incorporated into ecosystem research [42,43,44,45]. The frequent appearance of the keyword “Sustainability” may shed a light that these emerging concepts are widely discussed in future studies.
The U.S.A., Australia, England, Canada, and France were among the top-ranked countries related to highly cited articles published in the ES research field from 2000–2020 (Figure 4). Only one Asian country (China) and one African country (South Africa) are visible representing the Asian and African continent. The U.S.A. and England bear a total link strength of 10, which means these countries may have a strong link, and connects with the other countries that dominate ecosystem research. China also plays a leading role in the Asian region and strongly associates with the U.S.A. Further, the U.S.A., Canada, England, and Australia connect with the strong linkage of the ecosystem research field. The U.S.A. holds 21 highly cited articles and accounts for 4147 total citations; this indicates the U.S.A. is leading in ES research.
The co-authorship network presented in Figure 4 reflects the state of collaboration between the most productive countries and highly connected the U.S.A. to Canada, England, China, France, and Australia. It reflects a substantial portion of the U.S.A. network that is involved with these five countries. The results forecast the identification of three clusters, as follows: The countries surrounding the U.S.A. (green cluster); countries surrounding England (red cluster); and countries surrounding Australia (blue cluster). Notably, China is included in the U.S.A. cluster.
According to Figure 5, four organizations have a total link strength of 3; the Council of Scientific and Industrial Research (CSIR) in India, Stanford University, UC Santa Barbara, and the University of Minnesota. When considering the citations of highly cited articles, the University of Minnesota has the highest number of citations (814), followed by the Chinese Academy of Science (812) and Stanford University (810). Recently, Stanford University has developed the InVEST model (a subset of the Natural Capital Project), gaining popularity among researchers. On the other hand, according to Figure 5, CSIR is leading in the list. The Indian government founded the CSIR in 2013. CSIR consisted of more than 38 laboratories, and nearly 4800 scientists were working at this institution. However, the results indicate that the CSIR incorporated a minimal number of ES-related studies in the Asian region. There are three identical clusters in Figure 4 represented by 12 countries from 2000–2020. Compared with the link strength and the bubble size, the U.S.A. cluster is more potent than the other clusters. However, the U.S.A. cluster connects with many countries, including the Asian region countries such as China. Therefore, it is legitimate to conclude that the U.S.A.-based green cluster is dominant in ecosystem service research.
Further, the results indicate that the red cluster represents the most productive institutions in the ES. There are seven institutions included in this cluster. Chinese Academy of Science (CAS) is included in this cluster, which indicated that the research conduct relates to the ES in China has a solid link to the U.S.A. universities. As the U.S.A.’s most productive institution, Sanford University had the highest link strength with the University of Minnesota among all other institutions in the country. The U.S.A. is carrying out many actions related to environmental protection, including the National Ecosystem Services Partnership, the Natural Capital Project, and the development of USEPA’s Enviro Atlas tool [26]. The University of British Colombia and CSIR in India connect to the U.S.A. and Australia. Additionally, the University of East Anglia and the University of Stockholm also represent the east European partnership to the ES research. Among them, the University of Stockholm shows the highest total link strength (Figure 5).
There are two main clusters displayed in (Figure 6). The red color cluster consists of 21 items, whereas the green color consists of six clusters. Halpern S. Benjamin is dominant in the green color cluster with 26 links and the highest link strength in both clusters. However, Halpern S. Benjamin linked both clusters, and he represents the UC Santa Barbara. Halpern S. Benjamin et al. [44] article obtained 5948 citations for ‘a global map of human impact on marine ecosystems’ publication. This article developed an ‘ecosystem-specific, multiscale spatial model’ to evaluate global data sets of anthropogenic drivers of ecological change for marine ecosystems. They found almost every marine ecosystem is subjected to human impact other than the ecosystems close to the polar regions. The green color cluster mainly followed similar marine ecosystem-based research.
Our paper focuses on the 2000–2020 period and finding new research trends in ES research so that Costanza et al.’s publications in early 1994 are not included. The ‘Economic value of ES at the global scale’ by Costanza et al. made a tremendous contribution to the ES research field [8]. The unit value-based approach began from the study of Costanza et al. [8], which has been cited approximately 6000 times until 2017. This study established the first framework for estimating the economic value of 17 ES for 16 biomes. Additionally, Costanza and Kubiszewski [46] discussed the importance of valuing ES stressed the importance of introducing new common asset institutions to take the ES value better into account other than defining them in the conventional markets. The red color cluster more prominence given to climate change, valuation, ecological economics, modeling, etc.
The results also revealed that the authors such as Halpern S. Benjamin and Robert Costanza contributed immensely to developing ES-related research studies globally. Further, Robert Costanza’s research interests include ecological economics, landscape ecology, and ES. Meanwhile, in January 2011, Robert Costanza was recognized as the most productive author in the WoSCC [46].
Figure 7 displayed the data regarding ‘types of ecosystems’, ‘ecosystem services’, ‘research focus’, and ‘study cites’ of 128 highly cited articles across the continents related to their origin. North America and Europe are the dominant continents in ES related studies, concerning the highly cited articles and the number of ecosystem studies conducted from 2000 to 2020 (Figure 7). Moreover, these top two continents (North America and Europe) were highlighted in the other studies. In contrast, there was a minimal number of studies conducted in South America and Oceania. The most accessed ecosystems were terrestrial urban and ocean Figure 7a. The terrestrial ecosystem was the dominant type of ecosystem accessed in Europe, while the ocean ecosystem received particular consideration in North America. In contrast, this analysis found very few assessments involving grassland, freshwater, and wetland ecosystems among the highly cited articles. However, the studies conducted by Wen L. et al. [47] and Zheng X. et al. [48], focused on the degradation of grassland, which shows high trending rates in citations; therefore, these ES studies may see a high preference in the future.
Figure 7b displayed the data of ES regulating services were the most dominant, consistent with the previous finding [31]. The highly cited articles with the four continents, i.e., Europe, North America, Asia, and Africa, gave more attention to the regulating and provisioning services. The complexity that occurred while evaluating the cultural and supporting services might be the reason for the declining number of citations in this category [49,50]. In Oceania, there were no highly cited articles focusing on cultural services.
The results of the research focus are given in Figure 7c. Quantitative assessment is top in the research list, focusing on studies on ES, followed by qualitative assessment, policy evaluation, monetary valuation, and literature review. Quantitative assessments comprised all kinds of empirical studies of ES. In comparison, these studies used various statistical or computational techniques [51]. The tools used to evaluate the ecosystem services in quantitatively (1) ’Integrated Valuation of Ecosystem Services and trade-offs (InVEST)’ and (2) ‘Social Values for Ecosystem Services (SolVES)’ [52]. In addition, some studies incorporated ES and biodiversity as additional components to fit and visualize the consequences of land use on multiple ES and their trade-off [53,54].
Qualitative research on ES is mainly confined to surveys, experiments, or questionnaires. Some of the studies have addressed the relationship between ecosystem and biodiversity [55]. In addition, the Payment for Ecosystem Services (PES) has a developing trend on a global scale [56]. Costa Rica pioneered implementing PES for environmental conservation in 1997. China is also moving ahead with effective PES policy implementation, such as the Natural Forest Conservation Program (NFCP) and the Grain to Green Program (GTGP), notably the most prominent environmental conservation programs worldwide [57]. Through programs such as National Forest Commission (CONAFOR), Mexico also implemented PES and became one of the world-leading advocates in PES. [58]. Wetland mitigation banking is another Neoliberal environmental policy implemented by the U.S.A., which paves the path to creating a stable ES market [59]. The monetary valuation approach is another widely used method for valuing ES; unit value transfer, contingent valuation, and market and nonmarket valuation methods come under this category [60].
Figure 7d displayed the ES study cites around the world. According to the results, case study citations were not equally distributed across the continents. They are mainly confined to the U.S.A. and Europe. The top five countries in case study sites were the U.S.A., China, Sweden, Germany, and the U.K. Interestingly, China is an Asian country that immensely contributed to ES-related research, but did not contribute to other Asian countries towards ES-related research compared to China.

4. Limitation of This Study

This bibliometric analysis is solely based on the Web of Science’s SCI-E, ESCI, and SSCI databases. The term ‘ecosystem service/s’ is used in research to broaden the scope of the investigation. The analysis excludes any other databases. We note that results may vary depending on the database used, such as Scopus and Google Scholar, and, in the interim, the addition of other search phrases such ecosystem valuation. Author keywords were missing from certain highly cited publications published in journals such as PLoS ONE and PNAS. Therefore, our study depends on the author’s keywords and includes such articles only for the presentation of the network of keywords. The baseline (≥200) is the most cited article in this bibliometric analysis. Therefore, according to the limitations above, we must interpret any conclusions present in this study.

5. Conclusions

This paper presents the global ES research trend and a scholarly network covering the period of 2000 to 2020. Our bibliometric analysis includes publication outputs, journals, author keywords, countries, institutions, and authors, and is based on 128 highly cited research articles retrieved from the SCI-E, ESCI, and SSCI databases of the Web of Science. The types of ecosystem and ES were evaluated, including the studies’ research focus and the geographical location of the case study.
A comparative increase in the highly cited articles in ES research indicates the global attention it is acquired. The most frequently used author keywords were “ecosystem services”, “biodiversity”, “valuation”, “marine spatial planning”, and “conservation planning”. Based on the author’s keywords network, “ecosystem services” are strongly linked to biodiversity and climate change impacts with relatively ‘old’ keywords such as “sustainability” and new keywords such as “payment for ecosystem service”. The concepts behind these keywords are equally relevant in the author keywords network.
Ecological Economics is placed on first in the total citation ranking, followed by PNAS journal that obtained the second place and third place received by the Science journal. Concerning the impact factor, the Science journal gained the highest impact factor according to the 2020 JCR reports. The U.S.A., Canada, China, France, and Australia are considered to be the most influential countries related to the cumulative number of highly cited articles and co-authorship networks. Distinctly, the U.S.A. is highly connected with China, Canada, and France. The University of Minnesota, UC Santa Barbara, and the Chinese Academy of Science were noted as the most productive universities connected to the U.S.A. However, Halpern S. Benjamin represents the UC Santa Barbara and is considered the most influential and compelling author. Halpern S. Benjamin developed an ‘ecosystem-specific, multiscale spatial model’ to evaluate global data sets of anthropogenic drivers of ecological change for marine ecosystems, which gained international attention. Terrestrial, urban, and marine ecosystems are considered the most accessed and studied fields in the ecosystem service. Quantitative and qualitative evaluations methods were highly focused on ecosystem service studies. Most studies were conducted in the U.S.A. and China.

Author Contributions

Conceptualization, R.G., S.S., M.L. and W.A.; methodology, R.G. and S.S.; formal analysis, R.G., S.S., W.A. and I.G.; writing—original draft preparation, R.G., S.S., M.L. and I.G.; review and editing, R.G., S.S. and I.G.; visualization, S.S. and M.L. All authors have read and agreed to the published version of the manuscript.

Funding

This research received no external funding.

Institutional Review Board Statement

Not applicable.

Informed Consent Statement

Not applicable.

Data Availability Statement

Not applicable.

Conflicts of Interest

The authors declare no conflict of interest.

References

  1. Ehrlich, P.R.; Ehrlich, A.H. Extinction: The Causes and Consequences of the Disappearance of Species; Random House: New York, NY, USA, 1981; pp. 72–98. [Google Scholar]
  2. World Resources Institute. Ecosystems and Human Well-Being: Opportunities and Challenges for Business and Industry: Millenium Ecosystem Accessment. Washington, DC. 2005. Available online: https://www.millenniumassessment.org/documents/document.353.aspx.pdf (accessed on 10 October 2021).
  3. De Marques, A.A.B.; Peres, C.A. Pervasive legal threats to protected areas in Brazil. Oryx 2015, 49, 25–29. [Google Scholar] [CrossRef] [Green Version]
  4. Wood, S.L.R.; Jones, S.K.; Johnson, J.A.; Brauman, K.A.A.; Chaplin-Kramer, R.; Fremier, A.; Girvetz, E.; Gordon, L.J.; Kappel, C.V.; Mandle, L.; et al. Distilling the role of ecosystem services in the Sustainable Development Goals. Ecosyst. Serv. 2018, 29, 70–82. [Google Scholar] [CrossRef] [Green Version]
  5. Chaudhary, S.; McGregor, A.; Houston, D.; Chettri, N. The evolution of ecosystem services: A time series and discourse-centered analysis. Environ. Sci. Policy 2015, 54, 25–34. [Google Scholar] [CrossRef]
  6. Kull, C.A.; Arnauld de Sartre, X.; Castro-Larrañaga, M. The political ecology of ecosystem services. Geoforum 2015, 61, 122–134. [Google Scholar] [CrossRef] [Green Version]
  7. Millennium Ecosystem Assessment (MEA). Ecosystems and Human Well-Being: A Framework forAssessment; Island Press: Washington, DC, USA, 2003. [Google Scholar]
  8. Costanza, R.; D’Arge, R.; De Groot, R.; Farber, S.; Grasso, M.; Hannon, B.; Limburg, K.; Naeem, S.; O’Neill, R.V.; Paruelo, J.; et al. The value of the world’s ecosystem services and natural capital. Nature 1997, 387, 253–260. [Google Scholar] [CrossRef]
  9. FU, H.-Z.; Ho, Y.-S. Highly Cited Canada Articles in Science Citation Index Expanded: A Bibliometric Analysis. Can. Soc. Sci. 2015, 11, 50–62. [Google Scholar] [CrossRef]
  10. Estoque, R.C.C.; Murayama, Y. Landscape pattern and ecosystem service value changes: Implications for environmental sustainability planning for the rapidly urbanizing summer capital of the Philippines. Landsc. Urban Plan. 2013, 116, 60–72. [Google Scholar] [CrossRef]
  11. Wu, K.Y.; Ye, X.Y.; Qi, Z.F.F.; Zhang, H. Impacts of land use/land cover change and socioeconomic development on regional ecosystem services: The case of fast-growing Hangzhou metropolitan area, China. Cities 2013, 31, 276–284. [Google Scholar] [CrossRef]
  12. Heller, N.E.; Zavaleta, E.S. Biodiversity management in the face of climate change: A review of 22 years of recommendations. Biol. Conserv. 2009, 142, 14–32. [Google Scholar] [CrossRef]
  13. Wang, E.C.Y. CD4+ T cells, human cytomegalovirus and end-stage renal disease. Nephrol. Dial. Transplant. 2011, 26, 1467–1470. [Google Scholar] [CrossRef]
  14. Martínez, M.A.; Herrera, M.; Contreras, E.; Ruíz, A.; Herrera-Viedma, E. Characterizing highly cited papers in Social Work through H-Classics. Scientometrics 2015, 102, 1713–1729. [Google Scholar] [CrossRef]
  15. Zhang, L.; Wang, M.H.; Hu, J.; Ho, Y.S. A review of published wetland research, 1991–2008: Ecological engineering and ecosystem restoration. Ecol. Eng. 2010, 36, 973–980. [Google Scholar] [CrossRef]
  16. Estoque, R.C.C.; Togawa, T.; Ooba, M.; Gomi, K.; Nakamura, S.; Hijioka, Y.; Kameyama, Y. A review of quality of life (QOL) assessments and indicators: Towards a “QOL-Climate” assessment framework. Ambio 2019, 48, 619–638. [Google Scholar] [CrossRef] [PubMed]
  17. Runting, R.K.; Bryan, B.A.; Dee, L.E.; Maseyk, F.J.F.; Mandle, L.; Hamel, P.; Wilson, K.A.; Yetka, K.; Possingham, H.P.; Rhodes, J.R. Incorporating climate change into ecosystem service assessments and decisions: A review. Glob. Chang. Biol. 2017, 23, 28–41. [Google Scholar] [CrossRef] [PubMed] [Green Version]
  18. Wang, M.H.; Li, J.; Ho, Y.S. Research articles published in water resources journals: A bibliometric analysis. Desalin. Water Treat. 2011, 28, 353–365. [Google Scholar] [CrossRef]
  19. Khan, M.A.; Ho, Y.S. Top-cited articles in environmental sciences: Merits and demerits of citation analysis. Sci. Total Environ. 2012, 431, 122–127. [Google Scholar] [CrossRef]
  20. Barbosa, F.G.; Schneck, F. Characteristics of the top-cited papers in species distribution predictive models. Ecol. Model. 2015, 313, 77–83. [Google Scholar] [CrossRef]
  21. Fu, H.Z.; Ho, Y.S. Highly cited Antarctic articles using Science Citation Index Expanded: A bibliometric analysis. Scientometrics 2016, 109, 337–357. [Google Scholar] [CrossRef]
  22. Fahimnia, B.; Sarkis, J.; Davarzani, H. Green Supply Chain Management: A Review and Bibliometric Analysis; Elsevier: Amsterdam, The Netherlands, 2015; Volume 162, ISBN 1508831483. [Google Scholar]
  23. Waltman, L.; van Eck, N.J. Field-normalized citation impact indicators and the choice of an appropriate counting method. J. Informetr. 2015, 9, 872–894. [Google Scholar] [CrossRef] [Green Version]
  24. Xepapadeas, A. The Economics of Ecosystems and Biodiversity: Ecological and Economic Foundations; Kumar, P., Ed.; Earthscan: London, UK; Washington, DC, USA, 2010; ISBN 978-1-84971-212-5. [Google Scholar]
  25. Andrew, M.E.; Wulder, M.A.; Nelson, T.A.; Coops, N.C. Spatial data, analysis approaches, and information needs for spatial ecosystem service assessments: A review. GISci. Remote Sens. 2015, 52, 344–373. [Google Scholar] [CrossRef] [Green Version]
  26. McDonough, K.; Hutchinson, S.; Moore, T.; Hutchinson, J.M.S. Analysis of publication trends in ecosystem services research. Ecosyst. Serv. 2017, 25, 82–88. [Google Scholar] [CrossRef]
  27. Worm, B.; Barbier, E.B.; Beaumont, N.; Duffy, J.E.; Folke, C.; Halpern, B.S.; Jackson, J.B.C.; Lotze, H.K.; Micheli, F.; Palumbi, S.R.; et al. Impacts of biodiversity loss on ocean ecosystem services. Science 2006, 314, 787–790. [Google Scholar] [CrossRef] [Green Version]
  28. Rey Benayas, J.M.; Newton, A.C.; Diaz, A.; Bullock, J.M. Enhancement of biodiversity and ecosystem services by ecological restoration: A meta-analysis. Science 2009, 325, 1121–1124. [Google Scholar] [CrossRef]
  29. Fisher, B.; Turner, R.K.; Morling, P. Defining and classifying ecosystem services for decision making. Ecol. Econ. 2009, 68, 643–653. [Google Scholar] [CrossRef] [Green Version]
  30. Boyd, J.; Banzhaf, S. What are ecosystem services? The need for standardized environmental accounting units. Ecol. Econ. 2007, 63, 616–626. [Google Scholar] [CrossRef] [Green Version]
  31. Zhang, X.; Estoque, R.C.C.; Xie, H.; Murayama, Y.; Ranagalage, M. Bibliometric analysis of highly cited articles on ecosystem services. PLoS ONE 2019, 14, e0210707. [Google Scholar] [CrossRef]
  32. Costanza, R.; de Groot, R.; Sutton, P.; van der Ploeg, S.; Anderson, S.J.; Kubiszewski, I.; Farber, S.; Turner, R.K. Changes in the global value of ecosystem services. Glob. Environ. Chang. 2014, 26, 152–158. [Google Scholar] [CrossRef]
  33. De Groot, R.S.; Alkemade, R.; Braat, L.; Hein, L.; Willemen, L. Challenges in integrating the concept of ecosystem services and values in landscape planning, management and decision making. Ecol. Complex. 2010, 7, 260–272. [Google Scholar] [CrossRef]
  34. Carpenter, S.R.R.; Mooney, H.A.; Agard, J.; Capistrano, D.; Defries, R.S.S.; Diaz, S.; Dietz, T.; Duraiappah, A.K.; Oteng-Yeboah, A.; Pereira, H.M.; et al. Science for managing ecosystem services: Beyond the Millennium Ecosystem Assessment. Proc. Natl. Acad. Sci. USA 2009, 106, 1305–1312. [Google Scholar] [CrossRef] [PubMed] [Green Version]
  35. Mace, G.M.M.; Norris, K.; Fitter, A.H.H. Biodiversity and ecosystem services: A multilayered relationship. Trends Ecol. Evol. 2012, 27, 19–26. [Google Scholar] [CrossRef]
  36. Isbell, F.; Calcagno, V.; Hector, A.; Connolly, J.; Harpole, W.S.; Reich, P.B.; Scherer-Lorenzen, M.; Schmid, B.; Tilman, D.; Van Ruijven, J.; et al. High plant diversity is needed to maintain ecosystem services. Nature 2011, 477, 199–202. [Google Scholar] [CrossRef] [PubMed]
  37. Kremen, C. Managing ecosystem services: What do we need to know about their ecology? Ecol. Lett. 2005, 8, 468–479. [Google Scholar] [CrossRef] [PubMed]
  38. Costanza, R.; Howarth, R.B.; Kubiszewski, I.; Liu, S.; Ma, C.; Plumecocq, G.; Stern, D.I. Influential publications in ecological economics revisited. Ecol. Econ. 2016, 123, 68–76. [Google Scholar] [CrossRef] [Green Version]
  39. Balvanera, P.; Siddique, I.; Dee, L.; Paquette, A.; Isbell, F.; Gonzalez, A.; Byrnes, J.; O’Connor, M.I.; Hungate, B.A.; Griffin, J.N. Linking biodiversity and ecosystem services: Current uncertainties and the necessary next steps. Bioscience 2014, 64, 49–57. [Google Scholar] [CrossRef]
  40. Rey Benayas, J.M.; Bullock, J.M. Restoration of Biodiversity and Ecosystem Services on Agricultural Land. Ecosystems 2012, 15, 883–899. [Google Scholar] [CrossRef]
  41. Ricketts, T.H.; Watson, K.B.; Koh, I.; Ellis, A.M.; Nicholson, C.C.; Posner, S.; Richardson, L.L.; Sonter, L.J. Disaggregating the evidence linking biodiversity and ecosystem services. Nat. Commun. 2016, 7, 13106. [Google Scholar] [CrossRef] [PubMed] [Green Version]
  42. Power, A.G.G. Ecosystem services and agriculture: Tradeoffs and synergies. Philos. Trans. R. Soc. B Biol. Sci. 2010, 365, 2959–2971. [Google Scholar] [CrossRef]
  43. Raudsepp-Hearne, C.; Peterson, G.D.; Bennett, E.M. Ecosystem service bundles for analyzing tradeoffs in diverse landscapes. Proc. Natl. Acad. Sci. USA 2010, 107, 5242–5247. [Google Scholar] [CrossRef] [Green Version]
  44. Halpern, B.S.; Walbridge, S.; Selkoe, K.A.; Kappel, C.V.; Micheli, F.; D’Agrosa, C.; Bruno, J.F.; Casey, K.S.; Ebert, C.; Fox, H.E.; et al. A global map of human impact on marine ecosystems. Science 2008, 319, 948–952. [Google Scholar] [CrossRef] [PubMed] [Green Version]
  45. Whitbread, J.; Gray, S.J. Cardiopulmonary bypass equipment. In Core Topics in Cardiac Anesthesia, 2nd ed.; Cambridge University Press: Cambridge, UK, 2012; pp. 345–354. [Google Scholar] [CrossRef]
  46. Costanza, R.; Kubiszewski, I. The authorship structure of “ecosystem services” as a transdisciplinary field of scholarship. Ecosyst. Serv. 2012, 1, 16–25. [Google Scholar] [CrossRef] [Green Version]
  47. Wen, L.; Dong, S.; Li, Y.; Li, X.; Shi, J.; Wang, Y.; Liu, D.; Ma, Y. Effect of Degradation Intensity on Grassland Ecosystem Services in the Alpine Region of Qinghai-Tibetan Plateau, China. PLoS ONE 2013, 8, e0058432. [Google Scholar] [CrossRef] [Green Version]
  48. Zheng, X.; Zhang, J.; Cao, S. Net value of grassland ecosystem services in mainland China. Land Use Policy 2018, 79, 94–101. [Google Scholar] [CrossRef]
  49. Maseyk, F.J.F.; Mackay, A.D.; Possingham, H.P.; Dominati, E.J.; Buckley, Y.M. Managing Natural Capital Stocks for the Provision of Ecosystem Services. Conserv. Lett. 2017, 10, 211–220. [Google Scholar] [CrossRef]
  50. Chan, K.M.A.; Satterfield, T.; Goldstein, J. Rethinking ecosystem services to better address and navigate cultural values. Ecol. Econ. 2012, 74, 8–18. [Google Scholar] [CrossRef] [Green Version]
  51. Jiang, W. Ecosystem services research in China: A critical review. Ecosyst. Serv. 2017, 26, 10–16. [Google Scholar] [CrossRef]
  52. Sherrouse, B.C.; Clement, J.M.; Semmens, D.J. A GIS application for assessing, mapping, and quantifying the social values of ecosystem services. Appl. Geogr. 2011, 31, 748–760. [Google Scholar] [CrossRef]
  53. Monge, J.J.; Parker, W.J.; Richardson, J.W. Integrating forest ecosystem services into the farming landscape: A stochastic economic assessment. J. Environ. Manag. 2016, 174, 87–99. [Google Scholar] [CrossRef]
  54. Peña, L.; Onaindia, M.; de Manuel, B.F.; Ametzaga-Arregi, I.; Casado-Arzuaga, I. Analysing the synergies and trade-offs between ecosystem services to reorient land use planning in Metropolitan Bilbao (northern Spain). Sustainability 2018, 10, 4376. [Google Scholar] [CrossRef] [Green Version]
  55. Costanza, R.; Fisher, B.; Mulder, K.; Liu, S.; Christopher, T. Biodiversity and ecosystem services: A multi-scale empirical study of the relationship between species richness and net primary production. Ecol. Econ. 2007, 61, 478–491. [Google Scholar] [CrossRef]
  56. Reed, M.S.; Allen, K.; Attlee, A.; Dougill, A.J.; Evans, K.L.; Kenter, J.O.; Hoy, J.; McNab, D.; Stead, S.M.; Twyman, C.; et al. A place-based approach to payments for ecosystem services. Glob. Environ. Chang. 2017, 43, 92–106. [Google Scholar] [CrossRef]
  57. Liu, J.; Li, S.; Ouyang, Z.; Tam, C.; Chen, X. Ecological and socioeconomic effects of China’s policies for ecosystem services. Proc. Natl. Acad. Sci. USA 2008, 105, 9477–9482. [Google Scholar] [CrossRef] [PubMed] [Green Version]
  58. Kosoy, N.; Corbera, E.; Brown, K. Participation in payments for ecosystem services: Case studies from the Lacandon rainforest, Mexico. Geoforum 2008, 39, 2073–2083. [Google Scholar] [CrossRef]
  59. Robertson, M.M. The neoliberalization of ecosystem services: Wetland mitigation banking and problems in environmental governance. Geoforum 2004, 35, 361–373. [Google Scholar] [CrossRef]
  60. Bateman, I.J.; Harwood, A.R.; Mace, G.M.M.; Watson, R.T.; Abson, D.J.J.; Andrews, B.; Binner, A.; Crowe, A.; Day, B.H.H.; Dugdale, S.; et al. Bringing ecosystem services into economic decision-making: Land use in the United Kingdom. Science 2013, 341, 45–50. [Google Scholar] [CrossRef] [PubMed]
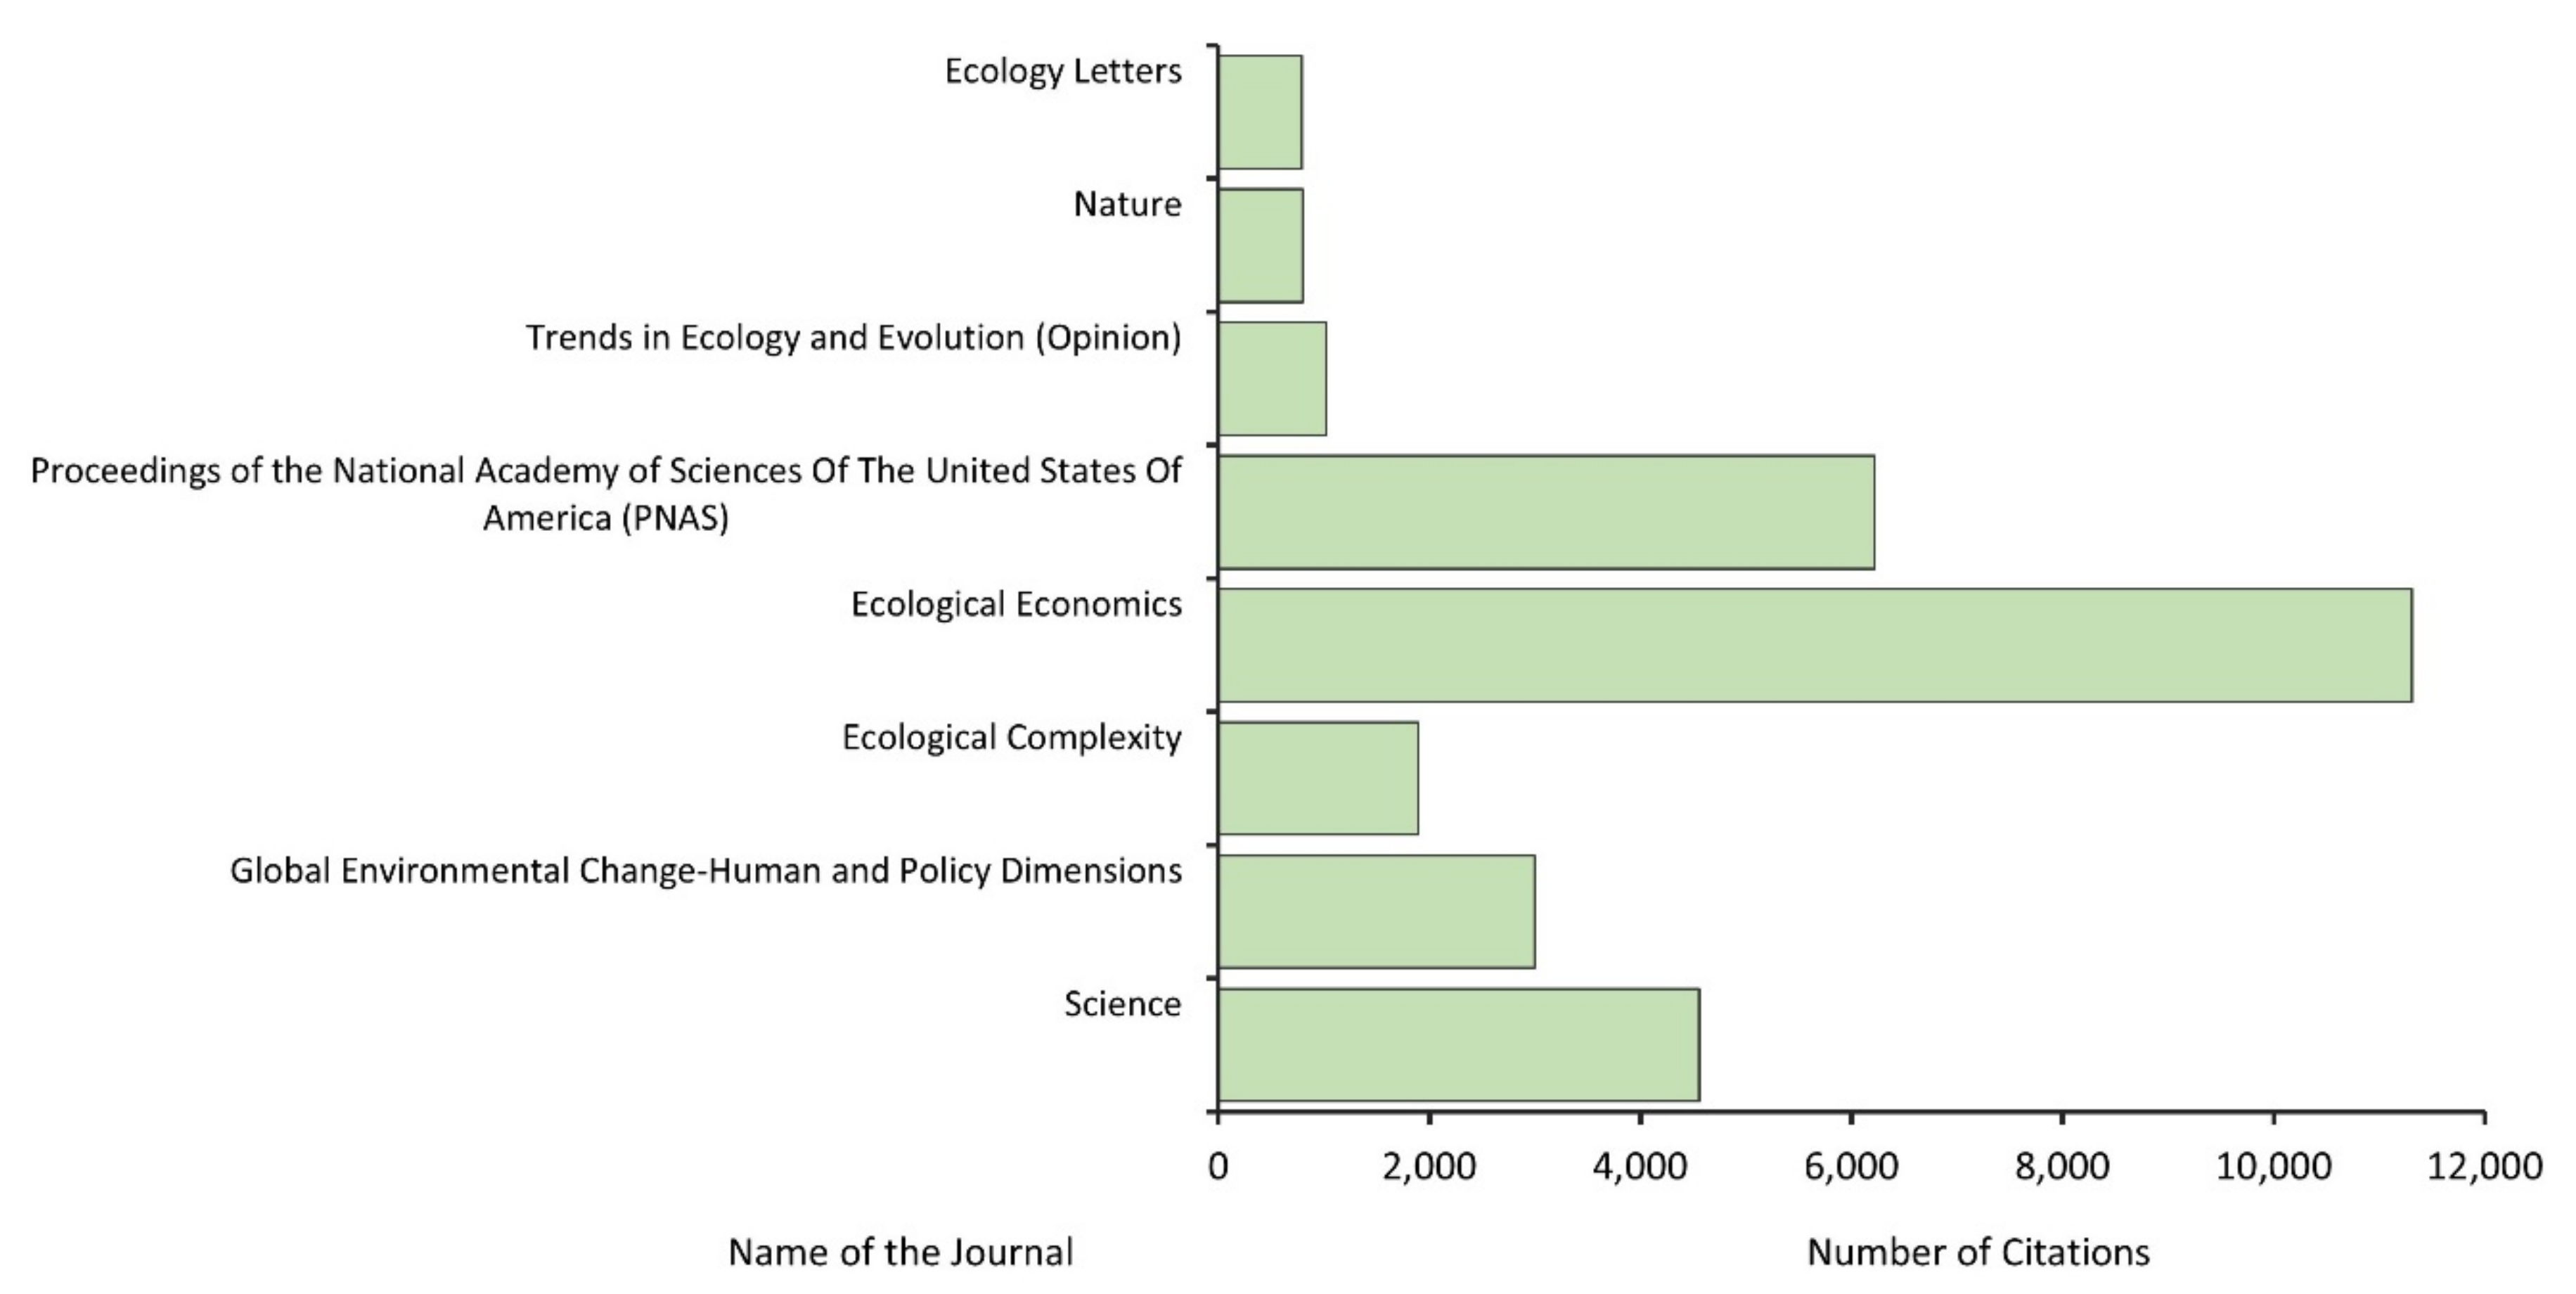
Figure 1. Number publications and citations related to ecosystem services research in Web of Science Core Collection (WoSCC) database from 2000 to 2020.
Ecologies 02 00021 g001
Figure 2. Number citations related to ecosystem services research in Web of Science Core Collection (WoSCC) database obtained by the highly cited journals from 2000 to 2020.
Ecologies 02 00021 g002
Figure 3. Co-occurrence network (author keywords) related to ecosystem services research in Web of Science Core Collection (WoSCC) database obtained by the highly cited journals from 2000 to 2020. Note: The threshold value = 1, applied for highly cited articles of 128, resulting in 156 keywords distributed among 22 clusters. The bubble size shows the total number of highly cited articles, the line thickness shows the linkage’s strength, and the color shows the cluster.
Ecologies 02 00021 g003
Figure 4. Co-authorship network of the top countries related to ecosystem services research in Web of Science Core Collection (WoSCC) database obtained by the highly cited journals from 2000 to 2020. Note: The threshold value = 1, applied for highly cited articles of 128, resulting in 12 countries. The bubble size shows the total number of highly cited articles, the line thickness shows the linkage’s strength, and the color shows the cluster.
Ecologies 02 00021 g004
Figure 5. Co-authorship network of the top universities and institutions related to ecosystem services research in Web of Science Core Collection (WoSCC) database obtained by the highly cited journals from 2000 to 2020. Note: The threshold value = 2, applied for highly cited articles of 128, resulting in 23 institutions. The bubble size shows the total number of highly cited articles, the line thickness shows the linkage’s strength, and the color shows the cluster.
Ecologies 02 00021 g005
Figure 6. Co-authorship network of the most productive authors related to ecosystem services research in Web of Science Core Collection (WoSCC) database obtained by the highly cited journals from 2000 to 2020. Note: The threshold value = 3, applied for highly cited articles of 128, resulting in 27 authors. The bubble size shows the total number of highly cited articles, the line thickness shows the linkage’s strength, and the color shows the cluster.
Ecologies 02 00021 g006
Figure 7. Highly cited articles: (a) Ecosystem Type, (b) Services of Ecosystem, (c) Research interest, and (d) Geographical locations of the study area.
Ecologies 02 00021 g007
Table 1. Top 10 highly cited articles (≥200, citation) in ecosystem services research in Web of Science Core Collection (WoSCC) database from 2000 to 2020.
Author(s)Publication YearJournalNCIF (2019)
Worm et al. [27]2006Science256447.728
Costanza et al. [32]2014Global Environmental Change-Human and Policy Dimensions212010.466
de Groot et al. [33]2010Ecological Complexity16911.882
Fisher et al. [29]2009Ecological Economics14975.389
Carpenter et al. [34]2009PNAS121211.205
Boyd and Banzhaf [30]2007Ecological Economics10495.389
Rey Benayas et al. [28]2009Science88747.728
Mace et al. [35]2012Trends in Ecology and Evolution (Opinion)82214.764
Isbell et al. [36]2011Nature79942.779
Kremen [37]2005Ecology Letters7928.665
Note: Number of Citations (NC); Impact Factor (IF) the details were extracted from the journal website.
Publisher’s Note: MDPI stays neutral with regard to jurisdictional claims in published maps and institutional affiliations.

