2. Materials and Methods
2.1. Experimental Approaches for Determining the Number of Subunits (Monomers) in a Multimolecular Complex
Here are some examples of experimental techniques that can be used to solve problems of the order of the assembly of macromolecular complexes:
Analytical ultracentrifugation allows the obtainment of the sedimentation profiles of particles based on size, shape, and mass [
2].
Size exclusion chromatography allows for the size-based separation of protein complexes [
3].
The native mass spectrometry method detects intermediate species and confirms their molecular weights [
4].
Crosslinking and SDS-PAGE enable the stabilization of oligomeric states through chemical crosslinking and visualizing all intermediates [
5].
Stopped-flow spectroscopy allows the observation of rapid changes in absorption or fluorescence during assembly [
6].
In affinity chromatography, a ligand (molecule with specific recognition capability) is immobilized on a suitable insoluble support (matrix), which is usually a natural or synthetic polymer gel in bead or membrane form.
However, there are difficulties everywhere. To ensure minimum interference in the binding of the analyte by the immobilized ligand, the coupling reaction between the ligand and support should occur through a region of the affinity ligand, remote from the binding site. In addition, the binding site of biopolymers is often located deep within the three-dimensional structure of the molecule, and steric hindrance prevents the interaction of the ligand with the analyte [
7].
Molecular weight (MW) is one of the most important characteristics of macromolecules. Single-molecule spectroscopy measures an average MW simply by counting individual fluorescent molecules embedded in a thin matrix film at a known mass concentration. This method can measure the MW of fluorescent molecules, biological objects, and nanoparticles at extremely low concentrations [
8]. Sometimes, MW cannot be measured correctly by conventional methods like gel permeation chromatography (GPC) due to, for example, aggregation. So, using single-molecule spectroscopy has been proposed to measure the average MW simply by counting individual fluorescent molecules embedded in a thin matrix film at known mass concentration. The most commonly used techniques to characterize synthetic polymers, such as osmometry, cryscopy, end-group titration, and light scattering, only yield an average molecular weight and do not yield any information about chemical structure or chain branching, etc. Other methods, such as gel permeation chromatography (GPC) and high performance liquid chromatography (HPLC), separate the oligomeric components of the polymer system with limited resolution. Furthermore, the accuracy of molecular weight values is limited by the need to calibrate against reference compounds. Thus, these techniques are not suitable for the determination of the absolute molecular weight distributions of the individual components of a polymer distribution.
2.2. Theoretical Approaches for Determining the Number of Subunits (Monomers) in a Multimolecular Complex
Simulations and algorithms predict the order of molecular interactions based on theoretical models such as the following [
9]:
Molecular dynamics (MD) simulations;
Quantum mechanics/molecular mechanics;
Reaction network analysis;
Machine learning models.
Also, real-time monitoring tools and methods such as the following can be used:
Single-molecule techniques and microfluidics [
9].
Stochastic models can provide valuable insights into chemical reactions, especially in systems where randomness and fluctuations are significant (e.g., small volumes or low particle numbers) [
10]. However, they have several limitations when it comes to determining the order of a chemical reaction.
Many models assume uniform reaction probabilities, which may oversimplify the effects of spatial constraints or variations in molecular accessibility. Stochastic models are not inherently designed to capture transition states or energy barriers, which are often critical in determining the reaction order in complex systems.
In this research study, we aim to determine the sequence of monomer involvement in biochemical reactions during the formation of a biological multicomponent structure. The objects of study include single-stranded and double-stranded RNA molecules, as well as small domains of viral proteins. The maximum molecular assembly in this study comprises double-stranded RNA, four small monomeric proteins, and a hexamer consisting of three proteins and three peptides.
For each molecular object, a spectrum of calculated thermodynamic parameters is determined, such as the stability parameter, the measure of differential entropy change, and the change in energy.
As additional monomers attach to a monomer and the structure becomes more complex, the set of calculated physical parameters also change. Therefore, we created a table outlining all possible pathways for forming the final complex molecular assembly and calculated their thermodynamic parameters (see
Table 1 and
Table 2).
2.3. Determination of Stoichiometries of [LGP2-8dsRNA-LGP2] Complexes
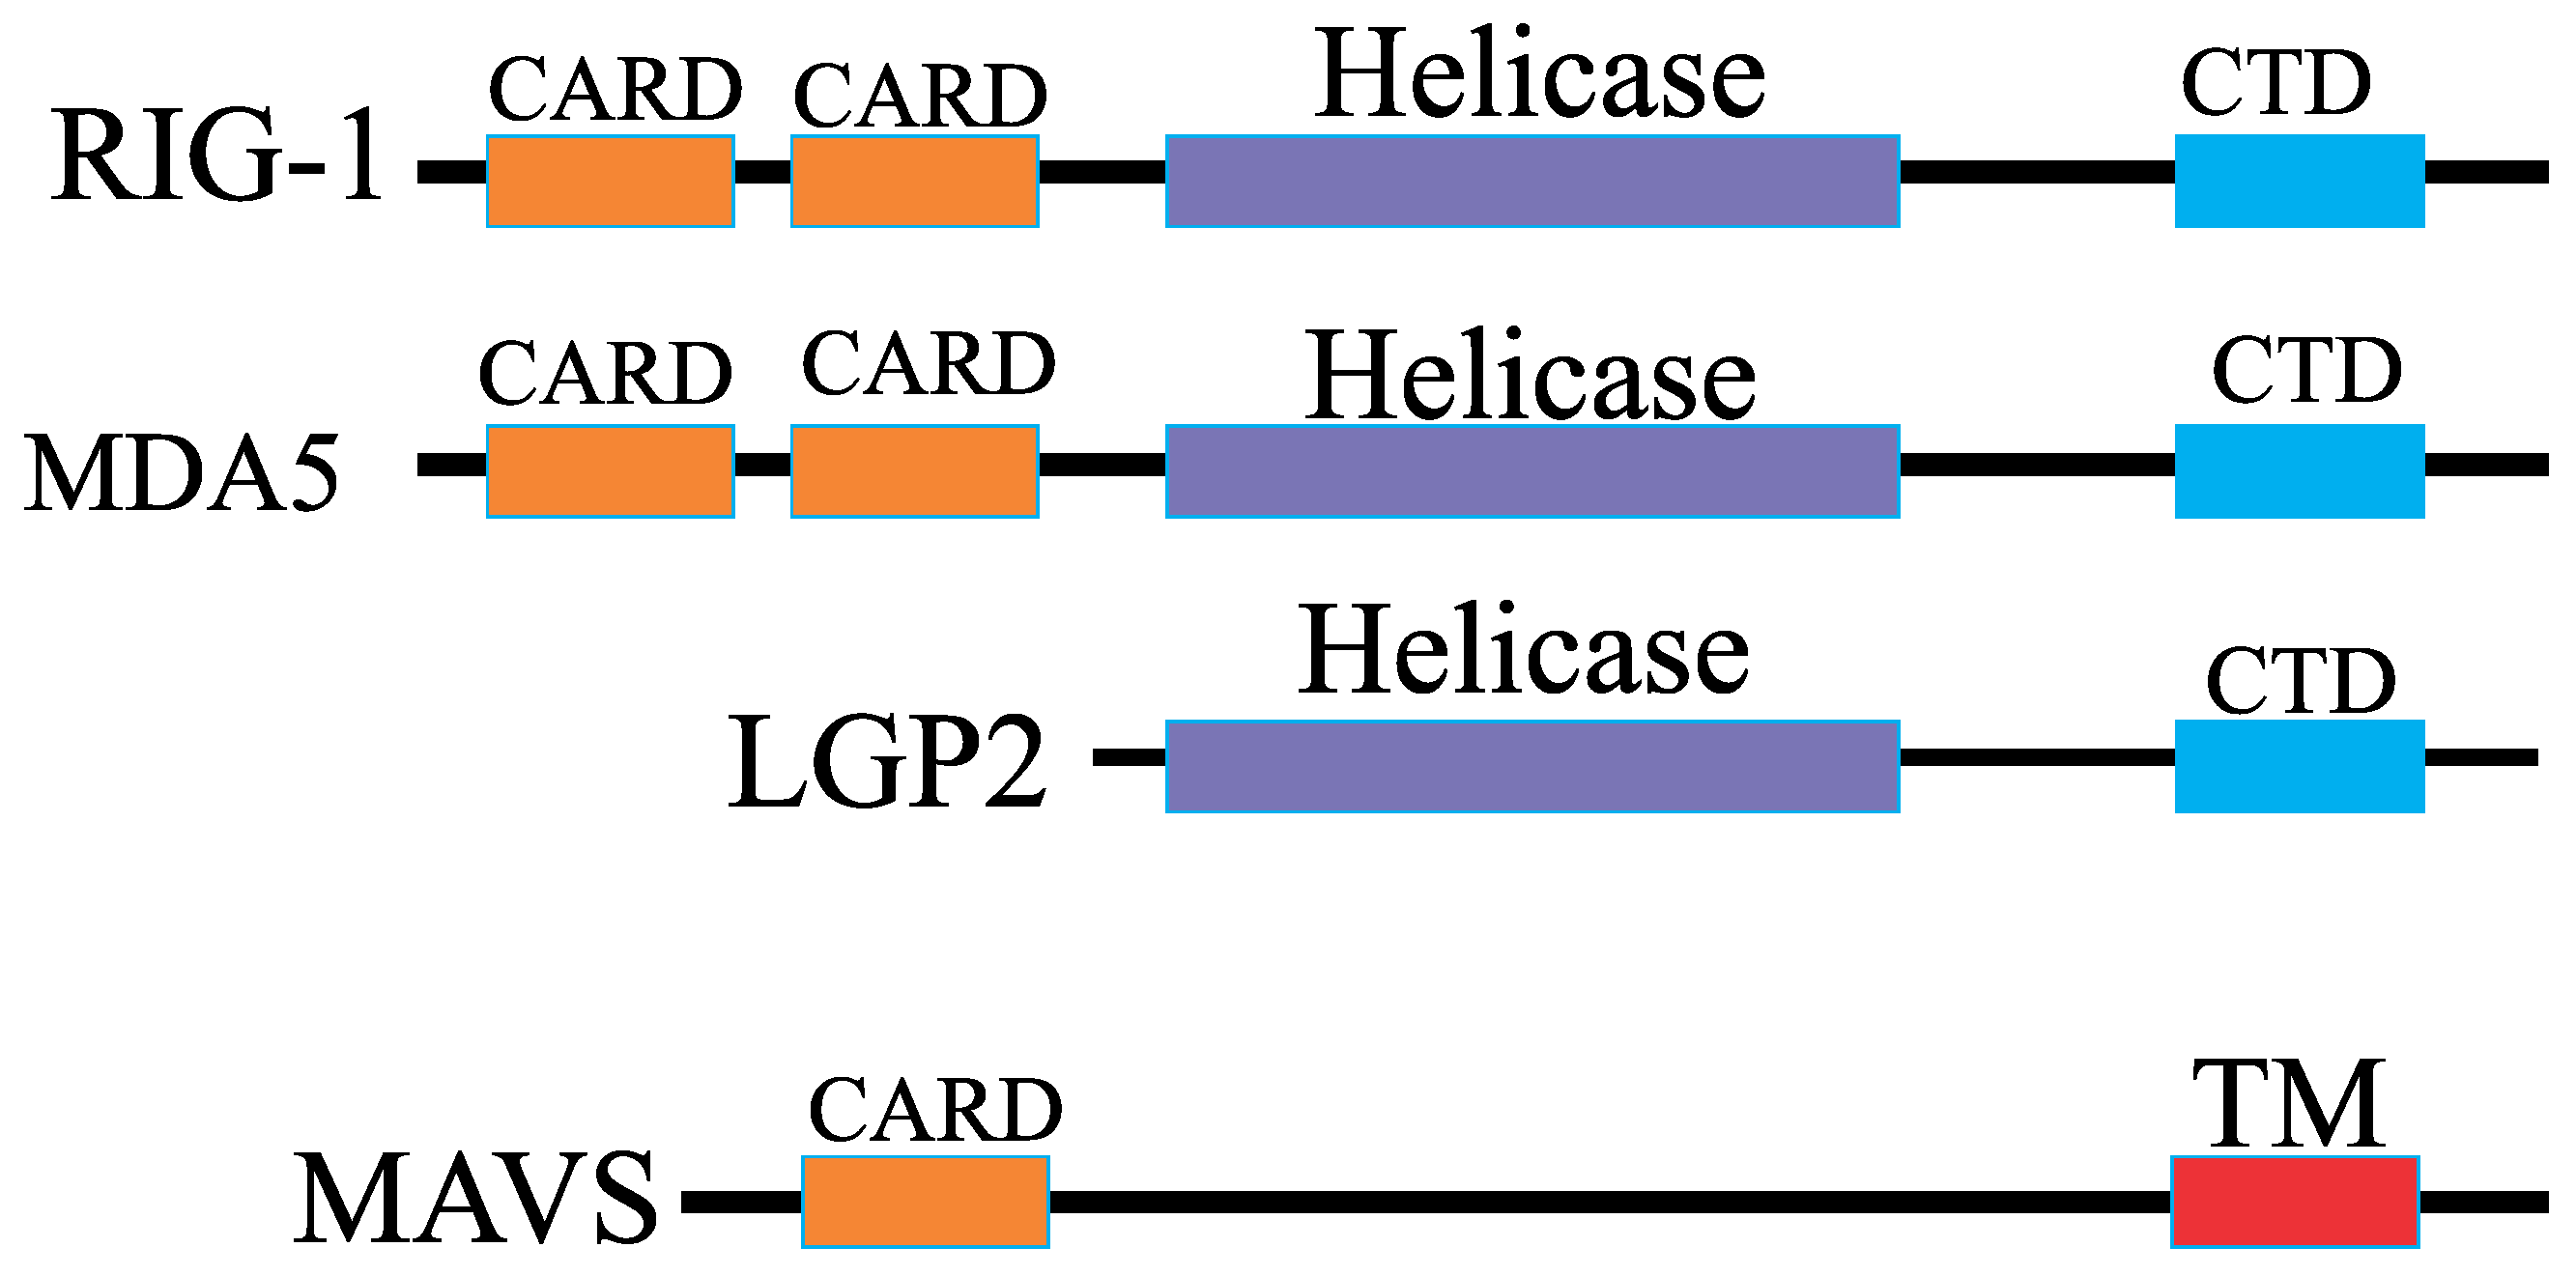
Let us examine the sequence of formation for the ternary [LGP2-8dsRNA-LGP2] complex in a solution. LGP2 is a homolog of RIG-I and MDA5, lacking the CARD domain, and thus lacks signaling capability [
15,
16]. Retinoic acid–inducible gene I (RIG-I)-like receptors (RLRs) are crucial sensors of viral infections, mediating the transcriptional induction of type I interferons and other genes that together establish the host antiviral response.
LGP2 can suppress RIG-I signaling through various potential mechanisms [
17]: by binding RNA with high affinity, thereby sequestering RNA ligands from RIG-I; or by directly interacting with RIG-I to block the assembly of the signaling complex (
Figure 1).
To establish the sequence of formation, we use changes in thermodynamic parameters such as , , and , calculated using computational methods.
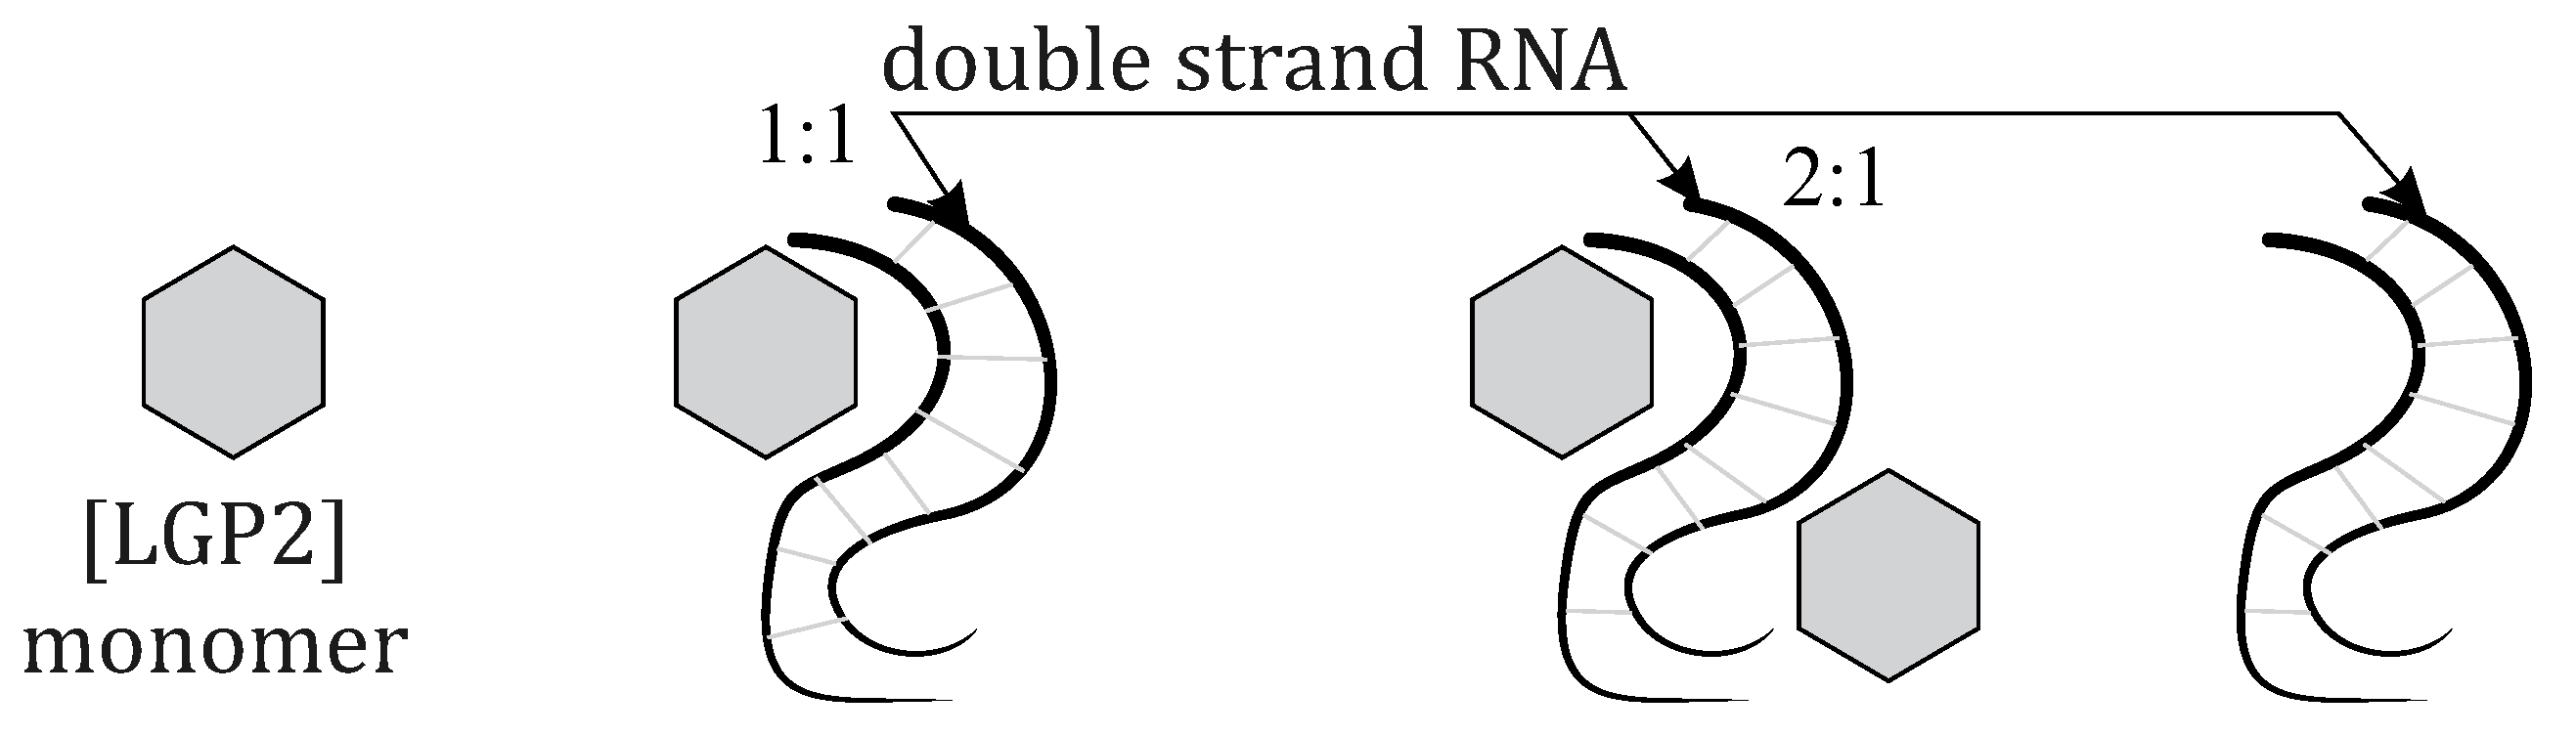
According to experimental studies [
18], the 8-bp dsRNA·LGP2 complex exhibits an estimated molecular mass consistent with a 2:1 complex, while the hairpin RNA·LGP2 complex has a molecular mass consistent with a 1:1 complex (
Figure 2).
Assuming the simultaneous existence of several biological systems in a solution, including LGP2 and dsRNA independently, as well as and , the relative proportions of these systems may vary depending on experimental conditions such as reagent and salt concentrations, temperature, and the presence of modified proteins. In this study, we calculate thermodynamic parameters for each compound and analyze energy barriers for transitions between the following biochemical systems:
: monomer;
: double-stranded RNA;
: 1:1 complex;
: 2:1 complex.
We begin with the stability parameter , shown in graphs on a logarithmic scale. Lower values of indicate a more stable biological compound closer to thermodynamic equilibrium. Conversely, higher values correspond to less stable compounds further from equilibrium, implying a system in search of further chemical reactions to reach equilibrium.
Changes in entropy are presented as differences between the mutant and wild-type systems. Negative entropy changes indicate increased system ordering.
The change in dissociation energy is also expressed as the difference between the mutant and wild-type systems.
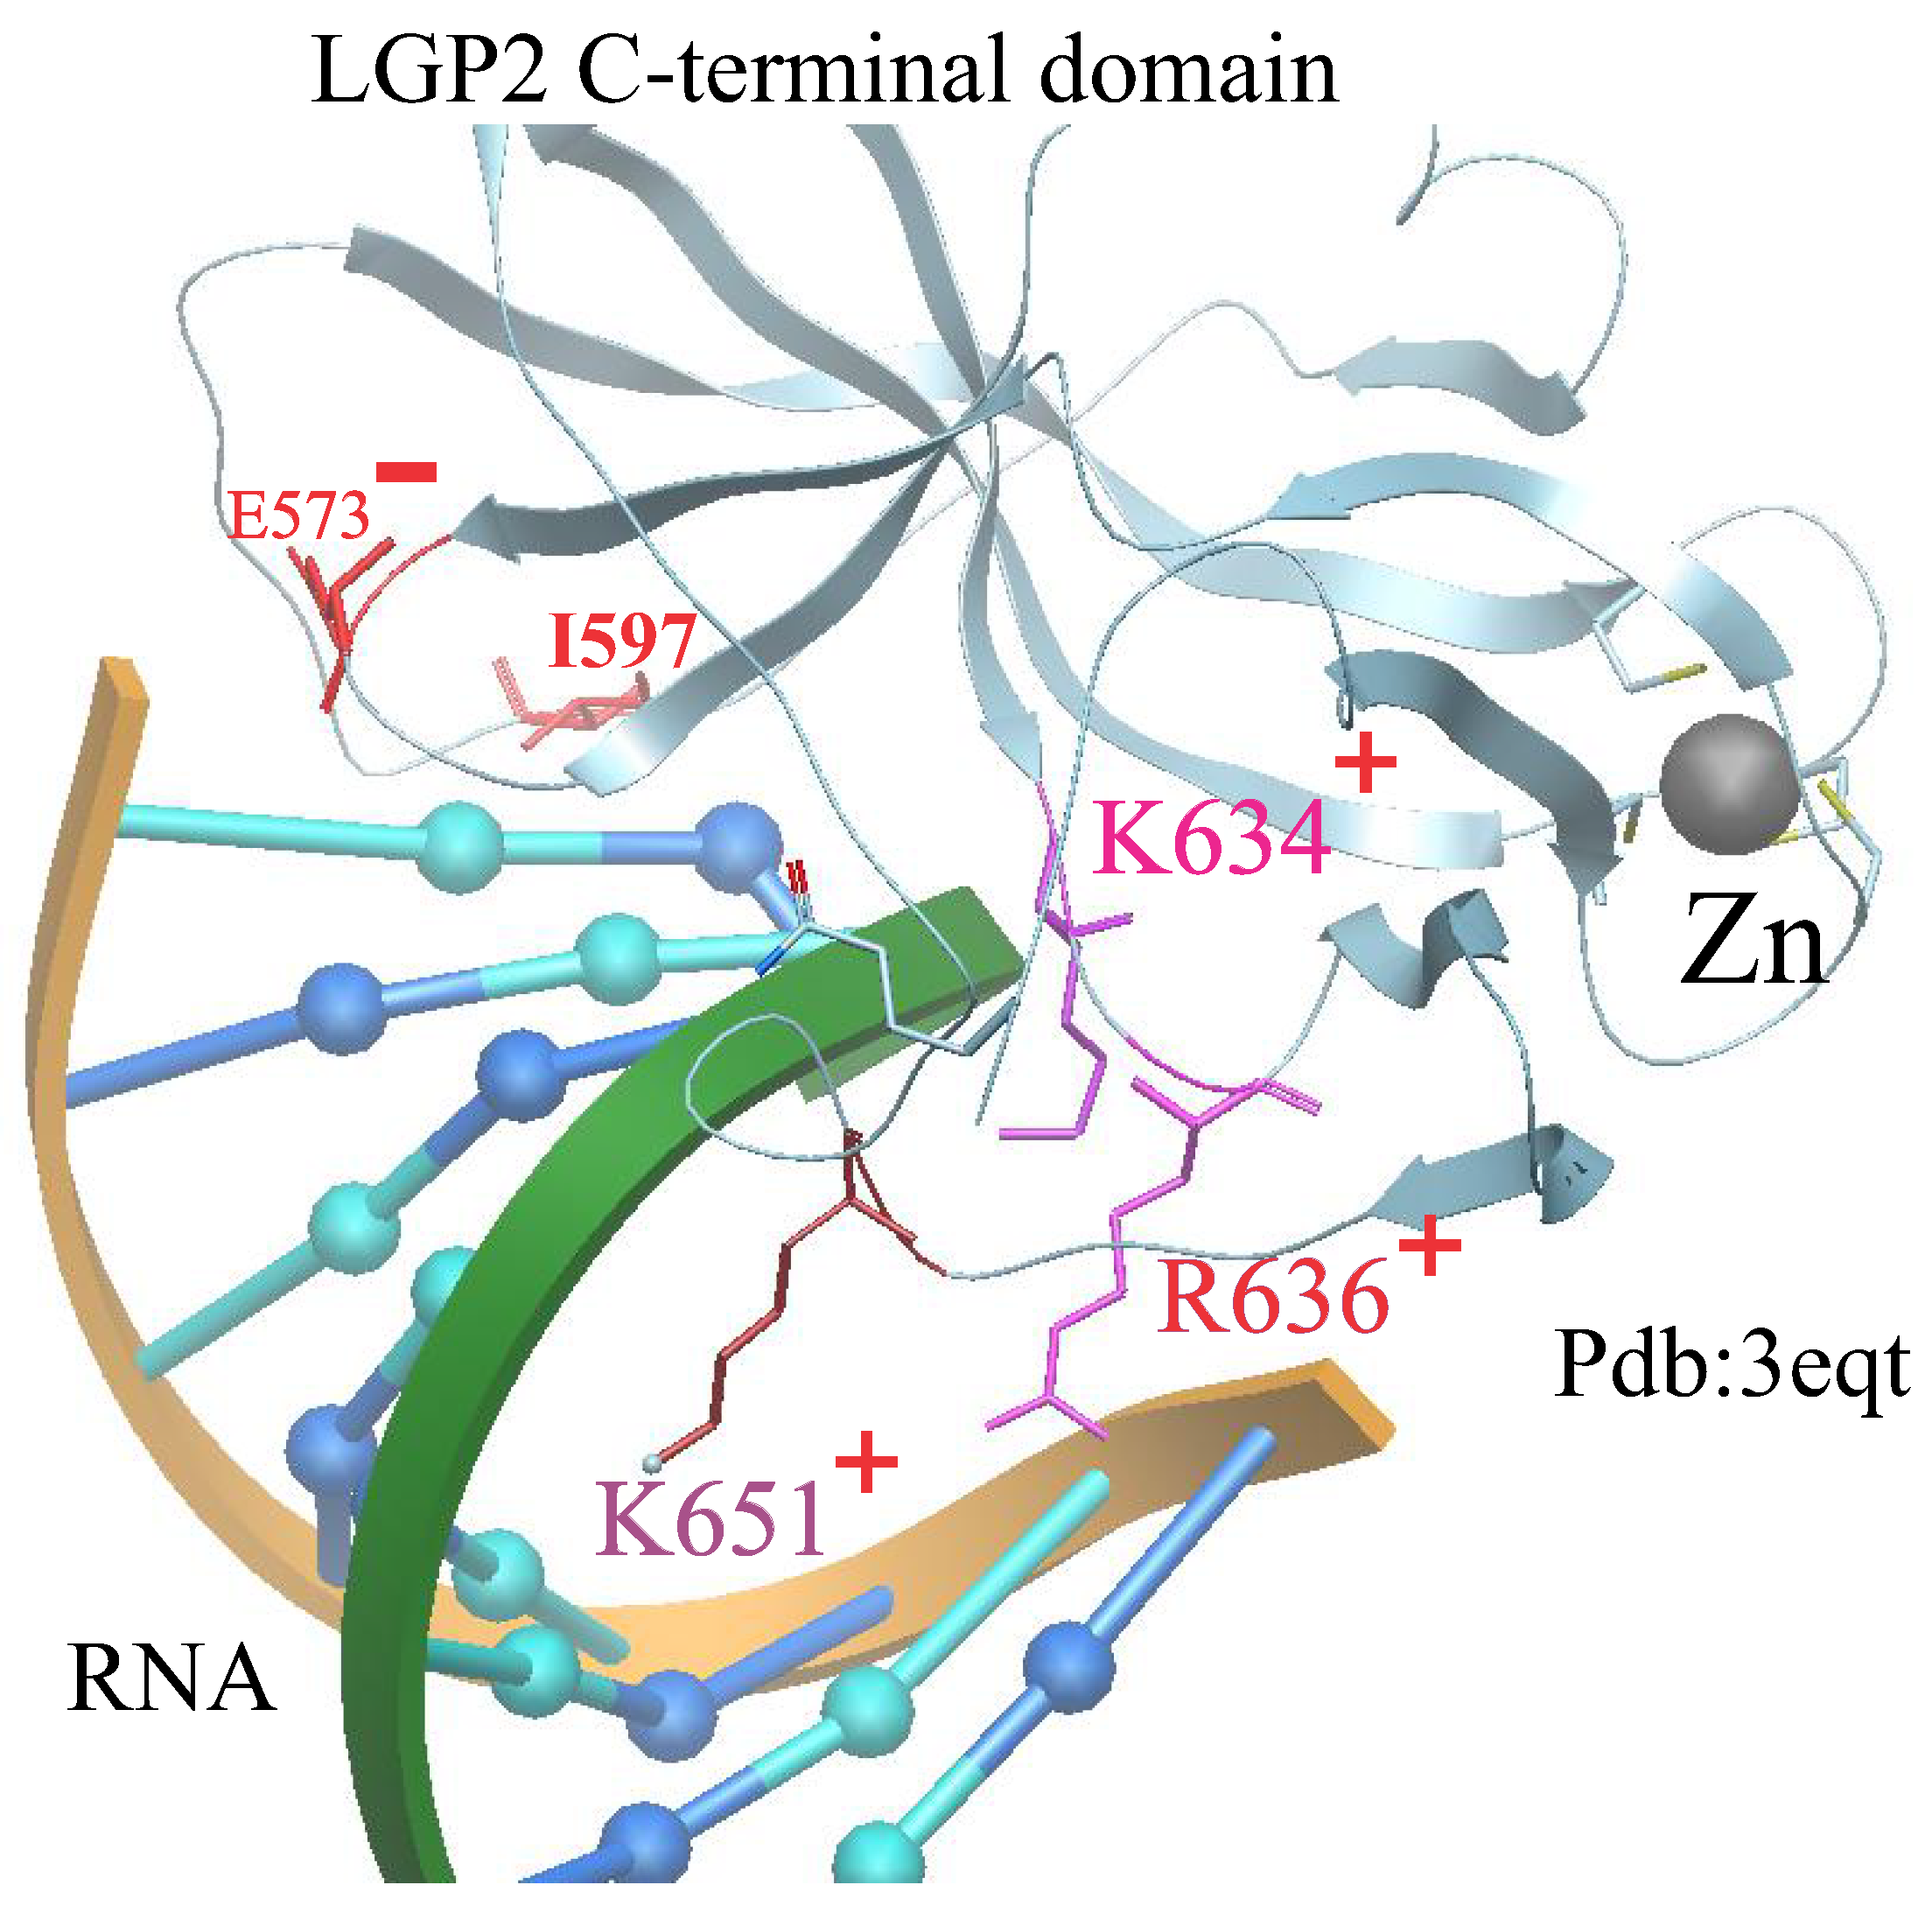
We performed thermodynamic calculations for all the above-mentioned biological complexes, taking into account LGP2 mutations: I597S, E573A, K634E, K651E, and K634E/R636E. These mutations significantly influence the stability and energy landscape of the complexes.
Thermodynamic analysis revealed that mutations impact the stability and energy profile of LGP2 complexes. Lower values correlate with increased stability, while negative entropy changes reflect greater molecular ordering. These findings contribute to understanding the molecular mechanisms underlying LGP2-dsRNA interactions and provide insights for further experimental and computational studies.
Since multiple different molecular systems can exist simultaneously in a solution,
Figure 3 shows those for which thermodynamic property calculations were performed.
Let us consider the experimental
values determined for molecular systems with various mutations in the LGP2 protein, along with the stoichiometries of the complexes (
Table 3).
We calculated the thermodynamic parameters for all three biological assemblies, taking into account the different mutations, and present these numerical data in combined graphs (see
Figure 3).
3. Results
We begin by analyzing monomeric [LGP2] proteins with various mutations, each of which exists in solution in a monomeric state. We calculated a set of thermodynamic parameters for each such monomeric protein, including the wild-type and mutant variants : I597S, E573A, K634E, K651E, and K634E/R636E.
The three monomeric [LGP2] complexes—
,
I597S, and
E573A—are characterized either by a slight reduction in stability parameters (see
Figure 4a or a significant reduction in stability, as observed in the case of
E573A.
The remaining three monomeric complexes— K634E, K651E, and K634E/R636E—show a sharp decline in the values of . This trend of increased instability at the very beginning of the biological complex formation in the monomeric protein stage may indicate that the thermodynamic equilibrium of the monomeric biological system is reached even before interaction with 8dsRNA.
We continued to explore the binding of subsequent molecular subunits (see
Figure 4b,c) to gain deeper insights into the thermodynamic characteristics of the complexes.
Figure 4 shows the calculated results of the stability value
for different types of intermediate reactions:
Figure 4a illustrates changes in the stability of one-dimensional [LGP2] proteins with various substitutions (E573, I597, K634, R636, K634, K651) in the amino acid sequence.
Figure 4b presents the calculated value of
for the [LGP2-RNA] biological formation.
Figure 4c shows the calculated
value for the [LGP2-RNA-LGP2] complex.
Figure 4d provides information on the changes in dissociation energy for the three biological formations [LGP2], [LGP2-RNA], and [LGP2-RNA-LGP2], indicating the direction and numbering of intermediate reactions.
Figure 4e depicts changes in entropy for the studied biological formations: [LGP2], [LGP2-RNA], and [LGP2-RNA-LGP2].
If the first two mutations (I597S and E573A) demonstrate either a slight increase or a significant decrease in the stability of the monomeric protein, the subsequent modifications (K634E, K651E, K634E/R636E) show a sharp “drop” in
, reflecting an increase in stability compared to the wild-type protein.
Figure 4b provides stability information for the molecular complex [LGP2-RNA]. The results shown for the [LGP2-8dsRNA] complex (1:1) follow a similar trend to the changes in
as seen in
Figure 4a. Notably, the increase in stability suggests that the system approaches equilibrium, where the system becomes less active in subsequent reactions. However, to further investigate, we added another mutant protein subunit to the [LGP2-RNA] system. We now analyze
Figure 4c, which corresponds to the [LGP2-8dsRNA-LGP2] biological formation. Normalized combined stability values are shown in
Figure 4f for greater detail:
Figure 4d,e illustrate notable variations in dissociation energy and entropy for biological formations containing K634E, K651E, and K634E/R636E mutations as they progress toward the final [LGP2-RNA-LGP2] biological formation.
In
Figure 4d, we observe a “drop” in dissociation energy values into the negative range for the intermediate [LGP2-RNA] formation (marked with red spheres) containing the K634E, K651E, and K634E/R636E mutations. Adding another mutant subunit shifts the dissociation energy of the system from negative to positive values, as indicated by arrows on the graph.
The comparison between
Figure 4d,e reveals unsynchronized changes in the calculated physical properties of dissociation energy and differential entropy. We summarize the conclusions and results in final tables (see
Table 4,
Table 5 and
Table 6).
In this section, we detail how a study was conducted on the changes in thermodynamic parameters during the assembly of a molecular complex involving two proteins and dsRNA, considering various mutations in the protein. The experimental stoichiometries of the complexes were compared with thermodynamic results at each stage of the formation of the [LGP2-8dsRNA-LGP2] biocomplex.
It was found that mutations in LGP2 could significantly increase the stability of intermediate complexes, such as mutant LGP2 monomers and the [LGP2-8dsRNA] complex (1:1). The mutant monomer (mutLGP2) was shown to be more stable compared to the wild-type protein. Upon binding to dsRNA, the [LGP2-8dsRNA] complex exhibited even higher stability, reflected by lower values of .
The addition of another mutant LGP2 protein to the system would likely lead to significant changes in stability and thermodynamic behavior, reflecting the potential effects of mutations on the formation and equilibrium of the complete [LGP2-8dsRNA-LGP2] complex.
3.1. Determining the Co-Directionality of Changes in Calculated Thermodynamic Parameters When [VP35]2-dsRNA-[VP35]2 Is Formed
Let us proceed to consider the process of forming the next molecular assembly involving four monomeric VP35 proteins and an RNA helix. The VP35 protein, encoded by the highly pathogenic Ebola virus, facilitates immune evasion by antagonizing antiviral signaling pathways, including those initiated by RIG-I-like receptors. Here, we performed calculations using the crystal structure of the Ebola VP35 interferon inhibitory domain (IID) bound to short double-stranded RNA (dsRNA). We performed calculations using the crystal structure of the Zaire ebolavirus VP35 IID bound to eight-base pair (bp) dsRNA.
First, we will examine the experimental data on the causes of changes in the affinity of the molecular complex, as indicated in
Figure 5.
This table (see
Table 5) contains the conclusions of experimental studies of the effect of substitutions of selected amino acid residues in VP35: R312, K339, R305, K319, and K309. The results of the substitutions of these amino acid residues are given both separately and grouped by similar results, such as those for R305A, K309A, and K319A. These mutations change the electrostatic surface of the VP35-RNA interaction.
Let us see how the experimental results and conclusions about the causes of the change in the interaction between VP35 and RNA are combined with the calculated schemes for changing the calculated physical parameters as the final compound [VP35]
2-dsRNA-[VP35]
2 is formed. A table of resulting experimental conclusions on mutations indicates the reasons for the change in interaction and affinity between VP35 and RNA [
13]. The main listed reasons for the change in affinity between protein and RNA are changes in the electrostatic surface of the interaction of protein and RNA, as well as the electrostatic distribution of solvent-accessible surfaces. Most amino acid substitutions do not lead to significant conformational changes.
After summarizing the conclusions and findings from experimental methods, we conducted a theoretical investigation into the stepwise formation of [VP35]
2-dsRNA-[VP35]
2, starting with the molecular assembly [dsRNA-VP35]. To this assembly, monomeric VP35 protein subunits were sequentially added from different orientations, as illustrated in
Figure 6. This figure shows the various forms of intermediate molecular assemblies:
- •
- •
- •
- •
- •
3D structure of [VP35]
1-dsRNA-[VP35]
II—
Figure 6e.
- •
3D structure of [VP35]
1-dsRNA-[VP35]
IV—
Figure 6f.
- •
3D structure of [VP35]
1-dsRNA-[VP35]
III—
Figure 6g.
Let us consider the process of tetramer formation involving four proteins and double-stranded RNA using two calculated parameters:
(see
Figure 7a) and
(see
Figure 7c). The left part of each graph (see
Figure 7a–c) shows the values of the calculated parameters for each of the mutations, R305A, N319A, R312A, R322A, K339A, F239A, and H240A, in the VP35 protein. The mutations were simultaneously introduced one at a time into all four proteins. In the right part,
Figure 7b,d present schemes illustrating the order of tetramer formation, taking into account the values of the selected parameters
and
.
The right side of graph (see
Figure 7b) shows the division of molecular complexes based on
into the following regions: low
, average
, and high
. Each region corresponds to a specific set of biological complexes, each with its own
value. Below is a similar scheme illustrating the distribution based on the change in differential entropy for the same molecular complexes.
Let us consider the initial molecular complex [VP35-dsRNA] when various mutations are introduced into the VP35 protein subunit. As shown in the graph (see
Figure 7b), introducing mutations into the initial complex does not significantly affect the calculated
value, which remains in the mid-to-high range. Similarly, the introduction of mutations into such a molecular complex [VP35-dsRNA], in terms of entropy changes, also does not lead to significant changes in the system’s order, as shown in
Figure 8d.
Significant changes in the calculated parameters begin when a second VP35 protein subunit is added to the RNA helix, forming [VP354-dsRNA-VP351] (blue color) and [VP353-dsRNA-VP351] (red color).
Mutations R322A and H240A, as shown in
Figure 7d, drive the final tetrameric complex to a high calculated
value. A similar trend is observed in
Figure 7b. In this case, these two selected mutations shift the tetramer system toward high entropy changes compared to other molecular complexes. Thus, the calculated physical values
and
for the molecular complex [VP35]
2-dsRNA-[VP35]
2, containing either R322A or H240A, are in the high-value region, as seen in
Figure 7b,d.
The analysis of the formation of the [VP35]2-dsRNA-[VP35]2 complex highlights the importance of calculated thermodynamic parameters, such as and , in understanding the assembly process. The stepwise addition of monomeric VP35 subunits to the RNA helix demonstrates clear trends in these parameters, with values decreasing and values increasing as the system progresses toward the final tetrameric complex.
Mutations, such as R322A and H240A, significantly influence the stability and entropy of intermediate and final complexes. These mutations drive the system to higher and values, indicating a destabilizing effect and a shift toward higher entropy states. Despite these changes, the final product [VP35]2-dsRNA-[VP35]2 consistently satisfies the predefined criteria for the thermodynamic parameters, reinforcing the robustness of the assembly pathway.
Overall, the findings provide a detailed understanding of the thermodynamic landscape of VP35-RNA interactions, including the impact of mutations on stability and entropy changes. These insights contribute to the broader understanding of protein–RNA interactions, with potential implications for therapeutic targeting and molecular design.
3.2. Analysis of Biochemical Pathways
Let us proceed with the analysis of the obtained biochemical pathways.
We consider the co-directionality of changes in the calculated physical parameters from the simplest molecular formation, the [VP35] monomer, to the final product, [VP35]
2-dsRNA-[VP35]
2 (see
Figure 8). We define the conditions for changes in physical parameters during the transition from one molecular complex to the next.
The trend for the calculated : The pathway begins with the highest value and progresses toward the lowest. The trend for the calculated : This parameter has both positive and negative regions. We focus on the positive regions first, as reactions can proceed spontaneously with an increase in entropy. Thus, we select biochemical complexes starting from the smallest positive value to the largest.
We begin with the biochemical pathway for the wild-type VP35, as shown in
Figure 8a. All possible biological complexes are arranged, starting from the monomeric VP35 protein and ending with the final product, [VP35]
2-dsRNA-[VP35]
2. The VP35 monomer corresponds to the highest value of
. The next largest value is
, corresponding to [VP35-dsRNA]. The next smallest value,
, corresponds to [VP35
2-dsRNA-VP35
1]. The subsequent biological complexes [VP35
4-dsRNA-VP35
1] and [VP35
3-dsRNA-VP35
1] are equivalent, with
. Finally, the lowest value
corresponds to the [VP35]
2-dsRNA-[VP35]
2 complex.
Next, we conduct a similar analysis for the assembly of the molecular complex [VP35]
2-dsRNA-[VP35]
2 containing the R305A mutation (see
Figure 8c). In this case, we combine two possible molecular pathways into a single graph based on the calculated data for
and
. The monomeric VP35 protein serves as the starting vertex of the graph as the final product [VP35]
2-dsRNA-[VP35]
2 is formed. Analyzing the scheme in
Figure 8c, we observe that the pathways of molecular assembly diverge at the start but converge at [VP35
3-dsRNA-VP35
1] before forming the final [VP35]
2-dsRNA-[VP35]
2 product.
Figure 8d shows a combined scheme for the assembly of [VP35]
2-dsRNA-[VP35]
2, taking into account the two calculated parameters,
and
. Despite the different pathways to reach the final [VP35]
2-dsRNA-[VP35]
2 product, the final complex satisfies the previously defined selection rules for
and
.
The last two schemes,
Figure 8e,f, focus on the biochemical pathways for assembling the final [VP35]
2-dsRNA-[VP35]
2 product containing unfavorable mutations R312A or R322A. If the maximum entropy change occurs in the final product, the lowest
value corresponds to intermediate complexes: [VP35
3-dsRNA-VP35
1] for both the R312A and R322A mutations.
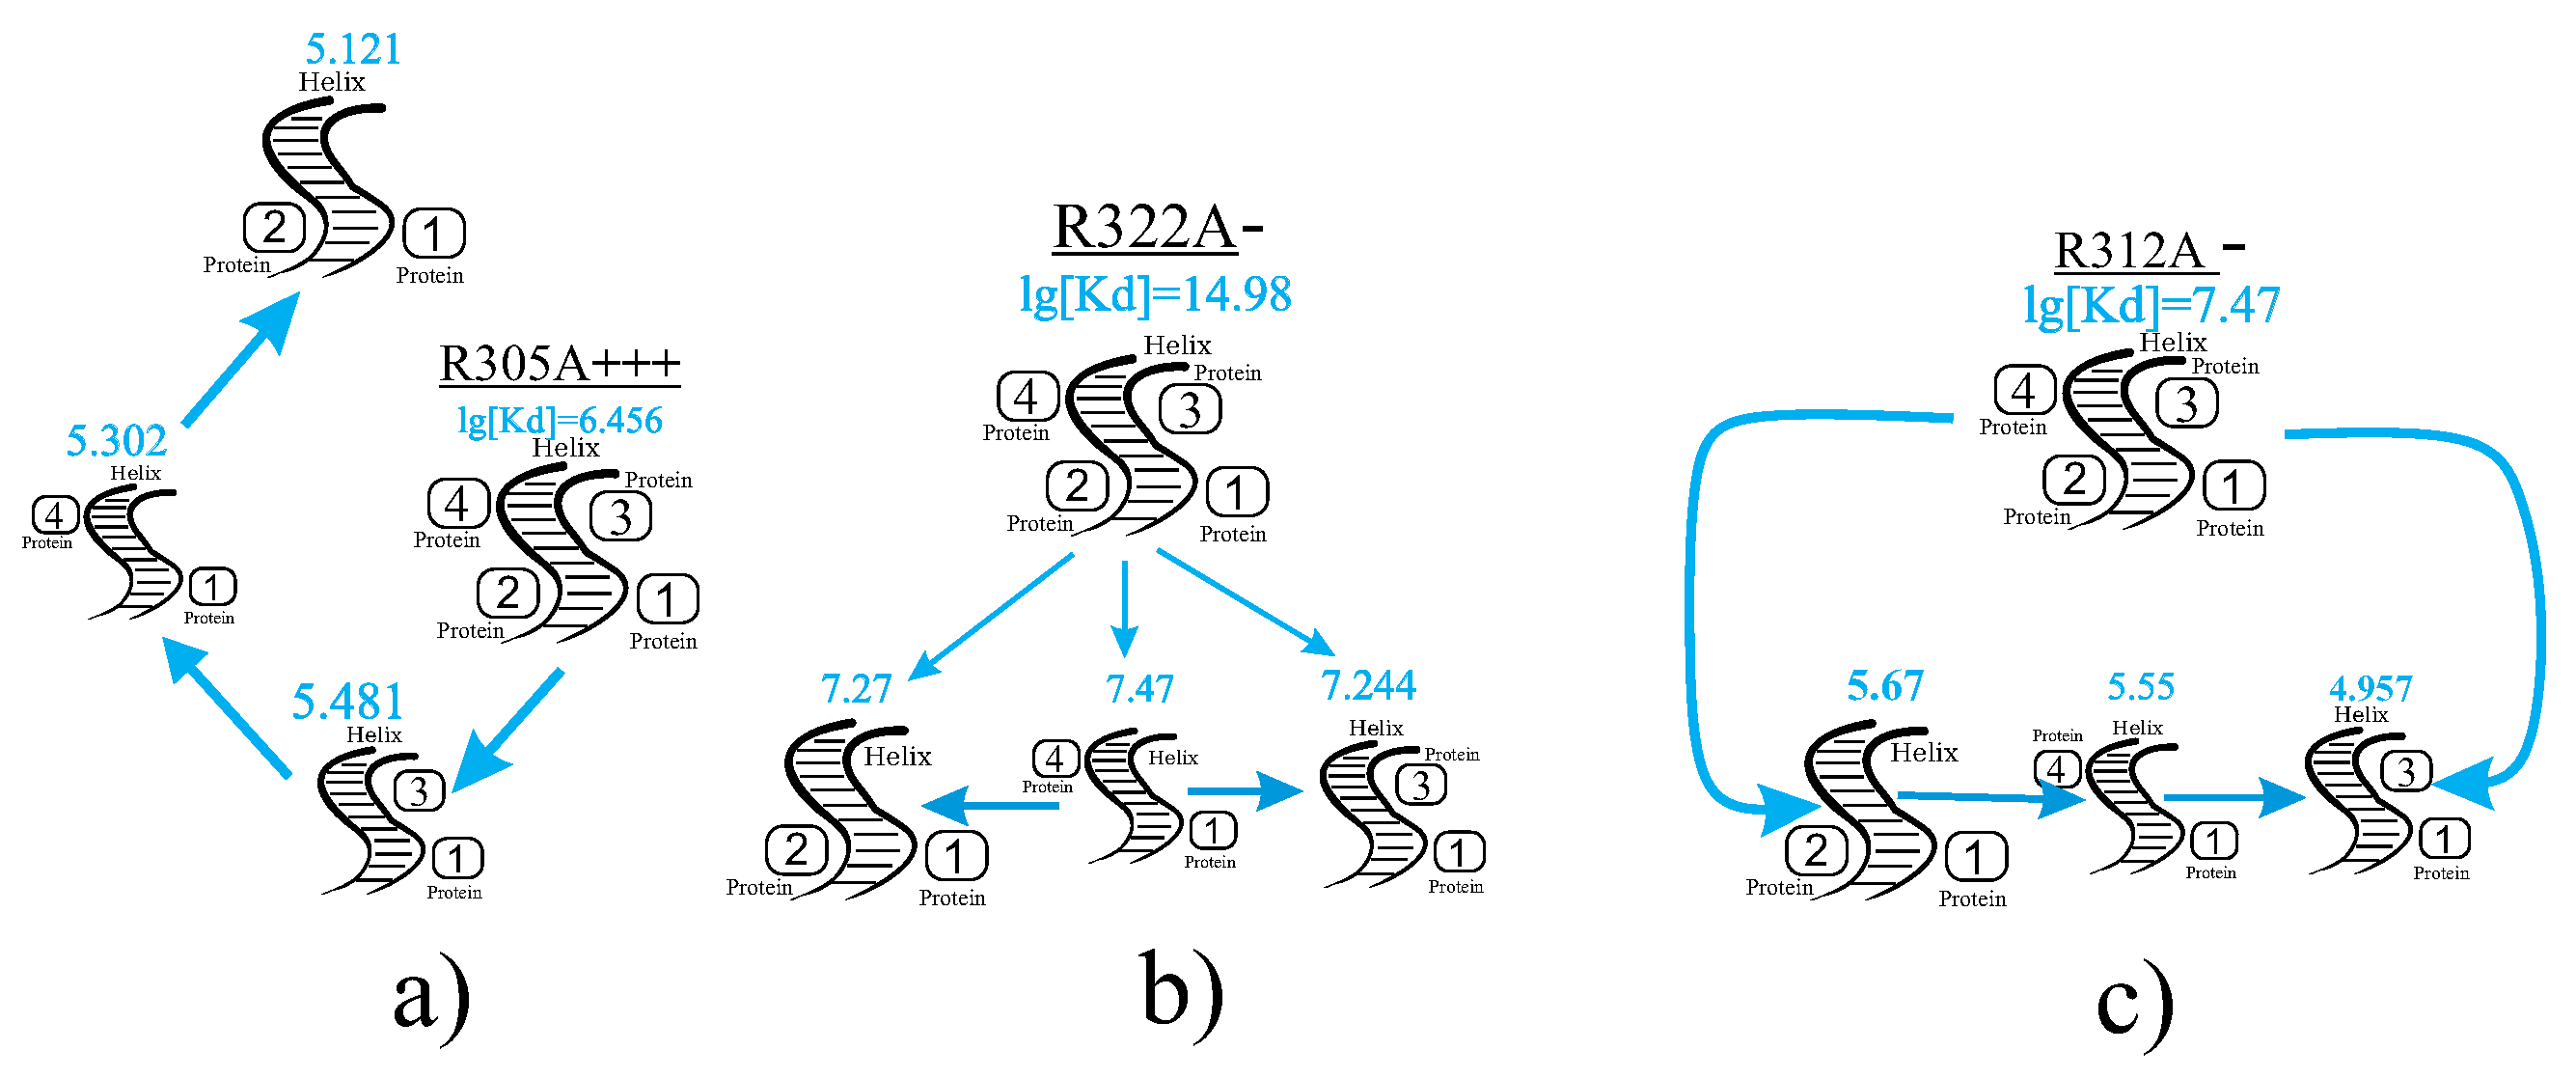
In
Figure 9, three biochemical pathways are presented, each containing a single mutation: R305A
+++, R312A
−, or R322A
−. These pathways are analyzed for one calculated parameter,
. In this case, attention is drawn to the differences in
values between the final [VP35]
2-dsRNA-[VP35]
2 product and intermediate complexes.
- -
The logarithmic difference for the [VP35]
2-dsRNA-[VP35]
2 product containing the R305A
+++ mutation and [VP35
2-dsRNA-VP35
1] is
(see
Figure 9a).
- -
For the [VP35]
2-dsRNA-[VP35]
2 product containing the R312A
− mutation and [VP35
3-dsRNA-VP35
1], the difference is
(see
Figure 9b).
- -
The maximum logarithmic difference occurs for the [VP35]
2-dsRNA-[VP35]
2 product containing the R322A
− mutation and [VP35
3-dsRNA-VP35
1], with
(see
Figure 9c).
The analysis of biochemical pathways for the formation of the [VP35]2-dsRNA-[VP35]2 complex demonstrates the co-directionality of changes in calculated physical parameters such as and . The transition from simpler molecular formations to the final product is characterized by a consistent decrease in values and an increase in positive , reflecting the stabilization and spontaneity of the assembly process.
The wild-type VP35 follows a straightforward pathway, progressing from the monomeric form to the tetrameric complex while maintaining the predefined trends in the thermodynamic parameters. Mutant VP35 pathways, such as those containing R305A, R312A, or R322A mutations, exhibit variations in intermediate complexes, influencing the stability and entropy changes. Notably, mutations like R322A introduce significant differences in , emphasizing the destabilizing effects of such substitutions.
Overall, this study highlights the interplay between entropy and dissociation constants in governing the assembly of VP35 complexes. The results provide valuable insights into the thermodynamic landscape of molecular interactions and the impact of mutations on the formation of stable biological complexes, offering a foundation for further exploration of protein–RNA interactions.
3.3. Definition of Thermodynamic Reactions During Hexamer Formation
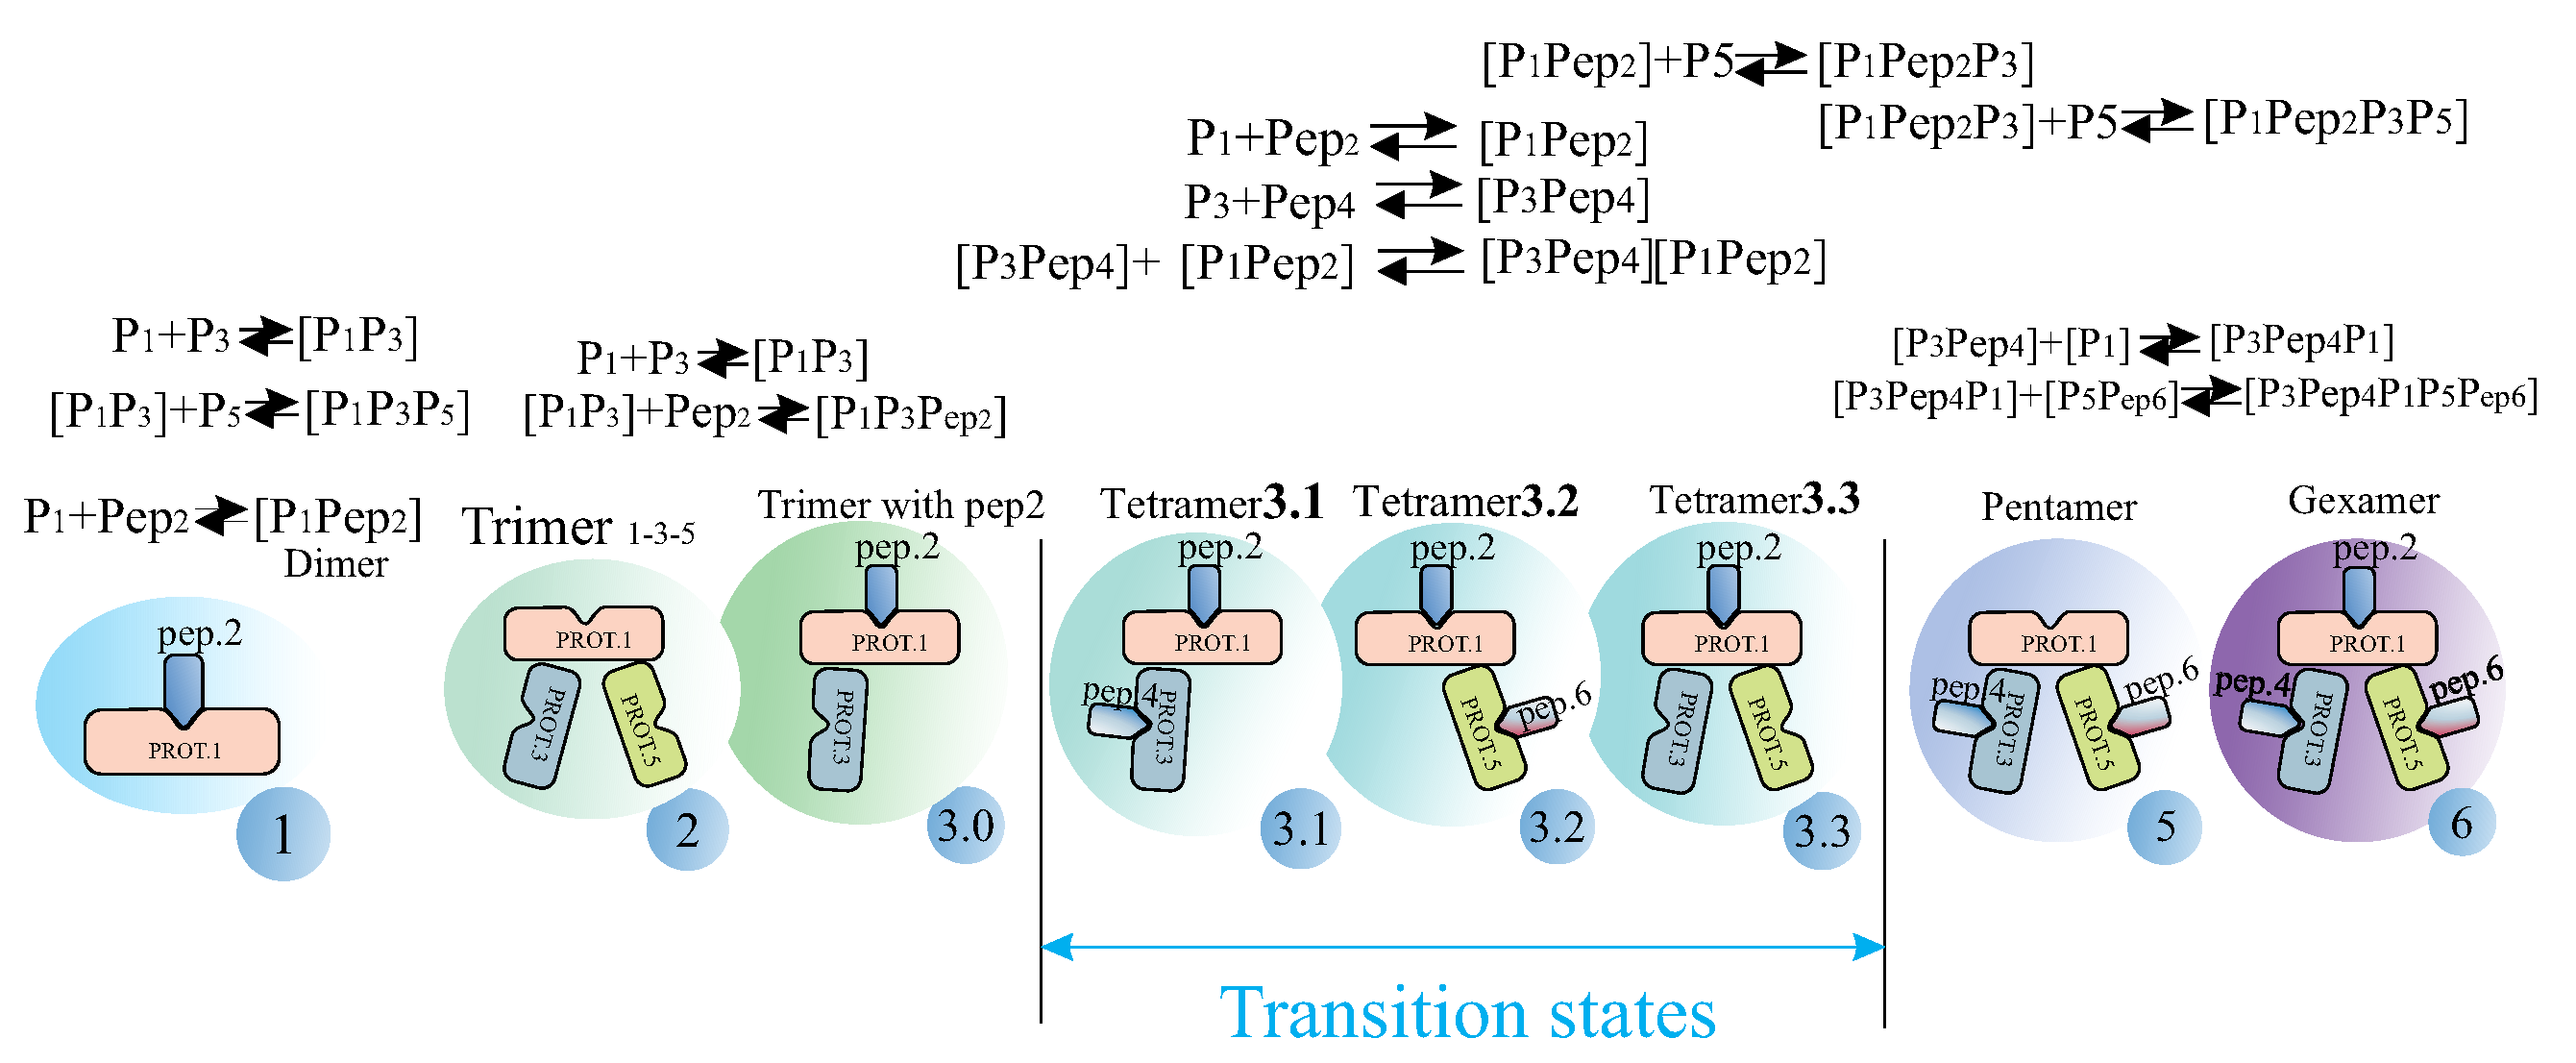
Let us complicate the task and consider a hexamer, which includes three proteins of Marburg virus (MARV), nucleoprotein (NP), and three VP35 peptides, and analyze the nature of the formation of the final hexamer, taking into account the intermediate biological formations. We will refer to the MARV NPcore proteins as Prot1, Prot3, and Prot5 and the VP35 peptides as Pep2, Pep4, and Pep6 (see
Figure 10).
In the article [
13], studies were conducted to measure affinity and determine crystal structure.
To measure the affinity of the VP35 peptide for NPcore, the isothermal titration calorimetry (ITC) assay was used. The results indicated that the VP35 peptide had a strong affinity for binding NPcore, with an equilibrium dissociation constant () of up to .
The structure of the MARV NPcore–VP35 peptide complex reveals that the interactions between NPcore and VP35 peptides are primarily hydrophobic. Most notably, mutations in the hydrophobic amino acids (L14D and M15P) significantly abolish the interaction between MARV NPcore and the VP35 peptide. Considering the high affinity of the VP35 peptide for NPcore, the peptide binds tightly and might stabilize this complex as an integrated component. A summary of ITC binding measurements between VP35 mutation derivatives and MARV NPcore is presented in the graph below.
The diagram shows possible intermediate biochemical formations that we assume the hexamer goes through as it assembles. The following values serve as calculated thermodynamic quantities for studying the order of hexamer assembly: , , , and .
The biochemical pathways for the formation of the wild-type hexamer
are shown in
Figure 11 below, with two calculated values:
and
. For these two physical values, the nature of transitions among all intermediate biological formations are similar, as the assembly progresses from the state with the highest values to the area with the lowest values.
An interesting observation is the result for , which is characterized by the lowest value of , indicating a dead end in terms of stability. However, the second calculated value, , has not yet reached its minimum.
The wild-type hexamer is characterized by the lowest value of .
Let us review some experimental studies on this hexamer formation.
Figure 12a shows the results of a
study for the MARV NPcore–VP35 complex, taking into account the mutations M7P, Q9A, V10D, S11P, E12A, V19D, I21D, V24D, and F25A in the peptide. The PDB structure 5XSQ was used for the calculations.
Note that tetramer 3.3, in some cases, is a dead-end formation containing a barrier, and only by overcoming this is the further formation of the hexamer possible. A similar situation is observed for the initial complex
. Dead-end complexes are designated in the biochemical schemes by a light-green rectangle (see
Figure 13).
The study of hexamer formation involving MARV NPcore proteins and VP35 peptides reveals the significance of thermodynamic parameters, such as and , in understanding the assembly pathway. The analysis demonstrates that the assembly progresses from intermediate states with high stability and affinity values toward a final hexamer complex characterized by lower and values.
Key observations include the identification of dead-end formations, such as the tetramer , which exhibit high values but low stability, posing barriers to hexamer formation. These dead-end states highlight the challenges in transitioning through intermediate formations and emphasize the role of specific protein–peptide interactions in overcoming these barriers.
Mutations in VP35 peptides, such as M7P, V10D, and V24D, significantly impact the stability and assembly dynamics of the hexamer. While some mutations enhance the stability of intermediate complexes, others create destabilizing effects or introduce barriers that hinder the progression to the final hexamer complex.
This study provides critical insights into the thermodynamic landscape of hexamer assembly, emphasizing the interplay between stability and affinity in guiding the formation of complex molecular assemblies. These findings contribute to a deeper understanding of protein–peptide interactions and their role in viral protein assembly, offering potential implications for therapeutic targeting and structural design.
3.4. Detailed Analysis of Hexamer Assembly Pathways
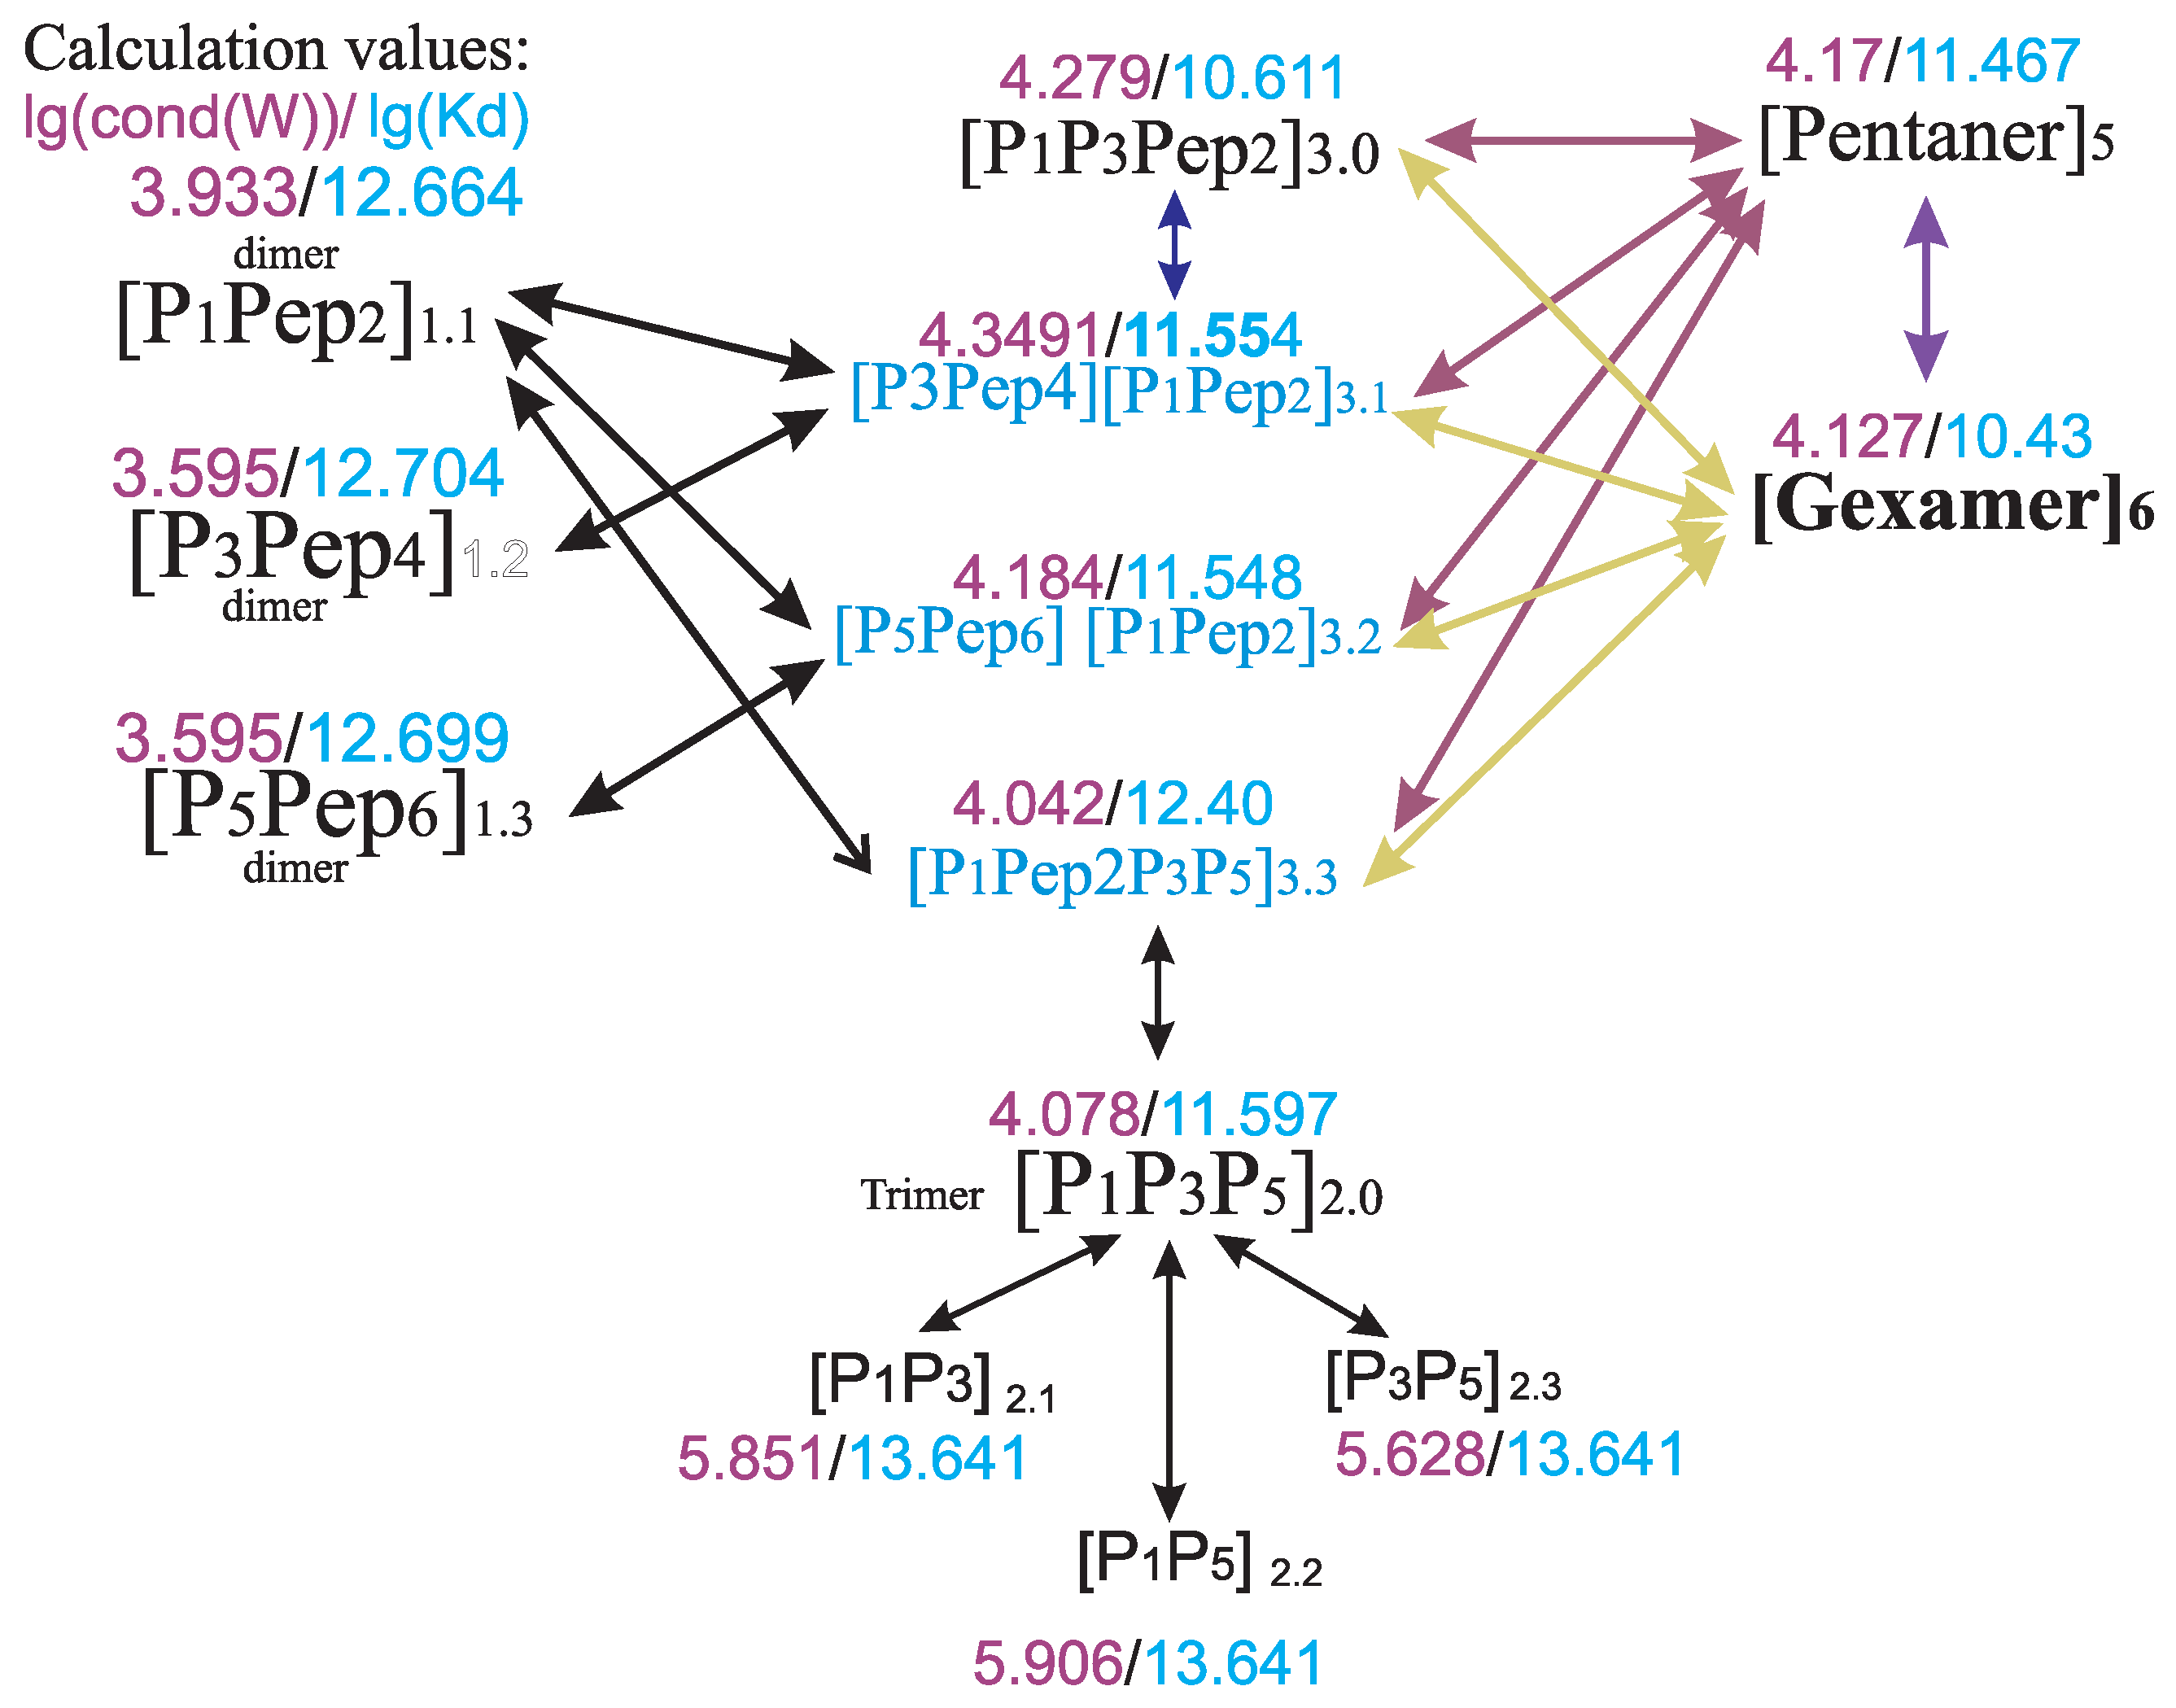
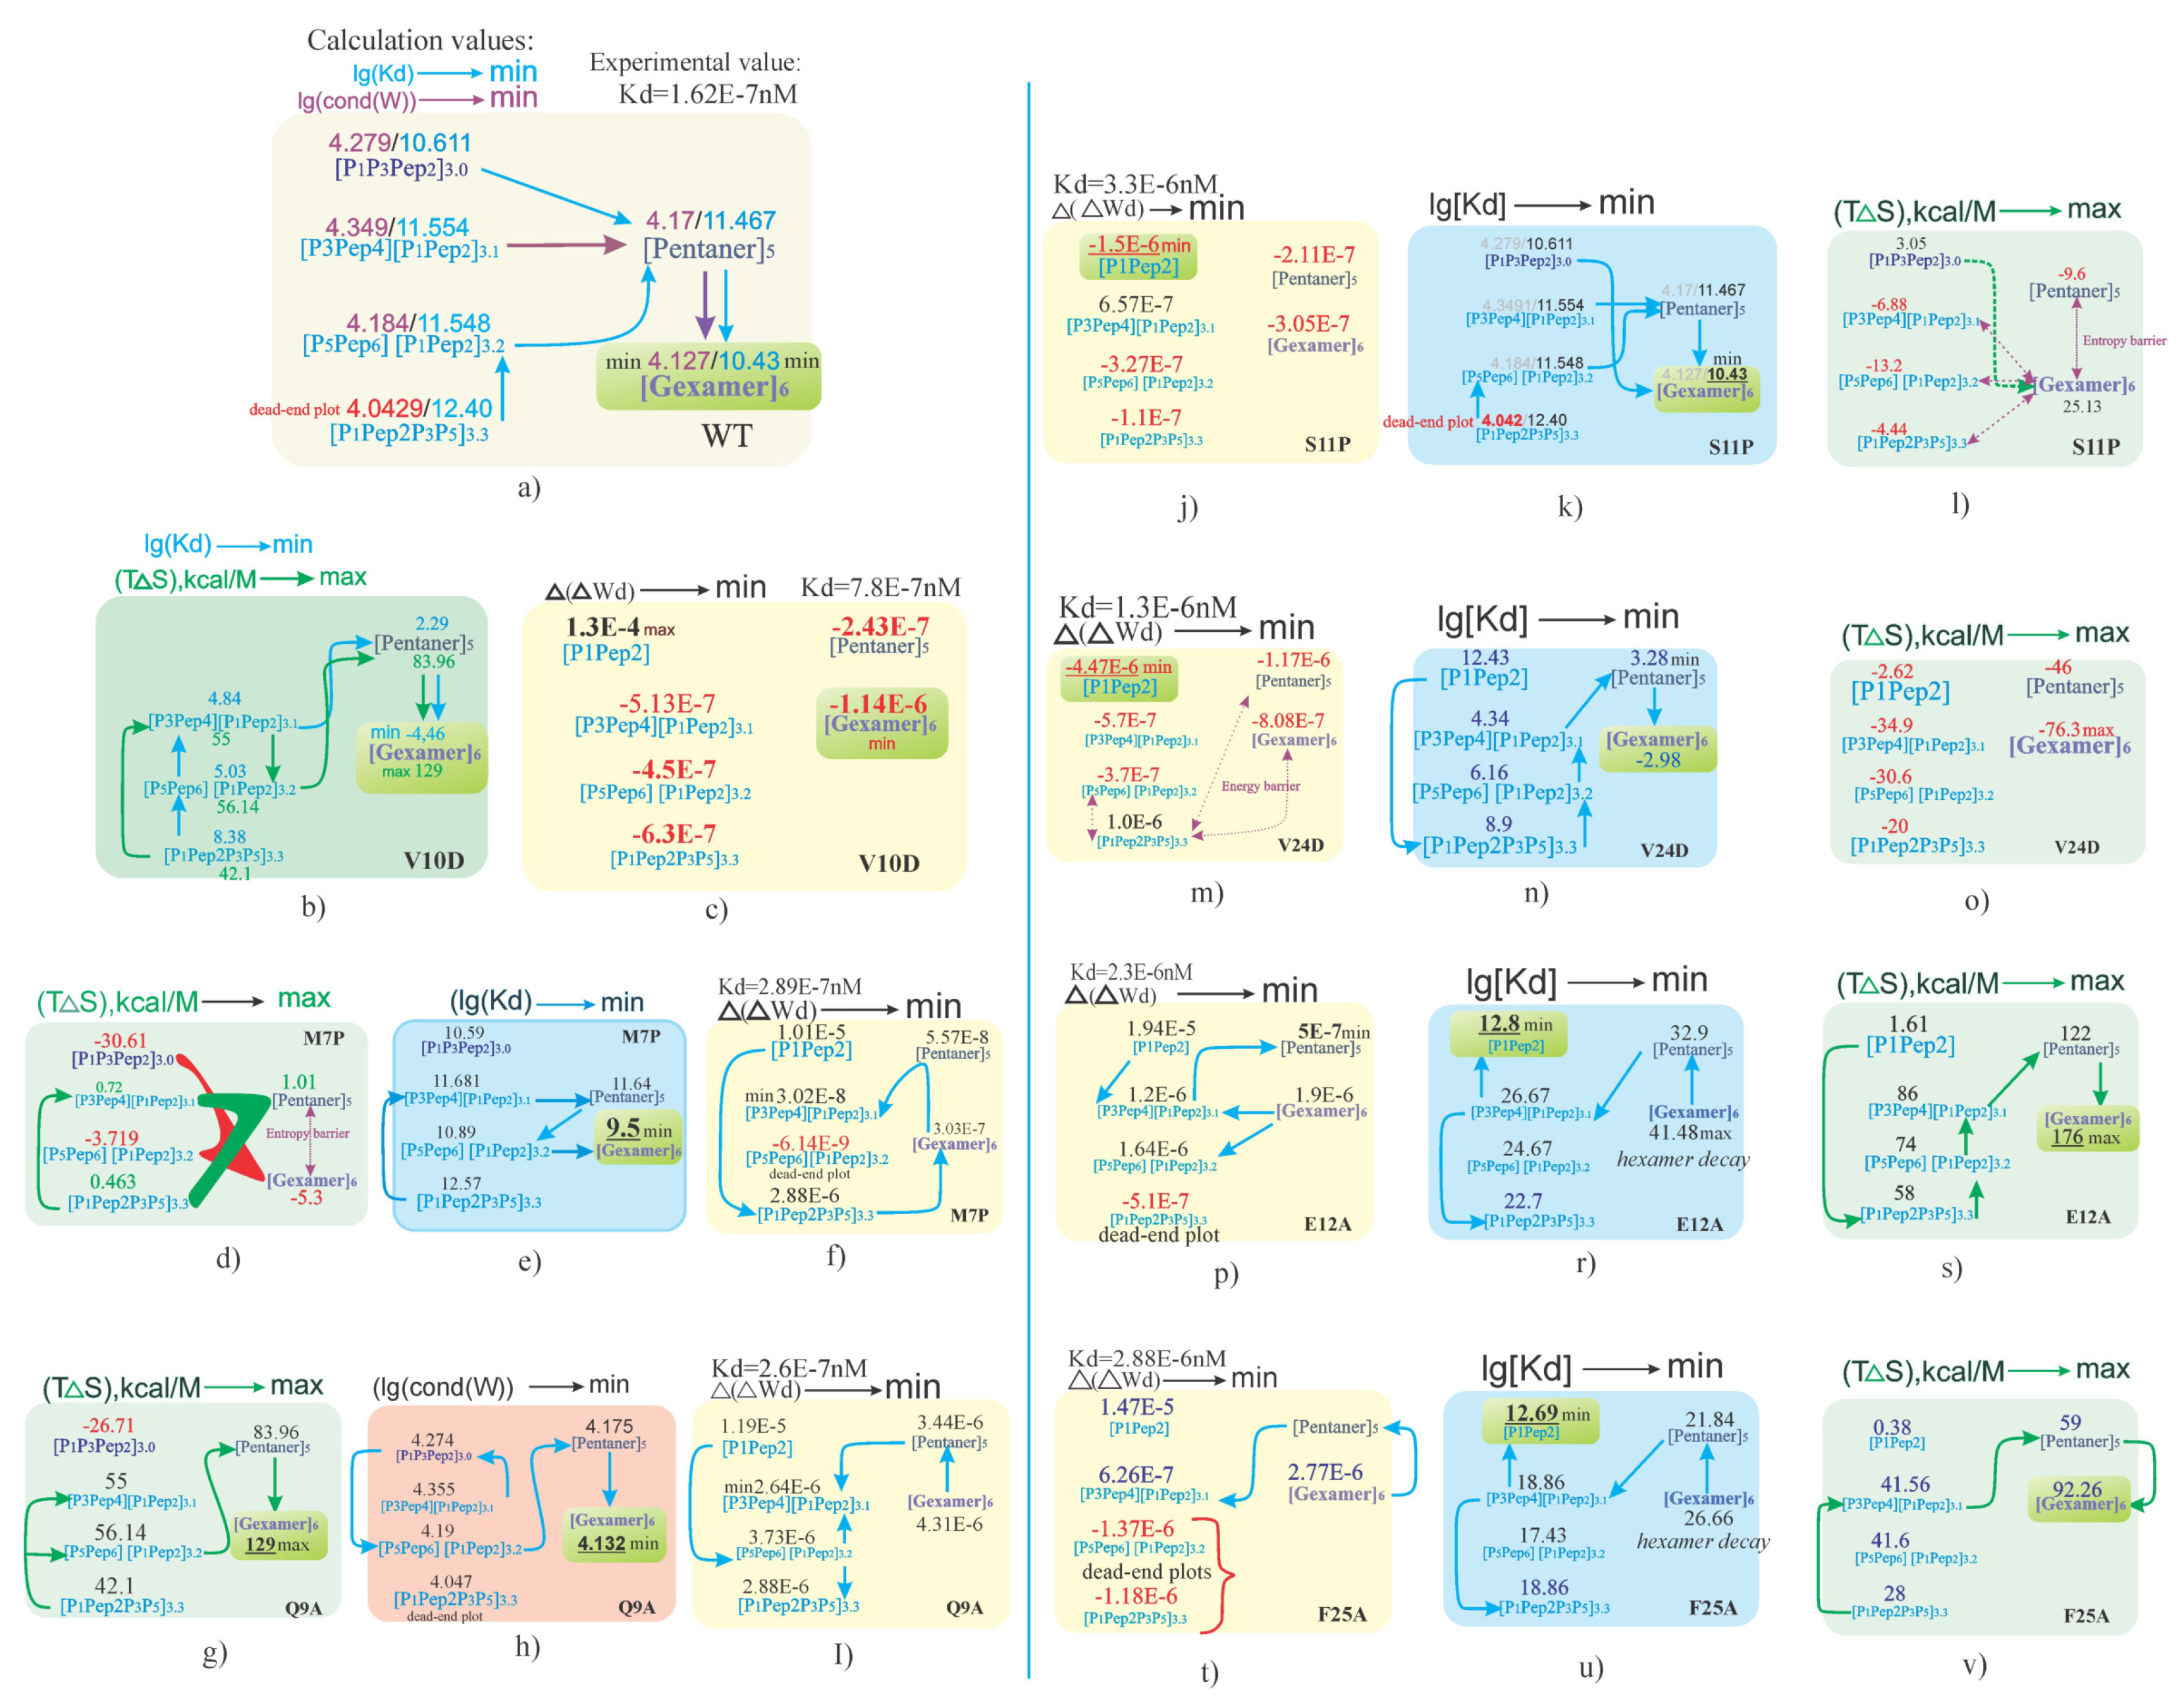
Let us proceed with a detailed examination of each biochemical pathway for hexamer assembly, as shown in the figure below. We will outline the criteria for evaluating biochemical pathways based on various calculated thermodynamic parameters: , , , and .
Biochemical pathways, considering the parameter, are presumed to progress towards increasing values in the positive range. At the same time, the calculated dissociation constant values, , are expected to decrease as the final hexamer complex is achieved. Similarly, should exhibit the same trend, with the lowest values corresponding to the most stable biochemical formations.
The left side of the figure presents (see
Figure 13a–h,I) hexamer assembly pathways where the experimental
values are approximately an order of magnitude smaller than those for hexamers shown on the right side (see
Figure 13j–p,r–v).
In
Figure 13a, the results of biochemical pathways forming the hexamer
are presented, taking into account two calculated parameters:
(blue) and
(dark burgundy). The assembly begins with the highest calculated values, 4.349 and 12.40, and progresses toward the lowest values corresponding to the hexamer complex. The endpoint is marked with a light-green rectangle, indicating
and
.
Additionally, this scheme includes a so-called dead-end value for , marked in red for the formation . However, the value of is the highest.
In the case of the V10D mutation, the results of hexamer formation are shown in
Figure 13b,c. These demonstrate that the final element is a hexamer when considering the calculated values
and
, as shown in
Figure 13b. The minimum value of
is depicted in
Figure 13c.
The detailed analysis of hexamer assembly pathways reveals critical insights into the role of the thermodynamic parameters , , , and in guiding the formation of stable biochemical complexes. This study demonstrates that pathways generally progress from states with high stability and affinity values toward a final hexamer characterized by lower and values.
Key observations include the following:
The identification of dead-end formations, such as , with low but high , highlight potential barriers to further hexamer assembly.
Mutations such as V10D affect the assembly process, with the final hexamer being achieved at calculated values of and , indicating a favorable thermodynamic landscape for formation.
The relationship between the dissociation energy and entropy reveals both stabilizing and destabilizing effects of specific mutations on intermediate and final hexamer formations.
The division of biochemical pathways into those with lower experimental
values (see left side of
Figure 13) and those with higher
values (right side) underscores the variability in thermodynamic profiles caused by different mutations. Dead-end formations in the right pathways suggest that certain mutations hinder the progression to stable hexamer assembly.
This analysis provides a comprehensive understanding of hexamer assembly pathways, highlighting the influence of mutations and thermodynamic properties on stability and formation efficiency. These findings contribute valuable insights into the mechanisms of protein–peptide interactions and offer guidance for designing stable molecular assemblies.
4. Discussion
Let us compare the left part of the biochemical pathways with the right part. The final reaction pathways are highlighted with a light-green rectangle. On the left side of the schemes, we see the predominant number of final light-green rectangles in the area of hexameric formations. The schemes of biochemical pathways on the right contain light-green rectangles at the very beginning [P1Pep2] of the hexamer formation, i.e., the final molecular formations that hinder further progression towards the hexamer.
Let us consider the results of the biochemical pathways for hexamer assembly containing the S11P mutation (see
Figure 13j–l). The conditions for hexamer assembly are satisfied only for the
value, the minimum of which corresponds to the hexamer containing the S11P mutation. Regarding the measure of entropy change, a large number of intermediate links are characterized by negative values. For the formation of the hexamer, the complex mut[P
1P
3Pep
2]S11P must “jump” into the hexameric state mut[P
1Pep
2P
3Pep
4P
5Pep
6]S11P, bypassing states with negative entropy changes where further hexamer assembly could stall.
An even more complex entropy contribution is introduced by the V24D mutation (see
Figure 13m–o). If the calculated
value corresponds to its minimum, the hexamer assembly containing the V24D mutation appears difficult to achieve due to the high degree of order in the hexamer mut[P
1Pep
2P
3Pep
4P
5Pep
6]V24D. Similarly, the hexamer assembly appears challenging from the perspective of the dissociation energy change
, as the final state is represented by the initial complexes mut[P
1Pep
2]V24D and mut[P
1Pep
2]S11P.
Let us consider the contribution of the E12A mutation to hexamer formation (see
Figure 13p,r,s). From the perspective of the calculated parameter, hexamer formation proceeds in the reverse direction, i.e., the hexamer breaks down into simpler complexes, while we observe a positive entropy contribution to hexamer formation.
The contribution of the F25A mutation to hexamer formation is similar (see
Figure 13t–v). Dead-end formations or potential barriers to hexamer formation are marked in red.
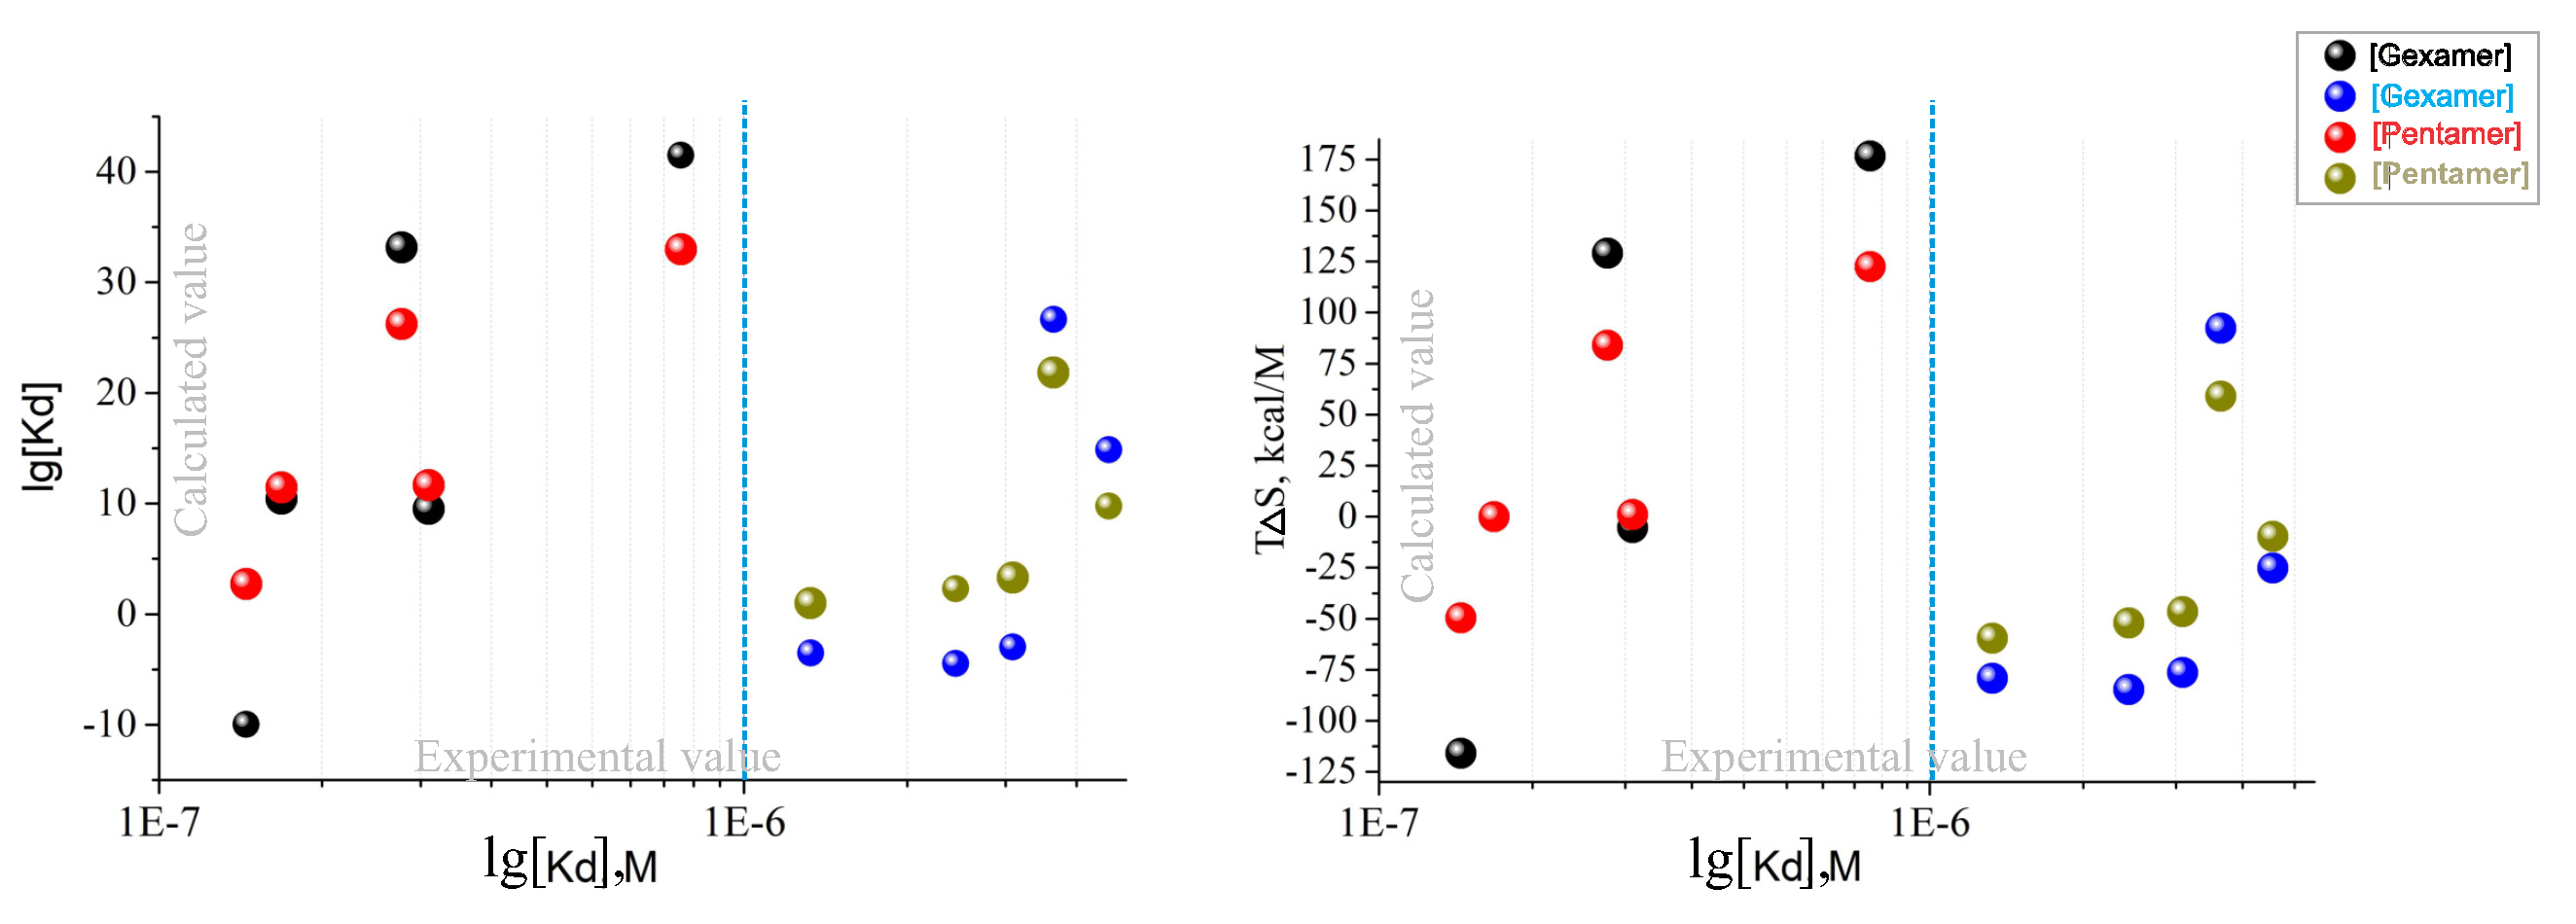
Figure 14 illustrates the relationship between experimental and calculated values for the hexamer
, focusing on the impact of mutations in peptides. The x-axis represents calculated thermodynamic parameters such as
,
, or
, while the y-axis displays corresponding experimental values derived from biochemical assays like ITC. Each data point corresponds to a specific peptide mutation, with trends or deviations highlighting how well theoretical predictions align with experimental observations. Key features include regions indicating dead-end formations or barriers to hexamer assembly, as well as mutations enhancing or weakening hexamer stability. The graph offers critical insights into the accuracy of predictive models for hexamer formation and the unique effects of specific mutations.
The analysis of hexamer assembly pathways reveals distinct patterns in the formation and stability of molecular complexes depending on specific mutations in peptides. On the left side of the pathways, hexameric formations dominate, with most pathways converging on stable final products. In contrast, pathways on the right highlight dead-end formations and barriers, particularly in the early stages of assembly, such as for [P1Pep2].
Specific mutations, such as S11P, V24D, and E12A, introduce unique challenges to hexamer formation. The S11P mutation requires a direct transition to the hexameric state, bypassing intermediates with negative entropy changes. The V24D mutation significantly increases the order of the hexamer, making its formation thermodynamically less favorable. For the E12A mutation, hexamer formation appears to proceed in reverse, breaking down into simpler complexes despite positive entropy contributions.
The relationship between experimental and calculated thermodynamic parameters, as visualized in
Figure 14, highlights critical insights into the interplay of stability, entropy, and dissociation energy during hexamer assembly. Regions of dead-end formations or barriers underscore the complexities of predicting hexamer formation, while the contributions of specific mutations to stability and assembly pathways provide valuable information for further experimental and computational studies.
Affinity Maturation Calculations for Fab Against Ebola Virus Using Single Fab Template
The production of natural monoclonal antibodies (mAbs) for diagnostic purposes is associated with significant time and cost, along with unpredictable quality and selectivity. These challenges were addressed by utilizing a single Fab template, identified through correlation dependencies calculated for a biological complex comprising two antibody branches and an epitope represented by the Ebola (Bundibugyo) protein.
In this study, a pan-specific Fab (MJ20), based on a Herceptin Fab scaffold, was used. This Fab demonstrated the ability to bind selectively and with high affinity to the C-terminal domains of nucleoproteins (NPs).
The spatially studied system included the crystal structure of the complex of MJ20 with the antigen from the Bundibugyo strain of Ebola virus [
14]. Thermodynamic parameters were evaluated using isothermal titration calorimetry, while scanning fluorescence was used to determine the melting temperatures (
).
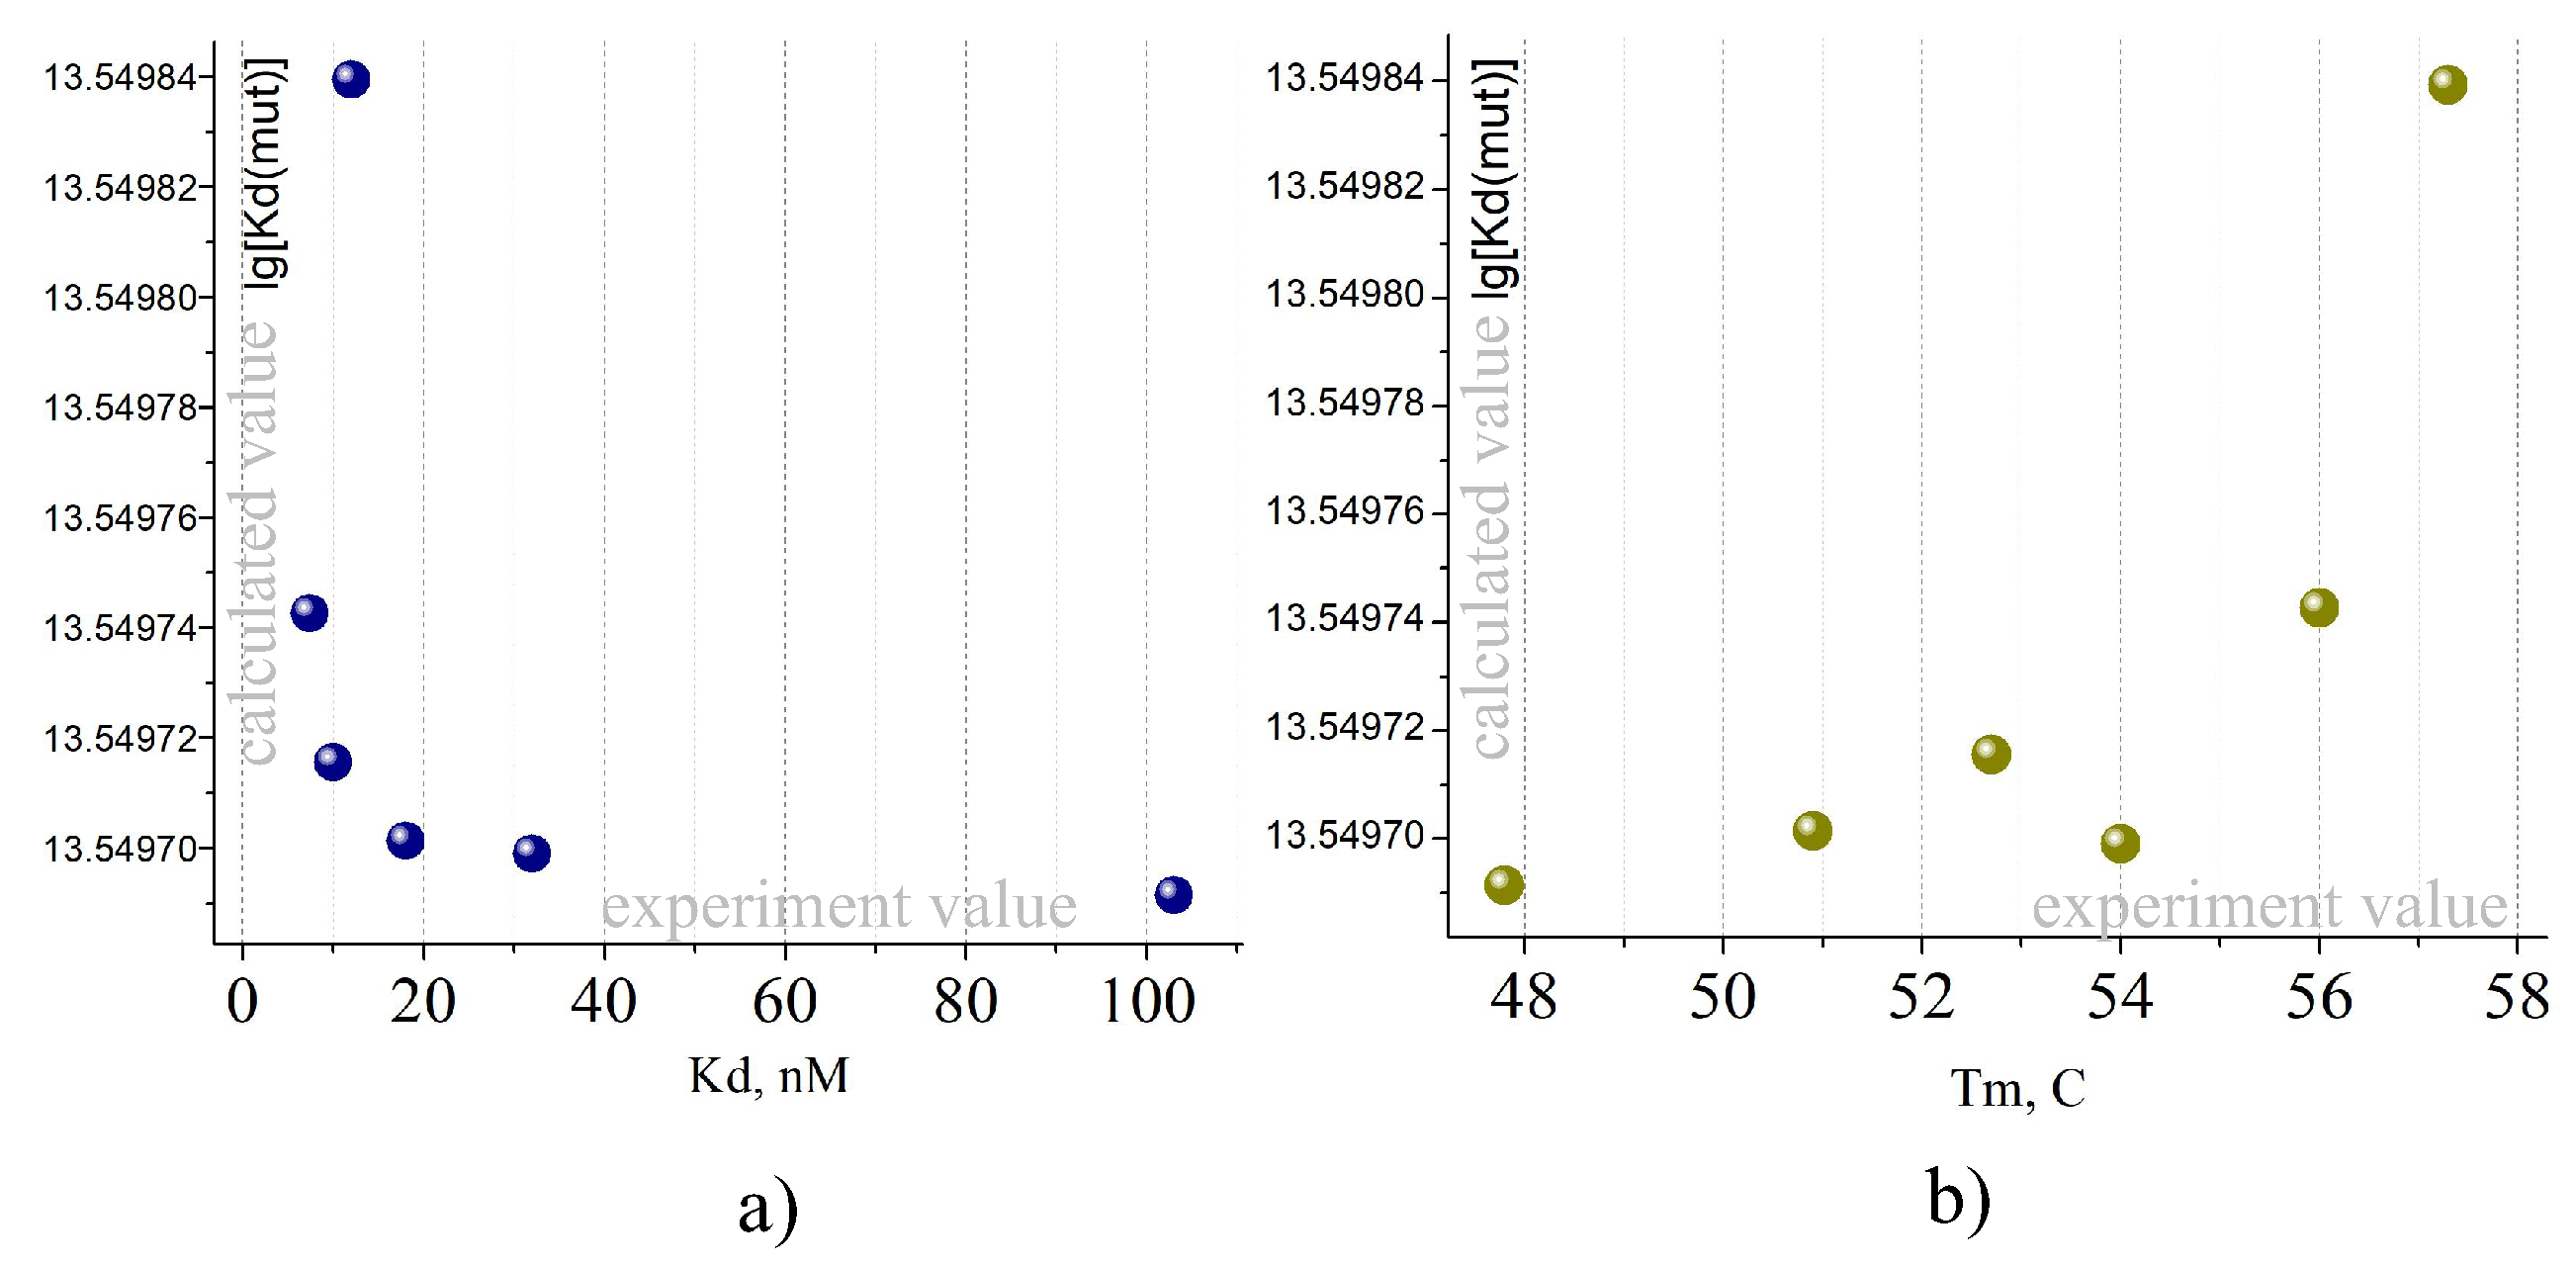
This study presents various types of dependencies that could be used for further affinity maturation (see
Figure 15a) and melting temperatures (see
Figure 15b).
In
Figure 15a, we observe a complex nonlinear inverse relationship between the calculated and experimental
, while a direct correlation is observed between the melting temperature (
) and the calculated
.
Let us consider the complex physical patterns of binding each branch of Fab to the Ebola (Bundibugyo) protein, as the resulting experimental and calculated values exhibit intricate additive relationships, shown in
Figure 16a for the physical parameter
.
Figure 16a presents combined correlation dependencies between calculated and experimental values of
and
for binding of the Ebola (Bundibugyo) protein with Fab (green) and Fab (yellow).
Figure 16b shows the resulting graph for binding involving both Fab subunits. As we can see, there is a direct correlation between the experimental
value and the calculated
, where this resulting dependency incorporates contributions from the binding of each Fab branch to the Ebola (Bundibugyo) protein.
An interesting correlation dependency is presented in
Figure 16d between
and
, both for the individual contributions of each Fab binding to the Ebola (Bundibugyo) protein (see
Figure 16c) and the resulting correlation dependency considering the additive contributions of both Fab subunits binding to the Ebola (Bundibugyo) protein (see
Figure 16d).
Thus, we can observe both the contribution of each Fab branch to interaction with the Ebola (Bundibugyo) protein and the overall effect of amino acid residue substitutions in the complex. In
Figure 16e, a single correlation dependency is shown for the Fab(green)-Ebola (Bundibugyo) protein complex, as the calculated result for the Fab(yellow)-Ebola (Bundibugyo) protein complex was too chaotic, and the graph is not provided. The final graph (see
Figure 16f), presents the resulting dependency between the calculated parameter
.
The set of graphs in
Figure 16 highlights the complex and multifaceted relationships between calculated and experimental parameters for the binding of Fab branches to the Ebola (Bundibugyo) protein. Key insights include the direct correlation between
and
, indicating a consistent thermodynamic trend across different conditions. The additive effects of individual Fab branches demonstrate that while each branch contributes uniquely to binding stability, the overall interaction often depends on the interplay between these contributions.
Notably, the chaotic nature of some interactions, particularly with Fab (yellow), underscores the challenges in predicting certain thermodynamic parameters due to potential structural or dynamic complexities. The dependency between and reflects the energy landscape of binding, revealing both the stabilizing and destabilizing contributions of specific Fab–epitope interactions. These findings provide a valuable framework for understanding the energetics of Fab binding and offer potential pathways for optimizing antibody design and engineering.


