Article

Estimation of the Negative Charge of Phi6 Virus and Its Variations with pH Using the Literature XPS Data

1
Laboratory of Industrial and Surface Engineering, Research Team of “Bioprocesses and Bio Interfaces”, Faculty of Sciences and Techniques, Sultan Moulay Slimane University, BP 523 Beni Mellal, Morocco
2
Laboratory of Microbial Biotechnology and Plant Protection, Faculty of Sciences, Ibn Zohr University, BP 32/S, CP 80000 Agadir, Morocco
3
Remote Sensing Laboratory, Faculty of Sciences and Techniques, Sultan Moulay Slimane University, BP 523 Beni-Mellal, Morocco
*
Author to whom correspondence should be addressed.
Biophysica 2025, 5(1), 8; https://doi.org/10.3390/biophysica5010008
Submission received: 5 January 2025 / Revised: 16 February 2025 / Accepted: 20 February 2025 / Published: 28 February 2025
(This article belongs to the Collection Feature Papers in Biophysics)

Abstract

:
Electrostatic charge significantly influences microorganism–surface interactions, including viral adhesion and transmission. While bacterial surface charges are well characterized using electrophoretic mobility and X-ray photoelectron spectroscopy (XPS), similar studies for viruses are limited. This work bridges the gap by estimating the negative surface charge of the Phi6 bacteriophage using XPS data. A novel approach is applied, combining chemical functionalities derived from XPS with a system of equations to quantify surface polysaccharides, proteins, hydrocarbons, and negatively charged groups (RCOO and R2PO4). The results indicate a predominance of proteins on the viral surface and a pH-dependent negative charge: phosphate groups dominate at low pH (1–3), while both groups contribute equally at pH 4–9. These findings provide a deeper understanding of virus–surface interactions and underscore the importance of pH in modulating viral surface charge. This method, which surpasses traditional electrophoretic mobility techniques, offers new perspectives for studying viral adhesion and developing improved antiviral materials and disinfection strategies.

1. Introduction

Electrostatic charge plays a critical role in virus fate and transport in engineered and natural systems [1]. Viruses, as well as other biocolloids, possess a pH-dependent surface charge in polar media such as water. This electrostatic charge determines the mobility of the soft particle in an electric field and thus governs its colloidal behavior, which plays a major role in virus sorption processes [2]. In addition, understanding the surface charge of viruses is essential for water treatment, such as coagulation [3,4] and disinfection (especially under conditions of virus aggregation) [5], as well as for modeling virus transport in porous media [6]. Moreover, virus–cell interactions are influenced by electrostatic forces, making the surface charge a key parameter in controlling viral outbreaks. Among these, the surface’s electrostatic potential can give valuable information that can help deal with new epidemics [7]. However, despite its importance, the determination of the surface charge of viruses remains challenging. The determination of the negative charge can be deduced from zettameter measurements [8]. However, zettameter analysis is a laborious technique that is not widely available and presents significant difficulties, especially in determining the electrostatic charge of the surface of pathogenic viruses such as SARS-CoV-2. Therefore, alternative and more accessible methodologies are needed. In order to understand the electrostatic interactions between microorganisms and surfaces, extensive research has been conducted by Rouxhet et al., who carried out significant research on fungal and bacterial cells using XPS data in the 1980s and 1990s [9,10,11,12,13,14,15,16,17]. In addition, our previous work has also contributed to this field, focusing on bacterial [18,19,20] and fungal surface analysis. Despite these advances, a gap in knowledge remains regarding the electrostatic properties of viruses, particularly using XPS data.
To our knowledge, estimating the negative charge of viruses was not reported before using the elemental composition of viruses obtained from XPS experiments.
In this study, we seek to explore the effectiveness of methodologies originally developed for bacterial cells in analyzing the surface chemistry of viruses, specifically focusing on their negative charge. By leveraging these methodologies, we seek to provide new insights into virus behavior that could inform both basic research and practical applications, such as improving virus detection and deactivation strategies.
In order to test this estimation, we selected the bacteriophage Phi6, for which elemental composition data were obtained using CryoXPS on the superficial surface of the viruses. This method is known for its sensitivity [18] and sample analysis with a depth of 5–10 nm [19], providing detailed surface chemical information. The Phi6 bacteriophage, an enveloped virus which has a phospholipid bilayer that contains the P9, P10, P13, and P6 membrane proteins, and the receptor-binding protein P3 that forms the outermost layer of the particle [20]. This virus was used in a wide range of biotechnological applications as a valuable surrogate of the SARS-CoV-2 virus [21,22,23,24] and as a surrogate of other highly pathogenic enveloped viruses such as influenza and Ebola [25,26,27]. Given the global shortage of biosafety level 3 (BSL-3) laboratories necessary for working with SARS-CoV-2, Phi6 serves as a critical model for understanding the electrostatic behavior of enveloped viruses. This research could lead to an enhanced mechanistic understanding of virus transmission and inform strategies for mitigating device-related infections and other public health challenges. This brings us to the following objectives for this study: (i) calculate the percentage of the molecular composition of the Phi6 bacteriophage in terms of protein, polysaccharides, and hydrocarbons using the elemental composition obtained from XPS data; (ii) calculate the concentration of the functional groups composing the viral surface (RCOOH and R2PO4H) and the concentration of RCOO and R2PO4 using the results of the molecular composition and the XPS data; and (iii) estimate the negative charge of the Phi6 bacteriophage.

2. Materials and Methods

2.1. Virus Choice and XPS Data

In the present study, we have chosen to use Phi6 bacteriophage to estimate its negative surface charge using elemental and functional group of CryoXPS data obtained from the work of A. Shchukarev et al. [28]. This virus selection is based on several crucial factors. Firstly, we took into account the accessibility of their chemical composition. Which is documented and readily available in the work of A. Shchukarev et al. [28]. Secondly, this availability of detailed data on their composition enables us to carry out accurate and reliable analyses of their surface charge, which is essential for our research objectives. In addition, the bacteriophage Phi6 is of particular interest due to its structural and functional similarities to SARS-CoV-2. As such, it is often used as a surrogate or model to study the physical and chemical properties of RNA viruses, including SARS-CoV-2.
The collection of published XPS data used in the present work is presented in Table 1.

2.2. Surface Molecular Composition

The modeling of the amount of polysaccharides (ps), proteins (pr), and hydrocarbons (HC) on the viral surface is calculated using the XPS chemical element ratios [28] and by following equations based on the three components of the carbon peak [14,16].
[ ( C = O ) / C ] o b s = 0.279 ( C p r / C ) + 0.167 ( C p s / C ) [ ( C ( O , N ) / C ) ] o b s = 0.293 ( C p r / C ) + 0.833 ( C p s / C ) [ ( C ( C , H ) / C ) o b s = 0.428 ( C p r / C ) + 1 ( C H C / C )
The percentage of each compound—proteins (Cpr/C), polysaccharides (Cps/C), and hydrocarbons (CHC/C)—is obtained after solving the systems of equations. These proportions can be converted into weight fractions using the carbon concentration of each model constituent [29] (Table 2).

2.3. The Calculation of RCOOH and R2PO4H Concentration

The literature reports that the carboxyl group, the phosphate group, and the amine group are probably responsible for the cell surface charge [30]. According to P. B. Dengis and P. G. Rouxhet [15], the electrostatic charge is obtained by calculating the concentration of chemical groups (COOH, NH3, and H2PO4) in mol/g. These concentrations are deduced from the molecular composition of the virus surface in mol/g and from the concentration of carbon in proteins, polysaccharides, and hydrocarbons. The electrostatic charge is expressed by the following relationship:
[Charge] (mole/g) = [RNH3+] (mole/g) − [R2PO4] (mole/g) − [RCOO] (mole/g).
In this work, we are especially interested in calculating the negative charge using the following formula:
[Negative charge] (mol/g) = −[R2PO4] (mol/g) − [RCOO] (mol/g).
The phosphate concentration [R2PO4H] and the carboxylic acid concentration [RCOOH] expressed in mole/g are determined using the following relationships [15]:
[R2PO4H] (mole/g) = (P/C) (mole/mole) × [Ct]* (mole/g)
And
[RCOOH] (mole/g) = (COOH/C) (mole/mole) × [Ct]* (mole/g).
where:
  • P/C: The phosphate group ratios obtained from the XPS data of A. Shchukarev et al. [28].
  • COOH/C: The carboxyl group ratios obtained from the XPS data of A. Shchukarev et al. [28].
  • [Ct]: Total carbon concentration in mole/g.
  • * The total carbon concentration in mole/g is previously calculated from the carbon concentrations (mole/g) in proteins, polysaccharides, and hydrocarbons [19] using Table 2.

2.4. Evolution of the Concentration of RCOO and of R2PO4 as a Function of pH

The deprotonation of chemical groups on the cell surface allows the calculation of the electric charge. According to P. B. Dengis and P. G. Rouxhet [15], the concentrations of RCOO and R2PO4 expressed in mol/g under different pH could be deduced from the acid–base equilibrium and from the concentration of chemical functions.
R 2 H P O 4 R 2 P O 4 + H + ;   p K a = 2.15
R C O O H R C O O + H + ;   p K a = 3.95  
Thus, the concentration of electrostatic charge is calculated using the following equation:
[B] = [TC] × 10−pKa/10−pH + 10−pKa
  • [B]: Concentration in mol/g of RCOO or R2PO4.
  • [TC]: Concentration in mol/g of RCOOH or R2PO4H.
  • pKa: Acidity constant of RCOOH/RCOO or R2PO4H/R2PO4.

3. Results

3.1. Surface Molecular Composition

Application of the equation system based on the function derived from carbon peak decomposition, shown in Table 3, indicates that the surface of Phi6 bacteriophage is composed of 46.3% proteins, 30.5% polysaccharides, and 22.1% hydrocarbons.

3.2. The Concentration of Chemical Functions RCOOH and R2PO4H

The concentration of the chemical elements composing the viral surface are presented in Table 4. The concentration of RCOOH was 7.08 × 10⁻⁴ mol/g, while the concentration of R2PO4H was 7.52 × 10⁻⁴ mol/g.

3.3. The Variation in the Concentrations of RCOO, R2PO4, and the Negative Charge with pH

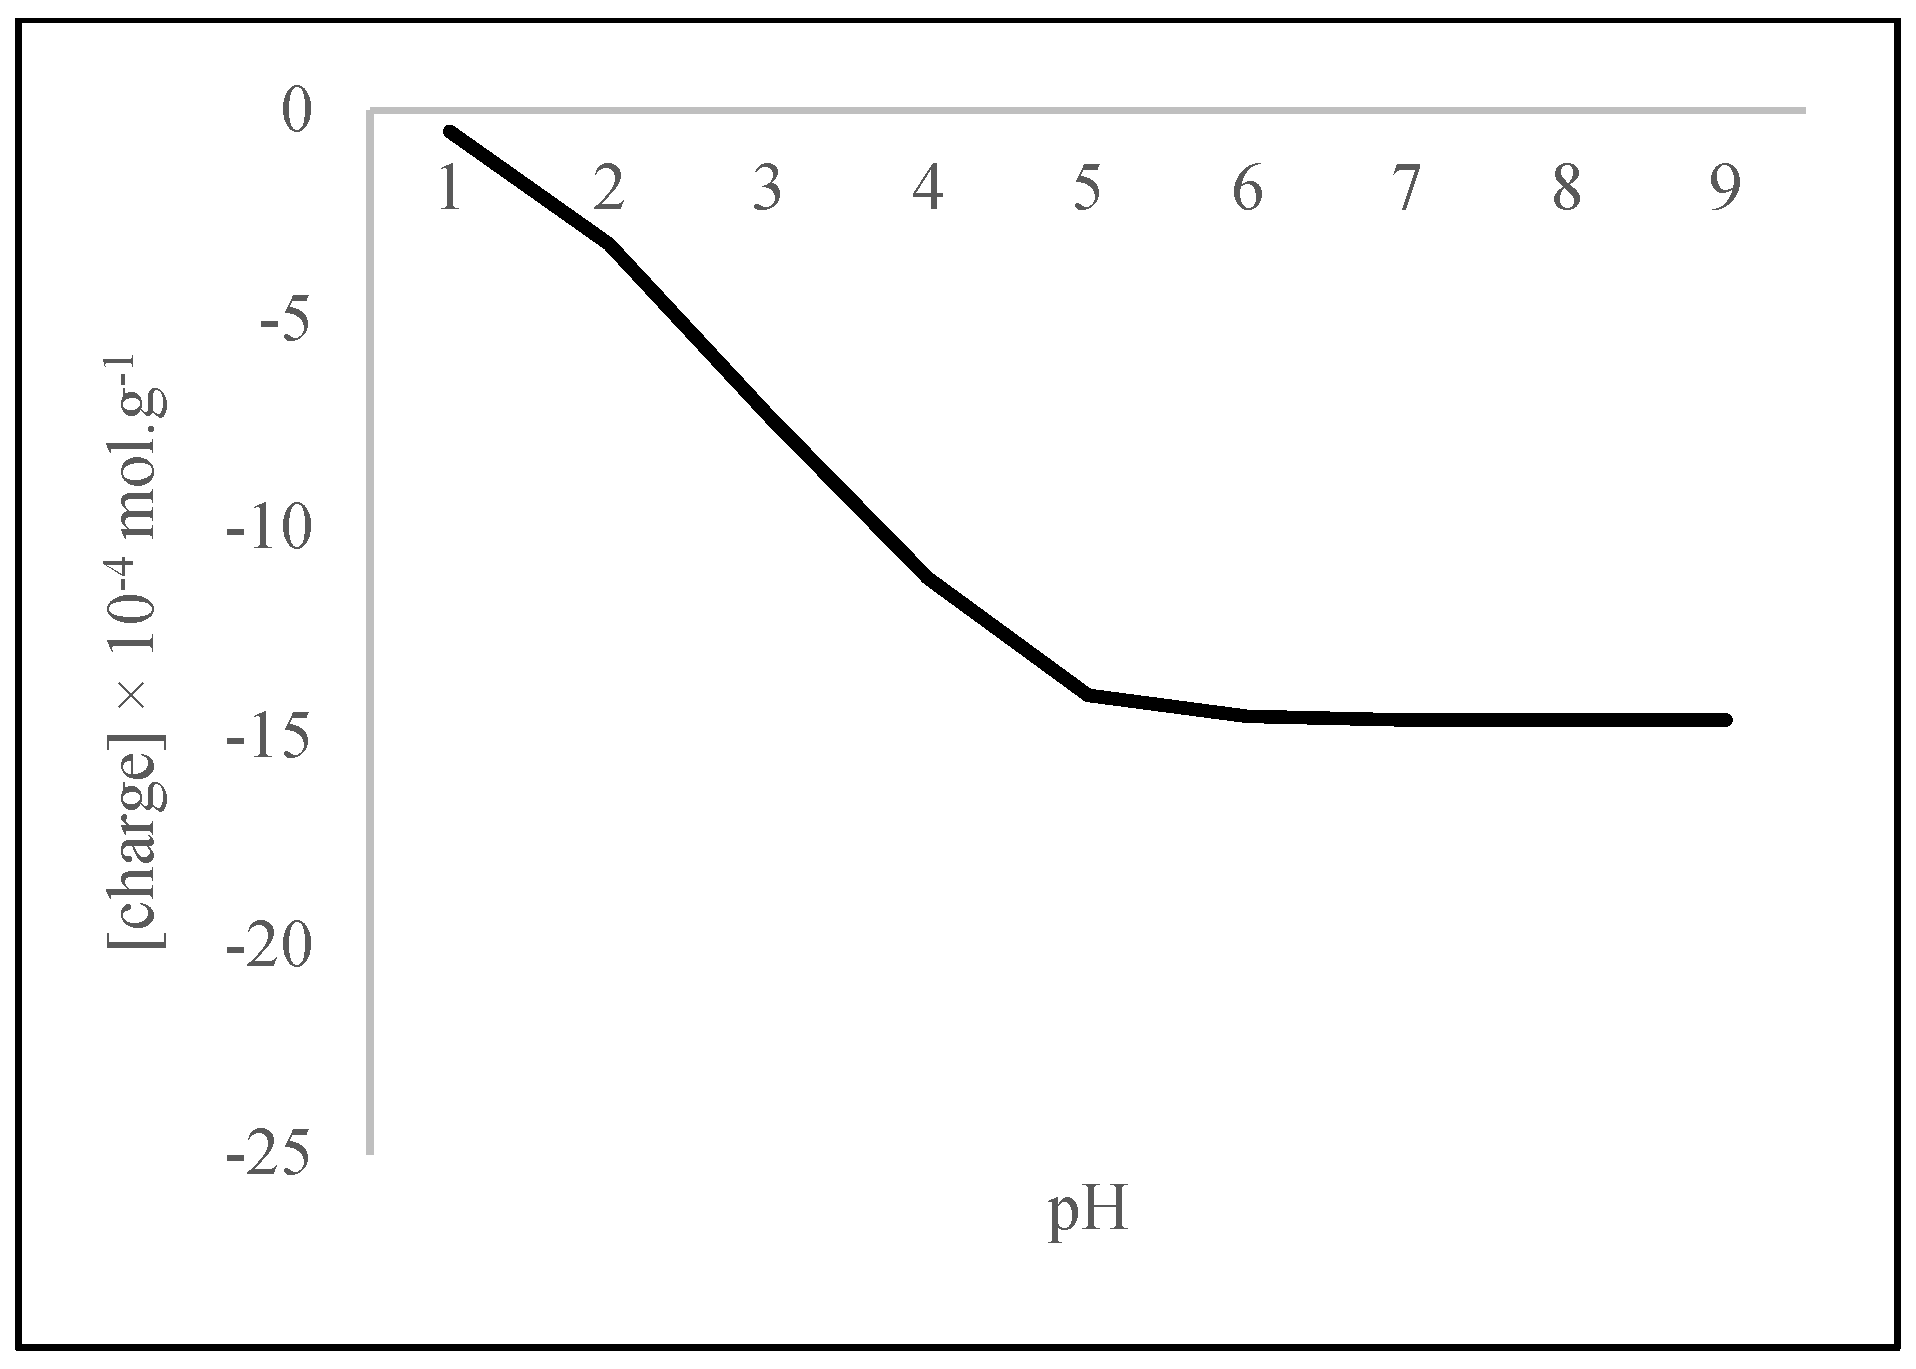
Figure 1 and Figure 2 show the evolution of the RCOO, R2PO4, and negative charge (−[RCOO] − [R2PO4]) as a function of pH for Phi6, respectively. It appears that the carboxylic and phosphate groups, as well as the electrostatic charge, vary as a function of pH. For the RCOO group, it strongly decreases from pH 3 to 6 and remains unchanged from pH 6 to 9 (Figure 1a). The R2PO4 group decreases continuously from pH 1 to 4 and remains unchanged from pH 4 to 9 (Figure 1b). The electrostatic charge decreases continuously from pH 1 to 5 and remains unchanged from pH 5 to 9 (Figure 2).

3.4. Contribution of Carboxyl and Phosphate Groups Phi6 Surface Negative Charges

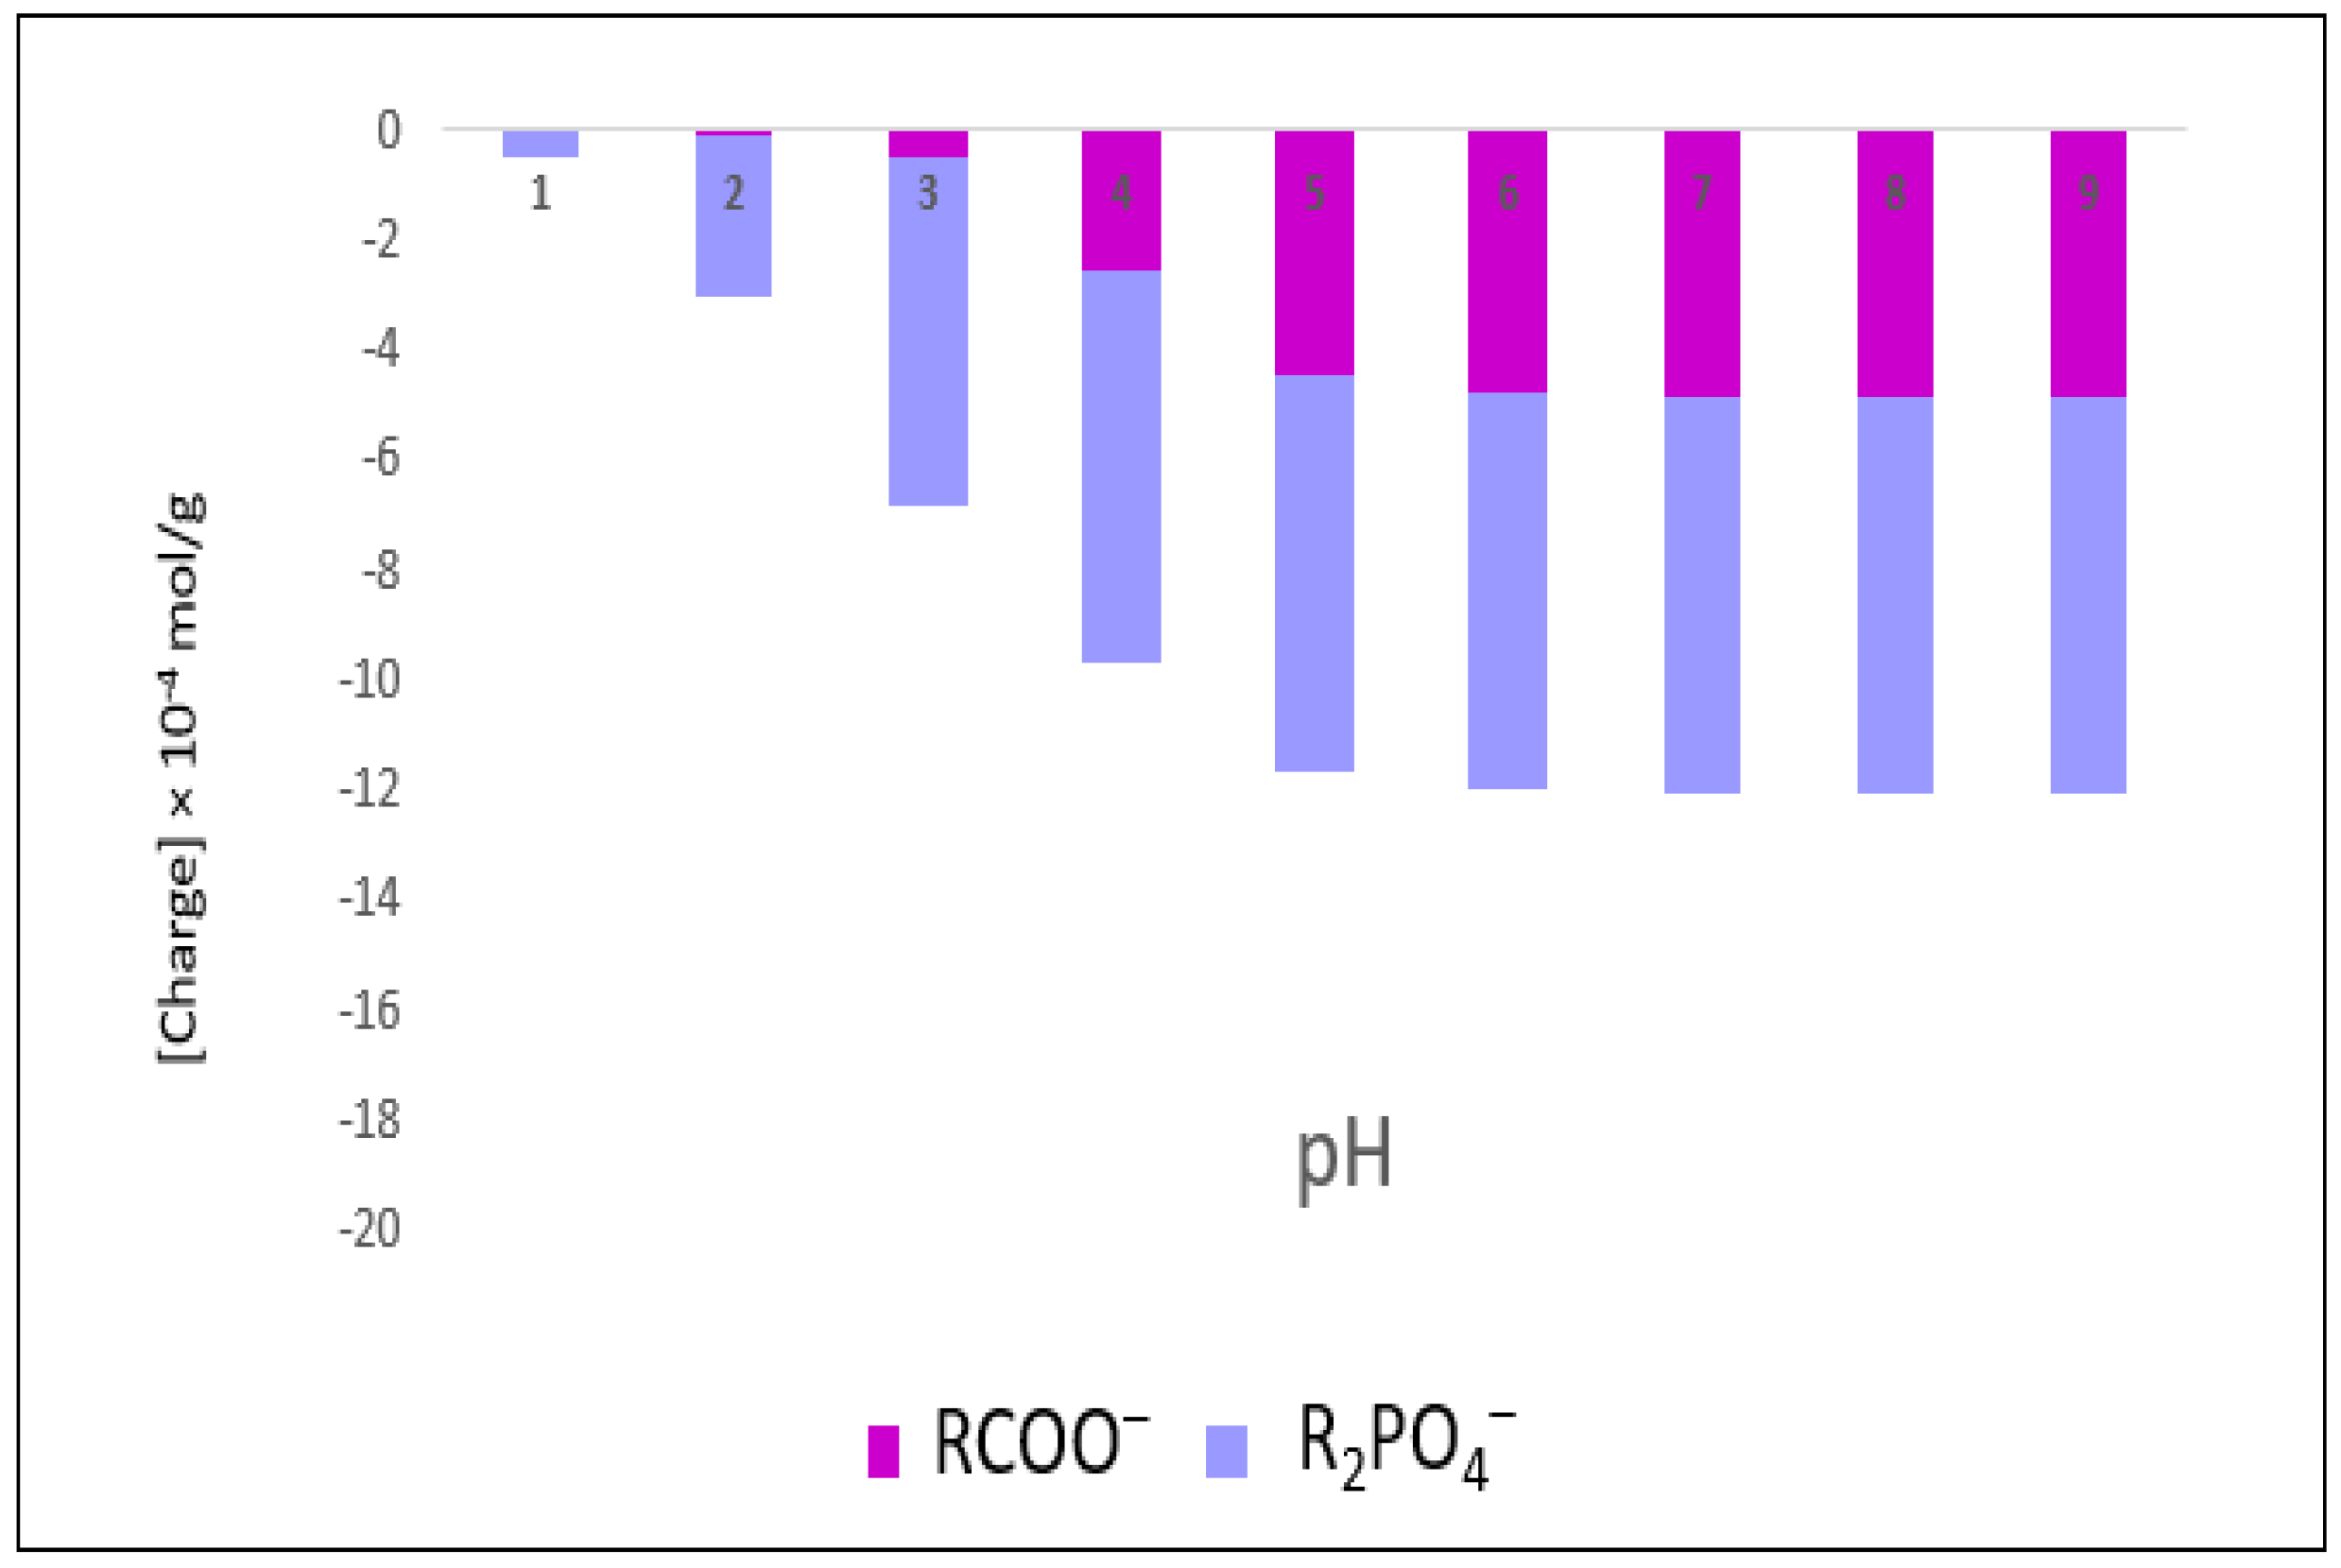
Figure 3 shows that the phosphate group contributes predominantly from pH 1 to 3 more than the carboxylic group in the electrostatic charge. Meanwhile, from pH 4 to 9, both chemical groups seemingly contribute to the electrostatic charge.

4. Discussion

The behavior of viruses, both in the environment and in physical and chemical treatments, depends largely on electrostatic interactions [1]. Electrostatic surface interactions are among the forces associated with virus–surface adhesion [31]. The sign of the charges carried by virus particles is the factor responsible for adhesion capacity. The origin of the surface charge of bacteria and viruses is thought to be linked to the superposition of protonated and non-protonated states of functional groups [2].
In this work, we have chosen to model the negative charge of the Phi6 bacteriophage using a theoretical model, used in our previous work for bacteria [15], but which will be applied for the first time in this study for this virus.
To estimate the electrostatic charge, we began by calculating the molecular composition (proteins, polysaccharides, and hydrocarbons) of the surface of the phi6 bacteriophage by solving a system of equations [16]. The results show that the Phi6 bacteriophage has a protein content that is twice as high as its hydrocarbon content. Indeed, the bacteriophage Phi6 belongs to the group of cytoviridae with an enveloped structure. The inner core of the virus is formed by four proteins, designated P1, P2, P4, and P7, which together form the procapsid and obtain their lipids from the bacterial plasma membrane [32].
Furthermore, according to the results of A. Shchukarev et al. [28], these amounts of polysaccharides and lipids for Phi6 (30.5% and 22.1%, respectively) are linked to the composition of the substance described in the literature: in Phi6, lipids would represent 20% by weight, proteins 70% by weight, and nucleic acids 10% by weight of the particle [32]. Some differences are noted between our results and those of the work of A. Shchukarev et al. [28], in which they used a new model developed for the calculation of this molecular composition (Umeå method).
In addition, although the work of M. Ramstedt et al. [33] suggests that the molecular composition obtained using a multivariate model or the model of P. G. Rouxhet and M. J. Genet [16] could be used side by side for dehydrated samples—but not for frozen samples due to the presence of water—our work employs the equation system (1) of P. Rouxhet et al. [14], in which the functions used to obtain the molecular composition are obtained from the decomposition of the C1S spectrum, without considering those derived from the decomposition of the O1 spectrum. Moreover, the results of the molecular composition of the Phi6 bacteriophage and its elemental compositions obtained from the XPS data made it possible to calculate the concentration of RCOOH and R2PO4H and thus to calculate the negative charge, as mentioned in Equation (3). The results of the negative charge estimation for Phi6 bacteriophage vary as a function of pH. This negative surface charge is reported to be attributed to ionizable amino acids placed on the outer surface of the capsid [31]. Furthermore, according to our results, the negative charge of the Phi6 obtained shows stability at pH values above 5, meaning that the carboxyl and phosphate groups responsible for the negative charge remain deprotonated and have not undergone any significant modifications that would alter their charge. This characteristic could enable phages to maintain their efficacy and viability in a variety of environments.
On the other hand, our results reveal that the phosphate group contributes predominantly to the negative charge between pH 1 and 3 (Figure 3). However, both the phosphate and carboxyl groups contribute to the negative charge between pH 4 and 9 (Figure 3). The variation in the contribution of each grouping as a function of pH show that this contribution to the surface charge is pH-dependent. These results are in line with those obtained by F. Hamadi et al. [34] for E.coli strains at pH 3 and 7. Indeed, modeling of the electrostatic charge of E. coli strains showed that, at pH 3, the contribution of the carboxylate groups involved in its negative charge was almost negligible compared to the concentration of deprotonated phosphate groups [34]. This pH is linked to the pka of the carboxyl and carboxylate group (3.5), which shows its onset of deprotonation after this pH. At pH 7, far from the pka of the two groups, the two groups were largely deprotonated and both participated in the negative charge of the virus [34]. Thus, the influence of acidic pH on the groups involved in negative charge is similar to the results of D. Amory et al. (10), H. C. Van Der Mei and H. J. Busscher [30]. In addition, the work of H. Latrache et al. [35] reveals that the phosphate group is the main, if not the only, source of negative surface charge. This phenomenon is due to the protonation of cell surface compounds which govern environmental processes [36]. Based on the results obtained in the present work, we agree that the surface charge of viruses could be influenced by protonated or deprotonated functional groups [37].
The use of XPS data to determine the elemental composition of the Phi6 virus, combined with our approach toward charge calculation, offers a new perspective on the physicochemical analysis of virus particles.

5. Conclusions

Our work presents the first attempt to model the negative charge of the phi6 bacteriophage using a theoretical model and the XPS data. The results obtained herein show that the percentage of proteins is higher than that of hydrocarbons and polysaccharides. This finding not only enhances our understanding of the surface chemistry of this virus, but also highlights the importance of protein-mediated interactions in viral adhesion, which could have significant implications for controlling virus spread in both clinical and environmental settings.
Moreover, the pH-dependent nature of the surface charge offers new insights into how environmental conditions can influence virus–surface interactions, potentially informing the development of more effective disinfection strategies. By providing a novel approach to estimating viral surface charge, this study establishes a foundation for future research on the electrostatic properties of other viruses, which could lead to innovative methods for preventing virus transmission and enhancing public health protection.

Author Contributions

All authors contributed to the study’s conception and design. I.H.C.: writing—original draft preparation, validation, data curation-methodology-investigation-formal analysis; H.L. and C.Z.: supervision-methodology-validation; M.E.L., H.Z. and T.H.: supervision-investigation-validation; F.H. and A.E.G.: supervision—validation-visualization. All authors have read and agreed to the published version of the manuscript.

Funding

This research received no external funding.

Data Availability Statement

All data analyzed during this study are included in this article.

Acknowledgments

The authors gratefully acknowledge everyone who participated in the realization of this work and the national center of research and technology of Morocco (CNRST) for the scholarship.

Conflicts of Interest

The authors declare no conflicts of interest.

References

  1. Heffron, J.; Mayer, B.K. Virus isoelectric point estimation: Theories and methods. Appl. Environ. Microbiol. 2021, 87, e02319-20. [Google Scholar] [CrossRef] [PubMed]
  2. Michen, B.; Graule, T. Isoelectric points of viruses. J. Appl. Microbiol. 2010, 109, 388–397. [Google Scholar] [CrossRef]
  3. Heffron, J.; Mayer, B.K. Emerging investigators series: Virus mitigation by coagulation: Recent discoveries and future directions. Environ. Sci. Water Res. Technol. 2016, 2, 443–459. [Google Scholar] [CrossRef]
  4. Heffron, J.; McDermid, B.; Maher, E.; McNamara, P.J.; Mayer, B.K. Mechanisms of virus mitigation and suitability of bacteriophages as surrogates in drinking water treatment by iron electrocoagulation. Water Res. 2019, 163, 114877. [Google Scholar] [CrossRef] [PubMed]
  5. Mattle, M.J.; Crouzy, B.; Brennecke, M.; Wigginton, K.R.; Perona, P.; Kohn, T. Impact of virus aggregation on inactivation by peracetic acid and implications for other disinfectants. Environ. Sci. Technol. 2011, 45, 7710–7717. [Google Scholar] [CrossRef] [PubMed]
  6. Dika, C.; Duval, J.F.L.; Francius, G.; Perrin, A.; Gantzer, C. Isoelectric point is an inadequate descriptor of MS2, Phi X 174 and PRD1 phages adhesion on abiotic surfaces. J. Colloid Interface Sci. 2015, 446, 327–334. [Google Scholar] [CrossRef]
  7. Fantini, J.; Azzaz, F.; Chahinian, H.; Yahi, N. Electrostatic surface potential as a key parameter in virus transmission and evolution: How to manage future virus pandemics in the post-COVID-19 era. Viruses 2023, 15, 284. [Google Scholar] [CrossRef]
  8. Rajagopalan, R.; Hiemenz, P.C. Principles of Colloid and Surface Chemistry; Marcel Dekker: New York, NY, USA, 1997; Volume 8247, p. 8. [Google Scholar]
  9. Rouxhet, P.; Misselyn-Bauduin, A.; Ahimou, F.; Genet, M.; Adriaensen, Y.; Desille, T.; Bodson, P.; Deroanne, C. XPS analysis of food products: Toward chemical functions and molecular compounds. Surf. Interface Anal. 2008, 40, 718–724. [Google Scholar] [CrossRef]
  10. Amory, D.; Mozes, N.; Hermesse, M.; Leonard, A.; Rouxhet, P. Chemical analysis of the surface of microorganisms by X-ray photoelectron spectroscopy. FEMS Microbiol. Lett. 1988, 49, 107–110. [Google Scholar] [CrossRef]
  11. Mozes, N.; Léonard, A.; Rouxhet, P.G. On the relations between the elemental surface composition of yeasts and bacteria and their charge and hydrophobicity. Biochim. Biophys. Acta BBA Biomembr. 1988, 945, 324–334. [Google Scholar] [CrossRef] [PubMed]
  12. Mozes, N.; Amory, D.E.; Léonard, A.J.; Rouxcet, P.G. Surface properties of microbial cells and their role in adhesion and flocculation. Colloids Surf. 1989, 42, 313–329. [Google Scholar] [CrossRef]
  13. Mozes, N. Microbial Cell Surface Analysis; VCH Publishers: Hoboken, NJ, USA, 1991. [Google Scholar]
  14. Rouxhet, P.; Mozes, N.; Dengis, P.; Dufrêne, Y.; Gerin, P.A.; Genet, M. Application of X-ray photoelectron spectroscopy to microorganisms. Colloids Surf. B Biointerfaces 1994, 2, 347–369. [Google Scholar] [CrossRef]
  15. Dengis, P.B.; Rouxhet, P.G. Surface Properties of Top- and Bottom-Fermenting Yeast. Yeast 1997, 13, 931–943. [Google Scholar] [CrossRef]
  16. Rouxhet, P.G.; Genet, M.J. XPS analysis of bio-organic systems. Surf. Interface Anal. 2011, 43, 1453–1470. [Google Scholar] [CrossRef]
  17. van Haecht, J.L.; Defosse, C.; van den Bogaert, B.; Rouxhet, P.G. Surface properties of yeast cells: Chemical composition By XPS and isoelectric point. Colloids Surf. 1982, 4, 343–358. [Google Scholar] [CrossRef]
  18. Genet, M.J.; Dupont-Gillain, C.C.; Rouxhet, P.G. XPS analysis of biosystems and biomaterials. In Medical Applications of Colloids; Springer: New York, NY, USA, 2008; p. 177. [Google Scholar]
  19. Gerin, P.A.; Dufrene, Y.; Bellon-Fontaine, M.N.; Asther, M.; Rouxhet, P.G. Surface properties of the conidiospores of Phanerochaete chrysosporium and their relevance to pellet formation. J. Bacteriol. 1993, 175, 5135–5144. [Google Scholar] [CrossRef]
  20. Laurinavičius, S.; Käkelä, R.; Bamford, D.H.; Somerharju, P. The origin of phospholipids of the enveloped bacteriophage phi6. Virology 2004, 326, 182–190. [Google Scholar] [CrossRef]
  21. Fedorenko, A.; Grinberg, M.; Orevi, T.; Kashtan, N. Survival of the enveloped bacteriophage Phi6 (a surrogate for SARS-CoV-2) in evaporated saliva microdroplets deposited on glass surfaces. Sci. Rep. 2020, 10, 22419. [Google Scholar] [CrossRef] [PubMed]
  22. Dey, R.; Dlusskaya, E.; Ashbolt, N.J. SARS-CoV-2 surrogate (Phi6) environmental persistence within free-living amoebae. J. Water Health 2022, 20, 83–91. [Google Scholar] [CrossRef] [PubMed]
  23. String, G.M.; White, M.R.; Gute, D.M.; Mühlberger, E.; Lantagne, D.S. Selection of a SARS-CoV-2 Surrogate for Use in Surface Disinfection Efficacy Studies with Chlorine and Antimicrobial Surfaces. Environ. Sci. Technol. Lett. 2021, 8, 995–1001. [Google Scholar] [CrossRef] [PubMed]
  24. Franke, G.; Knobling, B.; Brill, F.H.; Becker, B.; Klupp, E.M.; Belmar Campos, C.; Pfefferle, S.; Lütgehetmann, M.; Knobloch, J.K. An automated room disinfection system using ozone is highly active against surrogates for SARS-CoV-2. J. Hosp. Infect. 2021, 112, 108–113. [Google Scholar] [CrossRef] [PubMed]
  25. Lin, K.; Marr, L.C. Aerosolization of Ebola virus surrogates in wastewater systems. Environ. Sci. Technol. 2017, 51, 2669–2675. [Google Scholar] [CrossRef]
  26. Whitworth, C.; Mu, Y.; Houston, H.; Martinez-Smith, M.; Noble-Wang, J.; Coulliette-Salmond, A.; Rose, L. Persistence of bacteriophage phi 6 on porous and nonporous surfaces and the potential for its use as an Ebola virus or coronavirus surrogate. Appl. Environ. Microbiol. 2020, 86, e01482-20. [Google Scholar] [CrossRef] [PubMed]
  27. Adcock, N.J.; Rice, E.W.; Sivaganesan, M.; Brown, J.D.; Stallknecht, D.E.; Swayne, D.E. The use of bacteriophages of the family Cystoviridae as surrogates for H5N1 highly pathogenic avian influenza viruses in persistence and inactivation studies. J. Environ. Sci. Health Part A 2009, 44, 1362–1366. [Google Scholar] [CrossRef] [PubMed]
  28. Shchukarev, A.; Backman, E.; Watts, S.; Salentinig, S.; Urban, C.F.; Ramstedt, M. Applying Cryo-X-ray Photoelectron Spectroscopy to Study the Surface Chemical Composition of Fungi and Viruses. Front. Chem. 2021, 9, 666853. [Google Scholar] [CrossRef]
  29. Dufrêne, Y.F.; Boonaert, C.J.; Rouxhet, P.G. Surface analysis by X-ray photoelectron spectroscopy in study of bioadhesion and biofilms. Methods Enzymol. 1999, 310, 375–389. [Google Scholar]
  30. Van Der Mei, H.C.; Busscher, H.J. The Use of X-Ray Photoelectron Spectroscopy for the Study of Oral Streptococcal Cell Surfaces. Adv. Dent. Res. 1997, 11, 388–394. [Google Scholar] [CrossRef]
  31. Armanious, A.; Aeppli, M.; Jacak, R.; Refardt, D.; Sigstam, T.; Kohn, T.; Sander, M. Viruses at Solid–Water Interfaces: A Systematic Assessment of Interactions Driving Adsorption. Environ. Sci. Technol. 2016, 50, 732–743. [Google Scholar] [CrossRef] [PubMed]
  32. King, A.M.Q.; Adams, M.J.; Carstens, E.B.; Lefkowitz, E.J. Virus Taxonomy; Elsevier Academic Press Inc.: Amsterdam, The Netherlands, 2011. [Google Scholar]
  33. Ramstedt, M.; Leone, L.; Persson, P.; Shchukarev, A. Cell wall composition of Bacillus subtilis changes as a function of pH and Zn2+ exposure: Insights from cryo-XPS measurements. Langmuir 2014, 30, 4367–4374. [Google Scholar] [CrossRef] [PubMed]
  34. Hamadi, F.; Latrache, H.; Zahir, H.; Bengourram, J.; Kouider, N.; Elghmari, A.; Habbari, K. Evaluation of the relative cell surface charge by using microbial adhesion to hydrocarbon. Microbiology 2011, 80, 488–491. [Google Scholar] [CrossRef]
  35. Latrache, H.; Mozes, N.; Pelletier, C.; Bourlioux, P. Chemical and physicochemical properties of Escherichia coli: Variations among three strains and influence of culture conditions. Colloids Surf. B Biointerfaces 1994, 2, 47–56. [Google Scholar] [CrossRef]
  36. Brown, G.; Henrich, V.; Casey, W.; Clark, D.; Eggleston, C.; Felmy, A.F.A.; Goodman, D.; Gratzel, M.; Maciel, G.; McCarthy, M.; et al. Metal Oxide Surfaces and Their Interactions with Aqueous Solutions and Microbial Organisms. Chem. Rev. 1999, 1, 77–174. [Google Scholar]
  37. Po, H.N.; Senozan, N.M. The Henderson-Hasselbalch Equation: Its History and Limitations. J. Chem. Educ. 2001, 78, 1499. [Google Scholar] [CrossRef]
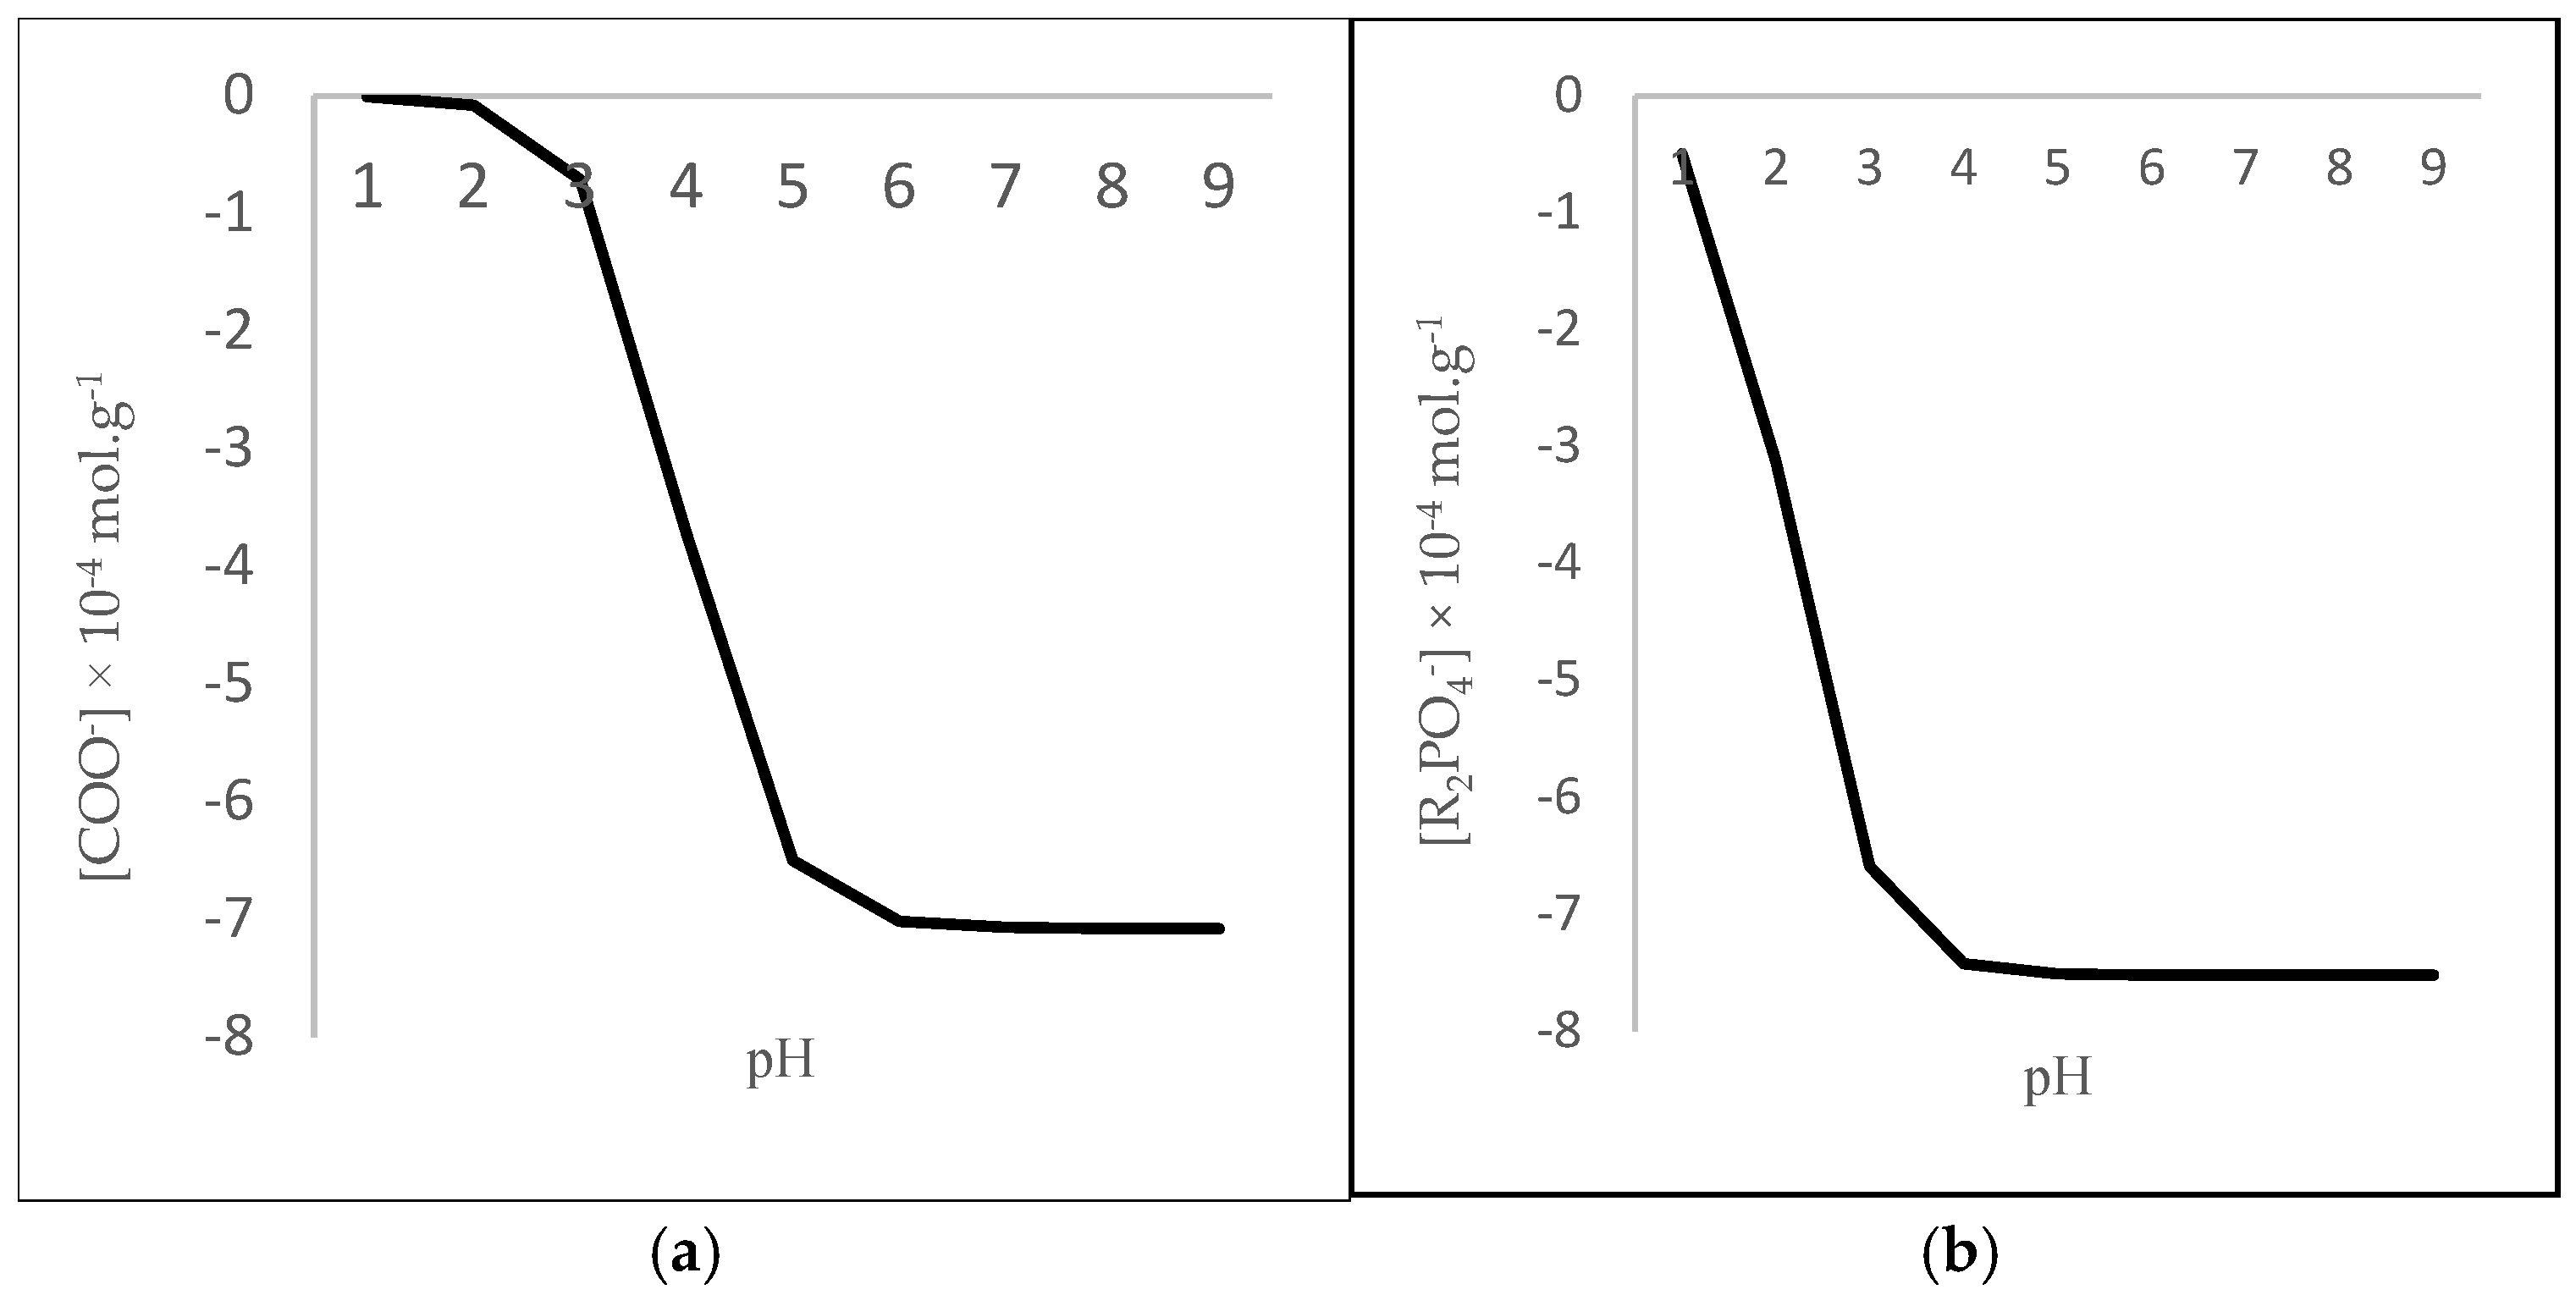
Figure 1. Evolution of the concentrations of (a) RCOO and (b) R2PO4 of the Phi6 bacteriophage.
Biophysica 05 00008 g001
Figure 2. Evolution of the concentrations of the negative charge of Phi6 bacteriophages under different pH.
Biophysica 05 00008 g002
Figure 3. Contribution of the carboxylic and phosphate groups in the negative charge of the Phi6.
Biophysica 05 00008 g003
Table 1. Elemental composition (%) of the phi6 bacteriophage) [28].
BacteriophageC [285.0]/CtotC [286.5]/CtotC [288.2]/CtotC [289.5]/CtotPC
Phi60.42 ± 0.020.39 ± 0.010.18 ± 0.010.01 ± 0.000.8 ± 0.150.2 ± 4.4
Table 2. Chemical composition of the model constituents considered for the deduction of the molecular compositions of Gram-negative bacteria [29].
ConstituentC-(C,H)/CC-(O,N)/CC=O/CCarbon Concentration (mmol/g)
Protein0.4280.2930.27943.5
Polysaccharide0.0000.8330.16737
Hydrocarbon1.0000.0000.00071.4
Table 3. Surface molecular composition (%) of the Phi6 bacteriophage (standard deviation in parenthesis).
ProteinsPolysaccharidesHydrocarbons
Phi646.3 ± 0.730.5 ± 1.722.1 ± 1.2
Table 4. Surface concentrations of two functional groups of Phi6 bacteriophage.
[RCOOH] × 10−4 mol/g[R2PO4H] × 10−4 mol/g
Phi67.08 ± 1.087.52 ± 0.58
Disclaimer/Publisher’s Note: The statements, opinions and data contained in all publications are solely those of the individual author(s) and contributor(s) and not of MDPI and/or the editor(s). MDPI and/or the editor(s) disclaim responsibility for any injury to people or property resulting from any ideas, methods, instructions or products referred to in the content.