2. Introduction
RBE is defined as the relative biological effectiveness of a radiation compared with a reference radiation, and is expressed as the ratio of the dose required for the same bioeffect, namely .
The reference radiation usually has a low linear energy transfer (LET), which is the averaged ionisation energy released along a radiation track length of 1 μm (approximately the width of a chromosome) in units of keV.μm−1. The test radiation has a higher LET with greater bioeffectiveness due to an increase in radiosensitivity (the lethal effect per unit dose) beyond that of the intrinsic biological radiosensitivity measured with a low LET radiation, and which requires a lower radiation dose to achieve the same bioeffect than with the reference radiation. The RBE ratio is then usually greater than unity.
Cell killing due to radiation is a combination of apoptosis, autophagy and, at higher therapeutic doses, the production of a lethal chromosome break (LCB) causing segregation of genetic content and intra-mitotic death. To produce a single LCB, there is a requirement for intense, highly localised ionisation with a clustering of DNA single-strand and double-strand breaks and of an increasingly wide (‘long patch’) damaged structure of increasing complexity and which cannot be rapidly repaired by enzymatic processes [
1,
2,
3]. The cellular defensive repair mechanisms are consequently overwhelmed, and even if this is only partially so, LCB can then occur in ‘repair proficient’ cells. In contrast, the more widespread but sparse distribution of DNA breaks, e.g., caused by lower LET radiations or by the continuous production of the free-radical products of oxidative metabolism, which are repaired with high fidelity and without frequent mutation induction.
LET therefore represents the localised intensity of ionisation released by a radiation on a microscopic scale. The LET magnitude will depend mainly on the electrostatic charge of the ion and its velocity when traversing through biosystems. A lowering of velocity allows a greater opportunity for the ionic charge to induce ionisation in nearby water and bio-molecules, including DNA, leading to its damage.
LETU is considered by the present author to be the value of LET where the relative probability of a lethal chromosome break is maximal, and at higher LET values, the RBE reduces probably due to excessive localised energy deposition beyond the requirement to produce a lethal event, which is often interpreted as a ‘wasted dose’.
The graphically displayed relationships between LET and RBE for different accelerated (and fully electron-stripped) ions are characterised by their unique turnover points, where RBE is maximal at an ion-specific LET of LET
U. It is important to understand that LET
U is independent of dose and surviving fraction, as can be seen in the work of Barendsen (1968) [
4], using helium and deuterons, and Weyrather (1999) [
5], using carbon ions, where RBE reduces with increasing dose but LET
U is unchanged. LET
U appears to increase non-linearly as a function of Z (the nuclear charge represented by the number of protons) as found initially for protons, helium, carbon, neon, and argon in Jones (2015) [
6] and with further kinematic information for data, which also included silicon and iron in Jones and Hill (2019) [
7]. A graphical display of these relationships can be seen in
Figure 1 of Jones and Hill (2020) [
8], where it can be seen that the increments in LET
U values become smaller with increasing Z, although the LET
U values continue to increase, possibly towards an asymptotic limiting value for extremely heavy ions beyond the Z and A range under consideration, i.e., beyond iron. The present work considers the hypothesis that LET
U will be dependent on the nuclear radius for each ion.
Some radiobiology textbooks state that an LET of approximately 110–120 keV.μm
−1 will provide the maximum RBE efficiency for all ions, as in the example of Hall and Giaccia (2019) [
9]. Also, data-mining publications have studied multiple ions with the empirical fitting of an overall single curve (rather than a series of unique curves), as in the PIDE-related publications of Friedrich et al. (2013, 2021) [
10,
11] and Sorensen et al. (2011) [
12]. Such data sets ignore the possibility of different turnover points for each ion. However, the colour-coded data published by Sorensen et al. (2011) [
12] does suggest the existence of unique turnover points on close inspection.
An empirical exponential saturation-type equation containing Z was initially fitted to LET
U experimental data sets [
6], but has limitations for the higher Z elements since LET
U continues to increase with Z, although by smaller amounts per unit increase in Z. The form of the plotted data set is compatible with a power law model. For this reason, the present study considers the approximated influence of increasing nuclear radius (related to A, the atomic mass) and charge radius (related to Z) on the progression of LET
U values with each of Z and A. The use of Z provides more limited information than would A for complete nuclear geometry. LET
U has been found to occur at lower LET values than the actual maximum LET (LET
M) at Bragg peaks [
8], an assumption made if straggling is not accounted for in a range of ions so that the use of the Bethe-Bloch equation, which depends on Z
2 and relativistic velocities, cannot be used in its present form to predict LET
U because biological properties must also contribute in addition to the physical properties. Also, the inclusion of A and Z, rather than Z alone, appeared to better discriminate the ionic kinematics at LET
U [
7]. It is important to compare the effects of all nucleons (protons and neutrons) contained in A with only the protons contained in Z since, in each, case the overall volumes and associated radii will differ.
Also, a system is suggested for estimating LET values, which are biologically isoeffective when two different ions are used. This is based on the linear geometry of experimental ascending LET-RBE relationships, as shown by Sorensen et al. (2011) [
12], before the turnover point is reached.
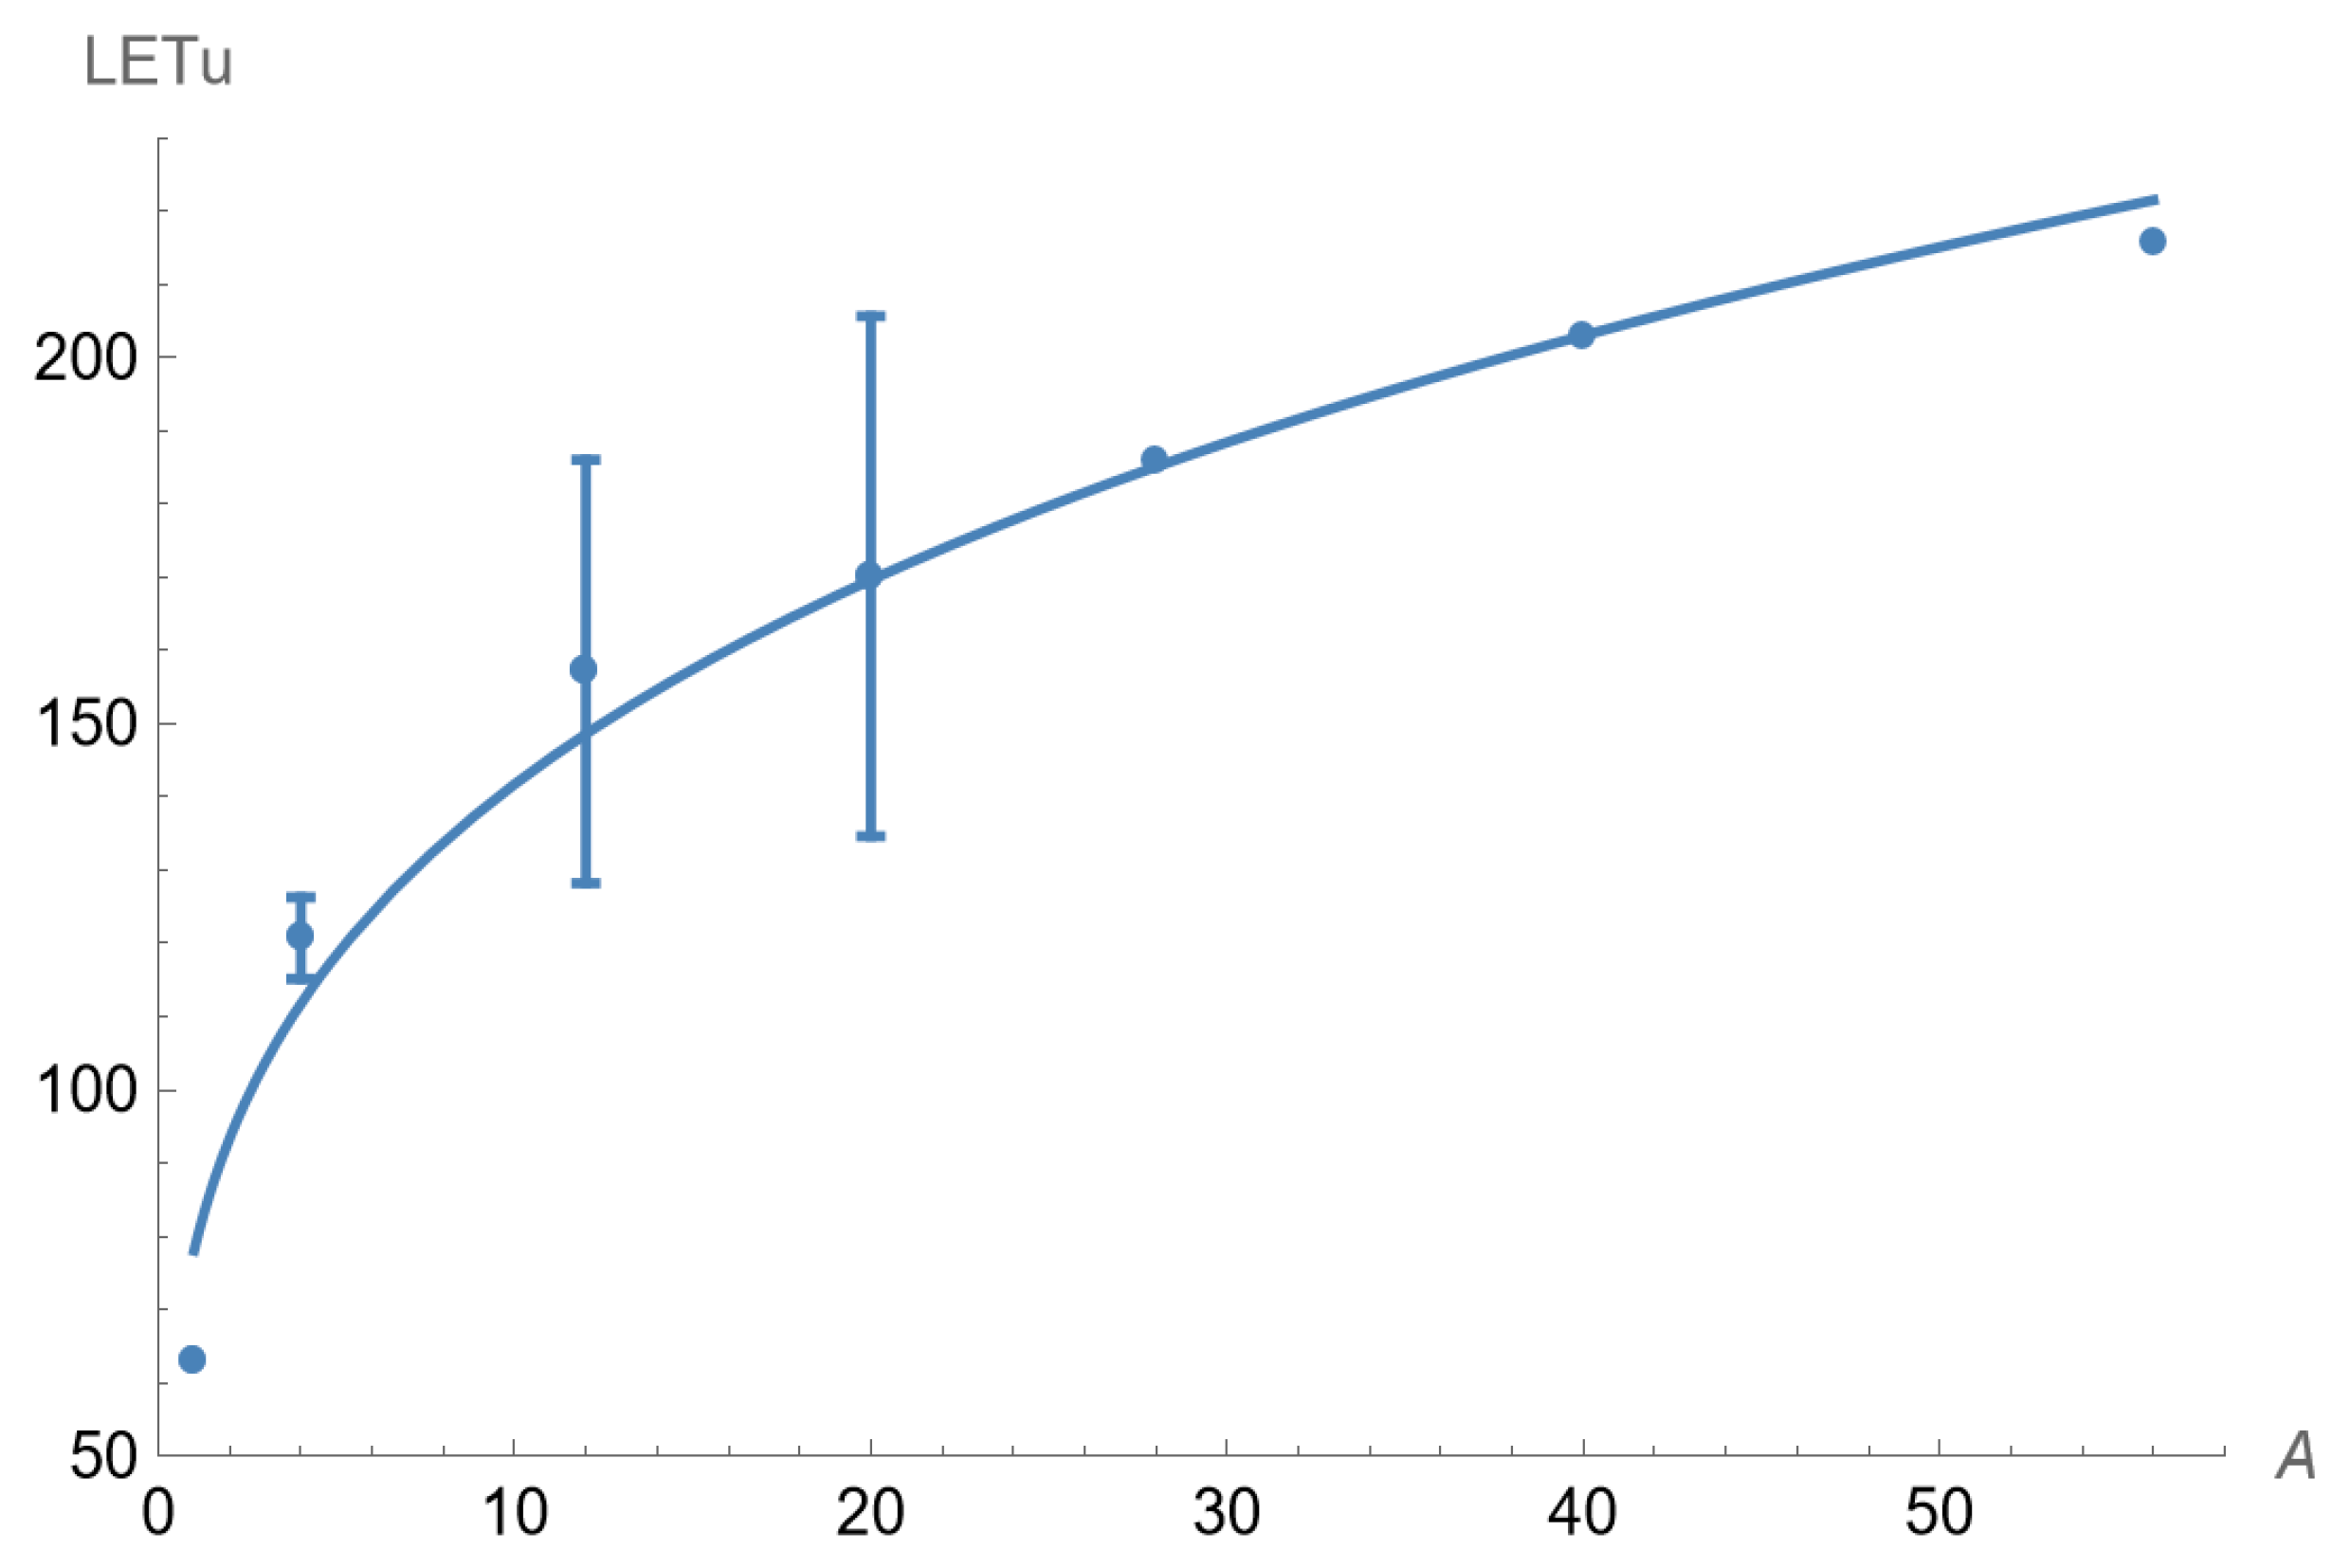
4. Results
The plotted experimental results for LET
U and A are displayed in
Figure 2 with a fitted curve obtained from non-linear least squares fitting, which provides an estimated relationship of
where LET
U[A=1] is the fitted LET
U of a proton particle, estimated to be 78.1 keV.μm
−1. This interpolated result differs from the 30.4 keV.μm
−1 obtained from experimental data where LET
U is lowered by proton range limitations (as discussed below). The fitted curve, using Equation (9), is also shown in
Figure 2. Although the relationship is better displayed as a continuous function, only the appropriate values of A for each practical ion should be used, and not intermediate values.
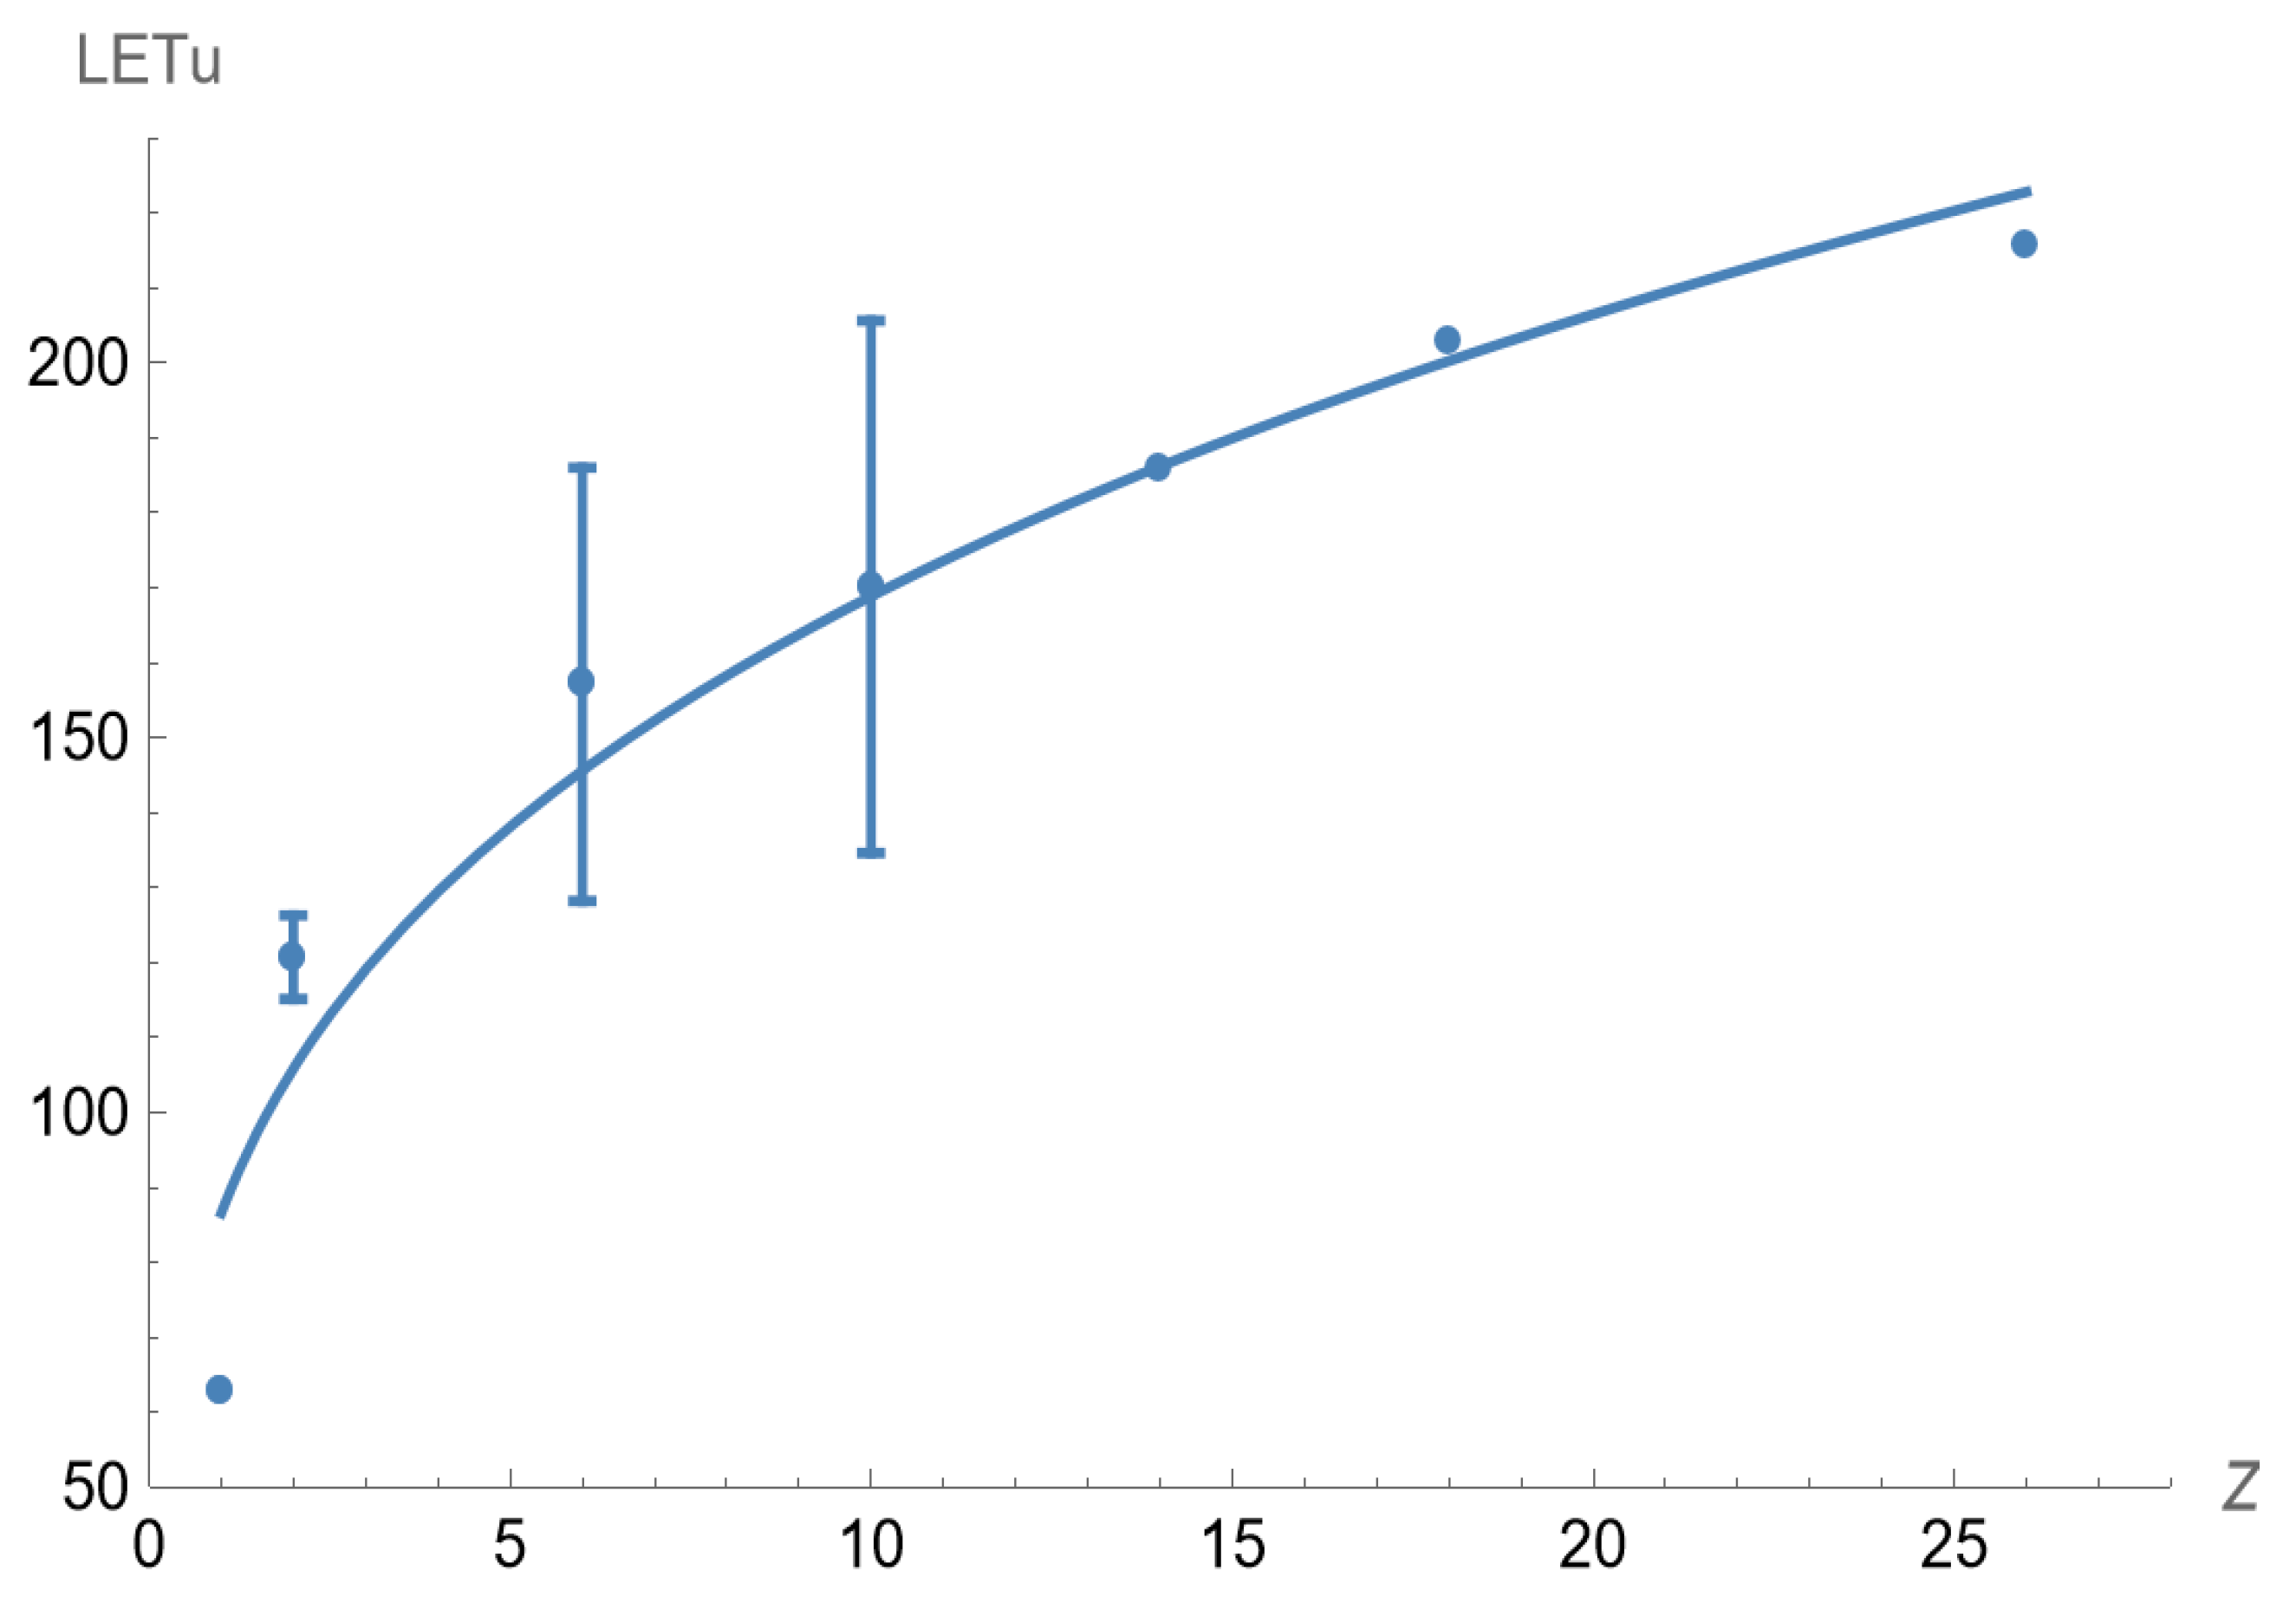
Similarly, the plotted experimental results for LET
U and nuclear charge (Z) are shown in
Figure 3 with a fitted curve obtained from non-linear least squares fitting, which provides an estimated relationship of
where Z must only have integer values.
Where LET
U[Z=1] is the LET
U of a proton particle, estimated to be 86.6 keV.μm
−1, which is larger than the estimate obtained using the A model. The LET
U data and fitted curve, using Equation (10) as an assumed continuous function for easier visual comparison purposes, is also shown in
Figure 3.
These power law models predict that the slope of the relationships will progressively reduce, with the increment in LET
U per unit rising in Z or A and becoming smaller with increasing Z or A, as shown in
Figure 2 and
Figure 3.
The statistical dispersions of the parameters obtained for each of the A and Z co-taining models and the R
2 fitting values are provided in
Table 2, where it can be seen from the standard errors that the two exponents may not be significantly different.
Goodness-of-fit tests (using Mathematica) showed no significant difference between the A and Z models, with high p-values.
The estimated LET
U results for each model are shown in
Table 3. These are not statistically different as assessed by the paired T, Mann–Whitney and Kolmogorov–Smirnov tests (
p-values of 0.33, 0.80 and 0.96, respectively), although the discrepancies are the greatest for the lowest two A and Z values (protons and helium) and the standard errors are large in many instances due to the sensitivity of the exponent to small changes.
4.1. Nuclear Shape Distortions
The assumption that all atomic nuclei are spherical is probably incorrect, since distortions to prolate or oblate shapes have been predicted and detected (this is discussed further below). In this respect, the exponent of 0.26 obtained with the A model is significantly lower than 0.33 (as expected for spherical nuclei), although the 0.29 exponent of the Z model is closer to 0.33. It is speculated here that these deviations, which represent an average value from all the ions studied, possibly represent distortions from nuclear spherical symmetry to that of a prolate spheroid. The Z model will of course under-represent the entire atomic nucleus; therefore, only the A model should be used to estimate the degree of distortion.
A description of the relevant spheroidal geometry and equations is provided in
Appendix A for readers who may not be familiar with these. In spheroids, the semi-axes distances are
a and
c, which replace the radius
r of a sphere.
For the experimentally obtained exponent of 0.26, Equation (A6) (see
Appendix A) is modified to be:
then
where C is a constant, so that
Since the spheroidal nuclear volumes depend on the relative proportions of dimensions
a and
c, then Equation (13) can be rewritten as
which provides the estimate:
so that a < c, which defines a prolate spheroid. The visualised geometry of the ions studied is shown graphically in
Appendix B.
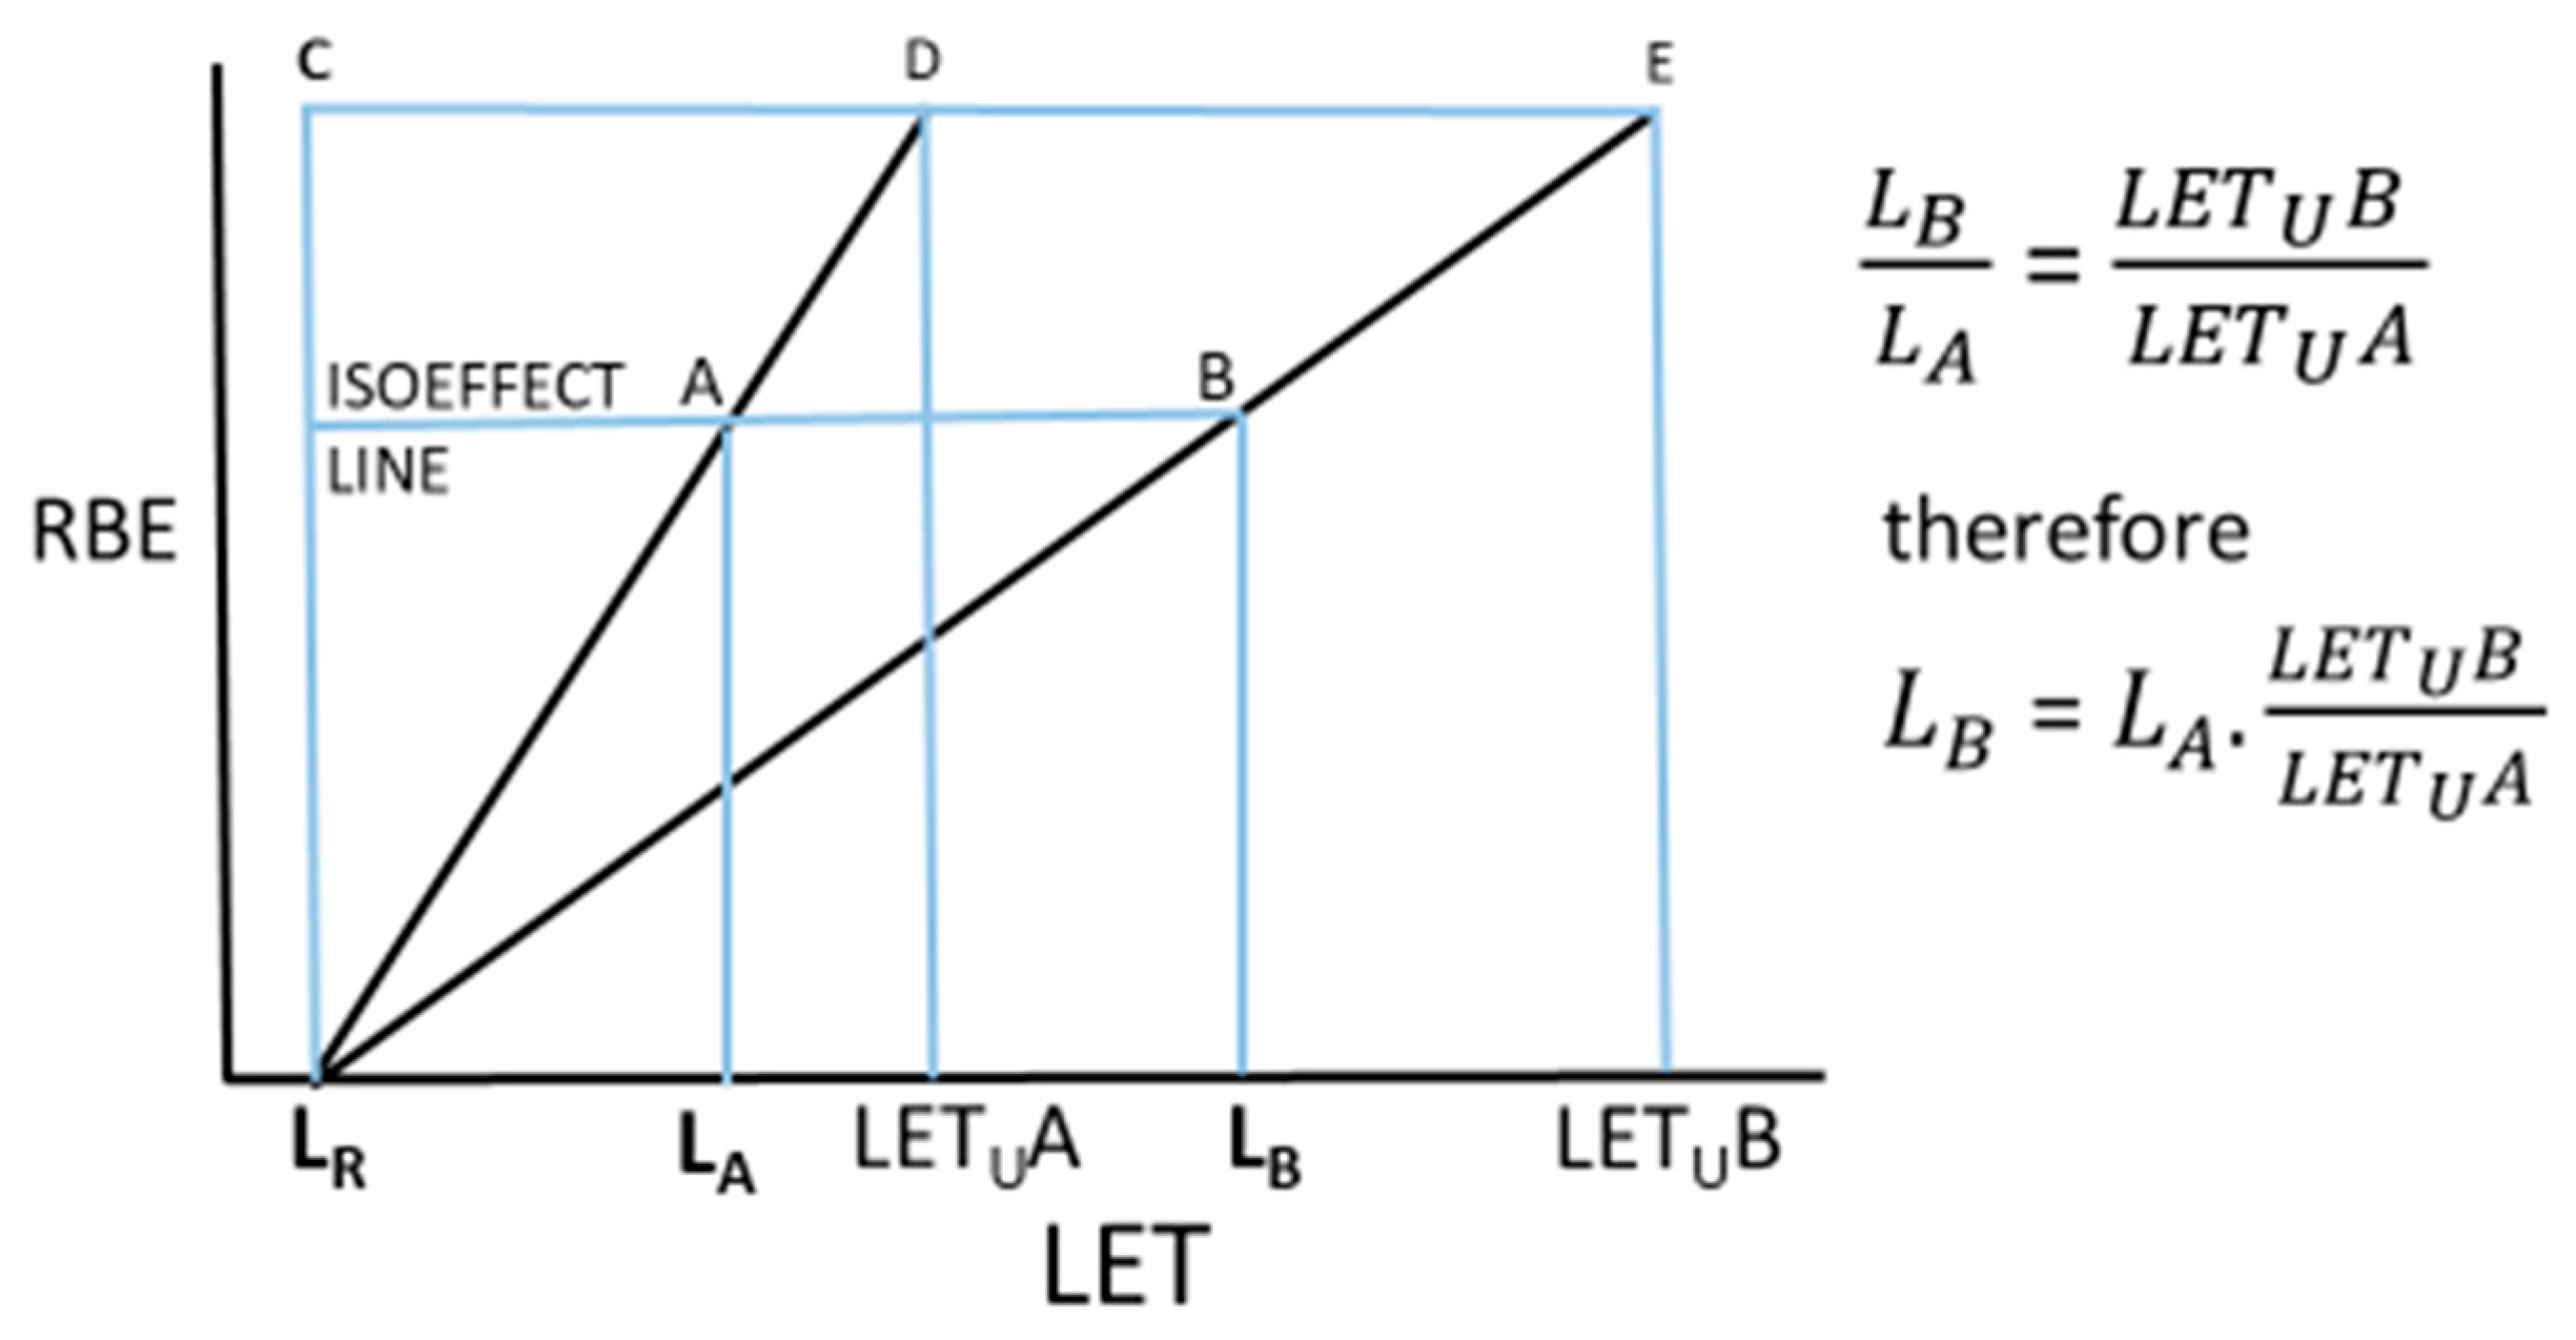
4.2. Obtaining Isoeffective LET Values for Different Ions
For any two ions A and B, the final equation shown in
Figure 1 can now have equation-derived LET
U values included, where L
x here refers to the LET values under consideration and designated A or B, and the atomic weights are A with suffixes A or B for each type of ion, as in:
and
where
provides the estimated LET
U if using the A model and 86.6 Z
0.29 the estimate for LET
U using the Z model. Where protons are to be compared, the LET
U of 30.4 keV.μm
−1 obtained by Belli et al. (2000) [
13] is preferred, rather than the fitted theoretical value inherent in each model. Two theoretical examples of proton–carbon ion comparisons are given below, but these can be extended for any two ions. The range of the spread-out Bragg peak LET values are usually between approximately 10 and 80 keV.μm
−1, as stated by Tinganelli and Durante (2020) [
18].
4.3. Theoretical Worked Examples
Answer: Using the final equation in
Figure 2, the carbon ion estimates obtained by use of the A model are
giving estimated carbon ion isoeffects at approximately 9.8, 29.4 and 49 keV.μm
−1, respectively.
Note that the proton LETU used was the experimental value of 30.4 keV.μm−1 and not the theoretical value given by the model.
- 2.
Radiobiologists have identified a specific grade of late-reacting normal tissue effect for carbon ions at effective LET values of 20, 50 and 80 keV.μm−1. However, around which proton-effective LET values might the same biological effectiveness be obtained if the target volumes were similar? It is assumed here that the effective LET is the single LET value representative of a spectrum of LET values that determines a specified effect in the context of an application using spread out Bragg peaks. Some readers may be unfamiliar with this concept, but a similar ‘effective energy’ from a spectrum of fast neutron energies can be used to determine a specified biological effect as in Jones (2021) [
19] and the same is both desirable and potentially achievable for particle therapy.
Answer: In this case, the heavier ion provides the input data, so the ratio within the equation must be inverted, as in
when using the A model, giving estimated proton isoeffects at approximately 4.1, 10.2 and 16.3 keV.μm
−1, respectively.
Now, if the Z-containing model is used, the respective results obtained are:
Example 1: keV.μm−1
Example 2: keV.μm−1
These Z-containing model results are different to those obtained using the A-containing model by between 16 and 19%. Consequently, the use of both models should, at best, give only a reasonable first approximation so that carefully designed experimental testing would be necessary to confirm which is best to use within the limitations presented by considerable biological variation, where 5–10% represents the most probable obtainable accuracy range.
These worked examples need further interpretation if actual clinical comparisons were to be made. For example, the above assumes the use of single doses. Consequently, it would be necessary to transform fractionated radiotherapy data to a single dose equivalent (e.g., by the BED method, which would need to be included), but if an equal number of fractions were used to achieve a specific isoeffect using two different ions, then the individual fraction size could be used. The system also assumes that the averaged LET (in spread-out Bragg peaks and at relevant tissue points or volumes) is adequate for the estimation of RBE, but this can be represented by a single LET value in principle.
5. Discussion
The relationships between successive LET
U values for different ions can be represented by simple power law-containing functions, which include the theoretical proton LET
U values, which are 78.1 in this study (for the A-containing model) and 86.6 keV.μm
−1 (for the Z-containing model). These values are prone to some uncertainty since they are on the steep gradient part of the plotted power law functions in
Figure 2 and
Figure 3. These high proton LET
U values are in marked contrast to the LET
U of 30.5 keV.μm
−1 obtained using mono-energetic protons [
13], and approximately 62.5 keV.μm
−1 by considering recoil protons from fast neutron collisions [
19], with each being considerably lower than the estimates provided by the A and Z models. This is likely because of the proton range limitations across cells in the Belli et al. [
13] data (discussed in Jones and Hill 2020 [
8]). Also, from kinematic considerations [
7], the proton LET
U was estimated to be as high as 87.7 keV.μm
−1 (with deuterons at 86.5 keV.μm
−1), which agrees well with the LET
U estimate found using the Z model. These authors also reviewed other experimental studies performed in the UK using mono-energetic protons (for lower LET values) but substituted by deuterons (for higher LET values) because of the proton cellular range limitations (as in the example of Folkard et al., 1996 [
20]). These experiments suggested LET
U values of between 55 and 80 keV.μm
−1, which are substantially larger than 30.5 keV.μm
−1 because of the longer deuteron physical range. The LET
U estimate given by the A model is within the higher end of this experimental LET
U range.
Such predicted LET
U values for protons are all beyond the usual range of averaged LET values over voxel regions of interest encountered in clinically relevant volumes within spread out Bragg peaks (1–10 keV.μm
−1 as in Grassberger et al., 2011 [
21]). In clinical practice, the influence of smaller sub-volumes, which contain higher LET values than within this range, remains to be determined, but could be of some significance in critical normal tissue structures being irradiated, e.g., within some critical central nervous system tissues. The two described models offer methods for estimating the LET
U value for any ion species up to the element iron, and their predictive value appears to be statistically very similar, probably as a consequence of the A = 2 Z relationship for the lighter ions, excluding protons. The model, which contains A, may have a possible advantage in that A carries more information. Since mass is implicitly included within A, it will influence mass and kinetic energy particle velocity, which appears to influence LET
U (as found in Jones and Hill, 2019 [
7]), although LET itself is influenced by the ratio of Z
2/β
2. For the same values of LET, deuterons will have double the kinetic energy of protons, as well as a larger cross-section for non-elastic nuclear collisions, which might influence LET
U, although the resulting recoil protons will have, on average, half the kinetic energy of the incident deuteron, which causes the LET to be the same, but there will also be a variety of secondary products with higher LET.
The exponents for the A and Z models suggest prolate nuclear geometries, which presumably affect the charge distribution at longer distances where biological targets exist. The maximum thickness of the nucleus when viewed orthogonally to the beam direction is 2a, and the cross-section is then πa2 instead of the larger πr2 for spherical nuclei. The average nuclear thickness (m) along the beam long-axis is obtained by integration to be . These simple geometrical concepts may be helpful for future correlative purposes in biological experiments.
Alternative methods for estimating different ionic effects include atomic cross-sections and the Katz theory, where ionic charge squared and its relativistic velocity determines its radial dose range in the form of a cylinder around the radiation track, as further advanced by Waligorski, Grzanka, and Korcyl (2015) [
22]. It was this radial geometry that alerted the present author to the potential importance of the nuclear radius and its proportionality to A and Z, although nuclear radius per se is not used in the Katz theory.
Another representation of the LET-RBE inversion effect at LET
U has some historical counterparts in the occurrence of ‘hooks’ as seen on plots of inactivation cross-sections (related to the final slopes of cell survival curves) with increasing LET, as in Wulf et al. (1985) [
14]. Such work merits reinvestigation with possible LET
U data comparisons. A review of all alternative models to predict RBE is beyond the scope of this article.
Each of the arguments made above about (1) spherical nuclear cross-sections not being a good predictor of LETU, and (2) the influence of the shape of the nucleus are speculative and would need further work by particle physicists to clarify the specific topology for each ion type and whether the influence of acceleration (and kinetic energy) and magnetic field strength produces further distortions.
Both of the predictive LETU models may be useful to scientists and clinicians investigating comparative differences between ions and should at least offer a first approximation to obtaining isoeffective LET values and without the necessity for more complex calculations involving dose, cellular surviving fraction, RBE, etc. These might be useful in experimental design and in clinical trial analysis, or even in retrospective clinical studies. Some further adjustments for changes in dose per fraction would be necessary in some cases. These estimates will be most reliable for well-oxygenated biosystems, such as the normal tissues and will require modification where significant numbers of hypoxic cells exist, such as in many tumours, since the LETU values will increase in these conditions (as discussed below).
A further refinement includes using the reference radiation LET value. For megavoltage radiation comparisons, the differences would be small (e.g., values of 0.2–0.6 keV.μm−1), and the chosen value should then be subtracted from each LET value. However, in the estimated isoeffects equation the LET for A = 1 and Z = 1 values cancel so that only the input value of LET is used. When the input value is corrected, for example in the case of a reference radiation LET of approximately 0.3 keV.μm−1, so that LET is changed to be (LET–0.3), then the estimations given in worked examples 1 and 2 for the A-containing model are:
Example 1: 1.3, 9.0, and 16.6 instead of 1.9, 9.5, and 17.2, respectively.
Example 2: 2.5, 5.1, and 7.7 instead of 2.6, 5.2, and 7.9, respectively.
In such cases, the percentage differences will be the greatest for small LET values.
The speculations made concerning nuclear shape need further discussion and it is perhaps surprising that biological experiments can lead to such an inference. The possibility of further distortions to non-spheroidal shapes may also occur and are known to exist for much heavier atoms as shown by the STAR Collaboration (2024) [
23]. However, prolate nuclear shapes are compatible with the fact that the overall relationship between LET
U and A or Z has an exponent smaller than 0.33 (which would only apply for only spherical nuclei). This result must depend on an averaging process for the separation of each LET
U value in the ions studied, and it would be interesting to know if increasing particle velocity can induce further changes in nuclear shape since inertia will resist imposed acceleration in the forward direction. It is already known that most nuclei are prolate-shaped in their ground state, as described in Tajima N and Suzuki N (2001) [
24]. This topic is worthy of further research with respect to potential effects on radiobiology. There is presently increasing interest in high energy experiments using ‘head-on’ Uranium collisions for this purpose at CERN [
23], which discusses methods of nuclear shape assessment by spectroscopic and quantum-based equations leading to conclusions of prolate, oblate and other types of nuclear deformations.
In order to make further improvements, it would be necessary to perform detailed experiments to find more accurate LET
U values. The existing data sets were designed only to show overall phenomena and were performed with relatively few data points at different laboratories where both physical definitions, such as LET definitions and dosimetry standards, would vary. Further causes of physical variation in LET
U estimates could be due to natural isotopes causing changes in atomic mass, although the greatest sources of variation are probably those in biological assays. For example, hypoxia can increase carbon and neon LET
U values by substantial amounts [
25], which indicates the importance of cell culture conditions, times between the plating of cells and the actual radiation exposure. It is probable that LET
U will be influenced by pH, the temperature of the experiment (room temperature or 37 °C), as well as the nutrient medium used to grow the cells: variations in these biological conditions could account for the statistical spread in LET
U (seen in
Figure 2 and
Figure 3) for helium, carbon, and neon ions due to results obtained from several laboratories being averaged, whereas the other ions are in the form of point estimates obtained from one laboratory. Different cell lines will also change RBE values depending on their radiosensitivities and repair capacities. Standardisation of all bio-laboratory conditions, choice of cells which have ranges of DNA repair proficiencies, radiosensitivities, etc., are essential, as well as the control of the physical beam parameters.
A proposal for a purpose-built Bio-LEIR laboratory for comparative ion radiobiology work using standardised laboratory conditions was proposed at CERN [
26,
27], but was eventually not funded. The completed design studies and partly redundant equipment remain available so that a future change in policy might result in considerable human benefit within particle therapy and radioprotection (e.g., ions beam bio-effects in industry, high altitude, and space travel). Such a facility, located in any country, could attempt to solve many of the issues raised in this article such as the effective LET to represent a LET spectrum as well as improve the statistical confidence of experimental results in order to determine better controlling radiobiological parameter values so that clinical and other applications could become feasible.


