Article

Computational Modeling of the Neurofibromin-Stimulated Guanosine Triphosphate Hydrolysis by the KRas Protein

by
Igor Polyakov
1,2 and
Alexander Nemukhin
1,2,*
1
Department of Chemistry, M. V. Lomonosov Moscow State University, Moscow 119991, Russia
2
N. M. Emanuel Institute of Biochemical Physics, Russian Academy of Sciences, Moscow 119334, Russia
*
Author to whom correspondence should be addressed.
Biophysica 2023, 3(2), 373-384; https://doi.org/10.3390/biophysica3020025
Submission received: 12 April 2023 / Revised: 14 May 2023 / Accepted: 17 May 2023 / Published: 31 May 2023
(This article belongs to the Special Issue Molecular Structure and Simulation in Biological System)

Abstract

:
We report the results of computational studies of the guanosine triphosphate (GTP) hydrolysis in the active site of the KRas-NF1 protein complex, where KRas stands for the K-isoform of the Ras (ras sarcoma) protein and NF1 (neurofbromin-1) is the activating protein. The model system was constructed using coordinates of heavy atoms from the crystal structure PDB ID 6OB2 with the GTP analog GMPPNP. Large-scale classical molecular dynamics (MD) calculations were performed to analyze conformations of the enzyme-substrate complexes. The Gibbs energy profiles for the hydrolysis reaction were computed using MD simulations with quantum mechanics/molecular mechanics (QM/MM) interaction potentials. The density functional theory DFT(ωB97X-D3/6-31G**) approach was applied in QM and the CHARMM36 force field parameters in MM. The most likely scenario of the chemical step of the GTP hydrolysis in KRas-NF1 corresponds to the water-assisted mechanism of the formation of the inorganic phosphate coupled with the dissociation of GTP to GDP.

1. Introduction

An ongoing interest in the molecular mechanism of the guanosine triphosphate (GTP) hydrolysis to guanosine diphosphate (GDP) through various variants of the Ras (rat sarcoma) protein is due to a vital importance of Ras in cancer research [1,2,3,4,5]. Ras is activated or inactivated, when bound to GTP or GDP, and oncogenic mutations increase the frequency of GTP-bound Ras in the signaling state. Thus, the mechanism of GTP hydrolysis through the GTPase Ras in complexes with the GTPase activating proteins (GAPs) is a focus of numerous studies. Several Ras-GAP complexes have been investigated in experimental and computational works [6]. Historically, the H-isoform of Ras complexed with the p120GAP protein gained the highest attention. The crystal structure of the HRas-p120GAP complex containing the GTP mimic was deposited to the Protein Data Bank (PDB) [7] as the PDB 1WQ1 entry [8]. This structure formed a solid structural basis to propose possible mechanisms of chemical reaction GTP + H2O → GDP + Pi, where Pi is called the inorganic phosphate. We refer to several selected papers [9,10,11,12,13,14,15,16,17,18,19,20,21,22,23] which describe proposed reaction mechanisms; the full list of references is excessively large for the present paper.
Recently, Rabara et al. reported results of experimental studies of GTP hydrolysis in the K-isoform of Ras complexed with another variant of GAP–neurofibrin-1 (NF1) [24]. The reported crystal structure PDB 6OB2 of KRas-NF1 contains atomic coordinates of the system with the non-hydrolyzable GTP analog, GMPPNP. Unlike the structure PDB 1WQ1, which presumably refers to the transition state mimic in the GTP → GDP reaction, the structure PDB 6OB2 simulates an enzyme-substrate (ES) complex. Therefore, modeling the reaction mechanism of GTP hydrolysis on the base of the PDB 6OB2 coordinates promises the discovery of novel details of this important mechanism.
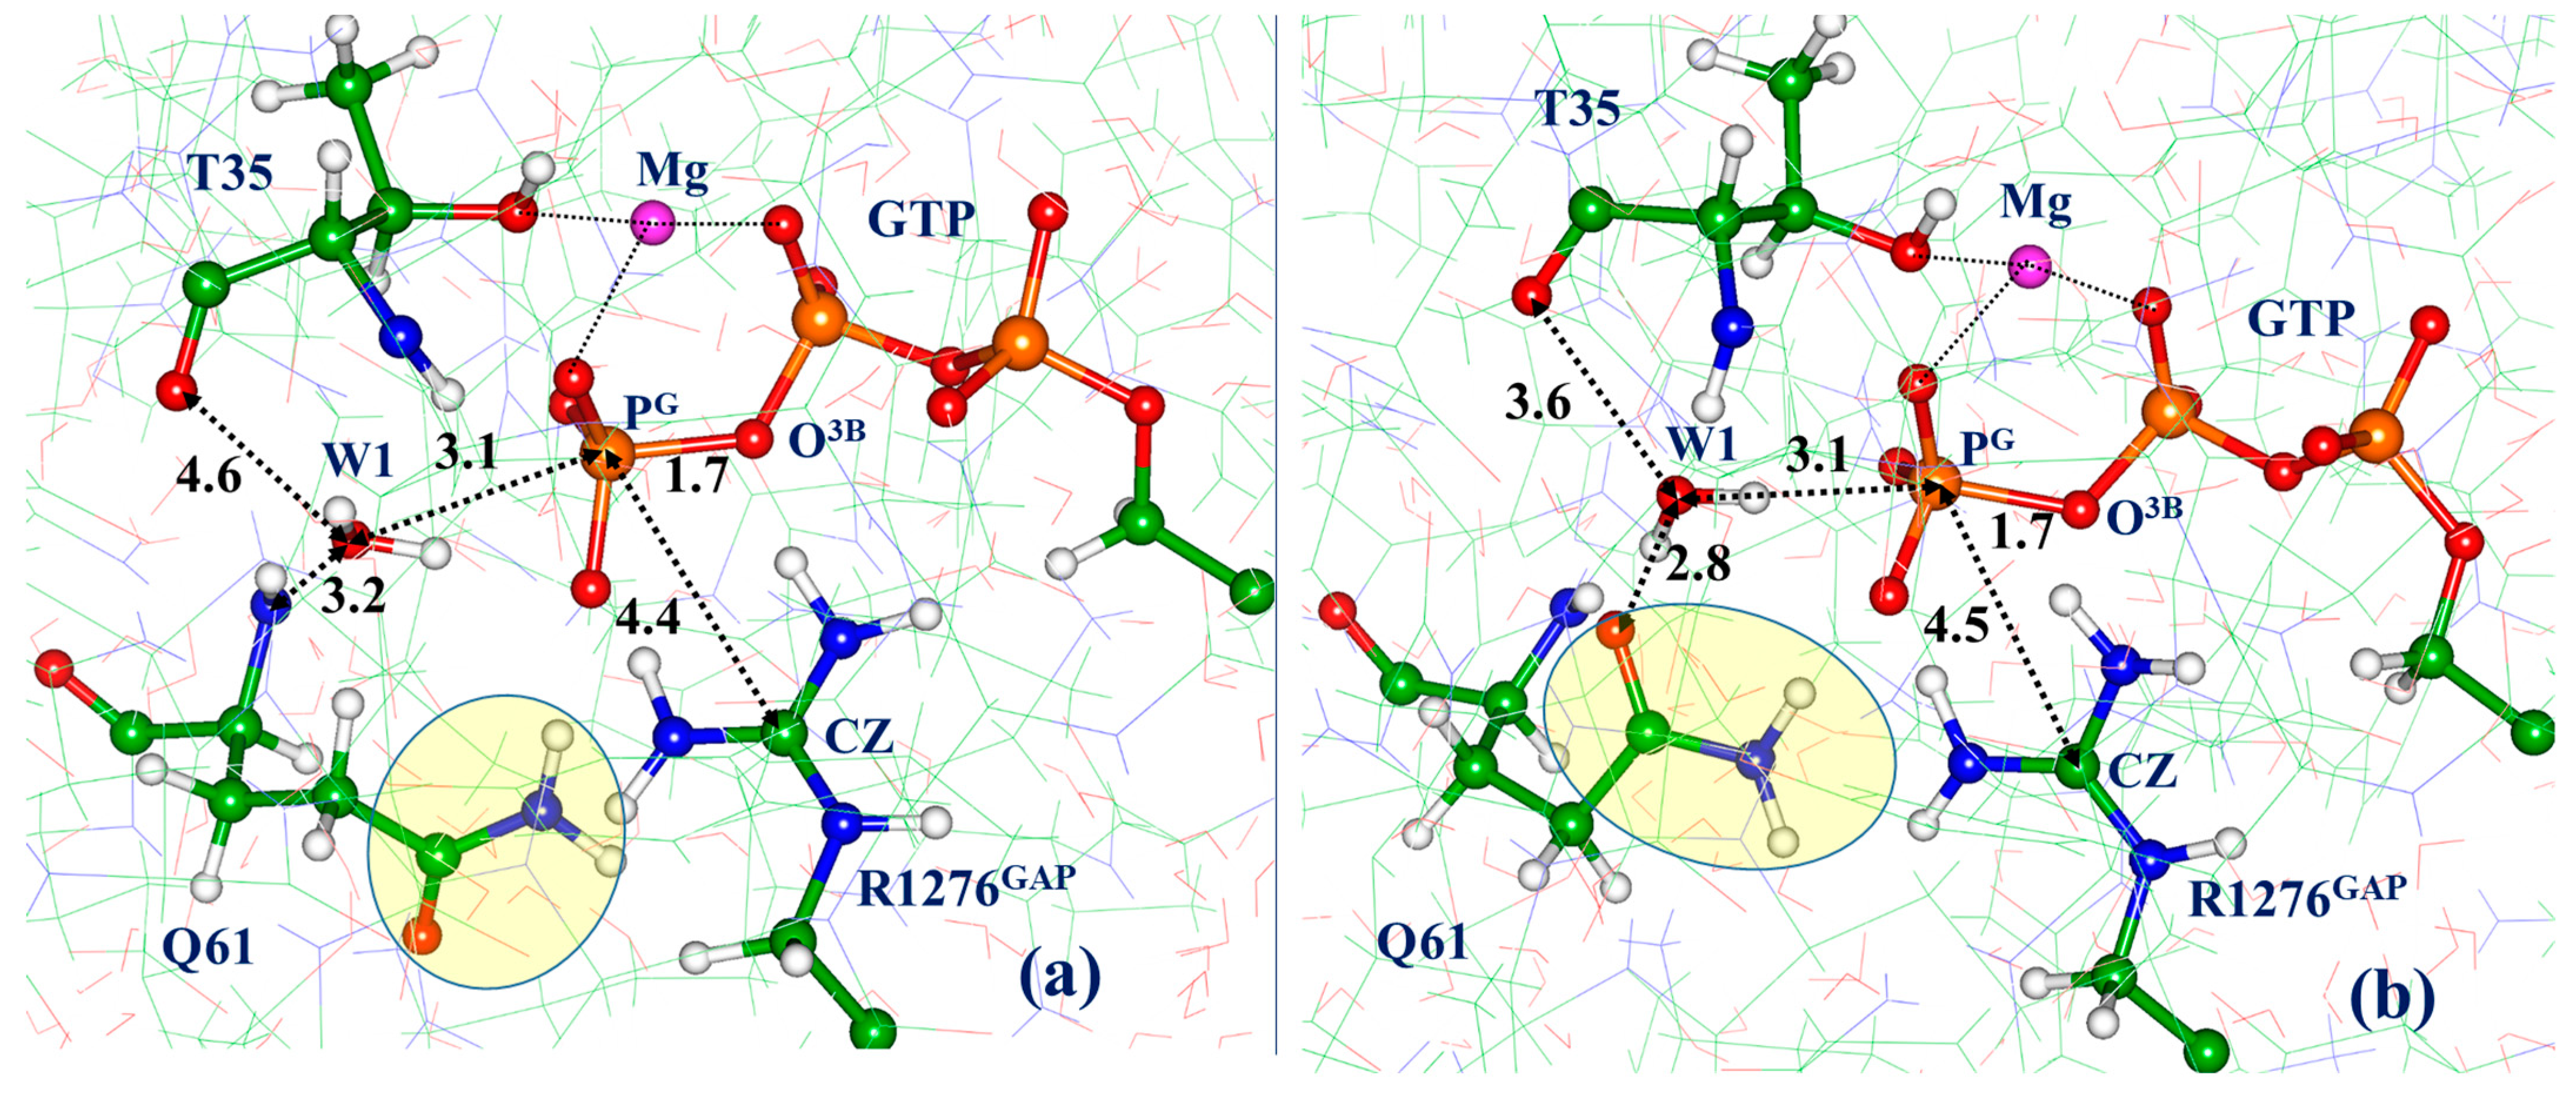
It is convenient to compare (see Figure 1) two Ras-GAP models taking atomic coordinates of heavy atoms from the crystal structure PDB 6OB2 of KRas-NF1 [24] and those from the computationally derived model [19,21,22] of HRas-p120GAP. The latter was obtained in QM/MM optimization of atomic coordinates initiated by the crystal structure PDB 1WQ1 [8] after restoring the γ-phosphate group in GTP instead of its mimic (AlF3) in the crystal. This model well reproduces positions of all important molecular groups in the enzyme active site observed in the crystal structure PDB 1WQ1. In both models, the substrate (either the GTP molecule or its non-hydrolyzable analog GMPPNP) is trapped inside proteins, in particular, with the help of the magnesium ion Mg2+. The coordination sphere of the latter is formed by the oxygen atoms of the γ- and β-phosphates, of the water molecules denoted WM1 and WM2 in Figure 1, and of the carbonyl groups of the serine S17 and threonine T35 side chains. All the magnesium–oxygen distances in both structures are about 2.0–2.1 Å.
As shown in Figure 1b, the water molecule denoted W1 stays in a perfect position for a nucleophilic attack on the PG atom of the γ-phosphate, taking into account its hydrogen bonds with the threonine T35 and glutamine Q61 side chains. In turn, location of the Q61 side chain, favoring a proper orientation of W1, is due to an important arginine residue R789 from the GAP molecule. The role of the “arginine finger” (in fact, the role of the GAP in the GTP hydrolysis by Ras) is well discussed in the literature [6,8,9,14,15,16,17,18]. Formation of these structural motifs in the active site accounts for the efficient GTP hydrolysis in the Ras-GAP protein complex. It is a common view that upon approaching the properly aligned nucleophilic water molecule, the PG−O3B bond cleaves producing GDP.
An analysis of the structure PDB 6OB2 of KRas-NF1 (see Figure 1a) shows that two critical amino acid side chains, Q61 and R1276GAP (an analog of R789GAP in the PDB 1WQ1), are in considerably different conformations than those in the structure PDB 1WQ1. The arginine finger is located too far from the γ-phosphate (cf. CZ-PG distances—9.5 Å in Figure 1a and 4.3 Å in Figure 1b). The side chain of Q61 in the PDB 6OB2 structure is switched away from the γ-phosphate and does not assist in aligning the nucleophilic water molecule W1.
Such a position of Q61 is inconsistent with the key role of this glutamine residue in the GTP hydrolysis by Ras-GAP complexes as confirmed by mutational studies [3,5,8]. In particular, according to the results reported in [24], the Q61R mutation abolishes the reaction, although detailed kinetic experiments are not reported. In this respect, the paper of Philips et al. [25] is a more important contribution. The authors used the stopped-flow kinetic measurements for the KRas-NF1 system and reported the rate constant 19.5 s−1 for the chemical step of the entire GTP hydrolysis process. Using the equation of the transition state theory, this value can be converted to the activation free energy barrier of 16 kcal/mol.
The goal of the present paper is to report the results of molecular simulations of the GTP + H2O → GDP +Pi reaction in the KRas-NF1 model systems constructed on the base of the PDB 6OB2 crystal structure. We rely on novel efficient modeling tools to calculate the Gibbs energy reaction profiles using molecular dynamics approaches with the quantum mechanics/molecular mechanics potentials (QM/MM MD) which allow us to apply a high-level functional in the density functional theory and atom-centered basis functions to evaluate energies and forces in a large QM-subsystem.

2. Materials and Methods

The crystal structure PDB 6OB2 [24] is used as a source of coordinates of heavy atoms to construct all-atom molecular model systems of KRas(GTP)-NF1. The GTP molecule was restored from its GMPPNP analog; hydrogen atoms were added, assuming the conventional protonation states of the polar residues at neutral pH: Arg and Lys were charged positively; Glu, Asp were charged negatively. Water molecules resolved in the crystal structures were kept in the model systems. A solvation water box was built using the visual molecular dynamics (VMD) program [26]. Moreover, 45 sodium and 38 chloride ions were added to neutralize the system and ensure the 0.15 M NaCl concentration. The CHARMM36 force field topology and parameters [27] were employed along with the TIP3P parameters for water molecules. Parameters of GTP were taken from [28]. In total, the model system contained 47,128 atoms.
Classical MD trajectories were simulated using the NAMD 3.0 software package [29]. The isothermal–isobaric (NPT) ensemble at P = 1 atm and T = 300 K was employed with the Nosé–Hoover Langevin piston pressure control and the Langevin dynamics. Periodic boundary conditions and the particle mesh Ewald algorithm—to account for the long-range electrostatic interactions—were applied, whereas the non-bonded interaction cut-off parameter was set to 14 Å; integration step was set to 2 fs with the SHAKE/SETTLE algorithms applied to constrain bonds to hydrogen atoms. A harmonic constraint potential of 0.1 kcal/Å2 was applied to the CA atoms of the beta sheets of the protein. A total length of over 2000 ns from 16 trajectories was produced.
To construct the Gibbs energy profiles, we carried out MD simulations with the quantum mechanics/molecular mechanics (QM/MM) potentials for the model system in the vicinity of ES complexes revealed in classical MD. The triphosphate part of the GTP molecule; the K16, E57, Q61, R1276GAP side chains; the magnesium ion with its full solvation shell containing S17, Thr35, and two water molecules (WM1, WM2); the reactive water molecule W1; and an additional five water molecules in the active site were assigned to the QM subsystem, whereas the rest of the protein and solvent shells constituted the MM part. The energies and energy gradients in QM were computed using the density functional theory (DFT) level with the range-separated ωB97X functional [30] with the D3 dispersion correction [31]. The 6-31G** basis set was employed. The MM part was described with the CHARMM36 force field [27]. The trajectories were computed using the software stack of NAMD [32] and TeraChem [33] using an appropriate interface [34].
Trajectories of a total length of over 450 ps (with the 1 fs integration time step) were produced in these runs. The selected segments of collective variables (CV) were divided into windows, and each sampling window accounted for about 10 ps; force constants of additional harmonic potentials were 10–40 kcal/mol/Å2. The umbrella integration and weighted histogram analysis were utilized to construct the Gibbs energy profiles [35]. The MDAnalysis software [36] was also employed to analyze molecular dynamics trajectories.
The ‘psf’ topology files, the NAMD coordinates, and the ‘config’ files, as well as the ‘jupyter notebook’ files used to extract data from the MD trajectories and the extracted data are available in the general-purpose, open-access repository ZENODO (accessed via https://doi.org/10.5281/zenodo.7811133; last access on 27 May 2023).

3. Results

3.1. Classical Molecular Dynamics Reveals Non-Reactive and Reactive ES Complexes

The initial position of the R1276GAP side chain in classical MD runs was as that in the crystal structure PDB 6OB2. Part of trajectories left the arginine finger aside the active site; however, several trajectories favor approaching it to the γ-phosphate of GTP. Below, we analyze only protein conformations with the arginine finger inside the active site.
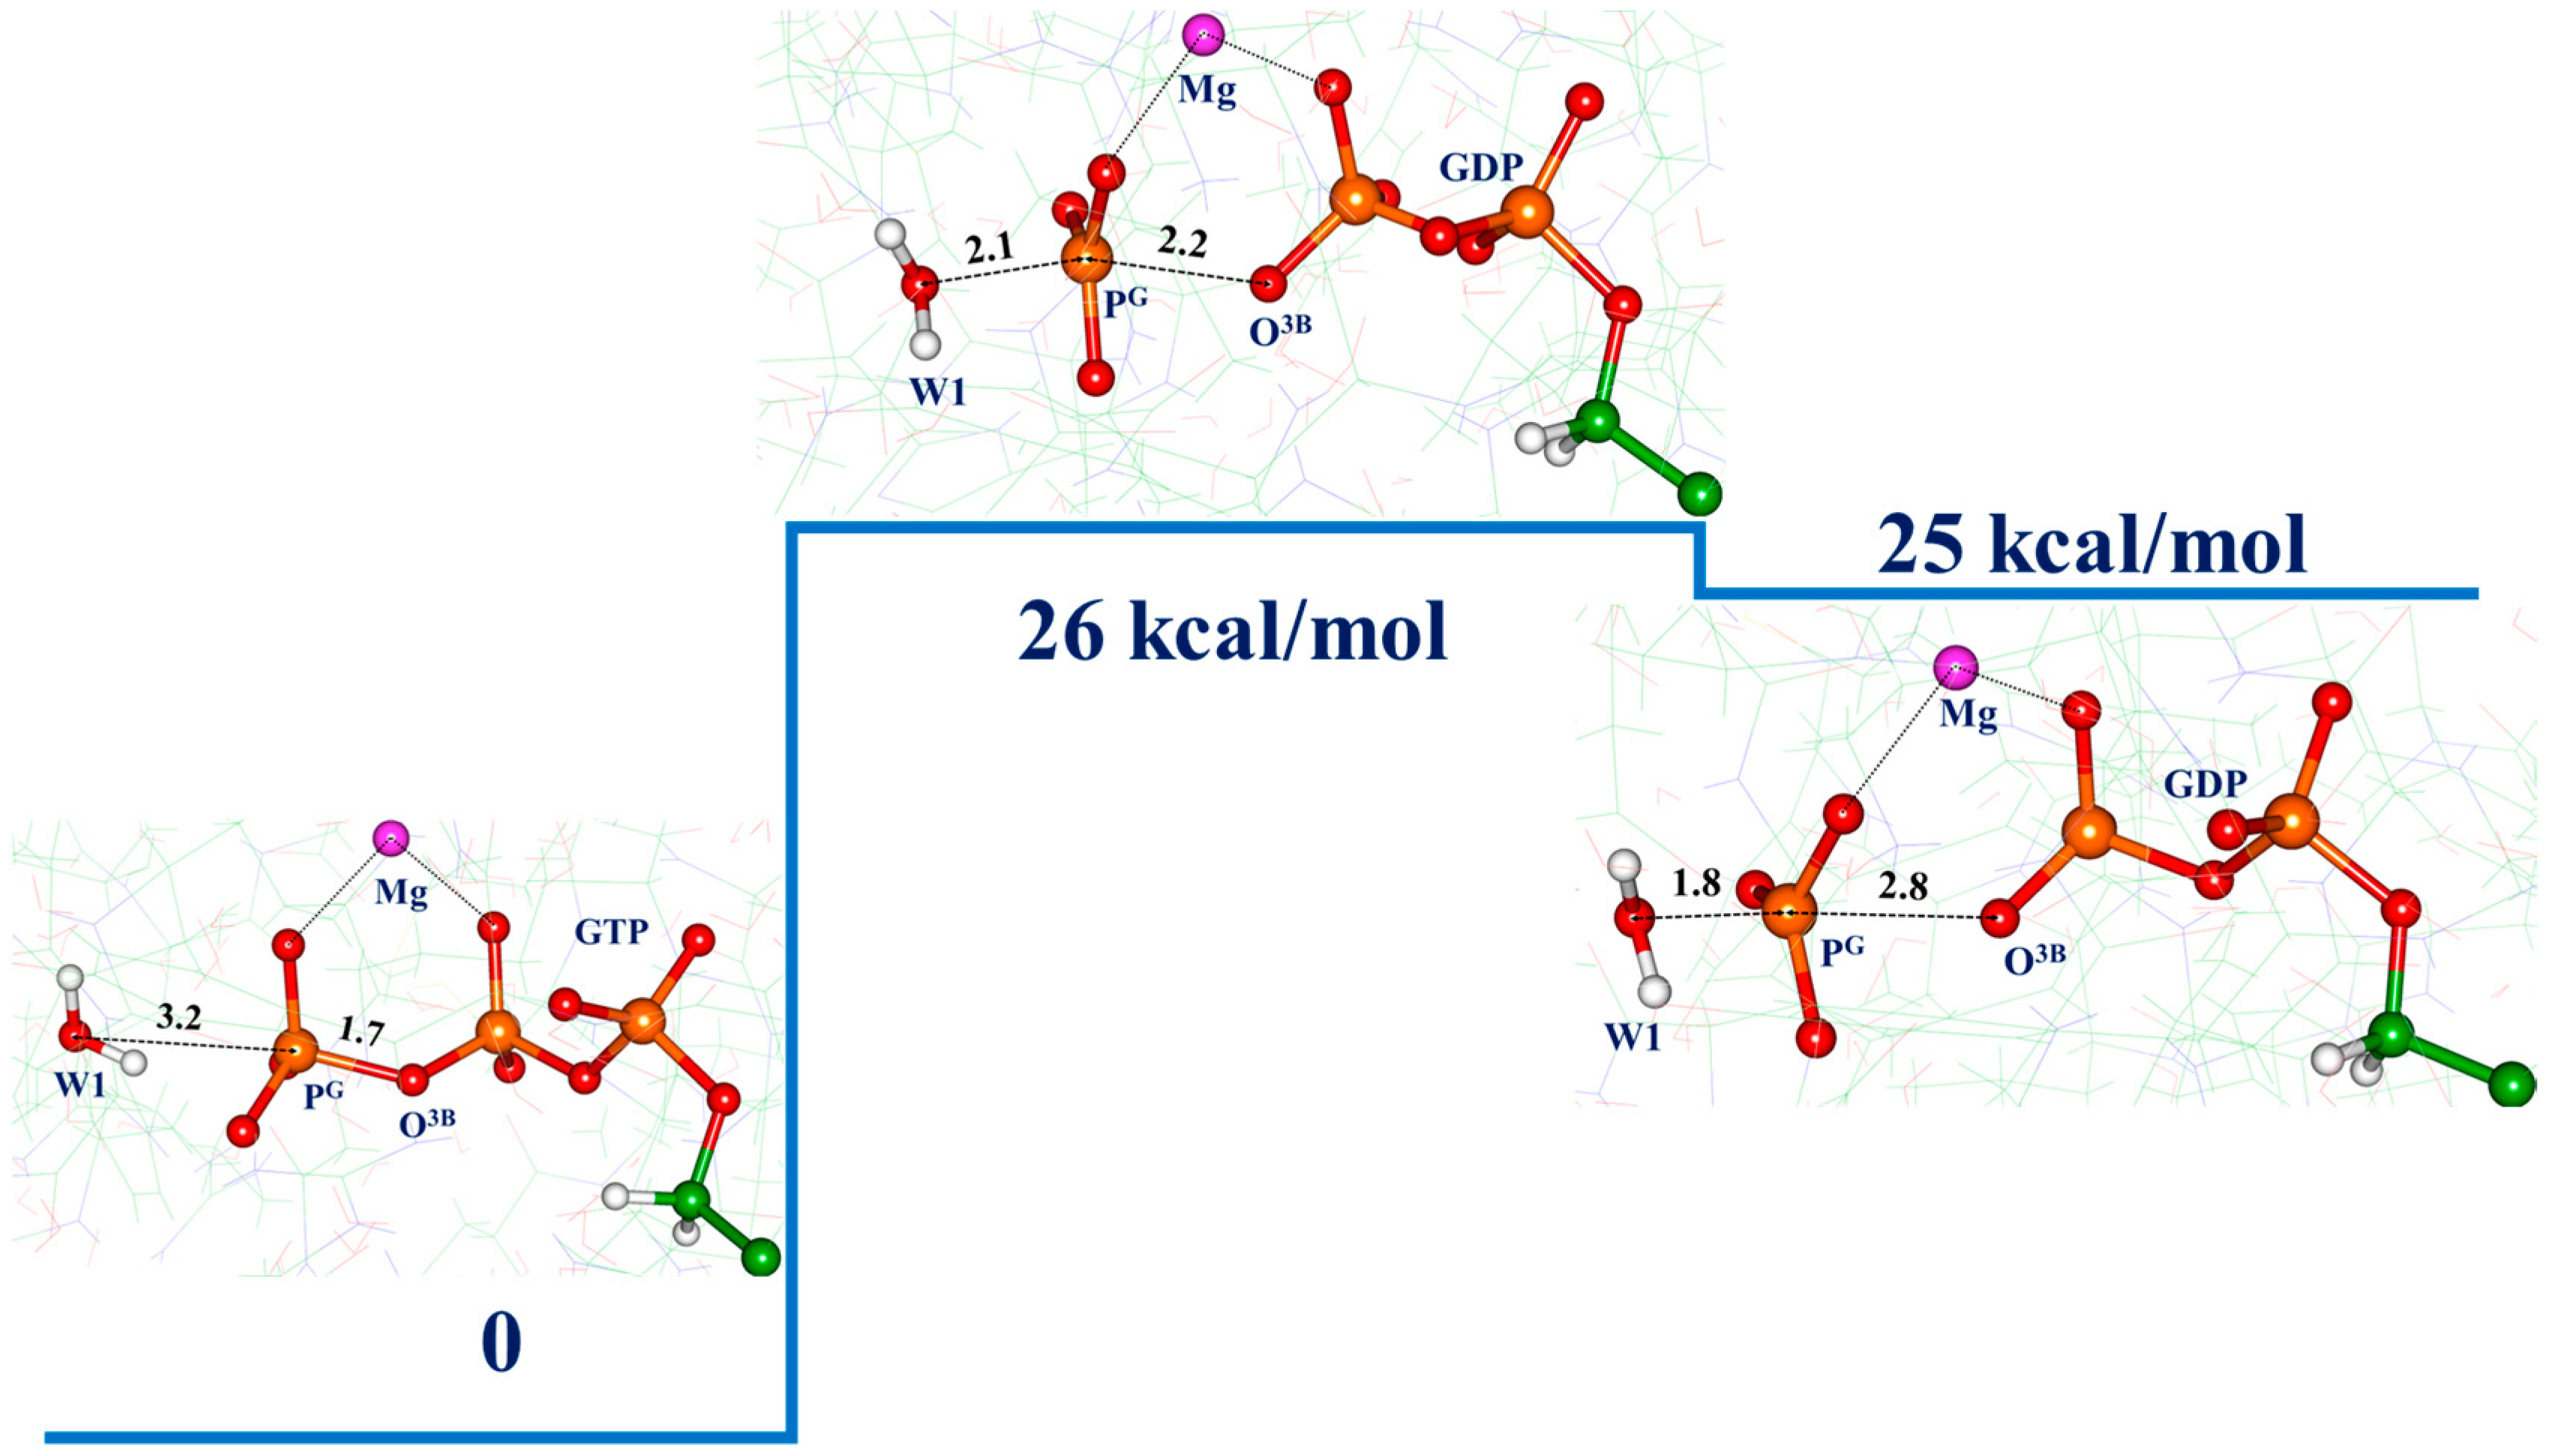
From the results of classical MD simulations, we distinguish two major conformations of the KRas(GTP)-NF1 complex. The first is the conformation with the glutamine Q61 side chain turned away from the γ-phosphate group of GTP. As we see below, subsequent QM/MM MD calculations of the Gibbs energy profiles show that the pathway initiated by this ES conformation corresponds to a high activation barrier of the GTP → GDP reaction, far exceeding the estimates (16 kcal/mol) from the kinetic experiments [25]. Therefore, this is an unlikely pathway, and we call the corresponding ES complex a non-reactive one. Reactive ES complex is characterized by a different orientation of the Q61 side chain, and subsequent calculations of the Gibbs energy profiles initiated from this complex result in reasonable reaction pathways. Figure 2 shows typical structures in the vicinity of the non-reactive and reactive ES complexes observed along MD trajectories. The interatomic distances presented in the figures correspond to the mean distances obtained in QM/MM MD runs initiated from the selected frames in classical MD.
Consistently with the comments in Ref. [24] about an 8° rotation and a 1.8 Å transition of the GAP domain of NF1 upon moving to the transition state, we obtain the 3.1 ± 0.5 Å transition and 8.7 ± 2.3° rotation of the GAP domain relative to the initial PDB 6OB2 crystal structure during the last 150 ns of the classical MD trajectory. To carry out the corresponding analysis, the RAS domain backbone of the trajectory frames was aligned to the initial crystal structure, whereas the GAP domain translation was measured via the center of mass of the GAP domain backbone and the principal axes of inertia of GAP domain backbone.
In the following subsections, we describe the results of Gibbs energy calculations initiated from non-reactive and reactive ES complexes performed at the QM/MM MD level.

3.2. Molecular Dynamics with QM/MM Potentials Initiated with Non-Reactive ES

As seen in Figure 2a, the nucleophilic water molecule W1 is located fairly close to the target PG atom of GTP. (The O(W1)-PG distance is 3.1 Å; however, it is poorly oriented for an efficient attack.) Selection of a collective variable as a combination of the key distances, CV = d(O3B-PG)-d(PG-O(W1)), allowed us to compute the Gibbs energy profile shown in Figure 3. The insets illustrate the most essential changes with the reactants, H2O (W1) and GTP; the distances shown in Å refer to the mean values over corresponding trajectory windows.
We see the expected qualitative structural changes along this pathway—upon approaching the nucleophilic water molecule W1 to the γ-phosphate group of GTP, the inversion of the PGO3 moiety takes place with an almost planar arrangement at the energy barrier, and the cleavage of the PG–O3B bond occurs. However, the energy barrier is too high—more than 25 kcal/mol. We remind the reader that the kinetic studies described in Ref. [25] report the rate constant 19.5 s−1 for the chemical step of GTP hydrolysis in Ras-NF1 corresponding to the activation barrier of 16 kcal/mol.
It is unlikely that this pathway is consistent with the efficient hydrolysis reaction despite the close position of R1276GAP to the active site. It seems that it is not enough to insert the arginine finger into the active site; the glutamine Q61 side chain should be properly oriented as well. We point out that replacement of glutamine by arginine at position 61 in KRas-NF1 resulted in complete loss of hydrolysis activity [24].

3.3. Molecular Dynamics with QM/MM Potentials Initiated with Reactive ES

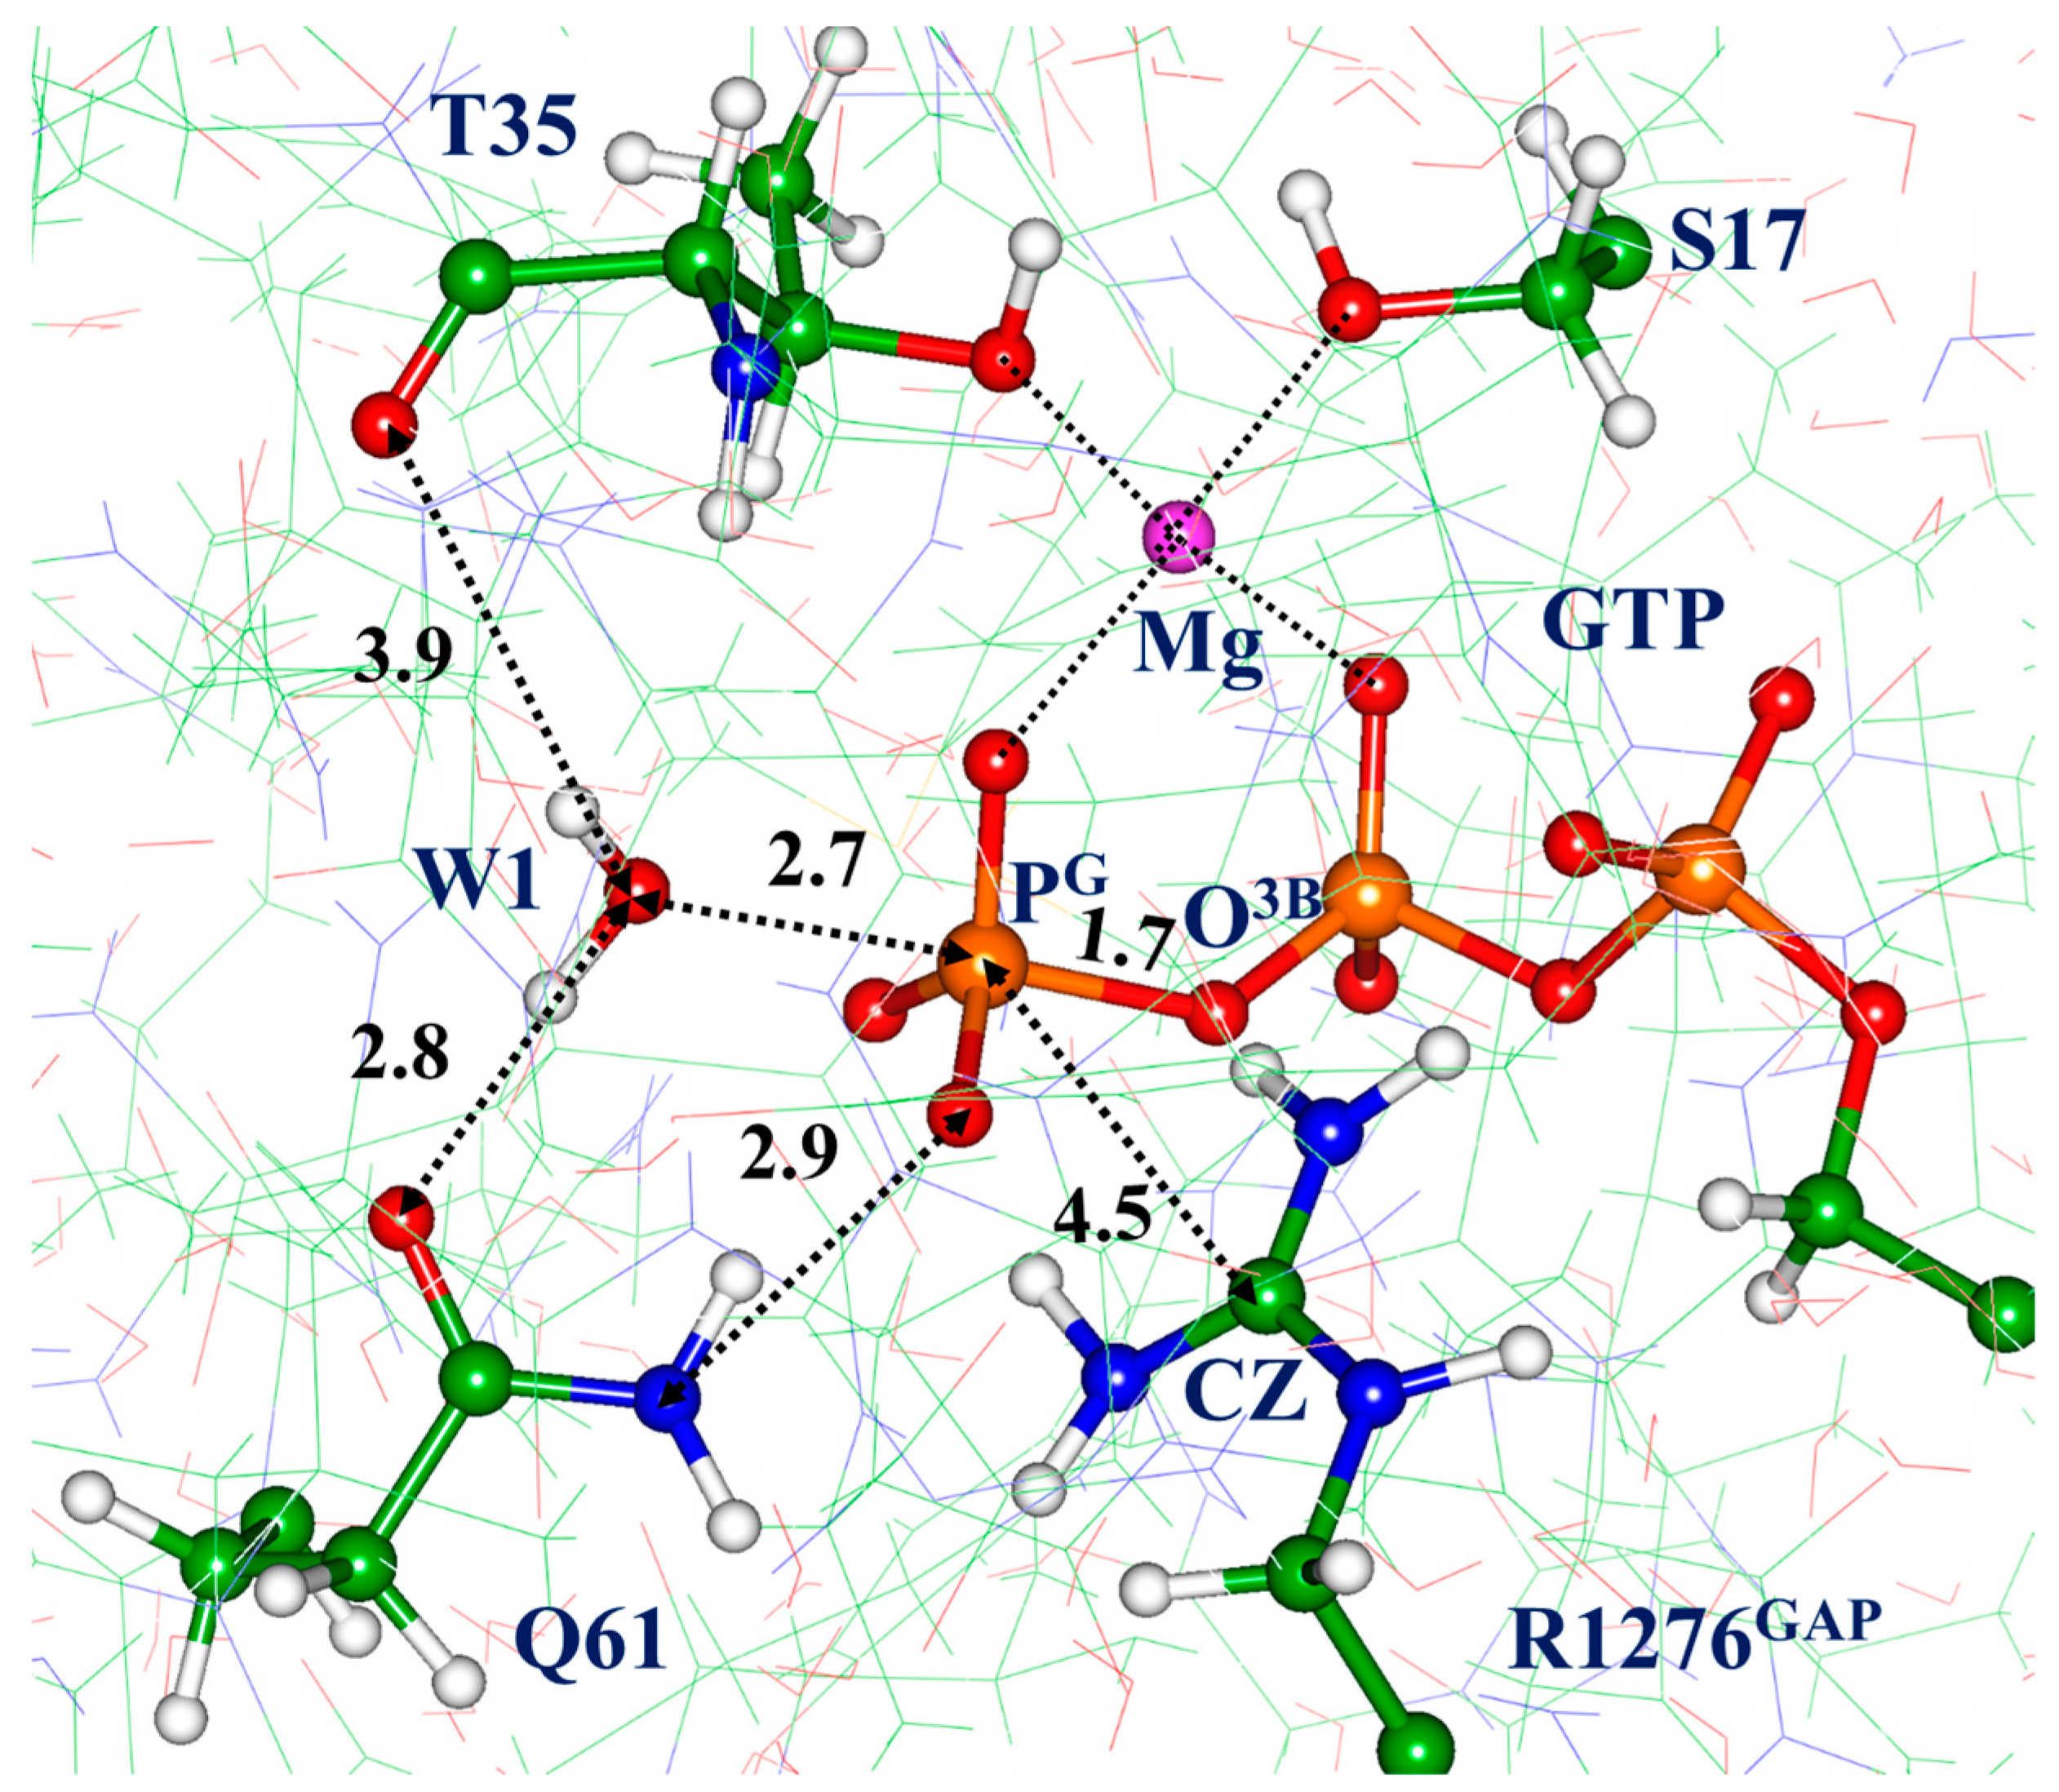
Now we turn to QM/MM MD simulations initiated with reactive ES (Figure 2b). First of all, we note that the use of the same collective variable as before, i.e., CV = d(O3B-PG)-d(PG-O(W1), allowed us to reach another conformation illustrated in Figure 4 (for the CV values exceeding −1 Å). Although its energy is 4 kcal/mol higher than that of the initial structure, at this conformation the nucleophilic water molecule W1 is located properly for the nucleophilic attack on the PG atom of the GTP. This structure shows common features of the reactants observed in previous modeling of the GTP hydrolysis reaction in HRas-p120GAP using the static QM/MM approach [19,20,21,22]. The major difference of the present structure of the active site from that in the HRas-p120GAP complex is a longer distance between the O(T35) and O(W1) atoms. Nevertheless, W1 is properly coordinated by Q61, and T35, the O(W1) − PG –O3B atoms, make an almost linear chain. Moreover, the KRas-NF1 model includes additional W2 and W3 water molecules that are absent in the HRas-p120GAP complex. In previous QM/MM simulations for the HRas-p120GAP complex, a potential energy reaction profile leads to a low energy pathway corresponding to the so-called glutamine-assisted mechanism [21,22].
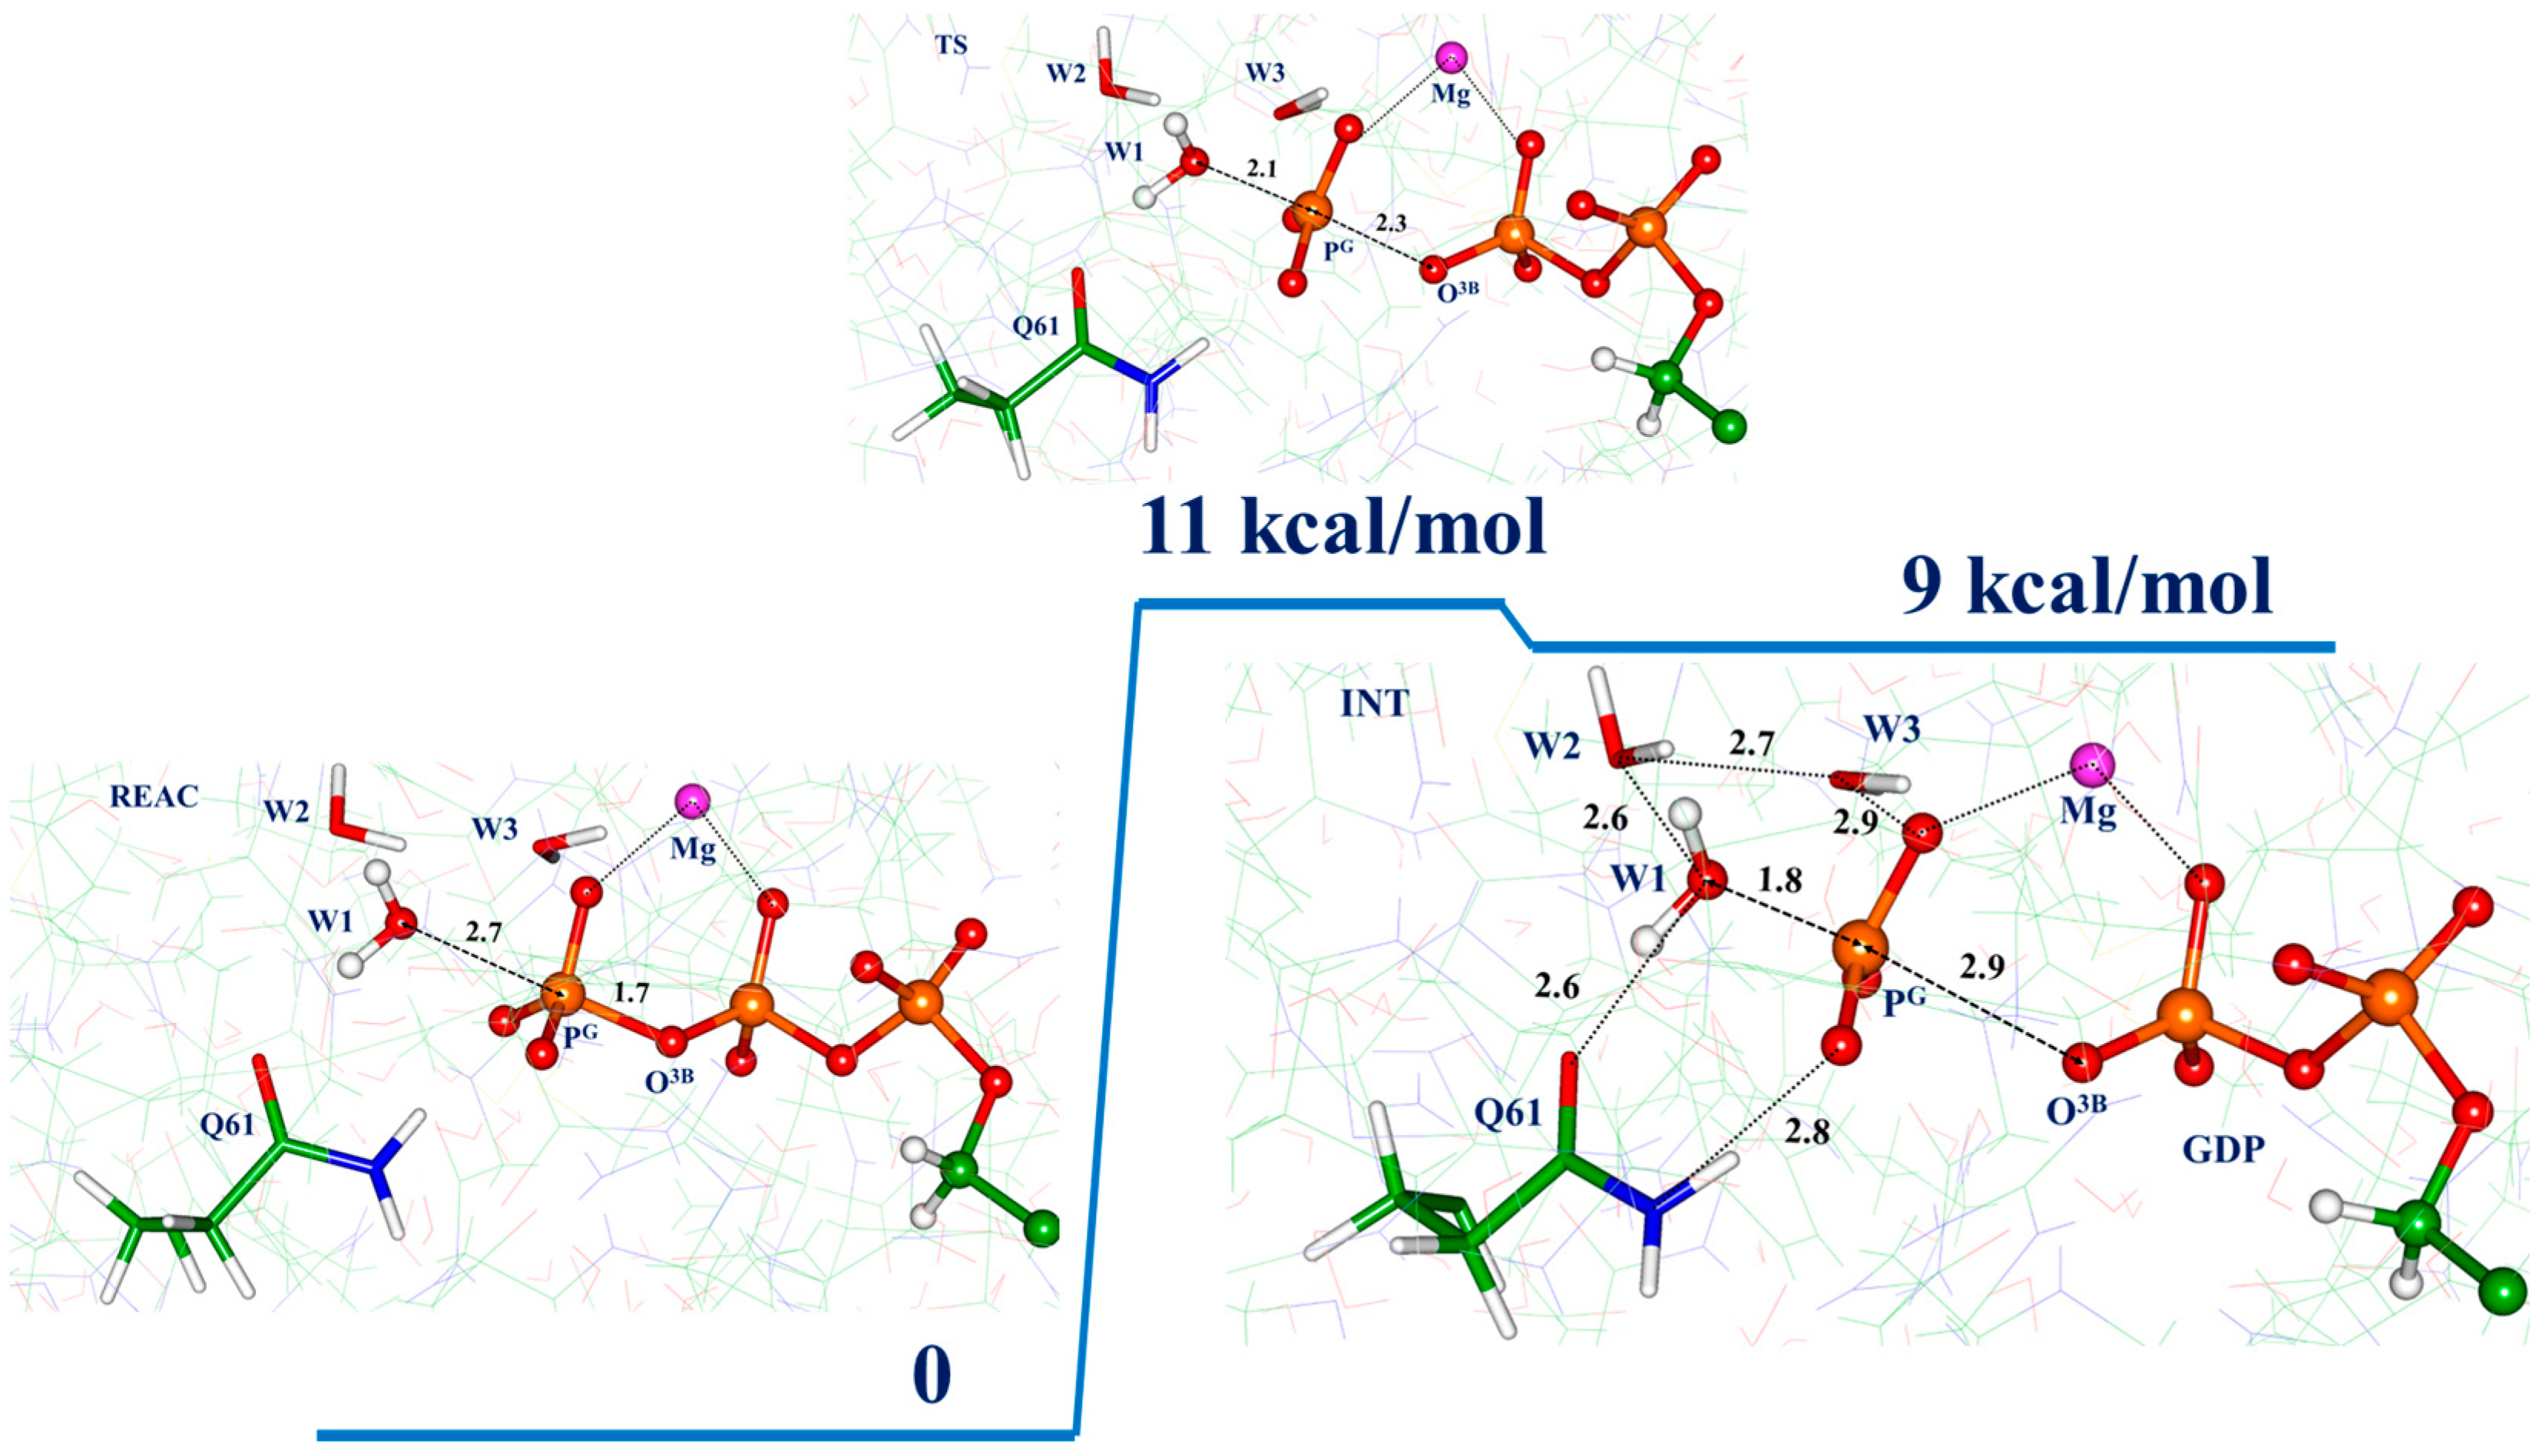
We consider the structure illustrated in Figure 4 as consistent with the reactants (REAC). Correspondingly, we shall cite below the free energies computed in QM/MM MD calculations for other structures along reaction pathways as counted from the level of REAC. Further evolution along the coordinate CV = d(O3B-PG)-d(PG-O(W1) leads to the Gibbs energy profile shown in Figure 5. We show in the insets the molecular groups directly involved in transformations. The primary reactants, W1 and GTP, are shown in balls and sticks, whereas other important groups—which actively participate in the reaction at subsequent steps; namely, the side chain of Q61 and two water molecules, W1 and W2— are shown in sticks.
After passing the transition state (TS) with an almost planar arrangement of the PGO3 moiety, the system occurs at the configuration of a reaction intermediate (INT). The energies of the TS and INT states are 11 and 9 kcal/mol, respectively. In the INT structure, the PG–O3B bond is cleaved, but the inorganic phosphate is not yet formed.
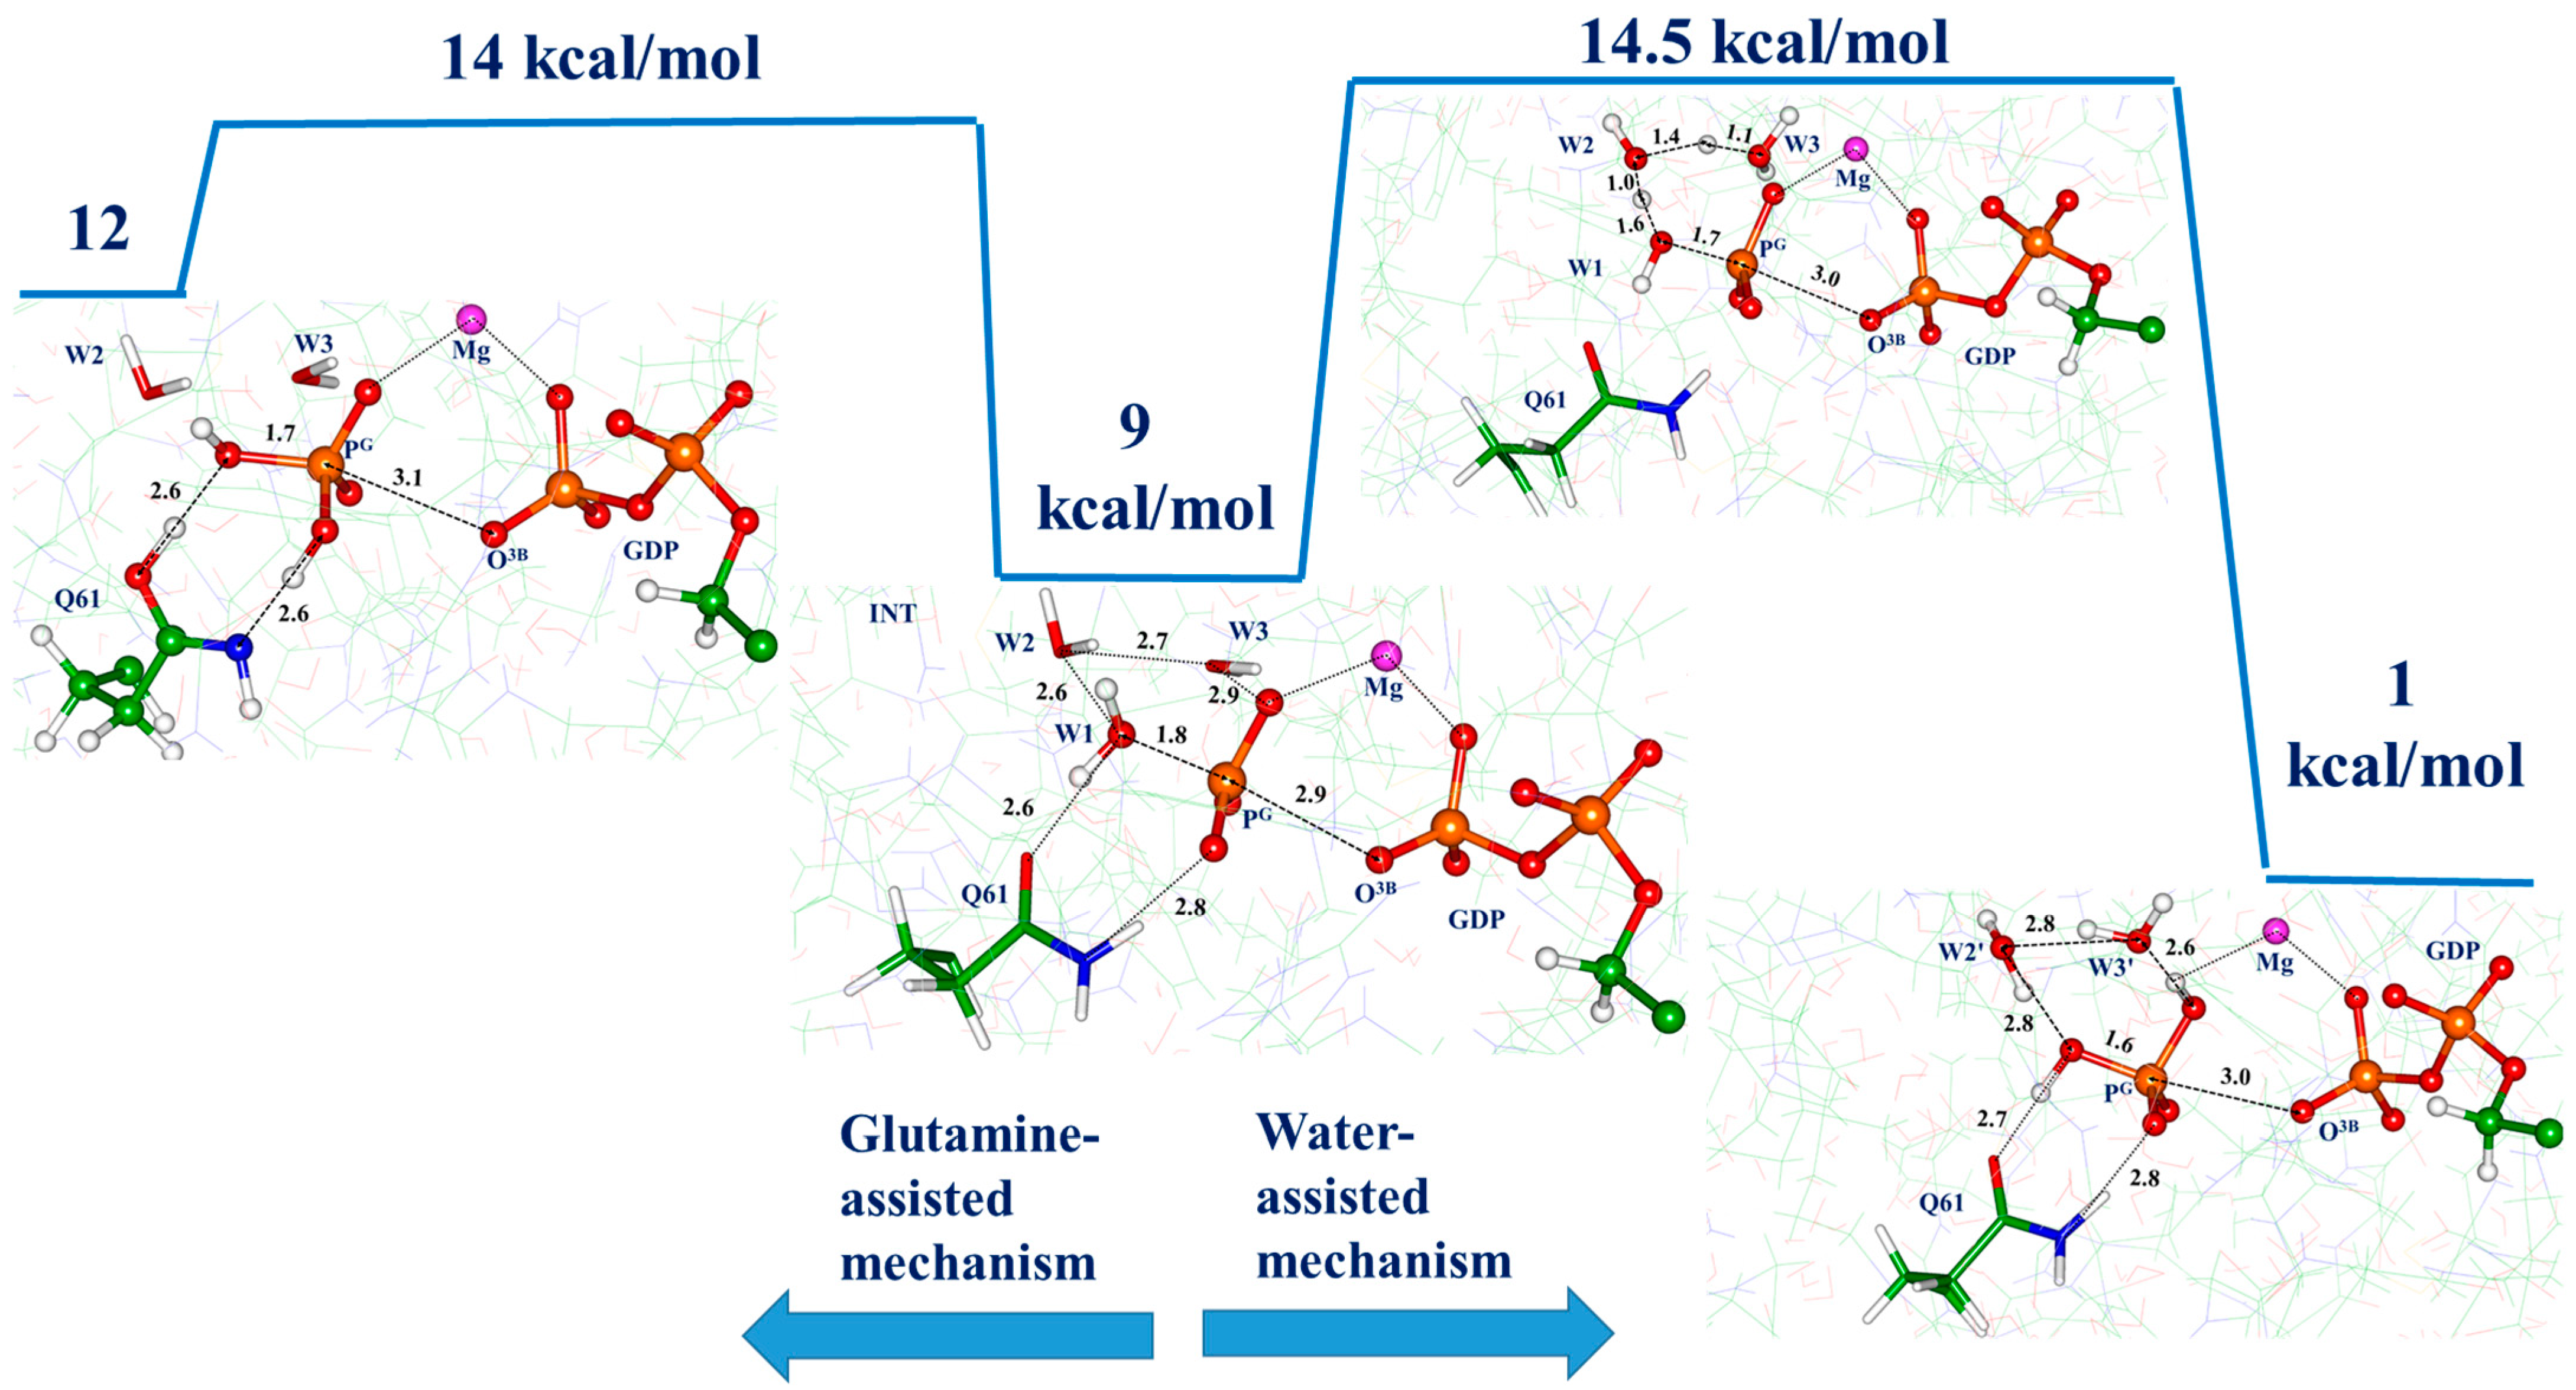
The first option is to explore the glutamine-assisted mechanism as for the HRas-p120GAP in Refs. [21,22]. This mechanism assumes tautomerization of the Q61 side chain to construct the inorganic phosphate. The left side in Figure 6 shows that conformations with the glutamine Q61 tautomer and the inorganic phosphate are observed along the reaction coordinate CV = −d(PG-O(W1)) + d(O(W1)-H(W1)) − d(H(W1)-OE1(Gln)) + d(NE2(Gln)-H(Gln)) − d(H(Gln)-O2G). The activation energy is about 5 kcal/mol from the level of INT, giving rise to a total barrier of about 14 kcal/mol. The problem with this pathway is that the minimum energy structure after the barrier is located higher (12 kcal/mol) than the level of INT (9 kcal/mol). Therefore, this pathway is hardly productive for the GTP hydrolysis in this model system.
Another option is to explore a proton wire route to obtain the inorganic phosphate as shown in the right side in Figure 6, although the role of the glutamine Q61 side chain is important as well—this time to coordinate properly the W1 molecule. The two water molecules W2 and W3 (besides the nucleophile water W1) in the active site participate in the proton transfer helping to accomplish the reaction. The activation barrier along this route (CV = −d(PG-O(W1)) + d(O(W1)-H(W1)) − d(H(W1)-O(W2)) + d(O(W2)-H(W2)) − d(H(W2)-O(W3) + d(O(W3)-H(W3) − d(H(W3)-O1G)) is 14.5 kcal/mol (consistent with the experimental estimate of 16 kcal/mol [25]), and the energy of the products is well below the level of INT. We consider this reaction pathway as the dominant channel in the chemical step of the GTP hydrolysis in the KRas-NF1 complex.

4. Discussion

It is hard to overestimate the significance of a reference crystal structure for successful simulations of the reaction mechanism in the enzyme active site using molecular modeling approaches. The predominant majority of previous efforts to dissect the reaction mechanism of GTP hydrolysis in the Ras-GAP protein complex were based on the crystal structure PDB 1WQ1 [8]. It refers to the HRas-p120GAP system containing a GTP analog (GDP and AlF3), presumably, in the conformation of a transition state. We emphasize the following features of this structure (see Figure 1b): (i) the arginine finger R789GAP is inserted deeply to the active site (the CZ(Arg)-PG(GTP) distance is 4.3 Å); (ii) the side chain of the glutamine residue Q61 is in a position capable of orienting the catalytic water molecule for a nucleophilic attack on the PG atom of the γ-phosphate (the O(Gln)-O(W1) distance is 2.8 Å; the O(W1)-PG(GTP) distance is 2.8 Å); (iii) there is space to accommodate only one water molecule in the active site. Calculations of the reaction energy profiles initiated by this crystal structure resulted in a variety of mechanistic proposals for the reaction mechanisms [9,10,11,12,13,14,15,16,17,18,19,20,21,22]. The most restricting condition for simulations is a requirement to consider only one water molecule in the reacting particles.
The crystal structure PDB 6OB2 for the KRas-NF1 complex [24] presents an alternative starting point for molecular modeling of the Ras-GAP catalyzed GTP hydrolysis reaction. It contains another GTP analog, the GMPPNP species, and the protein conformation, most likely, resembles an enzyme-substrate complex but not a transition state structure.
As obtained in the present work, model systems initiated from the crystal structure PDB 6OB2 and observed in large-scale MD simulations may refer to non-reactive and reactive enzyme-substrate complexes. Calculations of the Gibbs reaction energy profiles carried out at the high QM(DFT)/MM MD level confirm the significance of the arginine finger (here, the R1276GAP), as well as the significance of a proper orientation of the glutamine Q61 side chain to construct reactive ES complexes.
The non-reactive ES conformation may account for the so-called substrate-assisted mechanism of GTP hydrolysis in Ras-GAP [37]. We show that this mechanism in the KRas-NF1 system is associated with a fairly high activation barrier, inconsistent with the kinetic measurements. The reactive ES conformations initiate reaction mechanisms consistent with the measured rate constant of the chemical step of GTP hydrolysis in KRas-NF1. It requires participation of the glutamine Q61 side chain and the water molecules present in the active site. In this respect, the structure PDB 6OB2 provides a starting point for molecular simulations of GTP hydrolysis in Ras-GAP systems which differs from that initiated by the structure PDB 1WQ1. The latter excludes the accommodation of additional water molecule(s) in the active space besides the nucleophilic one. However, it should be noted that the crystal structure PDB 6OB2 does not contain the entire GAP macromolecule; for technical reasons, the authors of Ref. [24] could crystallize only a fraction of the NF1 molecule bound to the KRas protein.
Other details of a computational protocol besides selection of a reference crystal structure are significant as well. The results of experimental studies of the GTP hydrolysis in another GTPase [38] show that the activity optimum corresponds to pH 6; therefore, we apply here a manual assignment of protons to the polar residues consistent with physiological pH values. A consistent computational strategy would be to estimate the pKa of ionizable residues directly (e.g., Refs. [39,40,41,42]). A more careful treatment of the long-range electrostatic effects in MD simulations in model protein systems surrounded by water molecules (e.g., [43,44]) could improve the obtained low exothermicity of the GTP hydrolysis reaction (−1 kcal/mol, Figure 6). The choice of a functional for DFT calculations of energies and energy derivatives in QM is always a matter of strong consideration. We apply here the long-range corrected hybrid ωB97X functional [30], although the use of other modern variants, e.g., of the M06 suite, may improve the energy profiles.
Finally, it should be noted that the Empirical Valence Bond theory [45,46] is actively used for studies of GTP hydrolysis [9,10,11,12,13] and other enzyme-catalyzed reactions [47,48]. However, we emphasize the significance of MD simulations with the QM(DFT)/MM potentials for construction of the Gibbs energy profiles, which are now becoming available. Despite multiple attempts to dissect the mechanism of GTP hydrolysis in GTPases using molecular modeling tools, few papers describe the applications of MD with quantum-based potentials to evaluate free energy reaction profiles (e.g., [23,49]) but employing a lower level of theory. The present paper is a first approach in which the atom-centered basis functions and a reliable DFT functional (ωB97X-D3) in QM for calculations of reaction free energy profiles upon GTP hydrolysis in Ras-GAP systems are applied.

5. Conclusions

This paper reports the following novel aspects of the important enzyme-catalyzed reaction of GTP hydrolysis with the Ras-GAP protein complexes. We apply modern methods of molecular modeling to construct the Gibbs energy reaction profiles for the chemical step of GTP hydrolysis in the KRas-NF1 system. Specifically, we use molecular dynamics simulations based on the quantum mechanics/molecular mechanics interaction potentials (the QM(DFT)/MM MD approach) with the ωB97X-D3/6-31G** scheme in QM and the CHARMM36 force field parameters in MM. The QM subsystem in these on-the-fly calculations of energies and forces includes 94 atoms comprising important molecular groups in the active site, whereas the entire water-solvated protein complex includes more than 47,000 atoms. These large-scale calculations allowed us to analyze several scenarios for the mechanism of the NF1(GAP)-stimulated GTP hydrolysis from KRas taking the crystal structure PDB 6OB2 of the KRas-NF1 complex with a GTP analog as an initial source of atomic coordinates. We show that a proper orientation of the “arginine finger”, here, the R1276 residue from NF1, as well as of the glutamine residue Q61 from KRas is required for obtaining the free energy profiles consistent with the results of kinetic measurements. The most likely scenario of the chemical step of the GTP hydrolysis in KRas-NF1 corresponds to the water-assisted mechanism of the formation of the inorganic phosphate coupled with the dissociation of GTP to GDP.

Author Contributions

Conceptualization, I.P. and A.N.; methodology, I.P.; validation, I.P.; formal analysis, I.P. and A.N.; investigation, I.P.; data curation, I.P. and A.N.; writing—original draft preparation, A.N.; writing—review and editing, I.P. and A.N.; visualization, I.P. and A.N.; supervision, A.N.; project administration, A.N.; funding acquisition, I.P. and A.N. All authors have read and agreed to the published version of the manuscript.

Funding

This research was funded by the Russian Science Foundation, grant number 19-73-20032.

Data Availability Statement

The data extracted from the MD trajectories and used to produce Figure 2, Figure 3, Figure 4, Figure 5 and Figure 6 are available at the general-purpose, open-access repository ZENODO (accessed via https://doi.org/10.5281/zenodo.7811133; last accessed on 27 May 2023).

Acknowledgments

The research was carried out using the equipment of the shared research facilities of high-performance computing resources at Lomonosov Moscow State University. The use of supercomputer resources of the Joint Supercomputer Center of the Russian Academy of Sciences is acknowledged.

Conflicts of Interest

The authors declare no conflict of interest.

References

  1. Fernández-Medarde, A.; De Las Rivas, J.; Santos, E. 40 Years of RAS—A Historic Overview. Genes 2021, 12, 681. [Google Scholar] [CrossRef] [PubMed]
  2. Hobbs, G.A.; Der, C.J.; Rossman, K.L. RAS isoforms and mutations in cancer at a glance. J. Cell Sci. 2016, 129, 1287–1292. [Google Scholar] [CrossRef]
  3. Cox, A.D.; Der, C.J. Ras History: The Saga Continues. Small GTPases 2010, 1, 2–27. [Google Scholar] [CrossRef] [PubMed]
  4. Lu, S.; Jang, H.; Muratcioglu, S.; Gursoy, A.; Keskin, O.; Nussinov, R.; Zhang, J. Ras Conformational Ensembles, Allostery, and Signaling. Chem. Rev. 2016, 116, 6607–6665. [Google Scholar] [CrossRef] [PubMed]
  5. Lu, S.; Jang, H.; Nussinov, R.; Zhang, J. The Structural Basis of Oncogenic Mutations G12, G13 and Q61 in Small GTPase K-Ras4B. Sci. Rep. 2016, 6, 21949. [Google Scholar] [CrossRef] [PubMed]
  6. Mishra, A.K.; Lambright, D.G. Small GTPases and Their GAPs. Biopolymers 2016, 105, 431–448. [Google Scholar] [CrossRef] [PubMed]
  7. Berman, H.M.; Westbrook, J.; Feng, Z.; Gilliland, G.; Bhat, T.N.; Weissig, H.; Shindyalov, N.; Bourne, P.E. The protein data bank. Nucleic Acids Res. 2000, 28, 235–242. [Google Scholar] [CrossRef]
  8. Scheffzek, K.; Ahmadian, M.R.; Kabsch, W.; Wiesmuller, L.; Lautwein, A.; Schmitz, F.; Wittinghofer, A. The Ras-RasGAP Complex: Structural Basis for GTPase Activation and its Loss in Oncogenic Ras Mutants. Science 1997, 277, 333–338. [Google Scholar] [CrossRef]
  9. Glennon, T.M.; Villà, J.; Warshel, A. How Does GAP Catalyze the GTPase Reaction of Ras?: A Computer Simulation Study. Biochemistry 2000, 39, 9641–9651. [Google Scholar] [CrossRef]
  10. Prasad, B.R.; Plotnikov, N.V.; Lameira, J.; Warshel, A. Quantitative Exploration of the Molecular Origin of the Activation of GTPase. Proc. Natl. Acad. Sci. USA 2013, 110, 20509–20514. [Google Scholar] [CrossRef]
  11. Carvalho, A.T.P.; Szeler, K.; Vavitsas, K.; Åqvist, J.; Kamerlin, S.C.L. Modeling the Mechanisms of Biological GTP Hydrolysis. Arch. Biochem. Biophys. 2015, 582, 80–90. [Google Scholar] [CrossRef] [PubMed]
  12. Calixto, A.R.; Moreira, C.; Pabis, A.; Kötting, C.; Gerwert, K.; Rudack, T.; Kamerlin, S.C.L. GTP Hydrolysis Without an Active Site Base: A Unifying Mechanism for Ras and Related GTPases. J. Am. Chem. Soc. 2019, 141, 10684–10701. [Google Scholar] [CrossRef]
  13. Calixto, A.R.; Moreira, C.; Kamerlin, S.C.L. Recent Advances in Understanding Biological GTP Hydrolysis through Molecular Simulation. ACS Omega 2020, 5, 4380–4385. [Google Scholar] [CrossRef]
  14. Kotting, C.; Blessenohl, M.; Suveyzdis, Y.; Goody, R.S.; Wittinghofer, A.; Gerwert, K. A Phosphoryl Transfer Intermediate in the GTPase Reaction of Ras in Complex with its GTPase-Activating Protein. Proc. Natl. Acad. Sci. USA 2006, 103, 13911–13916. [Google Scholar] [CrossRef] [PubMed]
  15. te Heesen, H.; Gerwert, K.; Schlitter, J. Role of the Arginine Finger in Ras.RasGAP Revealed by QM/MM Calculations. FEBS Lett. 2007, 581, 5677–5684. [Google Scholar] [CrossRef]
  16. Kötting, C.; Kallenbach, A.; Suveyzdis, Y.; Wittinghofer, A.; Gerwert, K. The GAP Arginine Finger Movement into the Catalytic Site of Ras Increases the Activation Entropy. Proc. Natl. Acad. Sci. USA 2008, 105, 6260–6265. [Google Scholar] [CrossRef] [PubMed]
  17. Rudack, T.; Xia, F.; Schlitter, J.; Kötting, C.; Gerwert, K. Ras and GTPase-Activating Protein (GAP) Drive GTP into a Precatalytic State as Revealed by Combining FTIR and Biomolecular Simulations. Proc. Natl. Acad. Sci. USA 2012, 109, 15295–15300. [Google Scholar] [CrossRef]
  18. Nagy, G.N.; Suardíaz, R.; Lopata, A.; Ozohanics, O.; Vékey, K.; Brooks, B.R.; Leveles, I.; Tóth, J.; Vértessy, B.G.; Rosta, E. Structural Characterization of Arginine Fingers: Identification of an Arginine Finger for the Pyrophosphatase DUTPases. J. Am. Chem. Soc. 2016, 138, 15035–15045. [Google Scholar] [CrossRef]
  19. Grigorenko, B.L.; Nemukhin, A.V.; Topol, I.A.; Cachau, R.E.; Burt, S.K. QM/MM Modeling the Ras−GAP Catalyzed Hydrolysis of Guanosine Triphosphate. Proteins Struct. Funct. Genet. 2005, 60, 495–503. [Google Scholar] [CrossRef] [PubMed]
  20. Grigorenko, B.L.; Nemukhin, A.V.; Shadrina, M.S.; Topol, I.A.; Burt, S.K. Mechanisms of Guanosine Triphosphate Hydrolysis by Ras and Ras-GAP Proteins as Rationalized by Ab Initio QM/MM Simulations. Proteins Struct. Funct. Genet. 2007, 66, 456–466. [Google Scholar] [CrossRef]
  21. Khrenova, M.G.; Grigorenko, B.L.; Kolomeisky, A.B.; Nemukhin, A.V. Hydrolysis of Guanosine Triphosphate (GTP) by the Ras·GAP Protein Complex: Reaction Mechanism and Kinetic Scheme. J. Phys. Chem. B 2015, 119, 12838–12845. [Google Scholar] [CrossRef]
  22. Grigorenko, B.L.; Kots, E.D.; Nemukhin, A.V. Diversity of Mechanisms in Ras–GAP Catalysis of Guanosine Triphosphate Hydrolysis Revealed by Molecular Modeling. Org. Biomol. Chem. 2019, 17, 4879–4891. [Google Scholar] [CrossRef]
  23. Cavalli, A.; Carloni, P. Enzymatic GTP Hydrolysis: Insights from an Ab Initio Molecular Dynamics Study. J. Am. Chem. Soc. 2002, 124, 3763–3768. [Google Scholar] [CrossRef]
  24. Rabara, D.; Tran, T.H.; Dharmaiah, S.; Stephens, R.M.; McCormick, F.; Simanshu, D.K. Holderfield. Proc. Natl. Acad. Sci. USA 2019, 116, 22122–22131. [Google Scholar] [CrossRef]
  25. Phillips, R.A.; Hunter, J.L.; Eccleston, J.F.; Webb, M.R. The Mechanism of Ras GTPase Activation by Neurofibromin. Biochemistry 2003, 42, 3956–3965. [Google Scholar] [CrossRef] [PubMed]
  26. Humphrey, W.; Dalke, A.; Schulten, K. VMD: Visual molecular dynamics. J. Mol. Graph. 1996, 14, 33–38. [Google Scholar] [CrossRef] [PubMed]
  27. Best, R.B.; Zhu, X.; Shim, J.; Lopes, P.E.M.; Mittal, J.; Feig, M.; MacKerell, A.D. Optimization of the Additive CHARMM All-Atom Protein Force Field Targeting Improved Sampling of the Backbone ϕ, ψ and Side-Chain χ1 and χ2 Dihedral Angles. J. Chem. Theory Comput. 2012, 8, 3257–3273. [Google Scholar] [CrossRef] [PubMed]
  28. Yu, W.; He, X.; Vanommeslaeghe, K.; MacKerell, A.D. Extension of the CHARMM general force field to sulfonyl-containing compounds and its utility in biomolecular simulations. J. Comp. Chem. 2012, 33, 2451–2468. [Google Scholar] [CrossRef] [PubMed]
  29. Phillips, J.C.; Hardy, D.J.; Maia, J.D.C.; Stone, J.E.; Ribeiro, J.V.; Bernardi, R.C.; Buch, R.; Fiorin, G.; Hénin, J.; Jiang, W.; et al. Scalable Molecular Dynamics on CPU and GPU Architectures with NAMD. J. Chem. Phys. 2020, 153, 044130. [Google Scholar] [CrossRef]
  30. Chai, J.-D.; Head-Gordon, M. Long-range corrected hybrid density functionals with damped atom–atom dispersion corrections. Phys. Chem. Chem. Phys. 2008, 10, 6615–6620. [Google Scholar] [CrossRef]
  31. Grimme, S.; Ehrlich, S.; Goerigk, L. Effect of the damping function in dispersion corrected density functional theory. J. Comput. Chem. 2011, 32, 1456–1465. [Google Scholar] [CrossRef] [PubMed]
  32. Melo, M.C.R.; Bernardi, R.C.; Rudack, T.; Scheurer, M.; Riplinger, C.; Phillips, J.C.; Maia, J.D.C.; Rocha, G.B.; Ribeiro, J.V.; Stone, J.E.; et al. NAMD Goes Quantum: An Integrative Suite for Hybrid Simulations. Nat. Methods 2018, 15, 351–354. [Google Scholar] [CrossRef]
  33. Seritan, S.; Bannwarth, C.; Fales, B.S.; Hohenstein, E.G.; Isborn, C.M.; KokkilaSchumacher, S.I.L.; Li, X.; Liu, F.; Luehr, N.; Snyder, J.W., Jr.; et al. Terachem: A graphical processing unit-accelerated electronic structure package for large-scale ab initio molecular dynamics. WIREs Comput. Mol. Sci. 2021, 11, e1494. [Google Scholar] [CrossRef]
  34. Khrenova, M.G.; Polyakov, I.V.; Nemukhin, A.V. Molecular Dynamics of Enzyme-Substrate Complexes in Guanosine Trifosphate-Binding Proteins. Rus. J. Phys. Chem. B 2022, 16, 455–460. [Google Scholar] [CrossRef]
  35. Kästner, J.; Thiel, W. Bridging the Gap between Thermodynamic Integration and Umbrella Sampling Provides a Novel Analysis Method: “Umbrella Integration”. J. Chem. Phys. 2005, 123, 144104. [Google Scholar] [CrossRef]
  36. Michaud-Agrawal, N.; Denning, E.J.; Woolf, T.B.; Beckstein, O. MDAnalysis: A Toolkit for the Analysis of Molecular Dynamics Simulations. J. Comput. Chem. 2011, 32, 2319–2327. [Google Scholar] [CrossRef]
  37. Schweins, T.; Geyer, M.; Scheffzek, K.; Warshel, A.; Kalbitzer, H.R.; Wittinghofer, A. Substrate-Assisted Catalysis as a Mechanism for GTP Hydrolysis of p21ras and other GTP-Binding Proteins. Nat. Struct. Biol. 1995, 2, 36–44. [Google Scholar] [CrossRef]
  38. Seo, H.S.; Jeong, J.Y.; Nahm, M.Y.; Kim, S.W.; Lee, S.Y.; Bahk, J.D. The effect of pH and various cations on the GTP hydrolysis of rice heterotrimeric G-protein alpha subunit expressed in Escherichia coli. J. Biochem. Mol. Biol. 2003, 36, 196–200. [Google Scholar] [CrossRef]
  39. Stivers, J.T.; Abeygunawardana, C.; Mildvan, A.S.; Hajipour, G.; Whitman, C.P. 4-Oxalocrotonate Tautomerase:  pH Dependence of Catalysis and pKa Values of Active Site Residues. Biochemistry 1996, 35, 814–823. [Google Scholar] [CrossRef] [PubMed]
  40. Sham, Y.Y.; Chu, Z.T.; Warshel, A. Consistent Calculations of pKa’s of Ionizable Residues in Proteins:  Semi-microscopic and Microscopic Approaches. J. Phys. Chem. B 1997, 101, 4458–4472. [Google Scholar] [CrossRef]
  41. Czerwinski, R.M.; Harris, T.K.; Massiah, M.A.; Mildvan, A.S.; Whitman, C.P. The structural basis for the perturbed pKa of the catalytic base in 4-oxalocrotonate tautomerase: Kinetic and structural effects of mutations of Phe-50. Biochemistry 2001, 40, 1984–1985. [Google Scholar] [CrossRef]
  42. Repič, M.; Purg, M.; Vianello, R.; Mavri, J. Examining Electrostatic Preorganization in Monoamine Oxidases A and B by Structural Comparison and pKa Calculations. J. Phys. Chem. B 2014, 118, 4326–4332. [Google Scholar] [CrossRef] [PubMed]
  43. Straatsma, T.P.; Berendsen, H.J.C. Free energy of ionic hydration: Analysis of a thermodynamic integration technique to evaluate free energy differences by molecular dynamics simulations. J. Chem. Phys. 1988, 89, 5876–5886. [Google Scholar] [CrossRef]
  44. Ȧqvist, J. Ion-water interaction potentials derived from free energy perturbation simulations. J. Phys. Chem. B 1990, 94, 8021–8024. [Google Scholar] [CrossRef]
  45. Warshel, A. Computer Modelling of Chemical Reactions in Enzymes and Solutions; John Wiley and Sons: New York, NY, USA, 1991. [Google Scholar]
  46. Bauer, P.; Barrozo, A.; Purg, M.; Amrein, B.A.; Eguerra, M.; Barrie Wilson, P.; Major, D.T.; Åqvist, J.; Kamerlin, S.C.L. Q6: A comprehensive toolkit for empirical valence bond and related free energy calculations. SoftwareX 2018, 7, 388–395. [Google Scholar] [CrossRef]
  47. Prah, A.; Purg, M.; Stare, J.; Vianello, R.; Mavri, J. How Monoamine Oxidase A Decomposes Serotonin: An Empirical Valence Bond Simulation of the Reactive Step. J. Phys. Chem. B 2020, 124, 8259–8265. [Google Scholar] [CrossRef]
  48. Zhao, L.N.; Mondal, D.; Warshel, A. Exploring alternative catalytic mechanisms of the Cas9 HNH domain. Proteins 2020, 88, 260–264. [Google Scholar] [CrossRef]
  49. Mironov, V.A.; Khrenova, M.G.; Lychko, L.A.; Nemukhin, A.V. Computational Characterization of the Chemical Step in the GTP Hydrolysis by Ras-GAP for the Wild-Type and G13V Mutated Ras. Proteins Struct. Funct. Genet. 2015, 83, 1046–1053. [Google Scholar] [CrossRef]
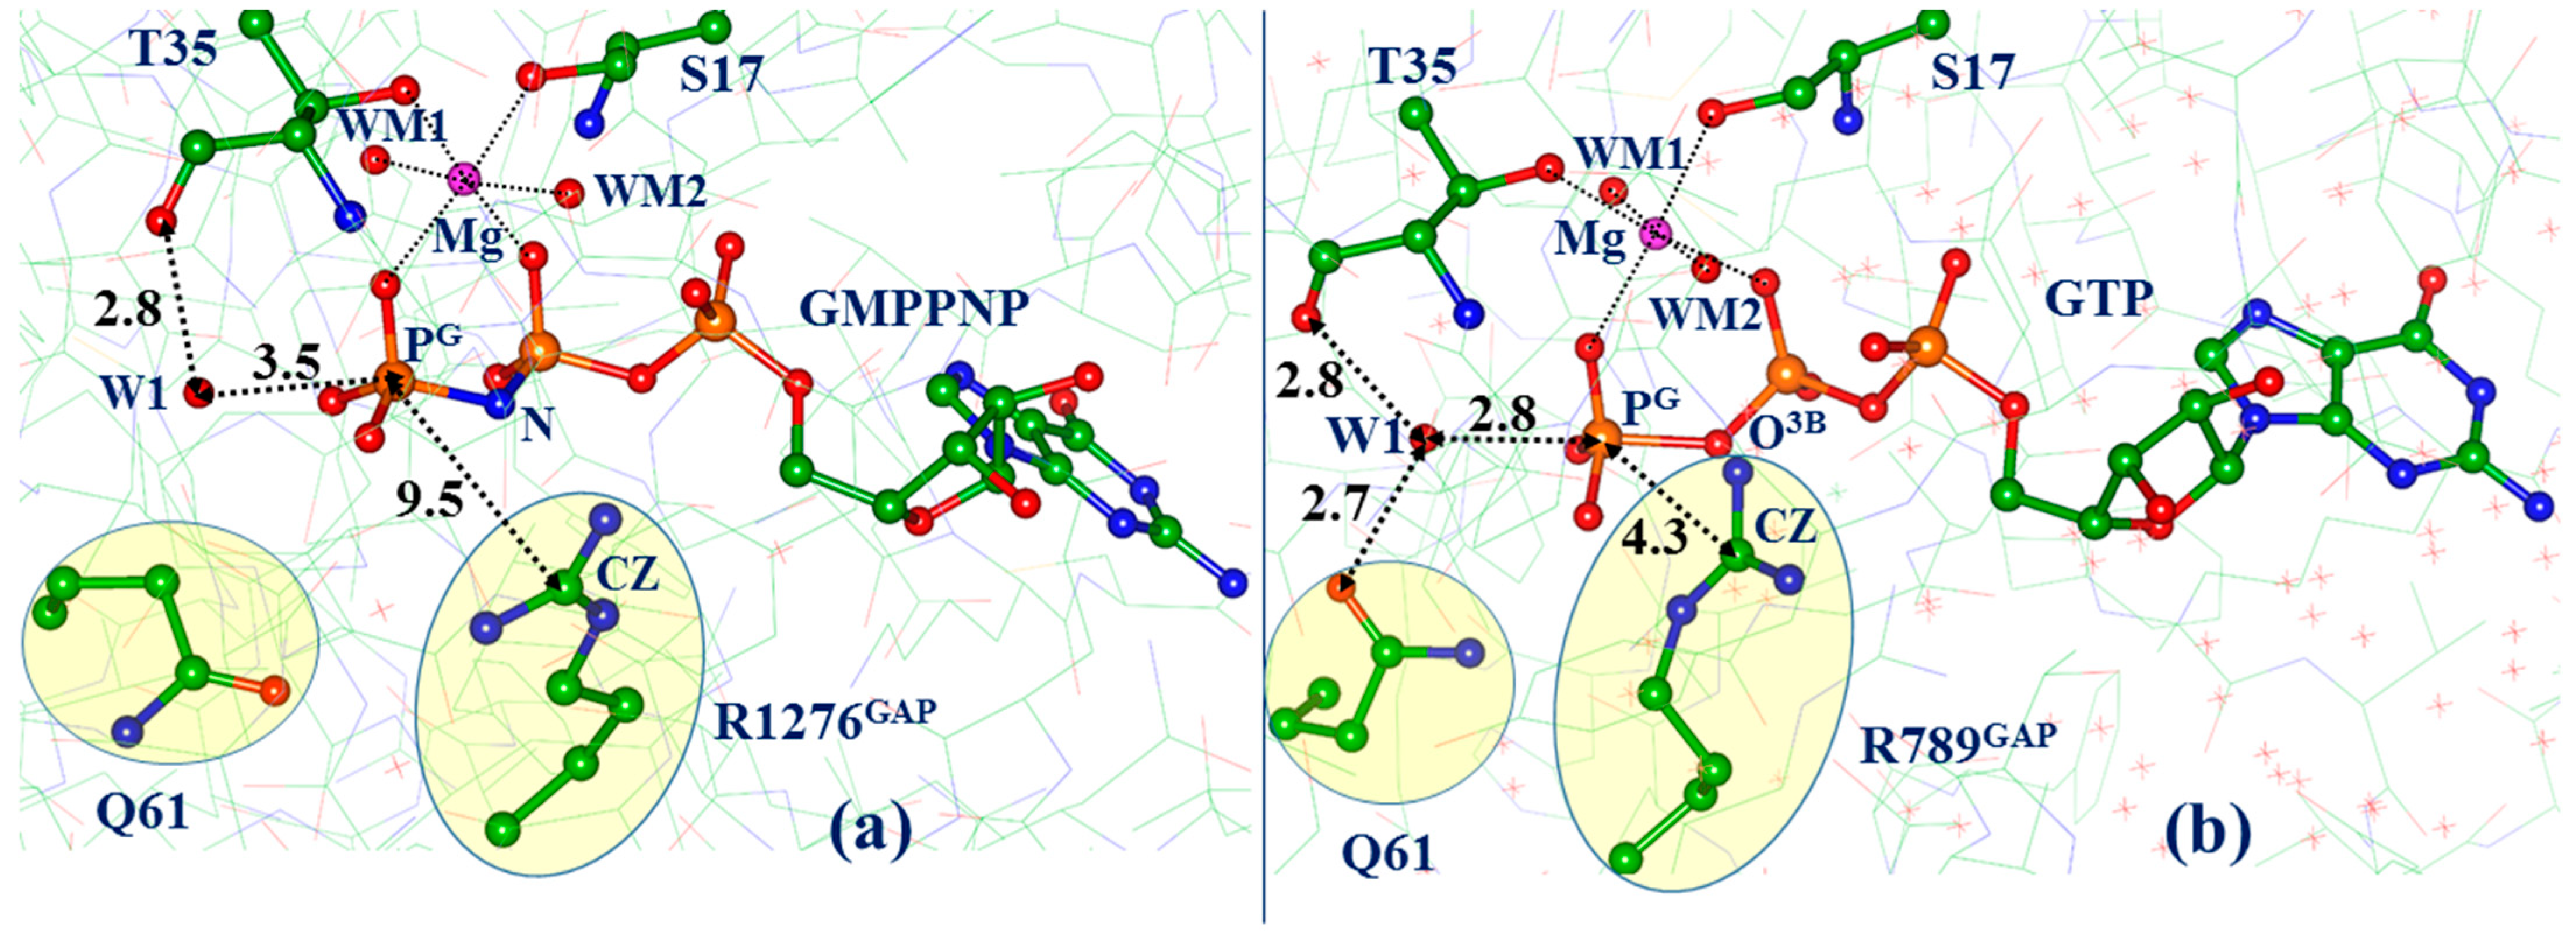
Figure 1. Panel (a) shows a view on the active site in the PDB 6OB2 crystal structure of KRas-NF1. Panel (b) shows a related fragment in the computationally derived HRas-p120GAP complex constructed with atomic coordinates of the PDB 1WQ1 crystal structure. In this and other figures, carbon atoms are shown in green, oxygen in red, nitrogen in blue, phosphorus in orange, magnesium ions in magenta. Interatomic distances are given in Å.
Biophysica 03 00025 g001
Figure 2. The active site in the KRas(GTP)-NF1 model system in the non-reactive ES conformation (a) and in the reactive ES conformation (b).
Biophysica 03 00025 g002
Figure 3. Gibbs energy profile for the reaction initiated by the non-reactive ES complex shown in Figure 2. The insets show essential changes with the reactants (the magnesium ion is presented to orient the view of the fragments). In this and subsequent figures, the shown interatomic distances in Å refer to the mean values averaged over corresponding trajectory windows.
Biophysica 03 00025 g003
Figure 4. Structure of the reactants (REAC) for the reaction pathways initiated with reactive ES.
Biophysica 03 00025 g004
Figure 5. The reaction pathway from REAC (Figure 4) to INT via TS. From the INT point, the system may evolve according to two scenarios as shown in Figure 6.
Biophysica 03 00025 g005
Figure 6. Possible reaction pathways from INT: the glutamine-assisted mechanism (to the left) and the water-assisted mechanism (to the right). Balls and sticks representation distinguishes the groups which experience chemical transformations (Q1, W1, GTP in the left-side scenario and W1, W2, W3, GTP in the right-side scenario).
Biophysica 03 00025 g006
Disclaimer/Publisher’s Note: The statements, opinions and data contained in all publications are solely those of the individual author(s) and contributor(s) and not of MDPI and/or the editor(s). MDPI and/or the editor(s) disclaim responsibility for any injury to people or property resulting from any ideas, methods, instructions or products referred to in the content.