Abstract
Protein contact networks (PCNs) have been used for the study of protein structure and function for the past decade. In PCNs, each amino acid is considered as a node while the contacts among amino acids are the links/edges. We examined the possible correlation between the closeness centrality measure of amino acids within PCNs and their mobility as known from NMR spin relaxation experiments and molecular dynamic (MD) simulations. The pivotal observation was that plasticity within a protein stretch correlated inversely to closeness centrality. Effects on protein conformational plasticity caused by the formation of disulfide bonds or protein–protein interactions were also identified by the PCN analysis measure closeness centrality and the hereby introduced percentage of closeness centrality perturbation (% CCP). All the comparisons between PCN measures, NMR data, and MDs were performed in a set of proteins of different biological functions and structures: the core protease domain of anthrax lethal factor, the N-terminal RING domain of E3 Ub ligase Arkadia, the reduced and oxidized forms of human thioredoxin 1, and the ubiquitin molecules (Ub) of the catalytic Ub–RING–E3–E2–Ub complex of E3 ligase Ark2.The graph theory analysis of PCNs could thus provide a general method for assessing the conformational dynamics of free proteins and putative plasticity changes between different protein forms (apo/complexed or reduced/oxidized).
1. Introduction
Proteins are largely dynamic molecules with their overall conformation affecting their biological function. Crystallographic B-factors, NMR spin relaxation measurements, and molecular dynamic (MD) simulations provide insights into protein flexibility on an atomic scale. Specifically, NMR spin relaxation experiments provide site-specific information about backbone and sidechain dynamics throughout the protein. Nowadays, established NMR procedures allow for routine extraction of motional description, or parameterization in terms of amplitudes (S2 order parameters) and characteristic timescales (τi) [1,2]. NMR experiments based on the methyl-TROSY effect that significantly improves spectral resolution and sensitivity have been used for the study of protein conformation of supra-molecular complexes with molecular masses extending to 1 MDa [3]. However, protein parts of increased flexibility will not diffract long enough and may not be visible in crystal structures. Methods that probe into the protein dynamics of these undefined parts are largely computational and may (i) use automated protocols for the identification of functional dynamics from X-ray structures [4]; (ii) classify proteins according to their mobility patterns, improving annotation of protein function on the basis of protein dynamics [5]; and (iii) predict conformational heterogeneity by the combination of residue coevolution and MDs [6].
Network analysis of protein structures has been very useful for the analysis of structural stability of macromolecules in the last decade [7,8,9,10,11,12]. The “protein structure networks”, known as “amino acid networks” or “protein contact networks” (PCNs) are constructed by nodes and edges. These networks consider amino acids and their respective interactions when their spatial distances within a protein structure are under a defined threshold (<7 Å i.e.,). The idea of essential contacts in a protein molecule was the core of an earlier methodologies such as (i) the lattice model of proteins that was introduced for studying the statistical mechanical characteristics of protein folding, unfolding, and fluctuations [13]; (ii) the “contact of structural units” such as helices, sheets, strands, and residues, embodied in the widely used contacts of structural units (or CSU) software [14]; and (iii) the “elastic network model” that investigates the magnitudes of motion of individual residues in the protein structure [15] and formed the basis of coarse-grained MDs studies [16].
Protein structure networks and their topological analysis are good tools for the analysis of protein folding [17,18], dynamics [19,20], and identification of key residues for protein–protein interactions [21,22,23,24]. In the theory of protein structure networks, “centrality” describes the importance of an amino acid position within a network. The most frequently used centrality measures are “degree”, “closeness”, “betweenness”, and “eigenvector” [25,26,27]. Betweenness and closeness are most useful in identifying crucial residues for protein folding and function [28,29,30]. Approaches utilizing protein networks have been recently explored to evaluate the dynamics of systems (from individual molecules to large protein assemblies) whose structures have been resolved [31] in order to generate information about ligand binding sites, protein–protein and/or protein–DNA interfaces, signal transduction, and allosteric communication mechanisms [31,32,33,34].
When proteins contact each other to form complexes, conformational changes may occur in dynamic/flexible parts of the corresponding contact areas. In the most of these cases, protein complexes may be too large for NMR spin relaxation experiments. Proteins may also undergo structural modifications resulting from interaction with other proteins or by changes within the same protein structure (formation of disulfide bridges), leading to altered protein dynamics in solution. The present study illustrates the use of PCN analysis as a suitable tool for qualitative evaluation of the conformational dynamics of free proteins as well as putative plasticity changes between different protein forms (apo/complexed or reduced/oxidized).
2. Materials and Methods
2.1. The Collection of PDB Structures
The names of proteins and Protein Data Bank (PDB) IDs used for the amino acid network reconstructions are summarized in Table 1.

Table 1.
Names of proteins and PDB codes that were used for the constructions of protein structure networks.
2.2. Construction and Centrality Measurements of Protein Structure Networks
Networks of proteins structures were built using the NAPS (Network Analysis of Protein Structures) web server (https://bioinf.iiit.ac.in/NAPS/help.html, accessed on 10 August 2020) [7]. In all constructed amino acid networks, every Cα atom of an amino acid was considered as a node. Edges corresponded to distances between different Cαs if distances between the corresponding amino acid residues were ≤~7 Å and were weighed according to the standard function wij = 1/dij (wij: edge weight and dij: distance between nodes i and j). Standard and long-range protein structure networks were constructed for each protein. The long-range networks were structured exclusively by edges between residues that were sequentially separated by 10 residues along the protein backbone chain.
In the protein contact networks, the closeness (or closeness centrality: the inverse of the shortest path distances of the node to all other nodes in the network) was measured. All topological analyses of the PCNs were performed using Cytoscape (https://cytoscape.org/, accessed on 10 August 2020) [35] and the NAPS web server [7]. To compare the closeness (closeness centrality) measures/values of PCNs between 2 different protein forms, we introduced the parameter “percentage of closeness centrality perturbation per residue” (% CCP) for each Cα of the polypeptide chain as
In the case of reduced and oxidized human thioredoxin-1 (hTrx1), protein forms A and B correspond to reduced and oxidized protein, respectively. In the case of the 2 Ubs of the UbR-RING-E2-UbD complex, protein forms A and B correspond to UbR and UbD, respectively.
2.3. NMR Spin Relaxation Measurements and MDs
15N NMR relaxation data (S2 order parameters for the N–H backbone vector) for anthrax lethal factor core protease and N-terminal RING domain of E3 Ub ligase Arkadia were provided by the previous reported studies [36]. All NMR data were acquired at 25 °C on a Bruker Avance 600 MHz spectrometer equipped with a TXI cryoprobe. MDs of anthrax lethal factor core protease and reduced (PDB ID: 1ERT) and oxidized (PDB ID: 1ERU) human thioredoxin-1 (hTrx1) were from [36,37], respectively. MDs of N-terminal RING domain of E3 Ub ligase Arkadia were performed according to standard protocols described in detail previously [38]. The selected structure for simulations was the NMR solution structure of the RING domain (PDB ID:2KIZ). MDs were performed using GROMACS software (version 2016.3) [39] and AMBER-99SB-STAR-ILDNP force field for 150 ns simulation time. NMR assignments of anthrax lethal factor core protease and N-terminal RING domain of E3 Ub ligase Arkadia used in this work were deposited in the Biological Magnetic Resonance Bank (BMRB) under the entry codes 16735 and 15948, respectively.
3. Results
3.1. PCNs Followed a Non-Scale Free Connectivity Distribution
The PCNs of the examined proteins displayed the general bell-shaped Poissonian behavior of other known protein structure networks (Figure 1a). This characteristic of PCNs is a marked exception to most self-organized biological networks (protein–protein and metabolic networks), which have scale-free behavior [19,27,40,41,42,43]. In the scale-free networks, the majority of nodes are each connected to a limited number of other nodes, whereas only a few nodes (hubs) are connected to many nodes. The scale-free nature of networks may explain their robustness in certain physical and biological situations [44]. It is likely that the main reason for the deviation of the protein structure networks from other biological networks (e.g., protein–protein interaction maps) in terms of scale-free connectivity distribution is the characteristic average degree of a given amino acid due to their limited binding capacity (volume effect) [19,45]. When only long-range interactions were considered (distances between Cαs were ≥5 Å), the distribution of PCNs had a more scale-free behavior (Figure 1b), typical of most biological networks. It is possible that this is the case for other protein structure networks. The stability of a given NMR structure for example is dictated by long range nuclear Overhauser effects (NOEs) and not by the interactions of sequential amino acids.
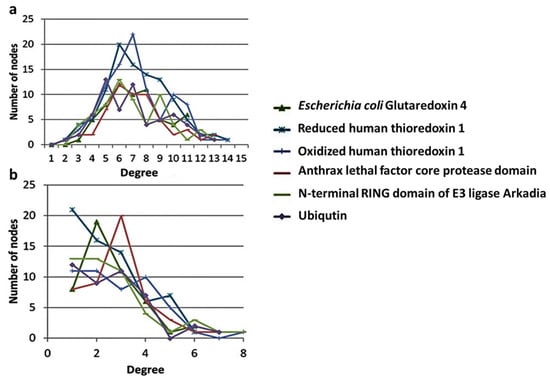
Figure 1.
Degree distribution of (a) short- and (b) long-range interaction networks of six different proteins. Protein contact networks (PCNs) were constructed as described in the Materials and Methods section.
3.2. Protein Plasticity Correlated Inversely to Closeness Centrality
Network metrics for anthrax lethal factor core protease domain (PDB ID: 2L0R) [36] were plotted against 15N NMR relaxation data (S2 order parameters for the N–H backbone vector) and RMSF (root mean square fluctuation) parameters from MD simulations (Figure 2) [36,46,47]. Closeness centrality measures of N-terminal RING domain of E3 Ub ligase Arkadia (PDB ID: 2KIZ) were compared with 15N NMR relaxation data and RMSF parameters (Figure 3) [48,49,50,51]. These two proteins have completely different biological function and structure. In both cases, lower closeness centrality measures were correlated to increased mobility (elevated RMSF values or reduced S2 parameters) of a protein segment and vice versa. Differences between NMR relaxation experiments and MDs and PCNs analysis were detected only for the loop (G722-Y728) between helix α5 and α6 of the anthrax lethal factor core protease domain. This loop consists of residues with reduced number of long-range NOE connectivities [36] and is probably the reason why the NMR relaxation studies indicate higher flexibility for this region. Thus, results from different protein structures taking into consideration NMR and MD data suggested that elevated closeness centrality measures correlated to lower mobility of amino acids within a protein segment.
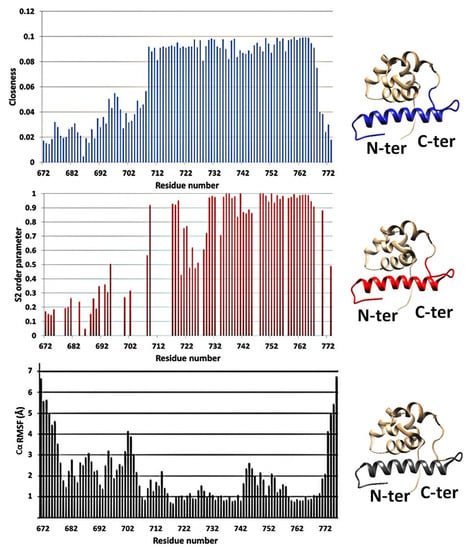
Figure 2.
Closeness centrality vs. S2 relaxation and root mean square fluctuation (RMSF) parameters from molecular dynamic (MD) calculations for the anthrax lethal factor protease core domain (PDB ID: 2L0R) [36]. The colored regions in the 3D structures in the right panel indicate the flexible segments identified by the corresponding technique.
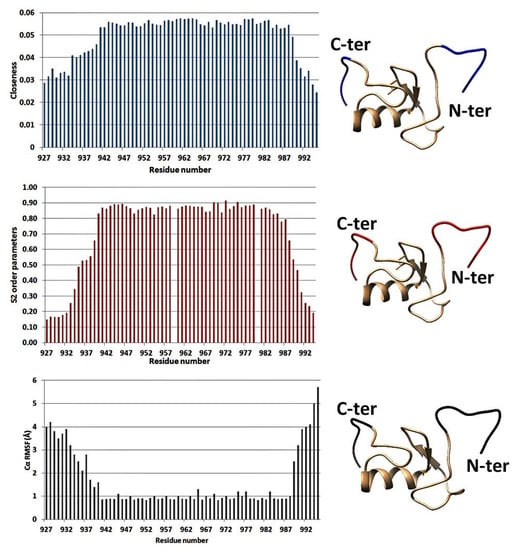
Figure 3.
Closeness centrality, S2 values, and RMSF parameters from MD calculations for the amino acid residues of the RING domain of E3 ligase Arkadia (PDB ID:2KIZ) [48]. The colored regions in the 3D structures in the right panel indicate the flexible segments identified by the corresponding technique.
3.3. Percentage CCP Changes May Indicate Alterations in Plasticity upon Formation of Disulfides within A Protein Sequence
Percentage CCP values between reduced (PDB ID: 1ERT) and oxidized (PDB ID: 1ERU) human thioredoxin-1 (hTrx1) were calculated and related to changes in the corresponding RMSF parameters from MD simulations [37]. MD simulations (for 10 ns) for the oxidized and reduced hTrx1 (Figure 4a) showed that the reduced molecule had increased Cα RMSFs (increased flexibility) for the loops between β2 and α2 (L3), between β3 and α3 (L5), and between α3 and β4 (L6). L3 contains the active site cysteines (Cys32-Gly-Pro-Cys35), and thus reduction of the disulfide conferred increased flexibility to the region. Network-based comparison of the reduced versus oxidized hTrx1 revealed that the % CCPs of parts without any fluctuation changes (β1, α1, β2, as revealed by MD simulations) were in the order of ±0.3. The % CCP value of ±0.33 was therefore set as the relative threshold-noise value that included all non-significant % CCP changes. Under this consideration, significant negative % CCP values were observed for the three loops with increased flexibility (L3, 5, and 6; Figure 4b), explained by the lower plasticity of oxidized hTrx1 compared to the more flexible reduced form. The segments with negative % CCPs (with values more than threefold above the threshold (±0.33) corresponded to 0.5–0.7 Å increases in the RMSF values (MD simulations).
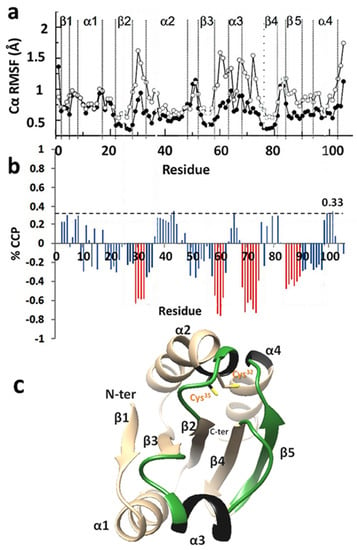
Figure 4.
Cα root mean square (RMS) fluctuations and percentage of closeness centrality perturbation (% CCP) values of oxidized and reduced human thioredoxin 1 (hTrx1). (a) Comparison of Cα RMS fluctuations of oxidized (black symbols) and reduced hTrx1 (white symbols) [37]. (b) The % CCP values between reduced (PDB ID:1ERT) and oxidized (PDB ID: 1ERU) hTrx1. The red bars indicate negative % CCP values per residues that were above the threshold-noise perturbations of ±0.33, with the latter value corresponding to segments without any significant change in structure. (c) Comparison of flexibilities obtained from MDs and % CCPs for reduced hTrx1. The green areas represent areas with increased flexibility from both methods, and black colored areas are data from MDs. The cysteines of the active site are shown in orange.
3.4. CCP Changes May Indicate Alterations in Plasticity upon Complexation
Human Ark2C is the only known RING E3 ligase. The protein participates in an alternative pathway for the activation of Ub transfer. Its RING domain binds to both E2-Ub and free Ub with high affinity, resulting in a catalytic active UbR–RING–E2–UbD complex with two Ubs [52]. MD simulations have shown that in the catalytic complex, the Ub bound to the RING domain (UbR) had greater mobility than the Ub bound to E2 (UbD) [38]. Calculations of % CCP between the two Ubs of the active UbR–RING–E2–UbD complex revealed different plasticities for the two molecules (Figure 5). Therefore, UbR is likely to have increased flexibility compared to UbD, which is in agreement with the previous MD simulations.
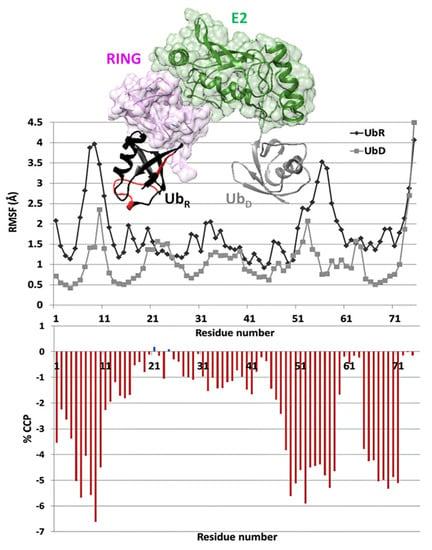
Figure 5.
Cα RMS fluctuations of UbR (black symbol) and UbD (grey symbol) [38] and % CCP values between UbR and UbD of the UbR–RING–E2–UbD complex (PDB ID: 5D0K). The areas of UbR with increased flexibility as detected by % CCP values are shown in red.
4. Discussion
The determination of the three-dimensional structure of proteins and their interactions and dynamics are paramount to structural biology. Functional dynamics provide vital information on the identification of key residues for protein–protein interactions and on structure–activity relationships that are of interest to many fields, e.g., pharmacology. Going beyond the static picture of protein structure has proven more challenging. Techniques such as NMR relaxation, fluorescence spectroscopy [53], and time-resolved X-ray crystallography [54] have helped. Integrations of the above experimental tools with computational approaches including MDs or network-based lattice or elastic models have allowed for the study of functional dynamics of proteins at atomic resolution in the time range of microseconds.
General Outcomes from the Measurements of Centrality Parameters
In any protein network, the length of the shortest path among different amino acids and their individual fluctuations are considered related [17,30]. As the shortest path has been described by the protein network parameter closeness centrality [17,18], the possible correlation between the closeness centrality measure of amino acids within PCNs, and their mobility, as known from NMR spin relaxation experiments and MDs, was explored.
Elevated closeness centrality values correlated to low mobility of a protein segment in the proteins examined. Positive or negative values of the introduced parameter % CCP reflected protein segments with reduced or increased intrinsic rigidity, respectively. The % CCP values (above the threshold) were able to distinguish subtle differences of Cα RMSFs in the whole structure of an oxidoreductase resulting from formation of a disulfide in its active site. Moreover, % CCP values were able to probe the different mobility profiles of the two different Ub molecules in the catalytic assembly UbR–RING–E2–UbD and showed, in agreement with the previous MDs [38], that UbR bound to the RING was more flexible than UbD bound to E2. Significant negative % CCP values were observed for the regions of UbR with meaningful increased flexibility compared to UbD. These data suggest that centrality measures of PCNs can detect fine flexibility changes in parts of protein structure occurring after interaction with other proteins or after small redox changes within their amino acid sequences.
5. Conclusions
Our findings suggest that novel in silico packages could be designed and developed considering (i) quantitative correlations between PCN centrality parameters and NMR relaxation measurements and MD simulations, and (ii) quantitative metrics, which can report on the correspondence of the network measures to the stability of protein structures, changes of plasticity in the exact contact areas of proteins, and hot spot residues in protein–protein interfaces.
Author Contributions
Conceptualization, C.T.C.; methodology, C.T.C.; investigation, C.T.C., A.V.-G.; writing—original draft preparation, C.T.C., A.V.-G.; writing—review and editing, C.T.C., A.V.-G. All authors have read and agreed to the published version of the manuscript.
Funding
This research received no external funding.
Data Availability Statement
Not applicable.
Conflicts of Interest
The authors declare no conflict of interest.
References
- Case, D.A. Molecular Dynamics and NMR Spin Relaxation in Proteins. Acc. Chem. Res. 2002, 35, 325–331. [Google Scholar] [CrossRef]
- Gu, Y.; Li, D.-W.; Brüschweiler, R. NMR Order Parameter Determination from Long Molecular Dynamics Trajectories for Objective Comparison with Experiment. J. Chem. Theory Comput. 2014, 10, 2599–2607. [Google Scholar] [CrossRef]
- Kay, L.E. Solution NMR spectroscopy of supra-molecular systems, why bother? A methyl-TROSY view. J. Magn. Reson. 2011, 210, 159–170. [Google Scholar] [CrossRef]
- Van den Bedem, H.; Bhabha, G.; Yang, K.; Wright, P.E.; Fraser, J.S. Automated identification of functional dynamic contact networks from X-ray crystallography. Nat. Methods 2013, 10, 896–902. [Google Scholar] [CrossRef] [PubMed]
- Hensen, U.; Meyer, T.; Haas, J.; Rex, R.; Vriend, G.; Grubmuller, H. Exploring protein dynamics space: The dynasome as the missing link between protein structure and function. PLoS ONE 2012, 7, e33931. [Google Scholar] [CrossRef]
- Sutto, L.; Marsili, S.; Valencia, A.; Gervasio, F.L. From residue coevolution to protein conformational ensembles and functional dynamics. Proc. Natl. Acad. Sci. USA 2015, 112, 13567–13572. [Google Scholar] [CrossRef] [PubMed]
- Chakrabarty, B.; Parekh, N. NAPS: Network Analysis of Protein Structures. Nucleic Acids Res. 2016, 44, W375–W382. [Google Scholar] [CrossRef] [PubMed]
- Grewal, R.K.; Roy, S. Modeling proteins as residue interaction networks. Protein Pept. Lett. 2015, 22, 923–933. [Google Scholar] [CrossRef] [PubMed]
- Yan, W.; Zhou, J.; Sun, M.; Chen, J.; Hu, G.; Shen, B. The construction of an amino acid network for understanding protein structure and function. Amino Acids 2014, 46, 1419–1439. [Google Scholar] [CrossRef] [PubMed]
- Di Paola, L.; De Ruvo, M.; Paci, P.; Santoni, D.; Giuliani, A. Protein contact networks: An emerging paradigm in chemistry. Chem. Rev. 2013, 113, 1598–1613. [Google Scholar] [CrossRef] [PubMed]
- Greene, L.H. Protein structure networks. Brief. Funct. Genom. 2012, 11, 469–478. [Google Scholar] [CrossRef]
- Taylor, N.R. Small world network strategies for studying protein structures and binding. Comput. Struct. Biotechnol. J. 2013, 5, e201302006. [Google Scholar] [CrossRef]
- Taketomi, H.; Ueda, Y.; Go, N. Studies on protein folding, unfolding and fluctuations by computer simulation. I. The effect of specific amino acid sequence represented by specific inter-unit interactions. Int. J. Pept. Protein Res. 1975, 7, 445–459. [Google Scholar] [CrossRef]
- Sobolev, V.; Sorokine, A.; Prilusky, J.; Abola, E.; Edelman, M. Automated analysis of interatomic contacts in proteins. Bioinformatics 1999, 15, 327–332. [Google Scholar] [CrossRef] [PubMed]
- Atilgan, A.R.; Durell, S.R.; Jernigan, R.L.; Demirel, M.C.; Keskin, O.; Bahar, I. Anisotropy of Fluctuation Dynamics of Proteins with an Elastic Network Model. Biophys. J. 2001, 80, 505–515. [Google Scholar] [CrossRef]
- Togashi, Y.; Flechsig, H. Coarse-Grained Protein Dynamics Studies Using Elastic Network Models. Int. J. Mol. Sci. 2018, 19, 3899. [Google Scholar] [CrossRef]
- Patra, S.M.; Vishveshwara, S. Backbone cluster identification in proteins by a graph theoretical method. Biophys. Chem. 2000, 84, 13–25. [Google Scholar] [CrossRef]
- Paola, L.D.; Paci, P.; Santoni, D.; Ruvo, M.D.; Giuliani, A. Proteins as sponges: A statistical journey along protein structure organization principles. J. Chem. Inf. Modeling 2012, 52, 474–482. [Google Scholar] [CrossRef]
- Atilgan, A.R.; Akan, P.; Baysal, C. Small-world communication of residues and significance for protein dynamics. Biophys. J. 2004, 86 Pt 1, 85–91. [Google Scholar] [CrossRef]
- Bode, C.; Kovacs, I.A.; Szalay, M.S.; Palotai, R.; Korcsmaros, T.; Csermely, P. Network analysis of protein dynamics. FEBS Lett. 2007, 581, 2776–2782. [Google Scholar] [CrossRef]
- Atilgan, A.R.; Turgut, D.; Atilgan, C. Screened nonbonded interactions in native proteins manipulate optimal paths for robust residue communication. Biophys. J. 2007, 92, 3052–3062. [Google Scholar] [CrossRef]
- Amitai, G.; Shemesh, A.; Sitbon, E.; Shklar, M.; Netanely, D.; Venger, I.; Pietrokovski, S. Network analysis of protein structures identifies functional residues. J. Mol. Biol. 2004, 344, 1135–1146. [Google Scholar] [CrossRef] [PubMed]
- Del Sol, A.; Fujihashi, H.; O’Meara, P. Topology of small-world networks of protein-protein complex structures. Bioinformatics 2005, 21, 1311–1315. [Google Scholar] [CrossRef]
- Cusack, M.P.; Thibert, B.; Bredesen, D.E.; Del Rio, G. Efficient identification of critical residues based only on protein structure by network analysis. PLoS ONE 2007, 2, e421. [Google Scholar] [CrossRef]
- Freeman, L.C. Centrality in social networks conceptual clarification. Soc. Netw. 1978, 1, 215–239. [Google Scholar] [CrossRef]
- Bonacich, P. Factoring and weighting approaches to status scores and clique identification. J. Math. Sociol. 1972, 2, 113–120. [Google Scholar] [CrossRef]
- Chasapis, C.T. Building Bridges between Structural and Network-Based Systems Biology. Mol. Biotechnol. 2019, 61, 221–229. [Google Scholar] [CrossRef]
- Vendruscolo, M.; Dokholyan, N.V.; Paci, E.; Karplus, M. Small-world view of the amino acids that play a key role in protein folding. Phys. Rev. E Stat. Nonlinear Soft Matter Phys. 2002, 65 Pt 1, 061910. [Google Scholar] [CrossRef] [PubMed]
- Thibert, B.; Bredesen, D.E.; del Rio, G. Improved prediction of critical residues for protein function based on network and phylogenetic analyses. BMC Bioinform. 2005, 6, 213. [Google Scholar] [CrossRef]
- Chasapis, C.T. Hierarchical core decomposition of RING structure as a method to capture novel functional residues within RING-type E3 ligases: A structural systems biology approach. Comput. Biol. Med. 2018, 100, 86–91. [Google Scholar] [CrossRef]
- Li, H.; Chang, Y.Y.; Lee, J.Y.; Bahar, I.; Yang, L.W. DynOmics: Dynamics of structural proteome and beyond. Nucleic Acids Res. 2017, 45, W374–W380. [Google Scholar] [CrossRef]
- Di Paola, L.; Giuliani, A. Protein contact network topology: A natural language for allostery. Curr. Opin. Struct. Biol. 2015, 31, 43–48. [Google Scholar] [CrossRef]
- Brysbaert, G.; Mauri, T.; De Ruyck, J.; Lensink, M.F. Identification of key residues in proteins through centrality analysis and flexibility prediction with RINspector. Curr. Protoc. Bioinform. 2019, 65, e66. [Google Scholar] [CrossRef]
- Di Paola, L.; Mei, G.; Di Venere, A.; Giuliani, A. Disclosing Allostery through Protein Contact Networks. In Allostery; Humana: New York, NY, USA, 2021; Volume 2253, pp. 7–20. [Google Scholar]
- Shannon, P.; Markiel, A.; Ozier, O.; Baliga, N.S.; Wang, J.T.; Ramage, D.; Amin, N.; Schwikowski, B.; Ideker, T. Cytoscape: A software environment for integrated models of biomolecular interaction networks. Genome Res. 2003, 13, 2498–2504. [Google Scholar] [CrossRef] [PubMed]
- Dalkas, G.A.; Chasapis, C.T.; Gkazonis, P.V.; Bentrop, D.; Spyroulias, G.A. Conformational dynamics of the anthrax lethal factor catalytic center. Biochemistry 2010, 49, 10767–10769. [Google Scholar] [CrossRef] [PubMed]
- Han, S. Molecular dynamics simulations of thioredoxin with S-glutathiolated cysteine-73. Biochem. Biophys. Res. Commun. 2007, 362, 532–537. [Google Scholar] [CrossRef]
- Mintis, D.G.; Chasapi, A.; Poulas, K.; Lagoumintzis, G.; Chasapis, C.T. Assessing the Direct Binding of Ark-Like E3 RING Ligases to Ubiquitin and Its Implication on Their Protein Interaction Network. Molecules 2020, 25, 4787. [Google Scholar] [CrossRef]
- Abraham, M.J.; Murtola, T.; Schulz, R.; Páll, S.; Smith, J.C.; Hess, B.; Lindahl, E. GROMACS: High performance molecular simulations through multi-level parallelism from laptops to supercomputers. SoftwareX 2015, 1–2, 19–25. [Google Scholar] [CrossRef]
- Chasapis, C.T. Interactions between metal binding viral proteins and human targets as revealed by network-based bioinformatics. J. Inorg. Biochem. 2018, 186, 157–161. [Google Scholar] [CrossRef]
- Chasapis, C.T.; Konstantinoudis, G. Protein isoelectric point distribution in the interactomes across the domains of life. Biophys. Chem. 2020, 256, 106269. [Google Scholar] [CrossRef]
- Peana, M.; Chasapis, C.T.; Simula, G.; Medici, S.; Zoroddu, M.A. A Model for Manganese interaction with Deinococcus radiodurans proteome network involved in ROS response and defense. J. Trace Elem. Med. Biol. 2018, 50, 465–473. [Google Scholar] [CrossRef] [PubMed]
- Chasapis, C.T. Shared gene-network signatures between the human heavy metal proteome and neurological disorders and cancer types. Metallomics 2018, 10, 1678–1686. [Google Scholar] [CrossRef]
- Barabási, A.-L.; Albert, R. Emergence of Scaling in Random Networks. Science 1999, 286, 509–512. [Google Scholar] [CrossRef] [PubMed]
- Amaral, L.A.; Scala, A.; Barthelemy, M.; Stanley, H.E. Classes of small-world networks. Proc. Natl. Acad. Sci. USA 2000, 97, 11149–11152. [Google Scholar] [CrossRef]
- Gkazonis, P.V.; Dalkas, G.A.; Chasapis, C.T.; Vlamis-Gardikas, A.; Bentrop, D.; Spyroulias, G.A. Purification and biophysical characterization of the core protease domain of anthrax lethal factor. Biochem. Biophys. Res. Commun. 2010, 396, 643–647. [Google Scholar] [CrossRef] [PubMed]
- Vourtsis, D.J.; Chasapis, C.T.; Pairas, G.; Bentrop, D.; Spyroulias, G.A. NMR conformational properties of an Anthrax Lethal Factor domain studied by multiple amino acid-selective labeling. Biochem. Biophys. Res. Commun. 2014, 450, 335–340. [Google Scholar] [CrossRef] [PubMed]
- Chasapis, C.T.; Kandias, N.G.; Episkopou, V.; Bentrop, D.; Spyroulias, G.A. NMR-based insights into the conformational and interaction properties of Arkadia RING-H2 E3 Ub ligase. Proteins Struct. Funct. Bioinform. 2012, 80, 1484–1489. [Google Scholar] [CrossRef]
- Kandias, N.G.; Chasapis, C.T.; Bentrop, D.; Episkopou, V.; Spyroulias, G.A. High yield expression and NMR characterization of Arkadia E3 ubiquitin ligase RING-H2 finger domain. Biochem. Biophys. Res. Commun. 2009, 378, 498–502. [Google Scholar] [CrossRef]
- Birkou, M.; Chasapis, C.T.; Marousis, K.D.; Loutsidou, A.K.; Bentrop, D.; Lelli, M.; Herrmann, T.; Carthy, J.M.; Episkopou, V.; Spyroulias, G.A. A Residue Specific Insight into the Arkadia E3 Ubiquitin Ligase Activity and Conformational Plasticity. J. Mol. Biol. 2017, 429, 2373–2386. [Google Scholar] [CrossRef]
- Chasapis, C.T.; Loutsidou, A.K.; Orkoula, M.G.; Spyroulias, G.A. Zinc Binding Properties of Engineered RING Finger Domain of Arkadia E3 Ubiquitin Ligase. Bioinorg. Chem. Appl. 2010, 2010, 323152. [Google Scholar] [CrossRef] [PubMed]
- Wright, J.D.; Mace, P.D.; Day, C.L. Secondary ubiquitin-RING docking enhances Arkadia and Ark2C E3 ligase activity. Nat. Struct. Mol. Biol. 2015, 23, 45–52. [Google Scholar] [CrossRef]
- Demchenko, A.P. Fluorescence and Dynamics in Proteins. In Topics in Fluorescence Spectroscopy; Springer: Boston, MA, USA, 2002; Volume 3, pp. 65–111. [Google Scholar]
- Van den Bedem, H.; Fraser, J.S. Integrative, dynamic structural biology at atomic resolution—It’s about time. Nat. Methods 2015, 12, 307–318. [Google Scholar] [CrossRef] [PubMed]
Publisher’s Note: MDPI stays neutral with regard to jurisdictional claims in published maps and institutional affiliations. |
© 2021 by the authors. Licensee MDPI, Basel, Switzerland. This article is an open access article distributed under the terms and conditions of the Creative Commons Attribution (CC BY) license (https://creativecommons.org/licenses/by/4.0/).