Article

Vinipel Curing: A Sustainable Approach to Enhanced Concrete Durability and Strength

Department of Civil and Environmental Engineering, Universidad de la Costa, Barranquilla 080002, Colombia
*
Author to whom correspondence should be addressed.
CivilEng 2025, 6(1), 9; https://doi.org/10.3390/civileng6010009
Submission received: 8 November 2024 / Revised: 22 December 2024 / Accepted: 9 February 2025 / Published: 13 February 2025
(This article belongs to the Section Construction and Material Engineering)

Abstract

:
Currently, the demand for environmental sustainability options in the construction industry is increasing, especially those related to the correct use of water. The aim of this work is to study different sustainable alternatives that minimize the use of water in cured hydraulic concrete, analyzing the effect of curing on hydration, microstructure, and compressive strength of hydraulic concrete exposed to different curing techniques: Manual Curing, Standard Curing, Vinipel, and Uncured. An experimental study was conducted using 180 cylindrical hydraulic concrete specimens, which were compression-tested at 7, 28, and 56 days. A Scanning Electron Microscope equipped with an Energy Dispersive X-ray Spectrometer analysis was carried out to examine the microstructural and compositional changes under the different curing techniques. The results indicate that the Vinipel technique is the best alternative, showing a compressive strength of 35 MPa after 56 days of curing. In general, Vinipel > Standard Curing > Manual Curing > Uncured is the order of strength from highest to lowest. The formation of hydration products was observed in all curing techniques. The presence of ettringite, complementing by abundant portlandite in Vinipel, shows the dominance of an important product in the strength of concrete. The best strength capacity under load and the lowest percentages of vacuum are likely to be favorable for the durability of the processes.

1. Introduction

The new strategies for planet conservation, especially related to the correct use of water resources, are also directly related to sustainable development, defined as “the ability to satisfy humanistic needs today without risking future needs” [1]. The demand for environmental sustainability options in construction is currently a great need and challenge [2,3], especially in the search for effective procedures in construction processes that avoid excessive water consumption and do not affect the compressive strength of concrete. This procedure or alternative would be key to saving a limited and irreplaceable element that only works as a renewable resource if it is well managed. In China, the evaluation of the effectiveness of water savings in the construction area showed, through statistical analysis, that water use was 89% higher in 2016 compared to the previous year, which led to the establishment of an urban water-saving policy. As a result, they observed that the impact was −7.2% for societies that applied the policy, compared to −13.5% for societies that did not apply the policy, achieving better water-saving effects. These data are reflected negatively due to the excessive use of this resource by both parties, but show a tendency for a reduction in the negative value, indicating a decrease in consumption, but it can be improved [4]. In the area of construction, the process where this resource is most used in the manufacture of concrete. As an example, for a dosage of 3000 Psi, 60% of the mixture must be added water (320 cm3 of cement, 0.52 m3 of sand, 0.90 g of gravel and 170 L of water). In the curing process, an amount equal to 25% of the mass of the concrete must be saturated with this resource [5]. The concrete, which is a mixture of sand, gravel, Portland cement, and water, has great versatility [6] because, when hardened, it gains a lot of resistance and, in turn, good solidification. It is also usual to add other additives to give variety to its mechanical characteristics. This strength only occurs when the concrete is maintained [5], especially during the first days in the process called curing [7]. The process of curing, hydration, or healing, consists primarily supplying a controlled temperature and humidity inside and outside the concrete. Its main objective is to keep the concrete saturated, since the hydration of cement occurs only in capillaries or voids filled with water. Therefore, excessive evaporation of water must be avoided, especially in environments where temperatures are higher than ideal. In addition, the temperature must be controlled, as it influences the rate and amount of hydrated phases formed [8]. The efficiency of this process is given by type of concrete, environmental factors (humidity, temperature) [9,10], the duration of the curing method [11], curing agents [12] cost, application, and other factors of the project [13]. It is well known that the curing process can be carried out with different methods, utilized to speed up the process and guarantee the quality of structural concrete [14]. If hydration is not performed in the concrete structures, consequently, it is observed that the concrete begins to eliminate the water necessary for the various desired chemical reactions to occur, preventing it from reaching its maximum strength. Keeping concrete samples moist prevents the appearance of plastic grooves caused by water loss due to evaporation [15]. Mohe et al. [16] used different water sources (river water, water from a deep well, and rainwater) for the curing process and studied the mechanical characteristics of concrete formed, obtaining variabilities in compressive strength of elaborated concrete cubes, showing that with the use of river water, less than 90% of the resistance is obtained compared to well water and water extracted from the rain, with the latter showing an exact 90% resistance. Likewise, Ekasila et al. [17] made a comparison between the spraying of water with a conventional “spray” and a pounding method or waterlogging in the curing process, finding that, for the latter method, the concrete presented greater resistance with results reaching 29 MPa during the 28 days of age compared to the conventional spray that only reached about 26 MPa at the same age. Alvarado et al. [18] studied the compressive strength of concrete against a number of different curing methods, including the conventional method, curing with sealing material (Vinipel), curing with membrane-forming liquids (Sika antisol S), and accelerated curing (boiling water). It was found that the conventional curing methods, which employed sealant material and membrane-forming liquids, resulted in percentages exceeding 100% of the design f’c. Florez et al. [19] used coverage type sack fiber and coverage polar fleece fabric. Osei et al. [20] determined the compressive strength of concrete using different curing methods (ponding, continuous wetting, open-air curing, and sprinkling with water). In this case, the microstructure was not studied, but Jilin et al. [14] studied various rapid concrete curing methods by analyzing hydration process, properties, and microscopic pore structure of concrete.
At the microstructural level, there is little research that examines the effects of the different curing techniques on the microstructure. Microstructural characterization involves the observation and description of matter on a scale ranging from atomic size to engineering components because certain essential characteristics can be observed within the sample. In this way, to carry out a more complete study of the factors that cause variation in the behavior found during the tests, which can satisfy the unknowns raised from the beginning. In this same order of ideas, the analysis of the microstructure of materials is important not only to control the properties to be obtained in a certain material but also to control the evolution of the properties throughout the life of said material. Several investigations have studied the microstructural properties, particularly those of polypropylene [21], mixtures of fly ash in concrete with granite residues [22], and the microstructural analysis of self-compacting mortar modified with the adhesion of nanoparticles. Additionally, studies have analyzed porosity, voids, and other factors [12]. However, every study involves simultaneous experimentation with an important factor—curing. Moreover, while different compounds may offer benefits, on the other hand, they may show ineffectiveness in other factors [13]. In general, some research studies show the benefits of curing methods such as water curing, immersion, and membrane curing [23], as well as plastic sheeting methods [7,24]. Other studies examine self-curing agents, wrapped curing, accelerators, waterproofing compounds, wet covering, sprinkling, and uncured methods [25]. Steam curing, direct electric curing, and microwave [14], or a combination of these curing methods could be used together or in combination with pressure or heat to further improve the compressive strength [26] at 7, 14, and 28 days, but no research analyzes at 56 days of cured and emphasized the microstructural level, and examines the product of the different curing techniques.
The aim of this research is to analyze microstructurally the effect of four curing techniques such as manual curing (Mc), vinipel wrap curing (Vc), standard curing (Sc) and uncured (Uc) on the compression behavior of concrete cured at 7, 28, and 56 days, highlighting that one of the main focuses is mainly to look for a sustainable alternative that minimizes the use of water resources in the construction industry and even in the manufacture of these, without affecting their mechanical resistance.

2. Materials and Methods

2.1. Cement, Aggregate, and Water

In this study, the gray cement of general-purpose type ART provided by the company Ultracrem S.A.S. (Barranquilla, Colombia) was used. The fine sand was extracted from the quarry of Santo Tomás, Atlántico according to the technical specification ASTM C778 [27], and the coarse sand from Cienega, Magdalena. It should be noted that the water used complies with chemical, microbiological, and physical regulations according to the ACI 308r standard [5]. The mixture design used for the preparation of 100 × 200 mm cylinders is shown in Table 1.
The characteristic of aggregate (fine and coarse) used in this work is the same as those in [28]. Plasticizing additive and retarding agents were used, the first to reduce the water and increase the slump as known and the second to optimize the concrete properties.

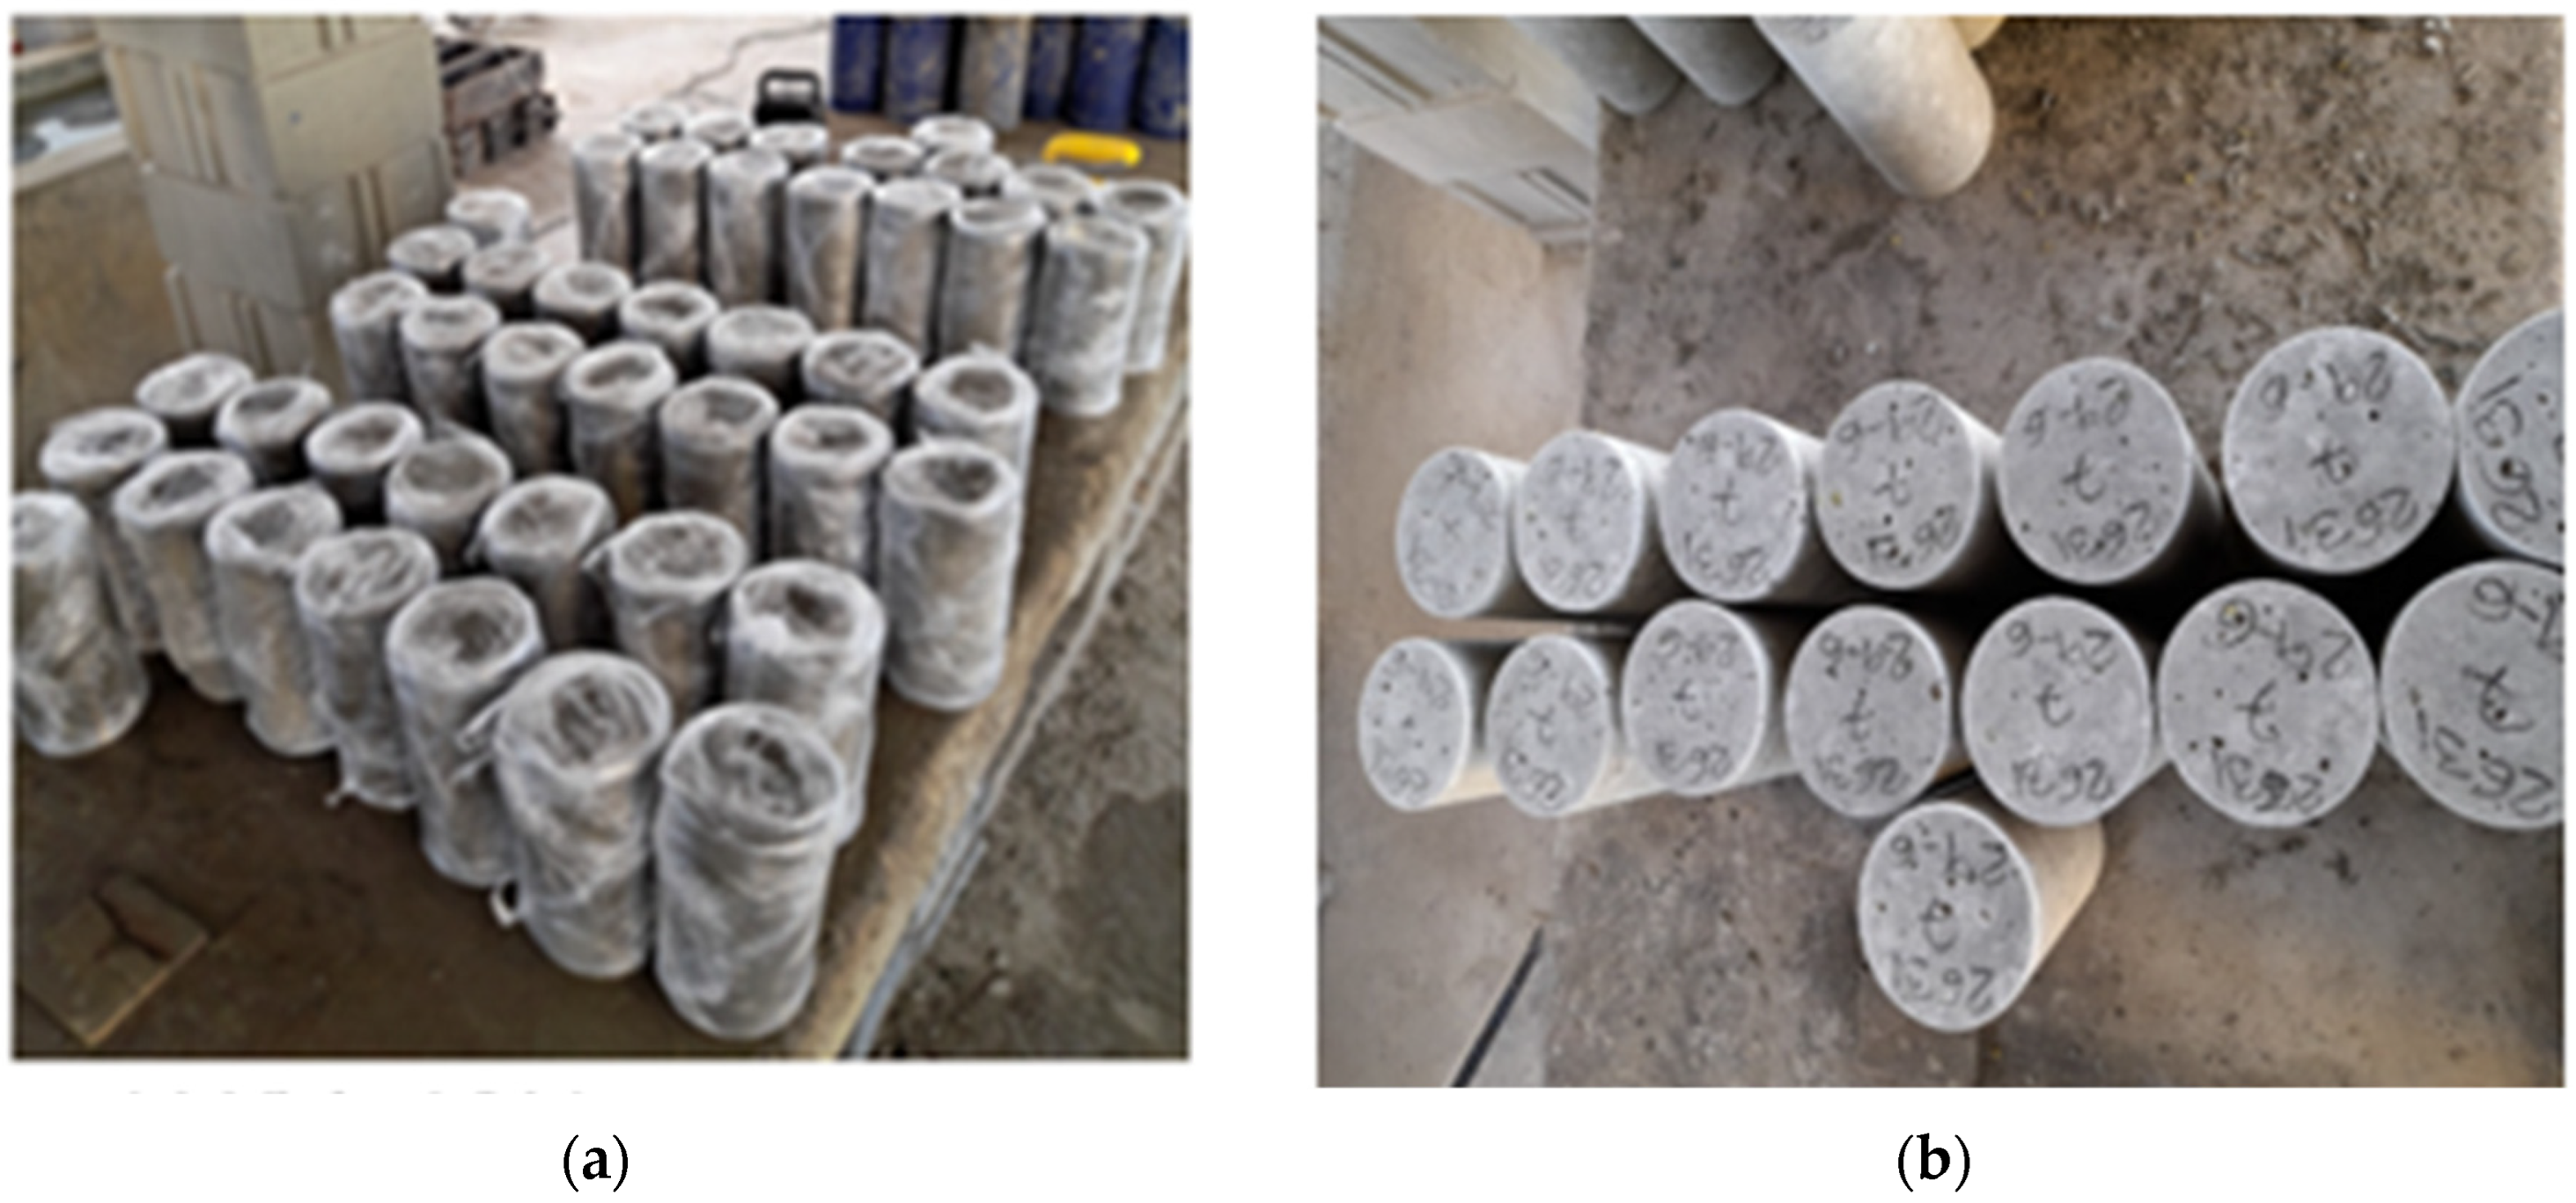
2.2. Cylinder Manufacturing and Curing Techniques

Once the concrete mixture was finished, the respective mold cleaning was carried out to continue with the formwork process. After 24 h, the samples were released from the molds and marked with consecutive numbers to facilitate their identification. Subsequently, the samples were tested using the different curing procedures as shown in Table 2.
A total of 15 cylinders were prepared for each curing technique and age. Figure 1 shows the curing process under the different techniques. Samples were tested for compression according to ASTM C39 [29] at 7, 28, and 56 days of curing using JSM-6490 equipment.

2.3. Microstructural Characterization

The techniques used to characterize the samples were a Scanning Electron Microscope (SEM) equipped with an Energy Dispersive X-ray Spectrometer (EDS). The studies were carried out using a JEOL-JSM 6490LV electron microscope. Analyses were performed on 2 × 2 cm sections of the specimens. The semi-quantification of elements was performed by energy dispersive spectroscopy (EDS) coupled to SEM. Also, all the samples submitted under the different curing techniques were analyzed, observing mainly the hydration products of the formed concrete, impurities, microcracks, and porosity.

3. Results and Discussion

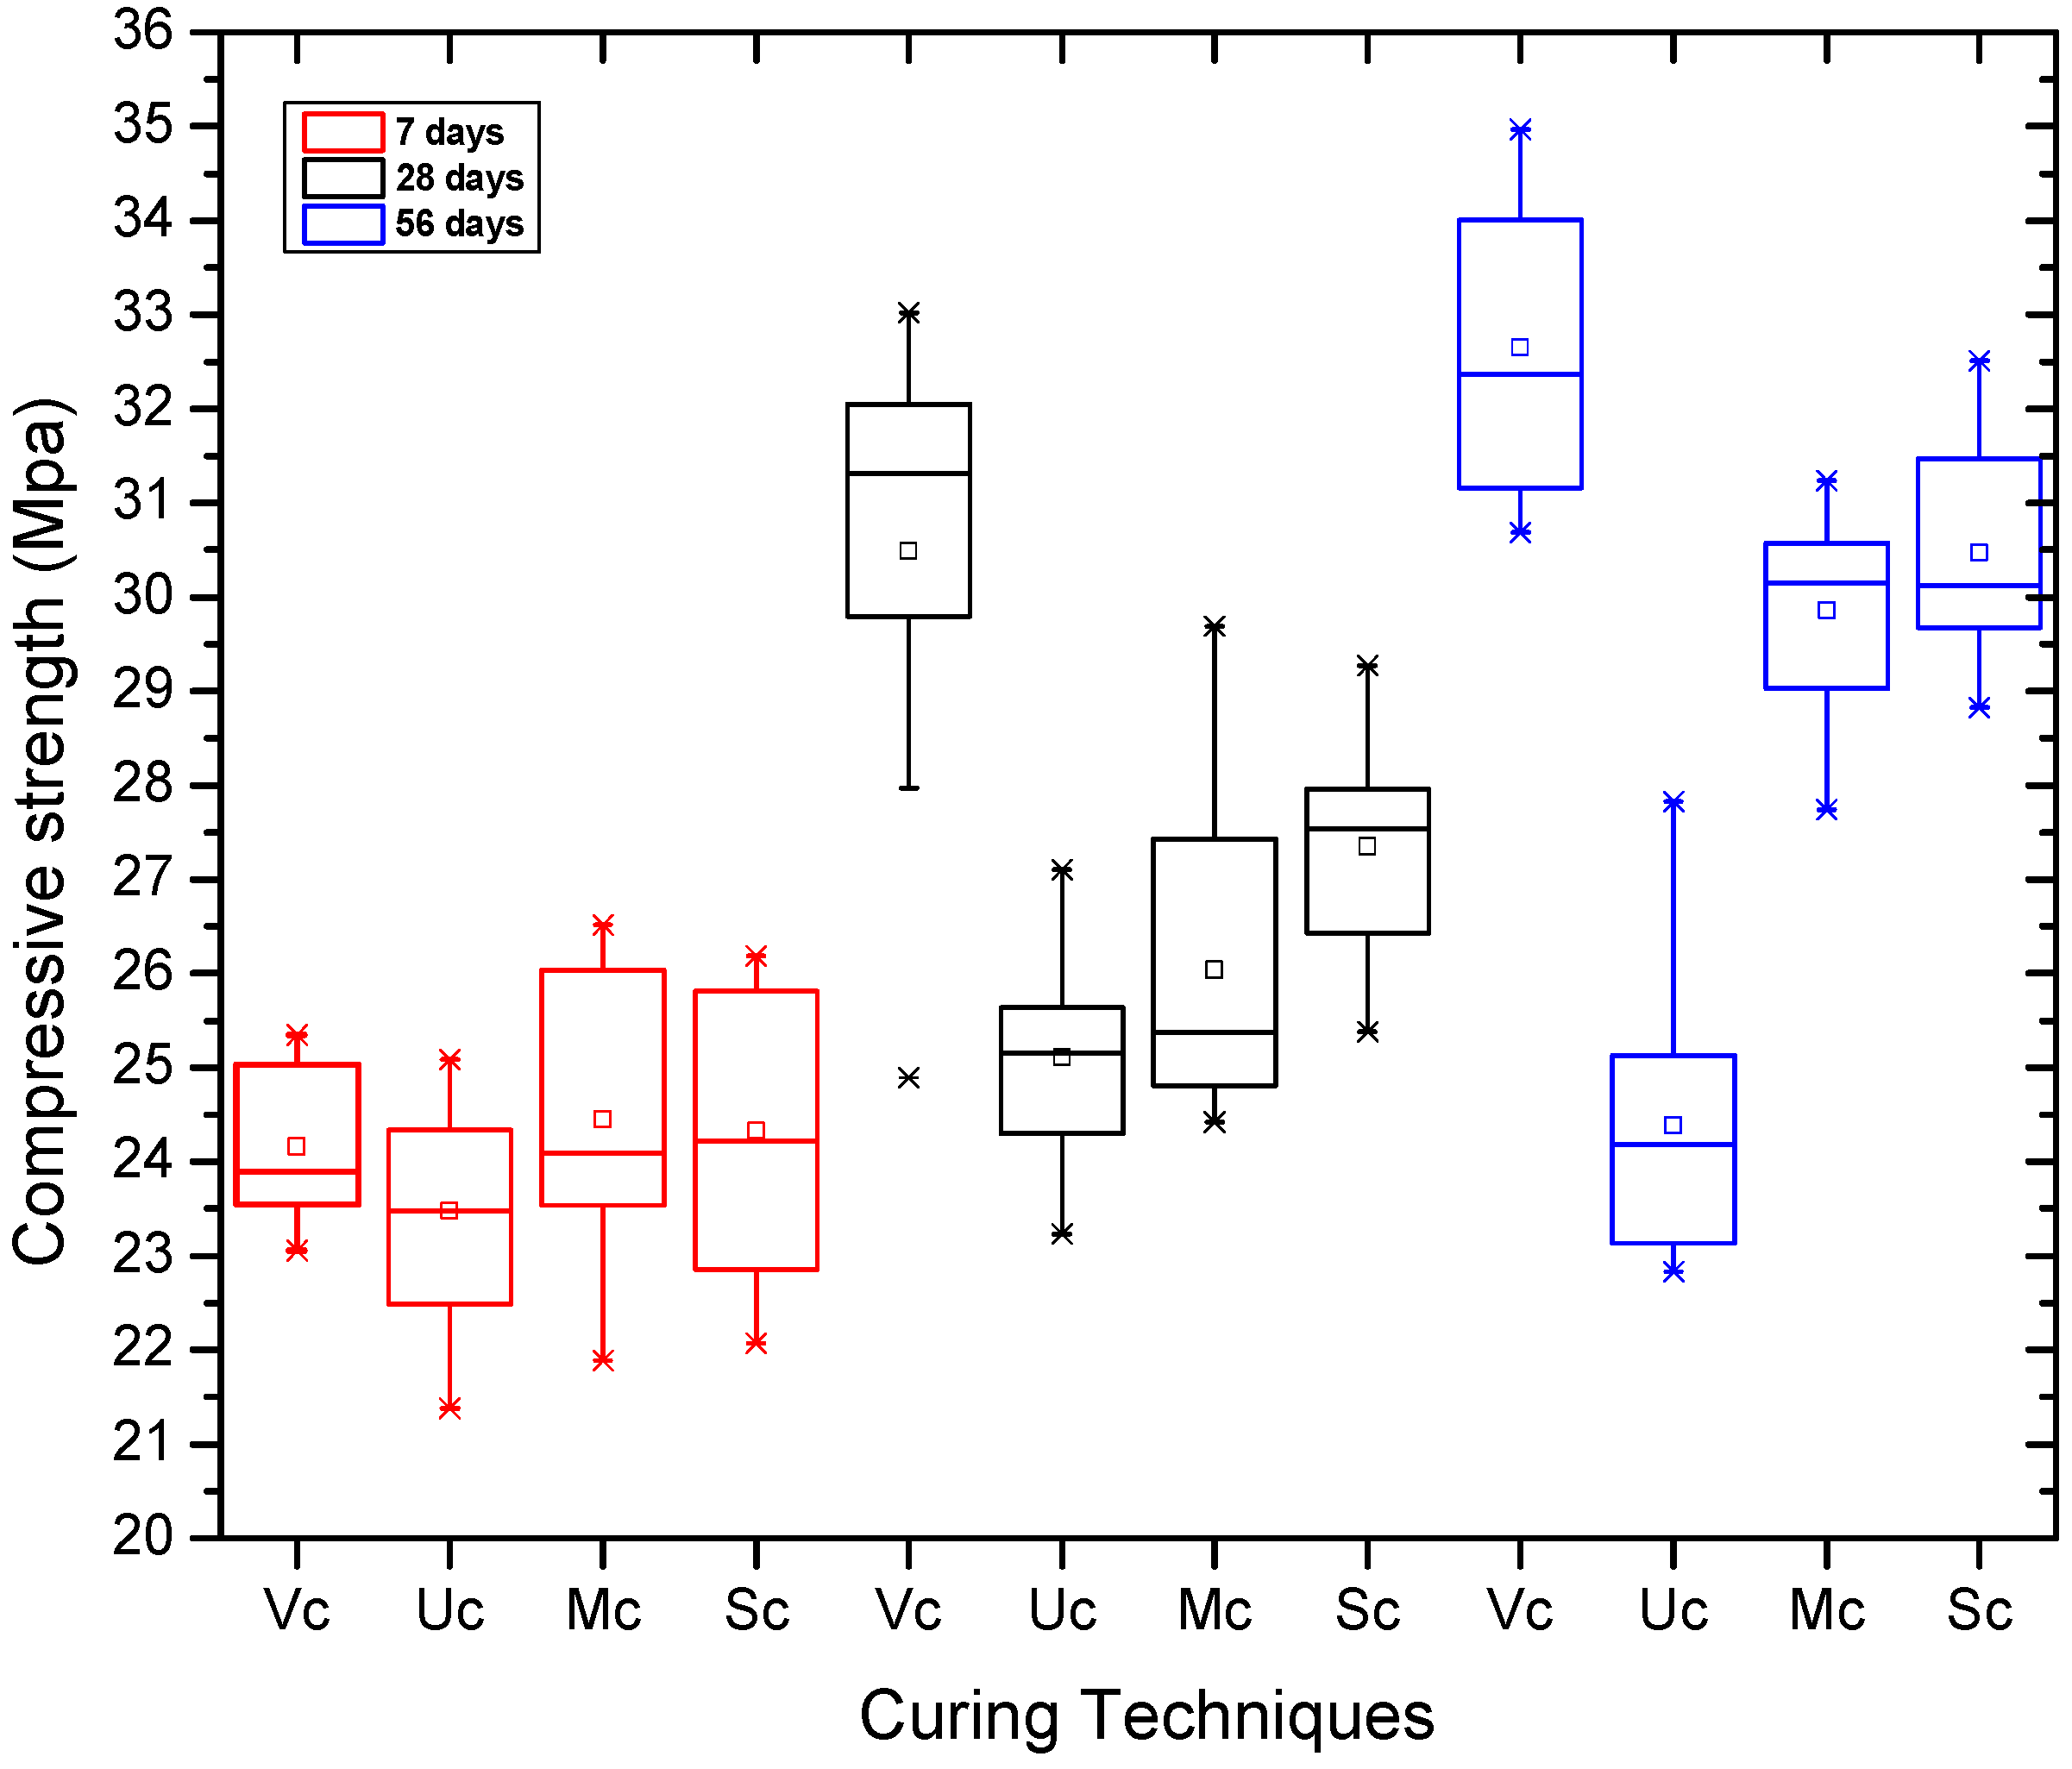
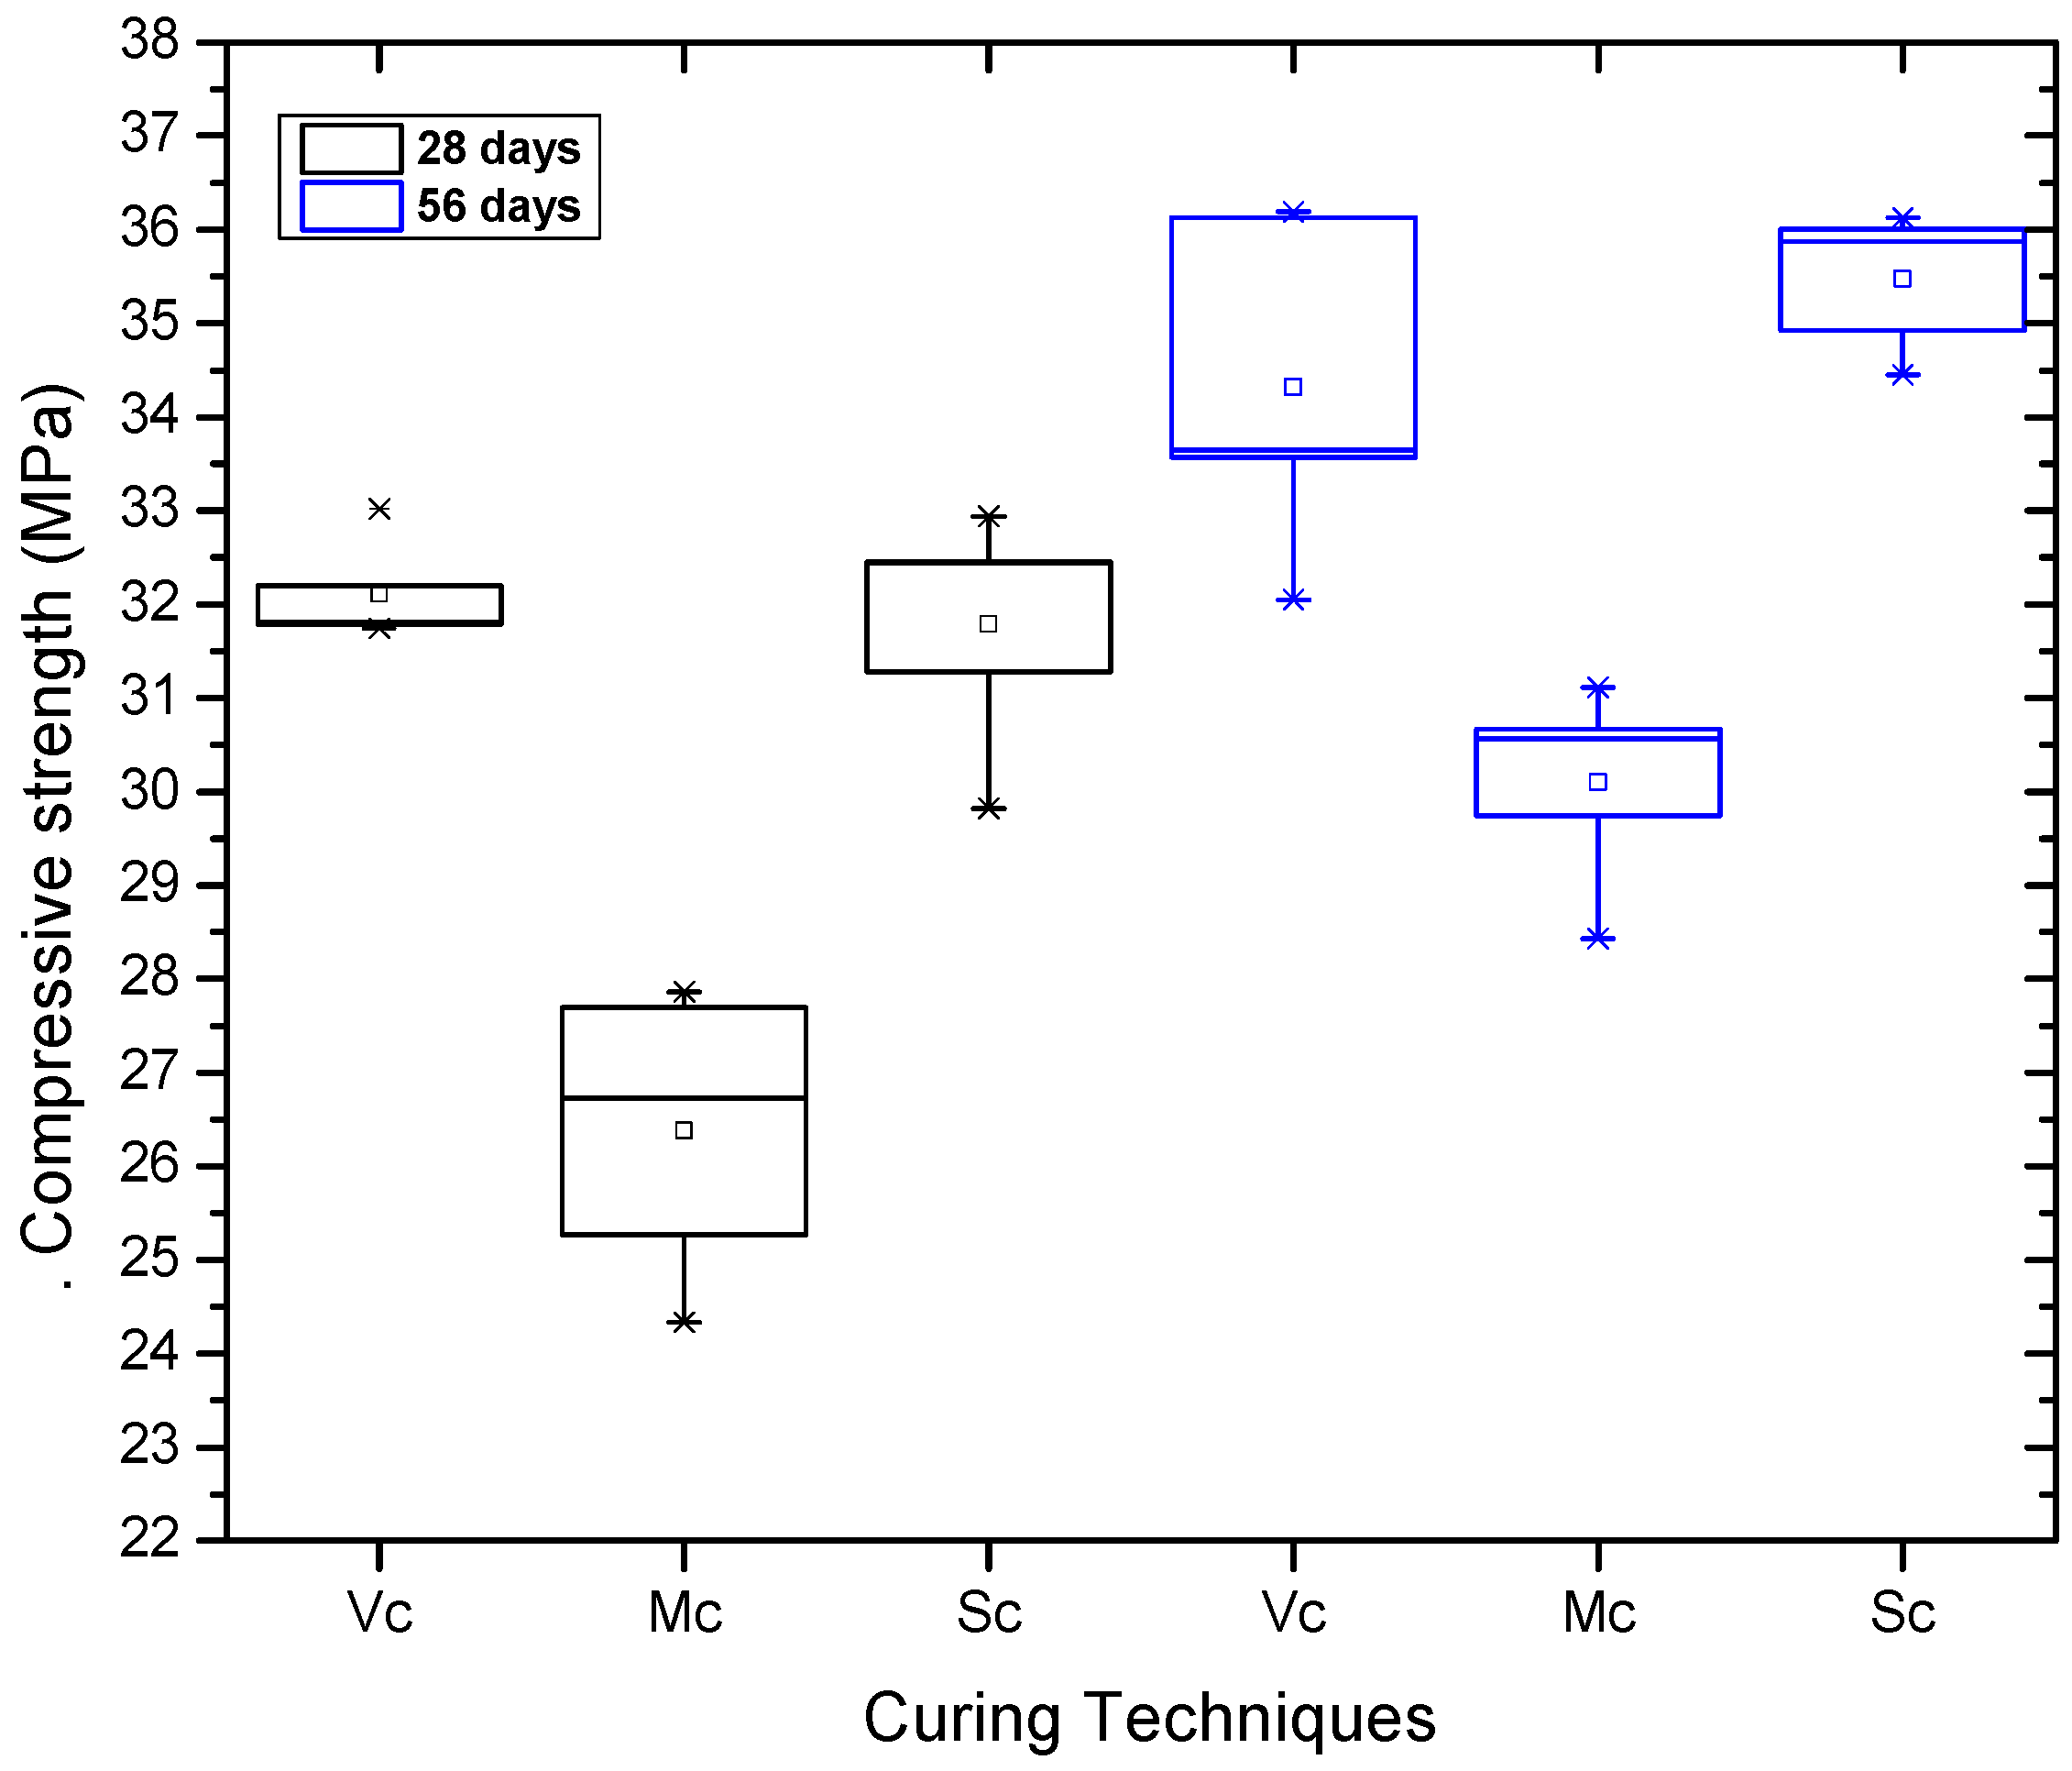
3.1. Analysis of Compressive Strength vs. Curing Techniques

The compressive strength as we know it is a primary characteristic of concrete since it is the ability to support a load provided by some external entity that interacts with the sample. Its result, expressed in terms of effort, allows how resistant this specimen is when applying a load per unit area. This implies some additional factors such as the curing process, during which the concrete sample receives a gain of resistance, ideal to meet the requirements demanded by consolidated regulations. Goel et al. [30] demonstrated that the method and duration of curing greatly affect the strength characteristics of concrete. Figure 2 shows the compressive strength results obtained for each curing technique. It is observed that the curing technique that showed greater compressive strength was the Vc technique at 56 days of curing with a maximum of 34.97 MPa of load per area. It should be noted that, for each of the different curing ages, the compressive strength using the Vc technique was always the highest. This is possibly because the plastic wrap retains as much water as possible, avoiding and/or reducing emissions that can cause moisture loss in the concrete, unlike the other techniques, which involvs the ambient temperature factor and therefore tend to lose moisture or saturate. In this way, an order is observed, in which we identify from highest to lowest the resistance results obtained: Vc > Sc > Mc > Uc.
On the other hand, for comparative purposes, a group of samples had the curing process stopped at 7 days to study their behavior under compression and analyze the estimated duration needed to perform a curing procedure while avoiding water losses, and thus conserving this resource. This analysis would be a significant advancement in the field of construction and an activity aligned with the concept of sustainable development, especially the SDG nine objective, which aims to achieve a sustainable, rigid, and excellent quality infrastructure for all people, to promote innovative industries in accordance with sustainability parameters using clean and environmentally friendly technologies and industrial procedures, as well as technology, innovation, analysis, and research to achieve greater progress. In this sense, Figure 3 shows the results of the compression tests of these samples. It is observed that the Vc technique presents the highest resistance compared to the other techniques. The percentage increase in the Vc technique was 3.4% at 56 days of suspension and 2% at 28 days of suspension, while there was a 9.7% increase in the Sc technique at 56 days and an 11% increase at 28 days of suspension. Meanwhile, in the Mc technique, resistance decreased by 6% at 28 days of suspension, and 56 days of suspension, it did not vary much, showing only a 0.3% difference. It is highlighted that the resistance of the samples left to cure was higher in percentage compared to the samples that were maintained throughout the curing process, as shown in Figure 2.

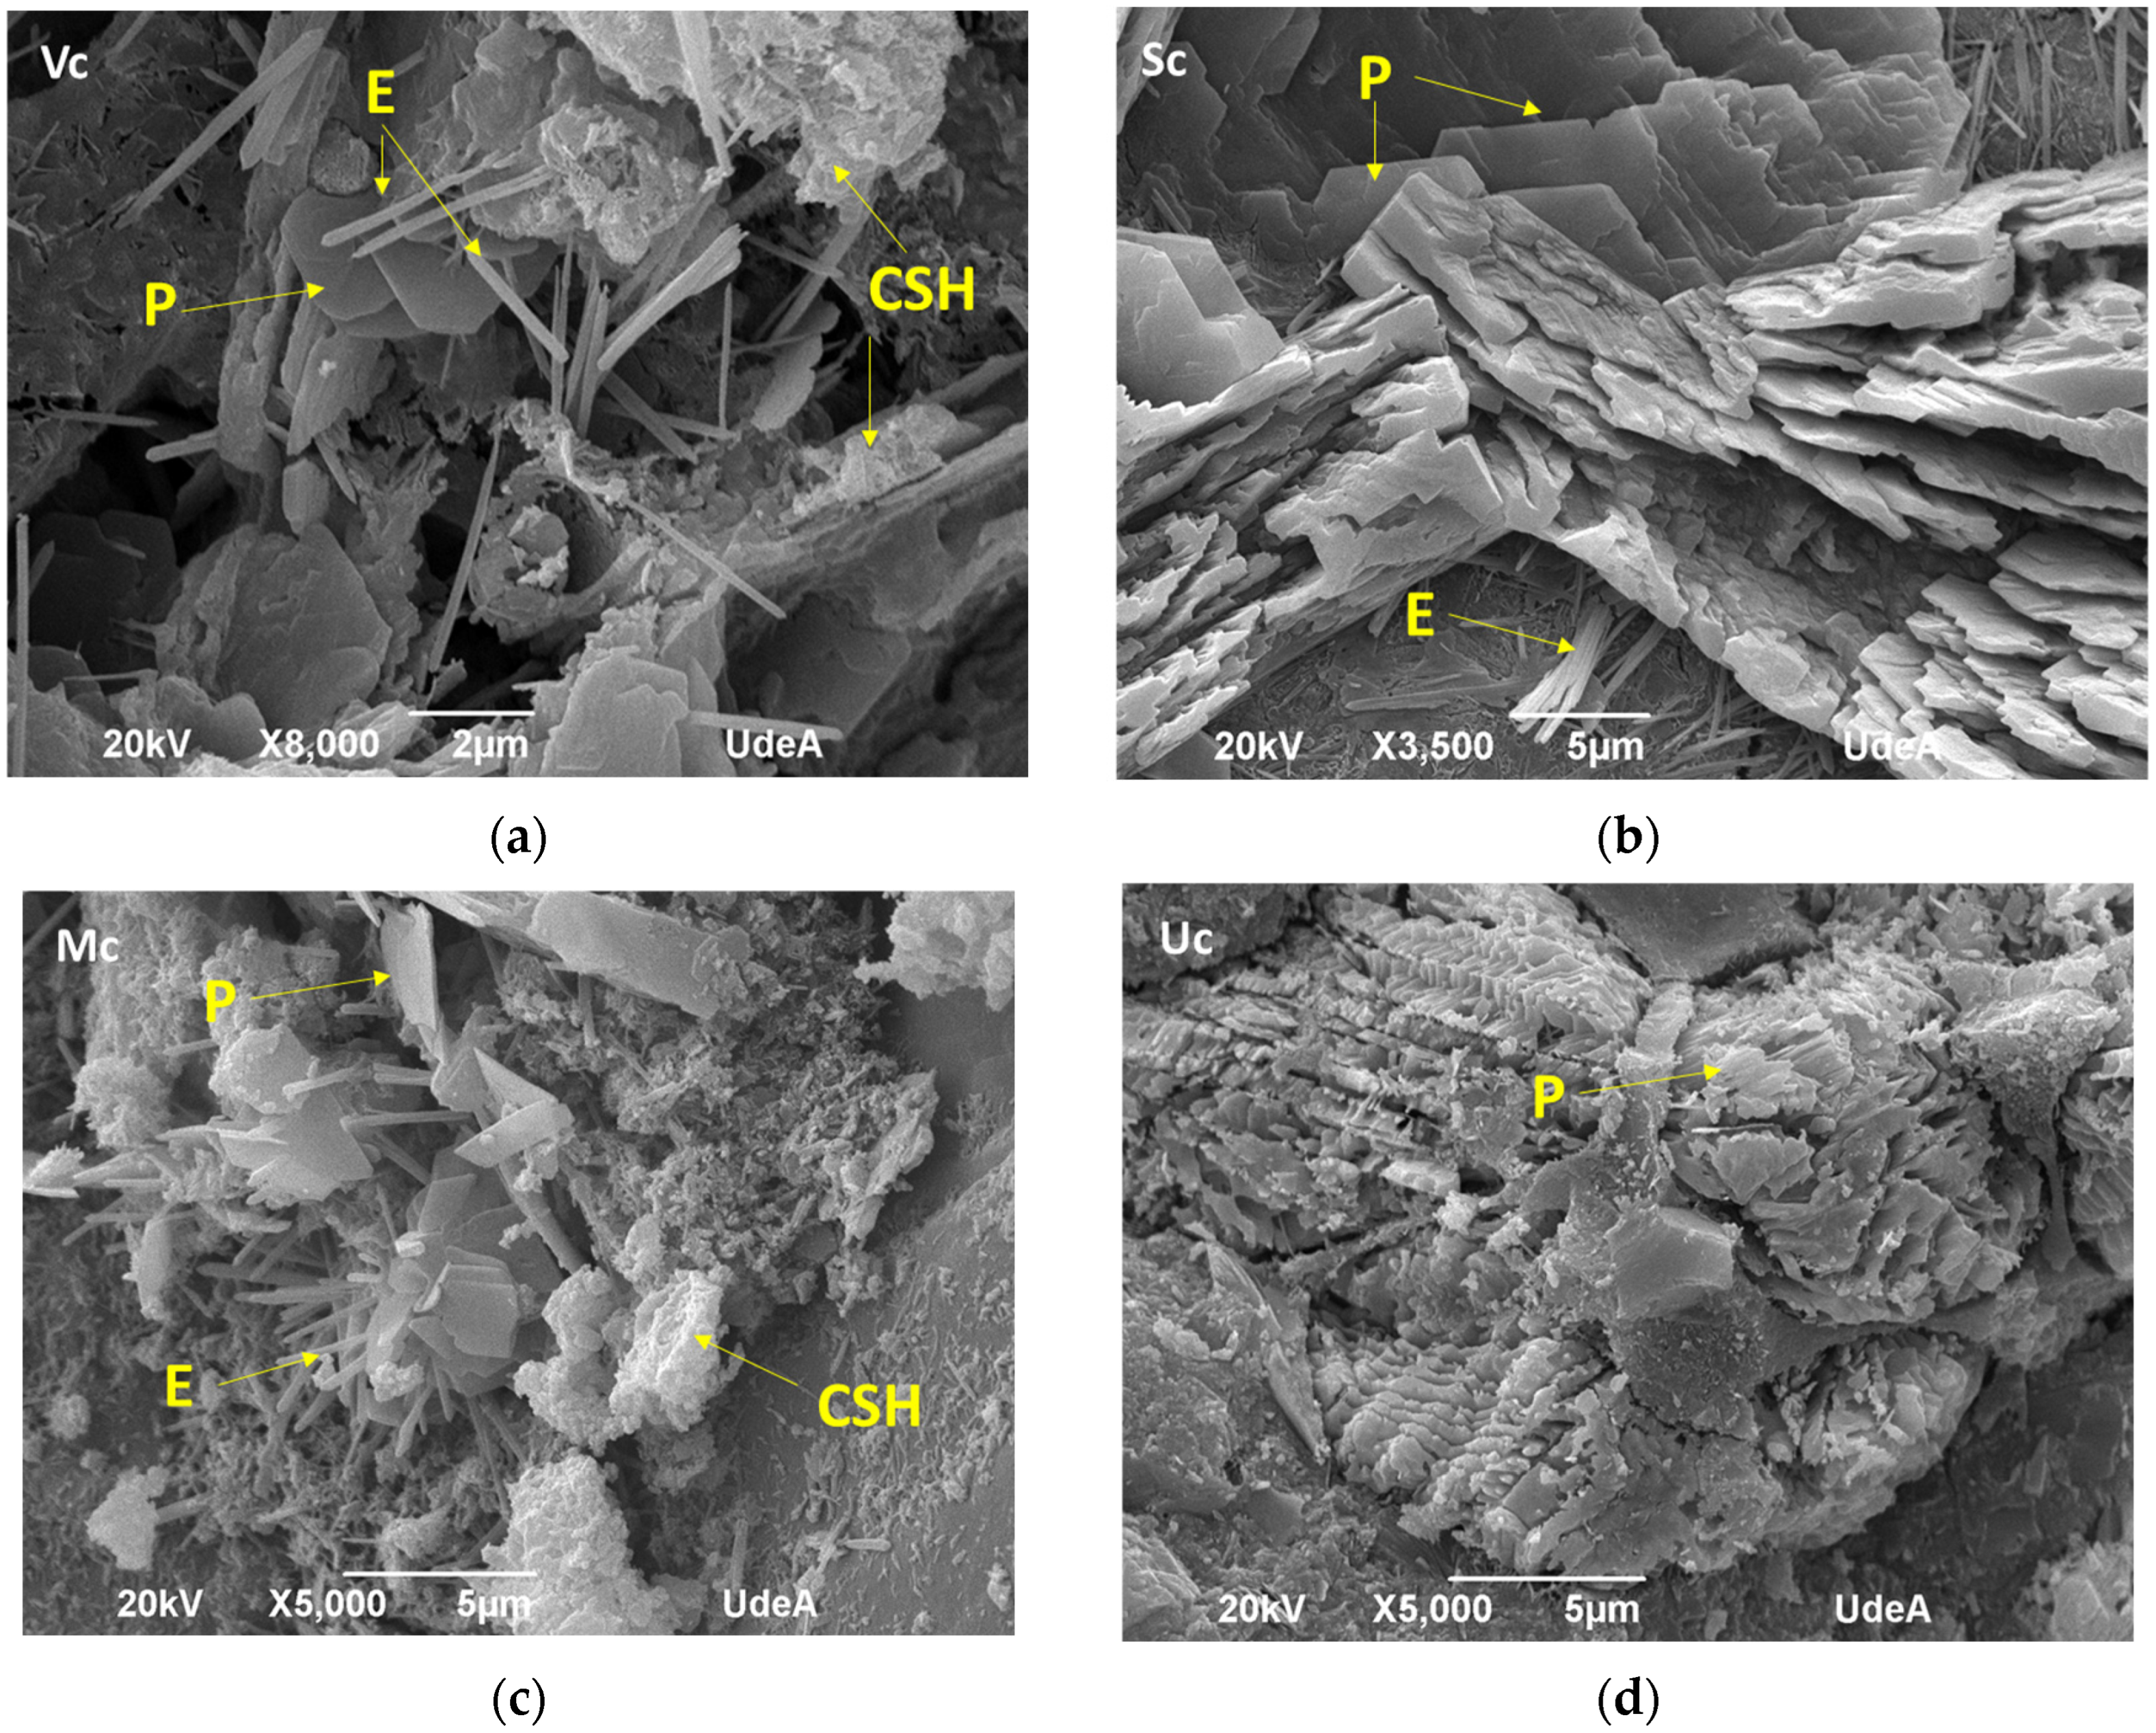
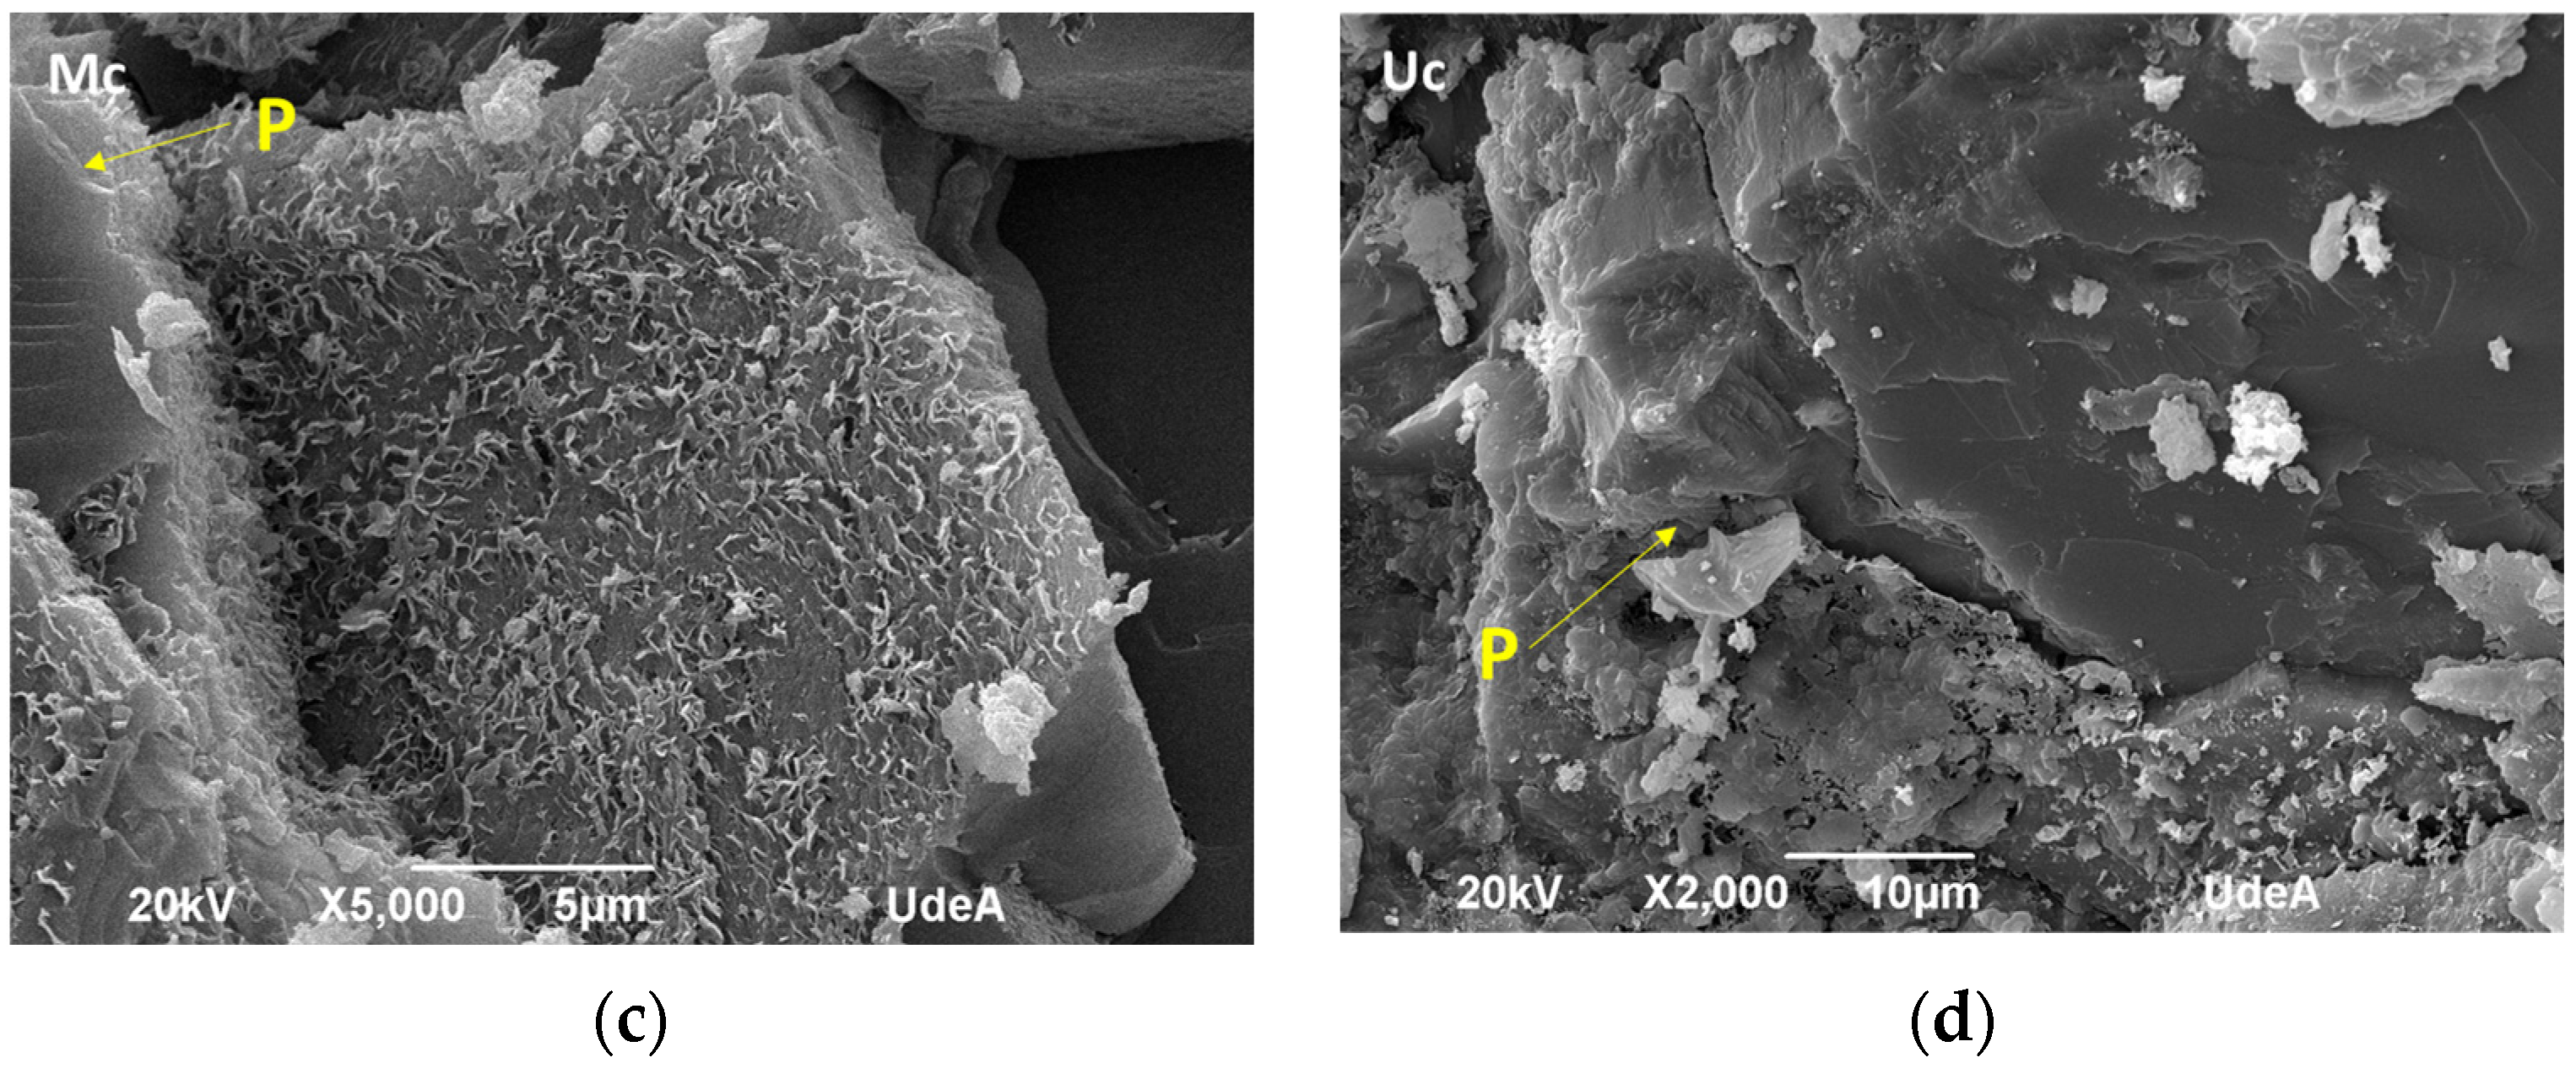
3.2. Analysis of Hydration Products Under the Different Curing Techniques

The curing process of cement-based materials depends on the application of an appropriate moisture content and temperature in order to achieve the requisite degree of hydration and performance [31]. The cement hydration products are generated through a process in which the cement, together with aggregates, interacts with water, forming crystalline structures. These structures transform the mortar into a material capable of joining fragments, resulting in a more compact whole [32]. These hydration products can be identified in the concrete, and according to the scientific literature, they include tobermorite (T) with the chemical formula Ca5Si6O16(OH)2·4H2O, which is responsible for the internal reinforcement of the cement mixture, joining the aggregates in the mortars; portlandite (P), with the chemical formula Ca(OH)2, which maintains the pH of the mixture within the necessary range of 12–13 and also acts as an anticorrosive in corrosion processes that may occur in reinforced concrete; ettringite (E), with the chemical formula Ca6[Al(OH)6]2(SO4)3·26H2O, which is easy to identify due to its elongated crystals that add adhesion to the concrete [32,33]; and finally, hydrated calcium silicate (CSH), which is responsible for the internal resistance of the concrete. These products were found in the samples analyzed by SEM. At 7 days, in the different techniques, formations of E, P, and CSH were observed to a greater extent. Additionally, pores or rounded cavities rich in E were noted. In general, only a few P plate formations were shown, suggesting that curing with lime in Sc affected their generation, making them slightly distinct since they were rough and stacked. On the surface, very small E formations were observed in certain cavities, as well as traces of T and partially formed P. Figure 4 shows the hydration products formed at 28 days of curing for the different techniques used. In general terms, at 28 days of curing: (a) the presence of E was noticed, along with CSH covering the entire area shown, as well as portlandite formation, which, over time, solidifies, (b) The surface exhibits fully formed E and P, with a highly notorious presence in the upper part. (c) E is concentrated in the area specified in the figure, which also shows a low presence of P forming near the area described. However, no other evidence of products is observed in the photographic sample, (d) a small presence of P is found, but no significant details are noted because no curing process was applied.
Similar results were observed after 56 days of curing, with a fairly compact paste in which a crack was observed, in addition to a low presence of E, complemented by an abundant presence of P, still formation. Identifying specific hydration products was challenging due to the limited area studied. However, a very small amount of E was noted, though it was not clearly distinguishable. Finally, a significant presence of P plates was observed, indicating the dominance of an important product in the strength of concrete. Figure 5 shows hydrated cement products in samples where curing was stopped after 28 days. (a) A cavity with abundant formation of E is visible, which was expected due to the curing technique provided allowing for good concentration and retention of liquid [34]. (b) A smaller quantity of E is observed, though it stands out against its surroundings. Additionally, a cavity with well-formed P and E is present. (c) A very small P-filled cavity is located in the corner of the image, while the surrounding area shows roughness and ongoing product formation. (d) A low presence of P is noted, appearing around a more solid surface of crushed aggregate, which covers most of the area.

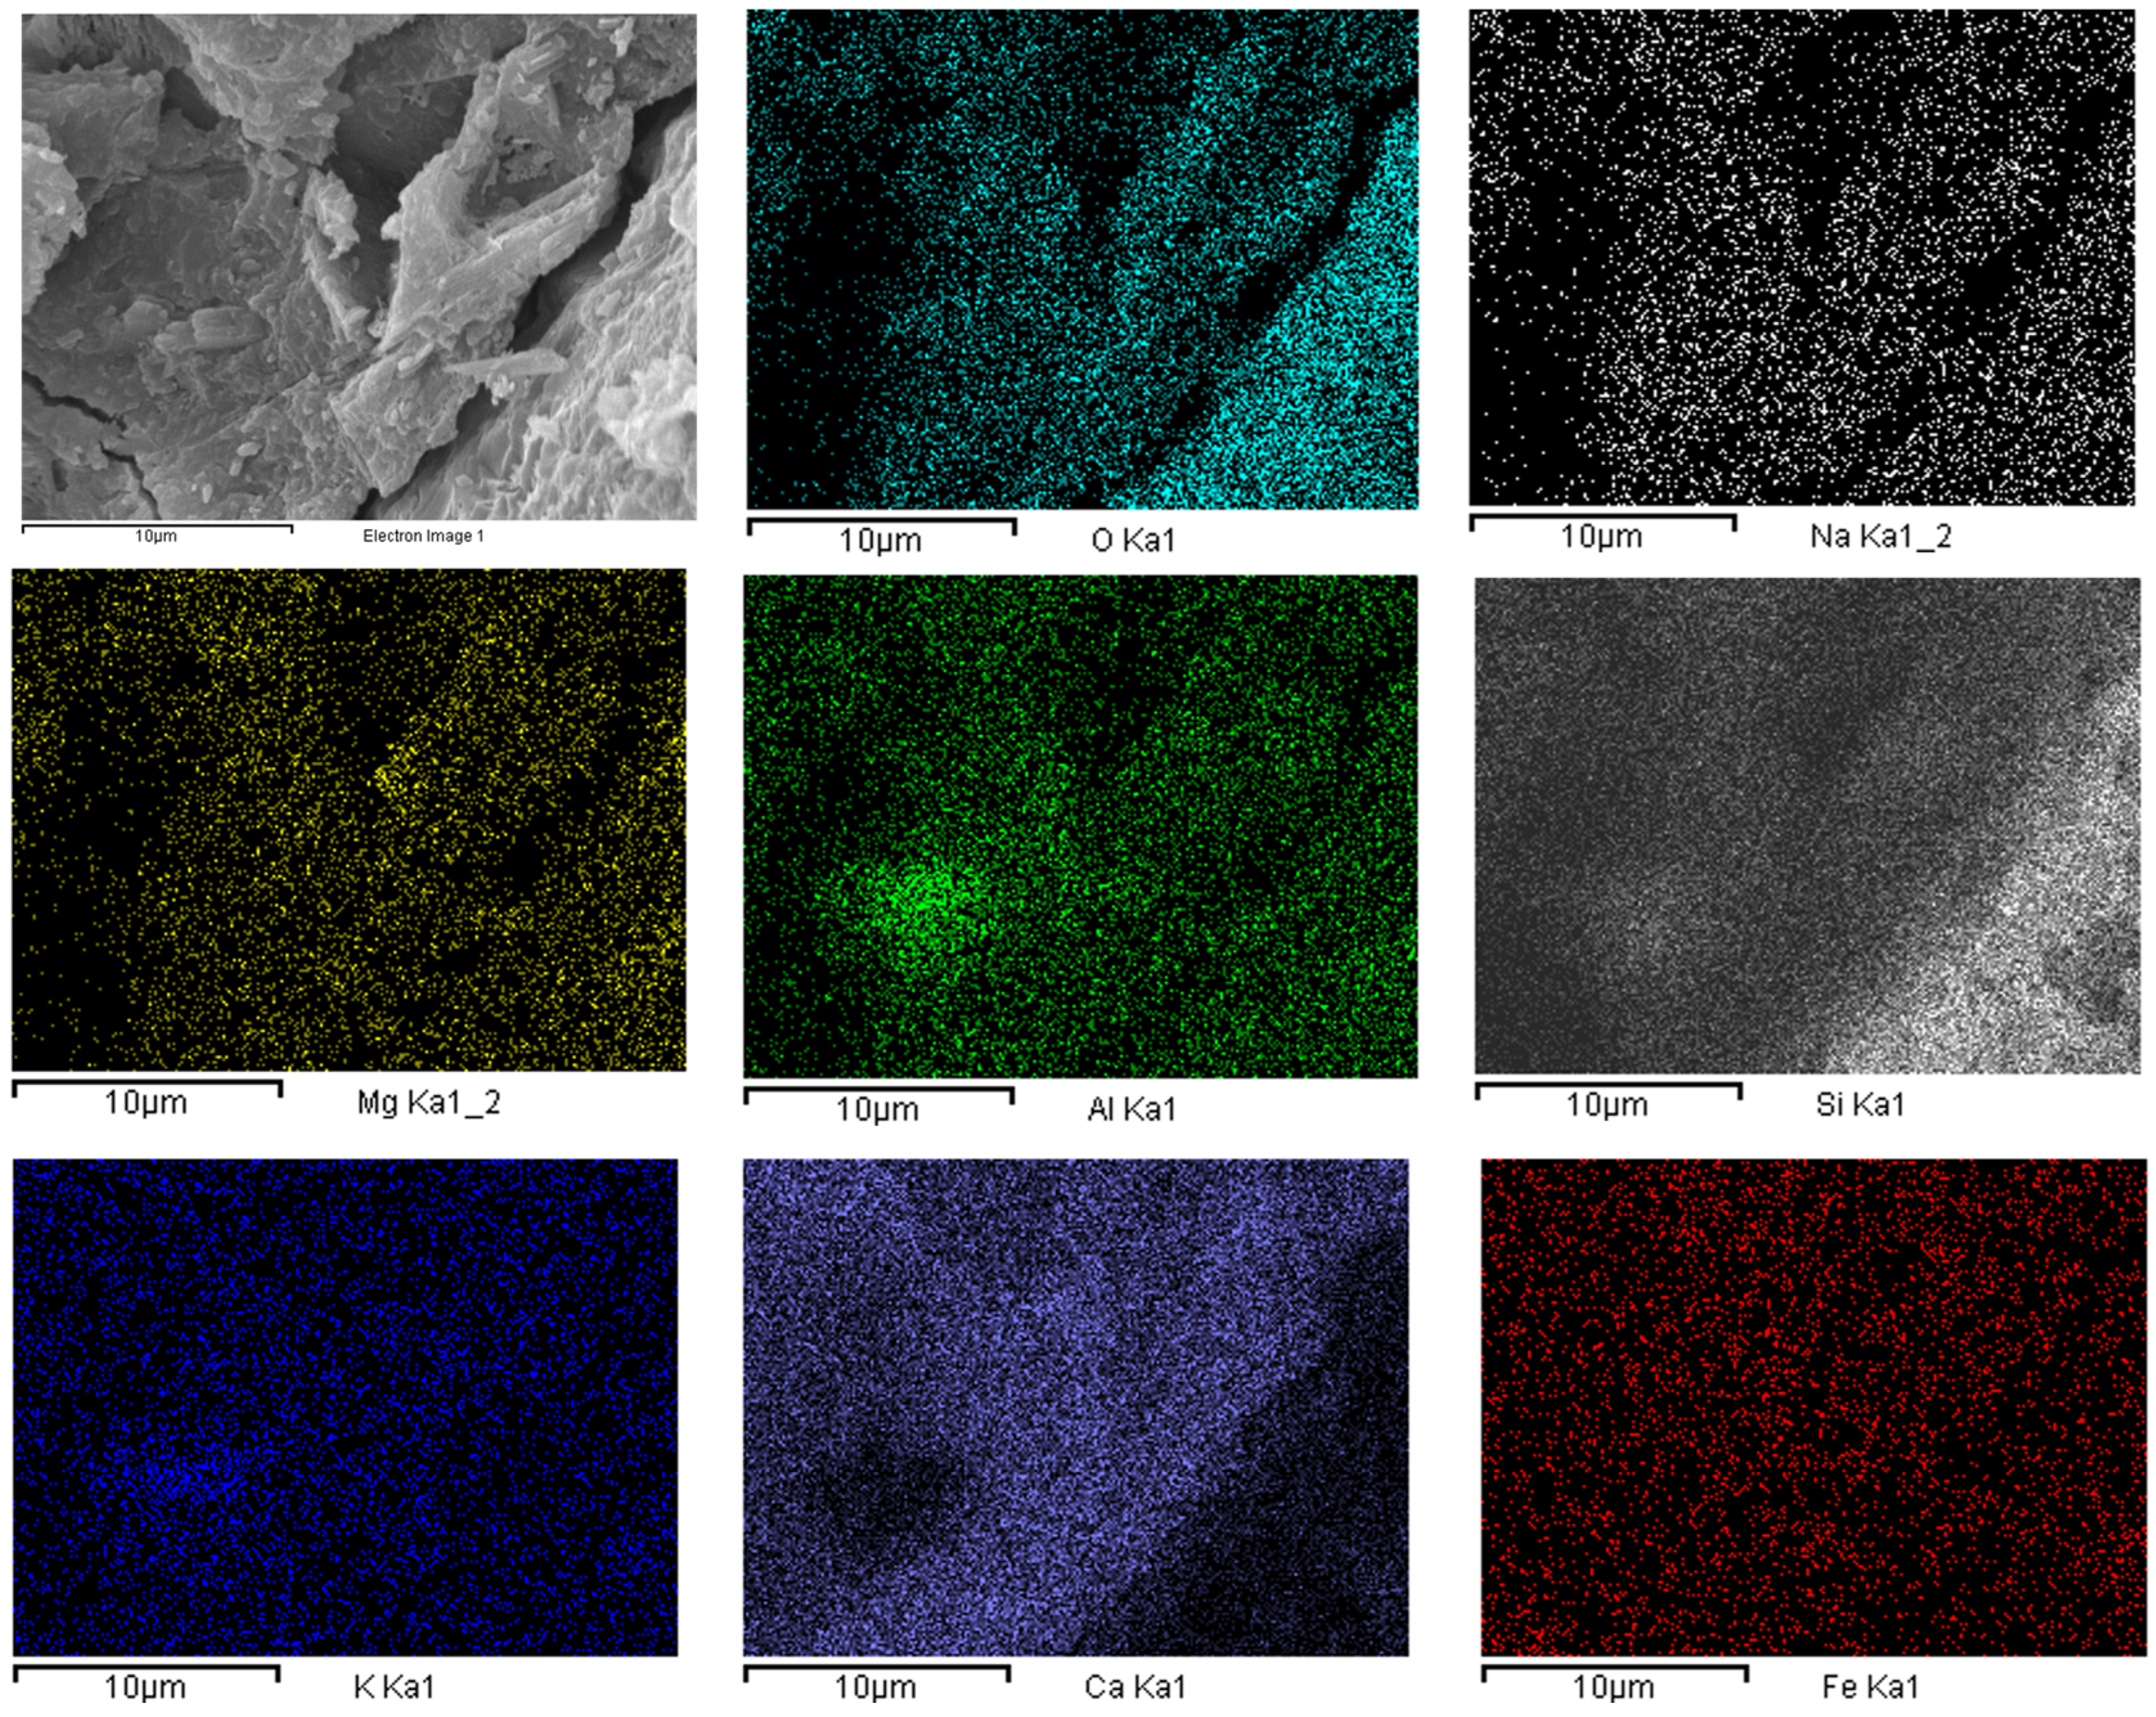
3.3. Elemental Mapping (Chemical Composition Analysis)

Figure 6 shows the compositional analysis carried out using SEM-EDS Maps on different samples of concrete cured under Mc techniques. Compositional maps are based on X-ray intensity, providing qualitative information about the spatial distribution of elements. This mapping method allows for comparative analysis of elemental distribution within the same region or different regions of given sample. Figure 6 shows the elemental mapping of the Mc sample after 28 days of curing. A homogeneous distribution of elements such as Si, Fe, Na, K, O, and Mg is observed. The Ca (shown in light blue) distribution appears darker in some areas, indicating a low concentration of Ca (27.13%) in those regions; likewise, the brighter regions corresponding to AI indicate that this element (1.67%) is more concentrated in those areas.
Similar results were observed for the sample cured by Sc at 28 days of curing. The elements O, Al, Si, Ca, and Fe were observed. In this case, Ca was noted with greater presence, comprising 50% of the weight; it is consolidated as the most influential element in the compositional structure of the sample. In the case of a Vc-cured concrete sample after 28 days of curing, the O, Al, Mg, Si, Ca, and Fe were observed. Ca was noted as the most prominent element in the sample, comprising 41% of the weight. Several investigations show the importance of EDS maps. One such study is on elementary zoning in marine concrete [25,35], which involved microstructural studies of concrete exposed to different marine environments for periods ranging from 2 to 34 years. Their evolutions included complete optical and electronic microscopic follow-up. They analyzed a total of 21 concrete samples collected from nine specific locations along the coasts between Norway and Denmark. A key observation was the presence of distinct surface regions in concrete exposed to sea, influenced by the location or composition of the binder. Notably, significant amount of magnesium were found, along with an area rich in sulfur and another with a high concentration of chlorine. In addition, in areas without apparent damage, a resurgence of sulfur was observed at specific points where damage had previously been identified.
Maps reveal several elements that positively influence the conservation and resistance of concrete. However, some components stand out more than the others. Among these, silicon (Si) is the most intense element, according to research. It is highly beneficial due to its excellent absorption capacity, ability to retain moisture, and role in maintaining temperature, which are essential factors for concrete curing [36]. Another prominent element is calcium (Ca), which was found using all three techniques mentioned in the previous figures. It is known that Ca improves mixing capabilities, making concrete more plastic and workable. Additionally, it contributes to improving properties of concrete when assessing its maximum strength at different ages [37]. Figure 7 shows some spectra obtained in the different areas analyzed for each curing technique.
In this, a high concentration and weight of calcium are observed in the Sc (65.9%) and Vc (44.89%) techniques. However, in Mc, the element that stands out in image (a), representing the manual curing technique, is silicon, with 23.64%, making it the most prevalent element in the structure of the sample and present in the sand used for mixing. It should be noted that in the three spectra, these two elements (silicon and calcium) serve the same function within the mortar structure. Throughout the days of curing, they help the generation of resistance in the sample, provide necessary fluidity, and offer good management in low temperatures. These elements are found in materials such as sand and crushed.

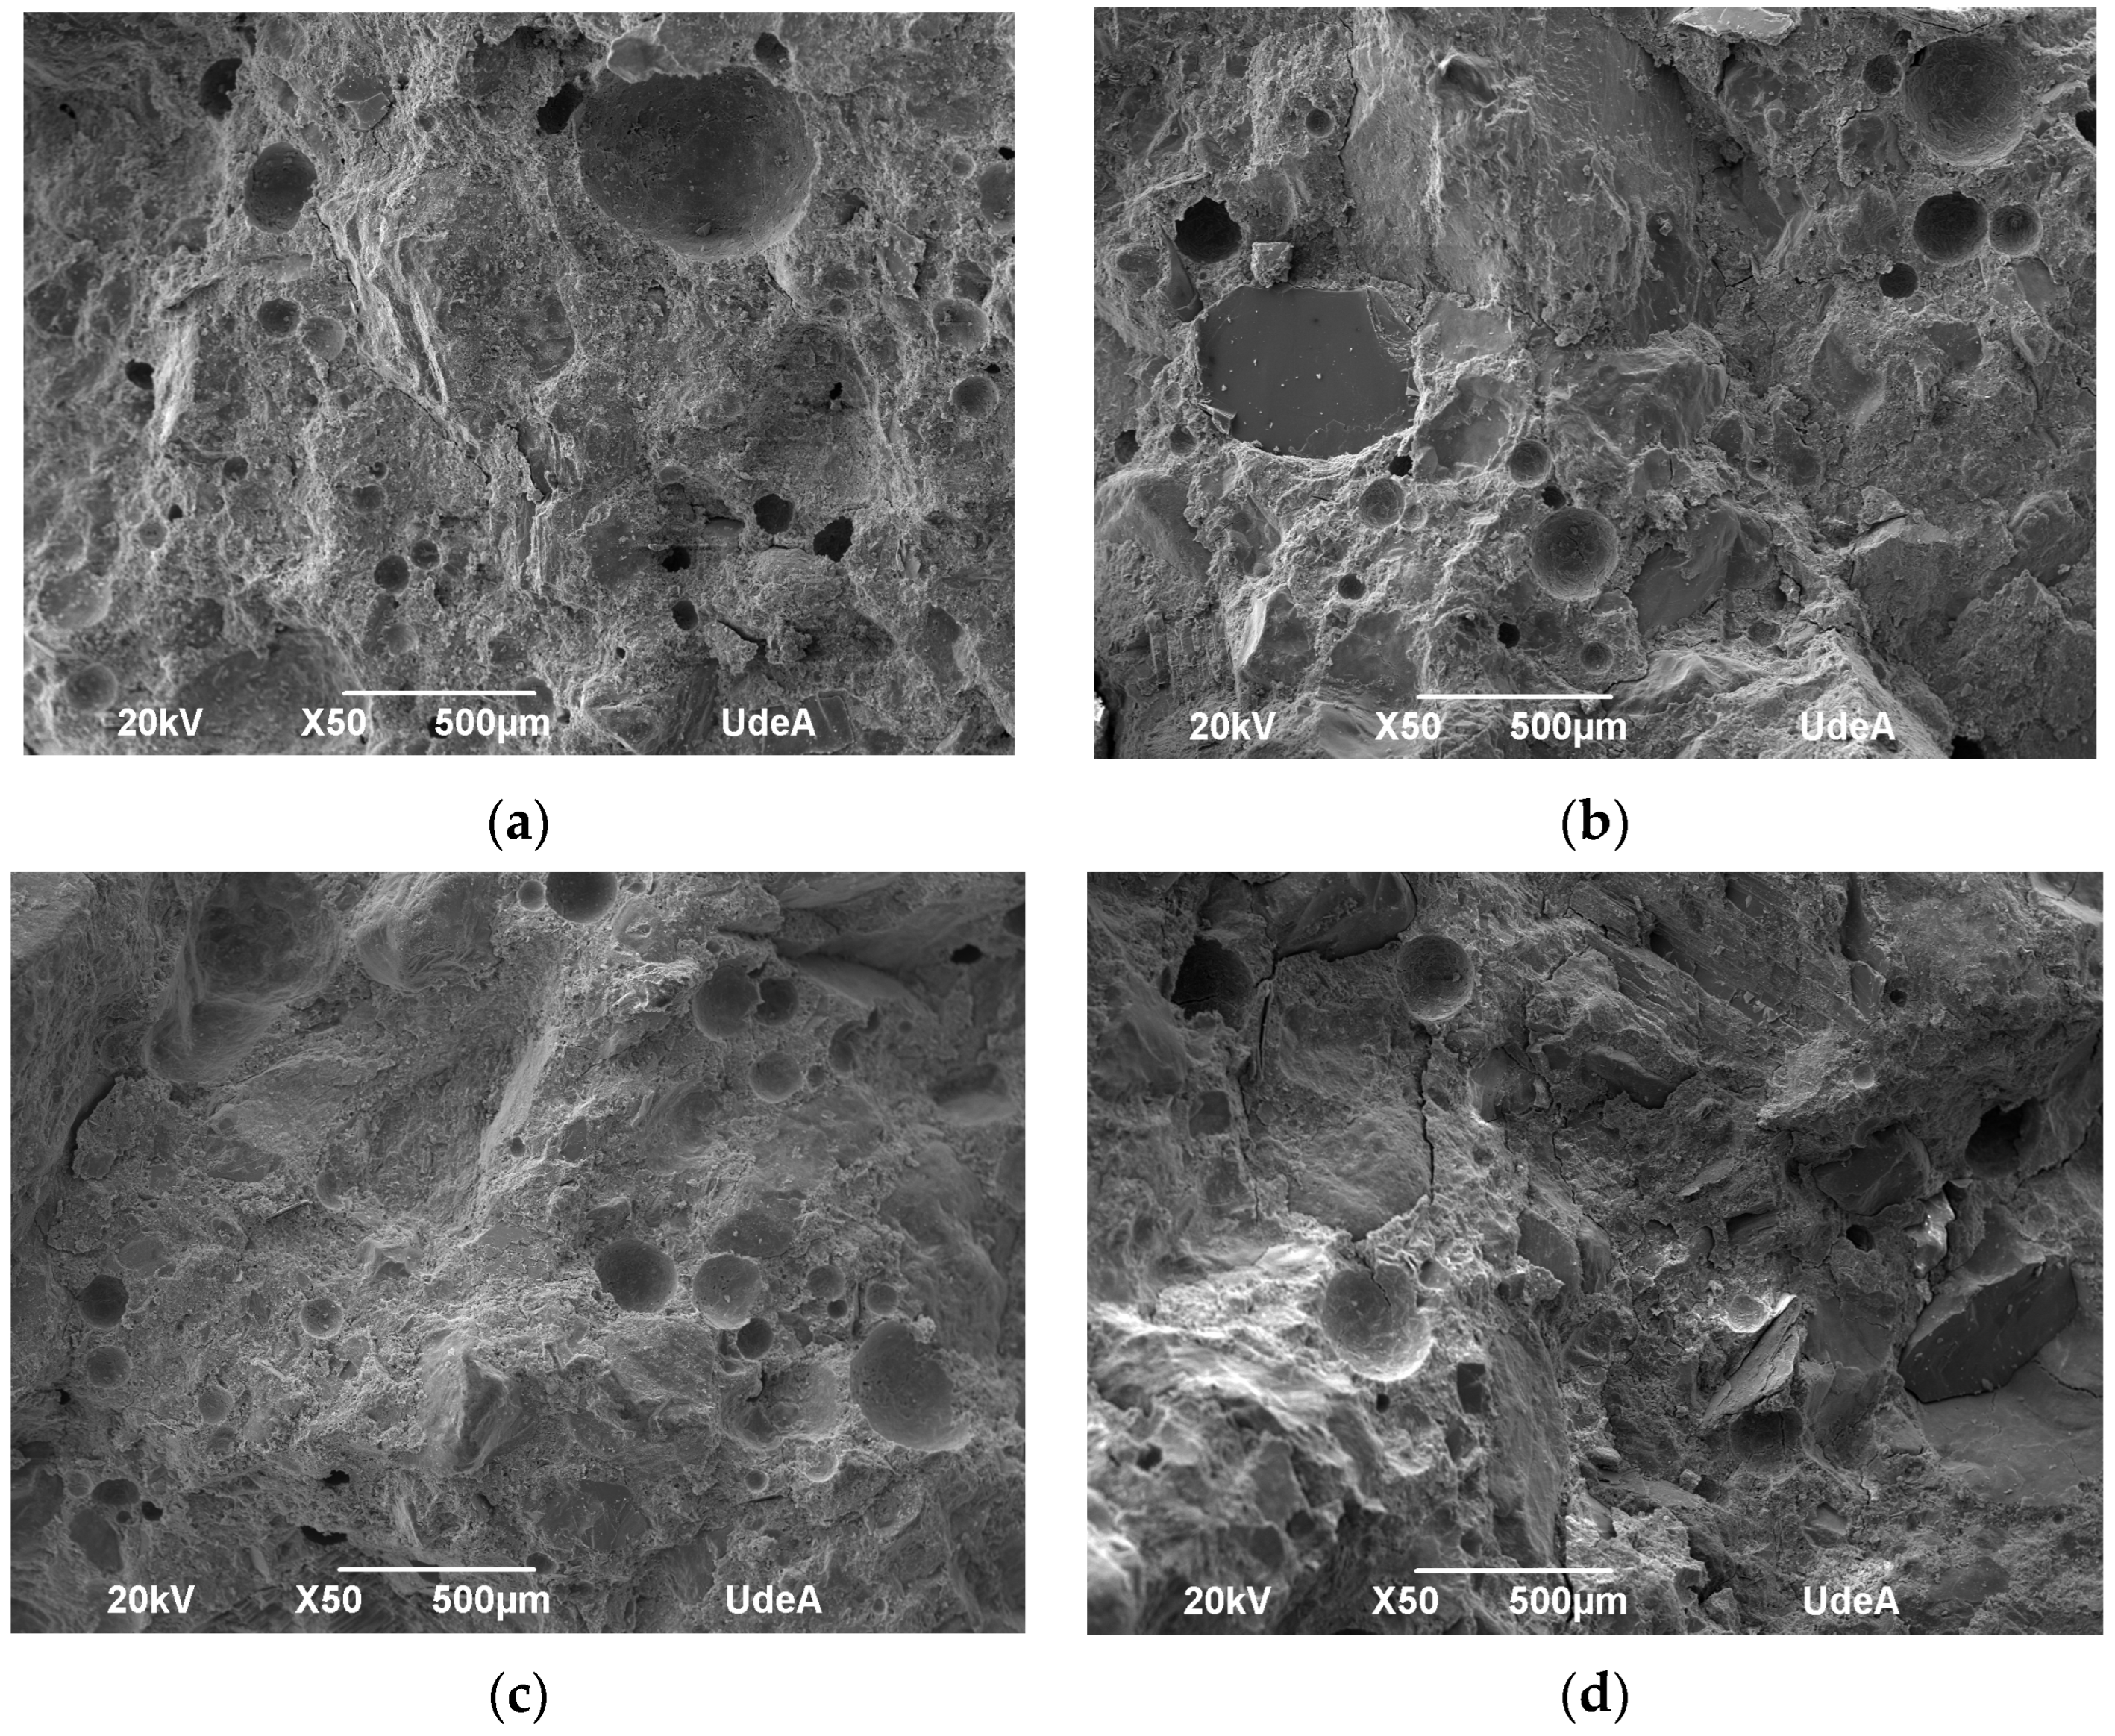
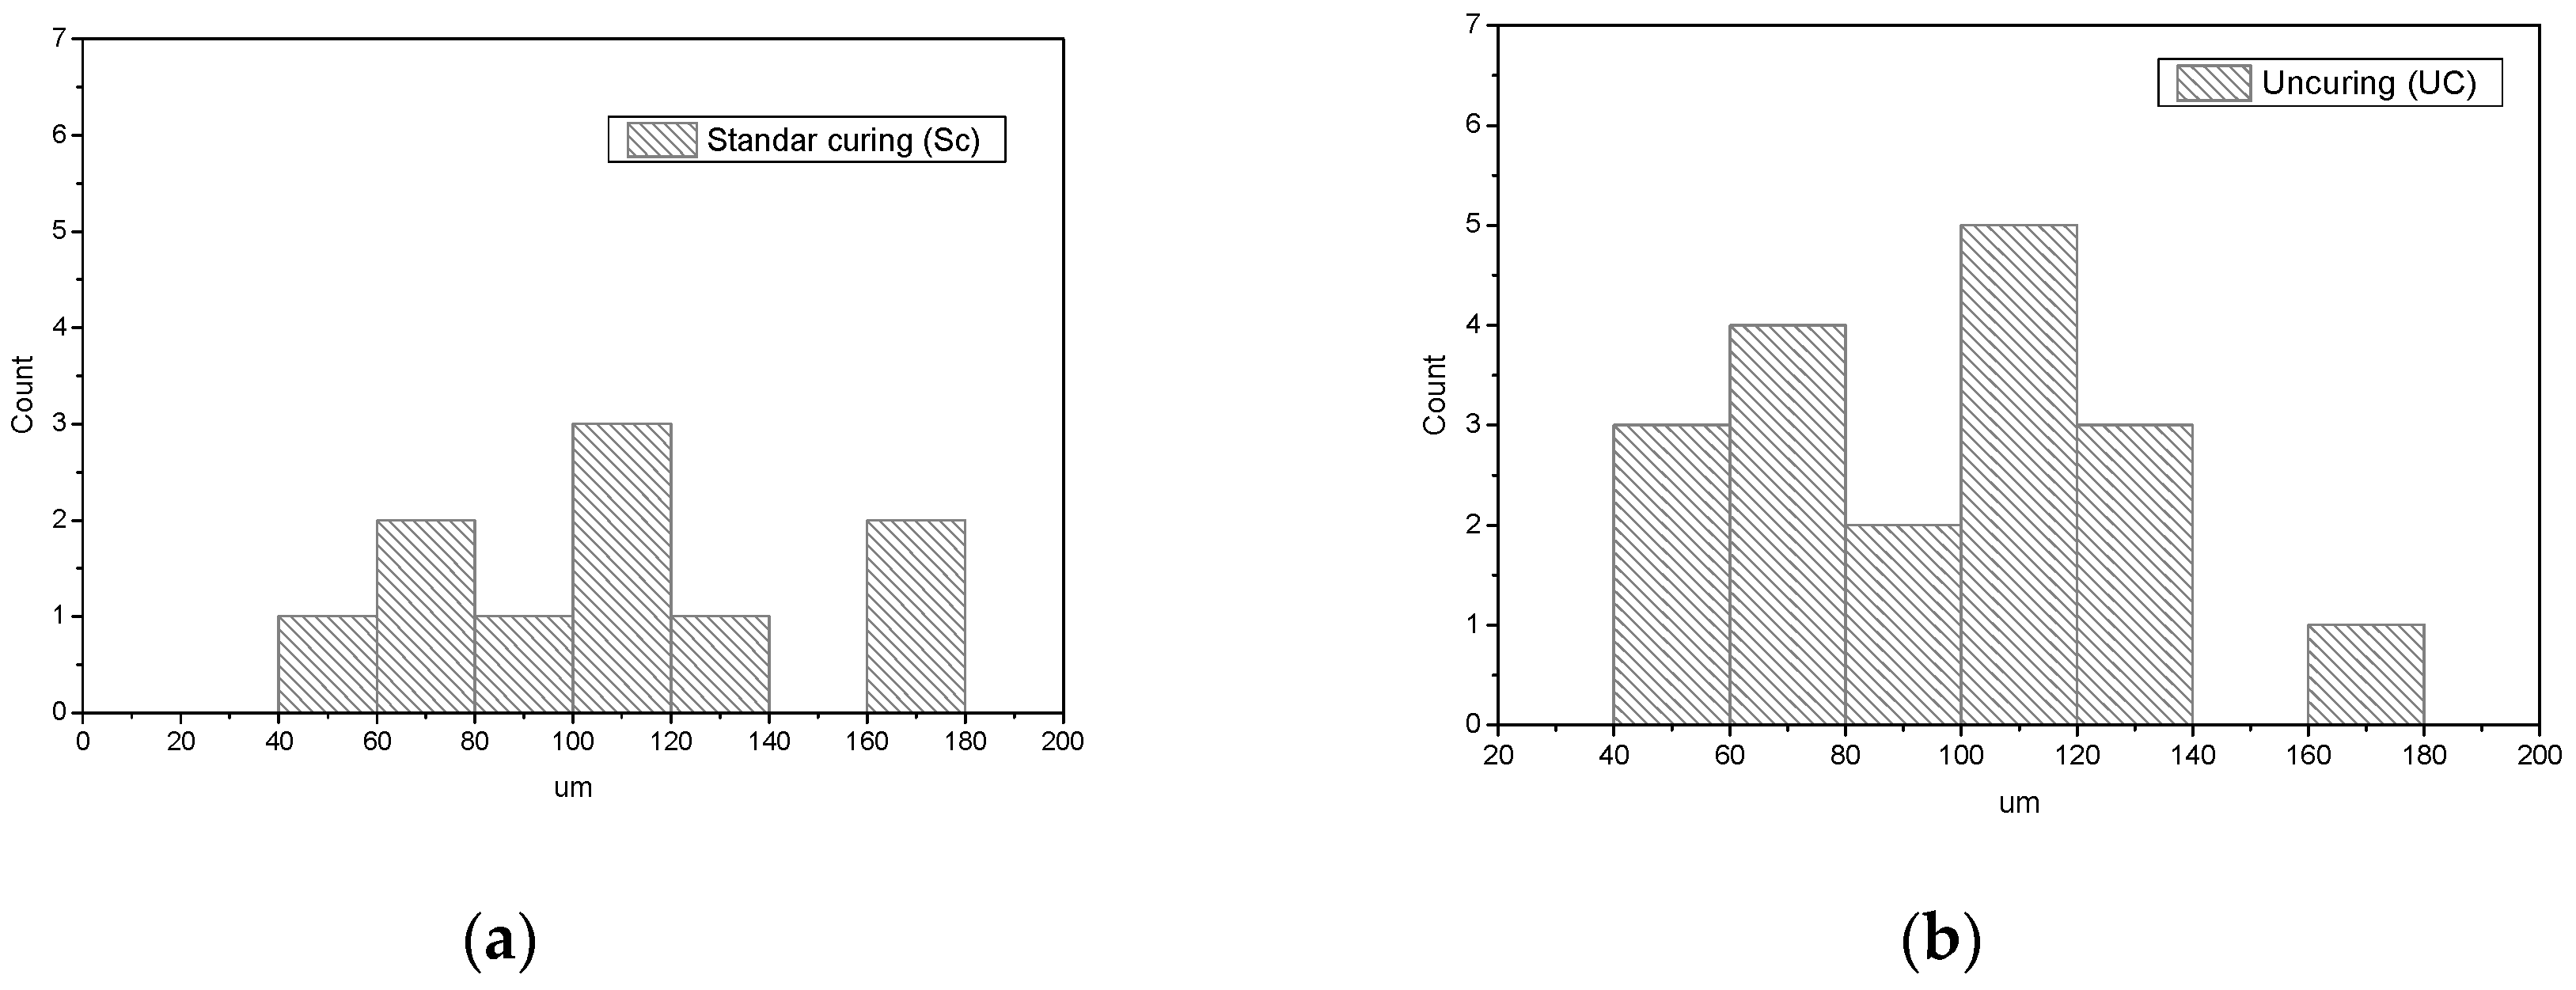
3.4. Porosity Analysis

Porosity is one of the primary factors affecting the strength and useful life of concrete. A higher degree of porosity increases the vulnerability of structures such as columns and beams. Studies have shown a close correlation between porosity, pore size distribution, and compressive strength [38]. Improper curing can generate porous surfaces that are highly susceptible to attack by aggressive agents as chloride, sulfates, etc., making them prone to cracking [9,11,39]. One of the causes of this impact is the environment, as external factors such as temperature influencing the loss of moisture, leading to voids in the concrete structure [40]. Figure 8 shows the porous surface of the samples cured at 28 days under the different techniques. There are notable surface similarities between the Mc and Sc techniques. In the remaining techniques, the Uc technique exhibits low porosity, while the Vc technique presents a porosity level consistent with expectations.
It is observed that the Mc technique significantly reduced its level of porosity compared to its 7-day-old sample, improving its resistance properties. In contrast, the Sc (normalized) technique exhibited more pores after 7 days of curing, which could probably reduce its durability. The Uc technique displayed a notably low presence of notorious pores, which is peculiar because it does not undergo any additional procedure. However, despite this, it demonstrated higher resistance compared to the other techniques. Finally, the Vc technique showed a pore presence almost identical to its previous sample, implying that it retained its initially provided moisture. At 56 days of curing, the Mc technique shows a minimization of the size of the pores in the specimen, implying that the cavities are correctly formed and the voids are less noticeable. A similar case is observed with the Sc technique, and this behavior is consistent across the rest of the techniques, all affected by the same phenomenon. The percentages and effective volumes of porosity calculated for the different samples cured with different techniques were similar, due to the egalitarian processes of mixing and manufacturing the specimens. It was found that the porosity is negatively correlated with the ratio of compressive strength to splitting tensile strength in the concrete [41]. Based on the porosity images, a statistical analysis of void distribution (see Figure 9) was performed for each curing techniques. It can be observed that: (a) the Sc technique does not present a high range of void quantities of the same size, primarily between 100–120 μm, followed by 160–180 μm,(b) the Uc technique presents a higher number of voids, with sizes primarily between 60–80 μm (4) and 100–120 μm (5). Additionally, way a low amount of voids is observed between 120–140 μm (3), indicating that the sample presented sufficient porosity on its surface. (c) the Mc technique presents very interesting results due to the high porosity found in its sample, suggesting a high number of voids identified between 40–60 μm (7), 60–80 μm (4), 80–100 μm (4), 140–160 μm (2), and 180–200 μm (1). This suggests a sample with a very low probability of resistance in a compression test compared to the other techniques. (d) the Vc curing technique yields very positive results relative to the others, showing very low porosity due to the few gaps found. However, it presents the largest vacuum diameter compared to the other techniques, at about 320–340 μm (1). On the other hand, a few pores are identified in the ranges of 40–60 μm (2), 80–100 μm (1), 100–120 μm (1), 140–160 μm (2), 160–180 μm (1), and 200–220 μm (2). There is a variety of sizes on the surface of the specimen, but with the least amount of pores identified, which leads to the conclusion that this technique would perform best in compression tests, as its resistance results were the most positive.

4. Conclusions

The curing technique of wrapping the sample with the product vinipel yielded the most positive results with respect to the other techniques, with compressive strength values of 32.35 Mpa at 28 days and 34.97 Mpa at 56 days. Similarly, samples that stopped curing at 7 days showed greater compressive strength than the vinyl-cured technique, with values of 33 Mpa at 28 days and 36.1 Map at 56 days. It is also concluded that the process of stopping curing at 7 days could be an alternative for obtaining better resistance results.
The analysis of hydration products shows that the vinipel technique presents abundant E and P in the early stages compared to the other techniques, which is of utmost importance because this component comprises most of the formation and internal strengthening of concrete. The Vc and Sc technique both show high concentrations of calcium (Ca), a very influential chemical element for structuring and strengthening resistance in the sample over time.
In the porosity analysis, we found that the Vc technique presented fewer voids and craters on the surface of the sample, which alighs with the theory that lower porosity leads to greater resistance. The technique with the highest porosity was the Mc techinique.
In general, it can be established that the Vc technique is the most suitable for proper curing procedure. Being a sustainable technique, it uses less water resource, which is especially important taking into account the amount of water spent during the construction processes. This technique can be a great alternative to guarantee safety and contribute to environmental conservation.

Author Contributions

H.C.: conceptualization; J.B. and J.D.l.I.: data curation and formal analysis; H.C. and M.M.: funding acquisition; H.C. and J.B.: investigation and methodology; H.C., D.A., F.A.C. and M.M.: project administration, resources; H.C. and J.D.l.I.: supervision; H.C. and J.B.: validation; visualization; J.B.: roles/writing—original draft; H.C.: writing—review & editing. All authors have read and agreed to the published version of the manuscript.

Funding

This research was funded by Universidad de la Costa and Ultracem S.A.S, grant number INV.1106-01-002-16.

Data Availability Statement

The original contributions presented in this study are included in the article. Further inquiries can be directed to the corresponding author.

Conflicts of Interest

The authors declare no conflicts of interest.

References

  1. Russo, A.; Cirella, G.T. Urban sustainability: Integrating ecology in city design and planning. In Sustainable Human–Nature Relations: Environmental Scholarship, Economic Evaluation, Urban Strategies; Springer: Singapore, 2020; pp. 187–204. [Google Scholar]
  2. Rubio, N.V.T.; Sarmiento-Rojas, J.A.; Junco, O.J.G. Efecto del tipo de activador en un mortero de escoria mezclado con caliza activada alcalinamente. Inge Cuc 2019, 15, 1–10. [Google Scholar] [CrossRef]
  3. Cavalieri, F.; Bellotti, D.; Caruso, M.; Nascimbene, R. Comparative evaluation of seismic performance and environmental impact of traditional and dissipation-based retrofitting solutions for precast structures. J. Build. Eng. 2023, 79, 107918. [Google Scholar] [CrossRef]
  4. Du, M.; Liao, L.; Wang, B.; Chen, Z. Evaluating the effectiveness of the water-saving society construction in China: A quasi-natural experiment. J. Environ. Manag. 2021, 277, 111394. [Google Scholar] [CrossRef]
  5. ACI 308R; Guide to Curing Concrete. American Concrete Institute: Farmington Hills, MI, USA, 2001.
  6. Surahyo, A.; Surahyo, L.; Luby. Concrete Construction; Springer: Berlin/Heidelberg, Germany, 2019. [Google Scholar]
  7. Pawar, Y.; Kate, S. Curing of Concrete: A Review. Int. Res. J. Eng. Technol. 2020, 7, 1820–1824. [Google Scholar]
  8. Rojas, M.F.; Cabrera, J. The effect of temperature on the hydration rate and stability of the hydration phases of metakaolin–lime–water systems. Cem. Concr. Res. 2002, 32, 133–138. [Google Scholar] [CrossRef]
  9. Cremonez, C.; da Fonseca, J.M.M.; Cury, A.C.S.; Ferreira, E.O.; Mazer, W. Analysis of the influence of the type of curing on the axial compressive strength of concrete. Mater. Today Proc. 2022, 58, 1211–1214. [Google Scholar] [CrossRef]
  10. Zeyad, A.M. Effect of curing methods in hot weather on the properties of high-strength concretes. J. King Saud Univ. Eng. Sci. 2019, 31, 218–223. [Google Scholar] [CrossRef]
  11. Golfetto, J.M.; Padilha, F.; Schimelfenig, B.; da Silva, C.V. Estudo experimental da influência da adição de microfibras de polipropileno e da cura na dureza superficial de pisos de concreto. Matéria 2019, 24, e12432. [Google Scholar] [CrossRef]
  12. Pérez, I.S.; Velayos, J.J.A.; Hernández, M.G.; Macphee, D.E.; Moragues, A.; Martin, T.S. Microstructural characterization of aged mortar by destructive and non-destructive testing. In Proceedings of the 12th International Congress on the Chemistry of Cement, Montreal, QC, Canada, 8–13 July 2008. [Google Scholar]
  13. Murillo, M.; Abudinen, D.; del Río, M.; Serrato, N.; Patrón, L.; Ramírez, J. Comparative analysis of the compressive strength of concrete under different curing methods. IOP Conf. Ser. Mater. Sci. Eng. 2021, 1126, 12002. [Google Scholar] [CrossRef]
  14. Wang, J.; Long, G.; Xiang, Y.; Dong, R.; Tang, Z.; Xiao, Q.; Yang, Z.; Ma, K. Influence of rapid curing methods on concrete microstructure and properties: A review. Case Stud. Constr. Mater. 2022, 17, e01600. [Google Scholar] [CrossRef]
  15. Hover, K.C. The influence of water on the performance of concrete. Constr. Build. Mater. 2011, 25, 3003–3013. [Google Scholar] [CrossRef]
  16. Mohe, N.S.; Shewalul, Y.W.; Agon, E.C. Experimental investigation on mechanical properties of concrete using different sources of water for mixing and curing concrete. Case Stud. Constr. Mater. 2022, 16, e00959. [Google Scholar] [CrossRef]
  17. Ekasila, S.; Vishali, B.; Anisuddin, S. An experimental investigation on compressive strength of concrete with rice husk and cow dunk ash using various curing methods. Mater. Today Proc. 2022, 52, 1182–1188. [Google Scholar] [CrossRef]
  18. Alvarado, J. Variación de la Resistencia a Compresión del Concreto 210, 245, 280 kg/cm2 Frente a Diferentes Métodos de Curado. Bachelor’s Thesis, Universidad Cesar Vallejo, Lima, Peru, 2020; p. 47. [Google Scholar]
  19. Delgado, A.L.F.; Silva, L.A.P. Resistencia a la Compresión de Concreto de 21MPA, Utilizando Cobertura Tipo Fibra de Costal y Cobertura Tela Polar FLEECE en el Curado del Concreto. Bachelor’s Thesis, Universidad Santo Tomas, Bogota, Colombia, 2015. [Google Scholar]
  20. Osei, D.Y.; Mustapha, Z.; Zebilila, M.D.H. Compressive strength of concrete using different curing methods. J. Soc. Dev. Sci. 2019, 10, 30–38. [Google Scholar]
  21. Ramana, P.V.; Surendranath, A. Assessment of endurance and microstructural properties effect on polypropylene concrete. Mater. Today Proc. 2022, 52, 2184–2191. [Google Scholar] [CrossRef]
  22. Jain, A.; Chaudhary, S.; Gupta, R. Mechanical and microstructural characterization of fly ash blended self-compacting concrete containing granite waste. Constr. Build. Mater. 2022, 314, 125480. [Google Scholar] [CrossRef]
  23. Nahata, Y.; Kholia, N.; Tank, T.G. Effect of Curing Methods on Efficiency of Curing of Cement Mortar. APCBEE Procedia 2014, 9, 222–229. [Google Scholar] [CrossRef]
  24. Gowsika, D.; Balamurugan, P.; Kamalambigai, R. Experimental study on curing methods of concrete. Int. J. Eng. Dev. Res. 2017, 5, 257–260. [Google Scholar]
  25. James, T.; Malachi, A.; Gadzama, E.W.; Anametemok, A. Effect of curing methods on the compressive strength of concrete. Niger. J. Technol. 2011, 30, 14–20. [Google Scholar]
  26. Hamada, H.; Alattar, A.; Tayeh, B.; Yahaya, F.; Almeshal, I. Influence of different curing methods on the compressive strength of ultra-high-performance concrete: A comprehensive review. Case Stud. Constr. Mater. 2022, 17, e01390. [Google Scholar] [CrossRef]
  27. ASTM C778-17; Standard Specification for Standard Sand. ASTM International: West Conshohocken, PA, USA, 2017. [CrossRef]
  28. Murillo, M.; Abudinen, D.; Torres, D.; Vásquez, M.; Cano, H.; Canales, F.; De la Iglesia, J.; Barraza, B. Experimental and comparative study of the compressive strength of hydraulic concrete samples subjected to various curing techniques. J. Posit. Sch. Psychol. 2022, 6, 8258–8271. [Google Scholar]
  29. ASTM C39/C39M-21; ASTM International Committee C09 on Concrete and Concrete Aggregates. Standard Test Method for Compressive Strength of Cylindrical Concrete Specimens. ASTM International: West Conshohocken, PA, USA, 2014.
  30. Goel, A.; Narwal, J.; Verma, V.; Sharma, D.; Singh, B. A Comparative Study on the Effect of Curing on the Strength of Concrete. Int. J. Eng. Adv. Technol. 2013, 2, 401–406. [Google Scholar]
  31. Kosmatka, S.H.; Wilson, M.L. Design and Control of Concrete Mixtures: The Guide to Applications, Methods, and Materials, 15th ed.; Portland Cement Association: Skokie, IL, USA, 2011. [Google Scholar]
  32. DeBruijn, G.; Whitton, S.M. Fluids. In Applied Well Cementing Engineering; Elsevier: Amsterdam, The Netherlands, 2021; pp. 163–251. [Google Scholar]
  33. Giraldo, M.A.; Tobón, J.I. Evolución mineralógica del cemento portland durante el proceso de hidratación. Dyna 2006, 73, 69–81. [Google Scholar]
  34. Davila, F.J.; John, V.M. Formación de etringita tardía en elementos de construcción. Rev. Colomb. Mater. 2014, 5, 231–237. [Google Scholar] [CrossRef]
  35. Jakobsen, U.H.; De Weerdt, K.; Geiker, M.R. Elemental zonation in marine concrete. Cem. Concr. Res. 2016, 85, 12–27. [Google Scholar] [CrossRef]
  36. Abhilash, P.P.; Nayak, D.K.; Sangoju, B.; Kumar, R.; Kumar, V. Effect of nano-silica in concrete; a review. Constr. Build. Mater. 2021, 278, 122347. [Google Scholar] [CrossRef]
  37. Durand Ciudad, A.J. Influencia del Óxido de Calcio en la Trabajabilidad, Fraguado, Compresión, Densidad, Porosidad y Absorción del Concreto para Elementos Estructurales, Trujillo 2017. Bachelor’s Thesis, Universidad Privada del Norte, Trujillo, Peru, 2017. [Google Scholar]
  38. Xu, D.; Tang, J.; Hu, X.; Yu, C.; Han, F.; Sun, S.; Deng, W.; Liu, J. The influence of curing regimes on hydration, microstructure and compressive strength of ultra-high performance concrete: A review. J. Build. Eng. 2023, 76, 107401. [Google Scholar] [CrossRef]
  39. Nery, G. O que é Monitoração na Construção Civil? Boletín Técnico no 5; Asociación Latinoamericana de Control de Calidad, Patología e Recuperación de la Construcción—ALCONPAT Int: São Paulo, Brasil, 2013. [Google Scholar]
  40. Solis-Carcaño, R.; Moreno, E.I. Análisis de la porosidad del concreto con agregado calizo. Rev. la Fac. Ing. la UCV 2006, 21, 57–68. [Google Scholar]
  41. Chen, J.; Li, Y.; Wen, L.; Guo, H.; Li, K. Effect of different curing processes on hydraulic concrete performance. ACI Mater. J. 2022, 119, 27–37. [Google Scholar]
Figure 1. Curing process using different types of techniques. (a) Vinipel (Vc), (b) Uncured (Uc), (c) Manual Curing (Mc), and (d) Standard Curing (Sc).
Civileng 06 00009 g001aCivileng 06 00009 g001b
Figure 2. Compressive strength obtained for the different techniques used at the ages of 7, 28, and 56 days.
Civileng 06 00009 g002
Figure 3. Graph of maximum compressive strength uncured excluded samples.
Civileng 06 00009 g003
Figure 4. Cement products hydrate during 28 days of curing. (a) Vc, (b) Sc, (c) Mc, and (d) Uc.
Civileng 06 00009 g004
Figure 5. Hydrated cement products stop curing for 28 days. (a) Vc, (b) Sc, (c) Mc, and (d) Uc.
Civileng 06 00009 g005aCivileng 06 00009 g005b
Figure 6. SEM image and elemental mapping (chemical composition analysis). Mc techniques at 28 days of curing.
Civileng 06 00009 g006
Figure 7. Graphs of the compositional spectra under the different techniques used at 28 days of curing, (a) Mc, (b) Sc, and (c) Vc.
Civileng 06 00009 g007
Figure 8. ×50 SEM images of each of the techniques during 28 days of curing. (a) Mc, (b) Sc, (c) Uc, and (d) Vc.
Civileng 06 00009 g008
Figure 9. Pore distribution histograms measured by SEM for each type of curing technique at 56 days of curing. (a) Ss, (b) Uc, (c) Mc, and (d) Vc.
Civileng 06 00009 g009aCivileng 06 00009 g009b
Table 1. Mix design for preparation of cylinders.
MaterialsDry Mass/m3 [kg]Density
[kg/L])
Volume
[L/m3])
Dry
Mass [kg]
HumidityAbsorptionCorrected WaterCorrected Mass [kg]
Cement2993.1009628.1 28.1
Water165116515.5 9.84
Coarse aggregate9512.5337589.51.60%1.4%−0.1890.89
Fine aggregate9142.54361867.40%1%−239.1492.31
Air1% 10 0
Eucon wr 851.431.171.230.13 0.135
Plastol 7200 1.791.0820.17 0.17
A/C design 0.552
Table 2. Different curing procedures and distribution of ages and number samples.
TechniqueCharacteristicAges of Curing (Days)Number of
Samples by Age
Manual Curing (Mc)The human factor influences when performing the curing procedure during the established days.715
2815
5615
Uncured
(Uc)
No curing procedure is applied to him, exposing him to interperie715
2815
5615
Vinipel
(Vc)
A wrap is applied to it after spraying water on the entire sample.715
2815
5615
Standard curing (Sc)This standardized procedure is performed by governing the standards established in the ASTM715
2815
5615
Disclaimer/Publisher’s Note: The statements, opinions and data contained in all publications are solely those of the individual author(s) and contributor(s) and not of MDPI and/or the editor(s). MDPI and/or the editor(s) disclaim responsibility for any injury to people or property resulting from any ideas, methods, instructions or products referred to in the content.

