Article

Fatigue Assessment of Rib–Deck Welded Joints in Orthotropic Steel Bridge Decks Under Traffic Loading

by
Bruno Villoria
1,2,*,
Sudath C. Siriwardane
2 and
Jasna Bogunovic Jakobsen
2
1
Norwegian Public Roads Administration, 4010 Stavanger, Norway
2
Department of Mechanical and Structural Engineering and Materials Science, University of Stavanger, 4021 Stavanger, Norway
*
Author to whom correspondence should be addressed.
CivilEng 2025, 6(1), 7; https://doi.org/10.3390/civileng6010007
Submission received: 18 November 2024 / Revised: 14 January 2025 / Accepted: 29 January 2025 / Published: 2 February 2025
(This article belongs to the Section Construction and Material Engineering)

Abstract

:
Rib–deck (RD) welded joints in orthotropic steel bridge decks are prone to different fatigue crack mechanisms. Standard fatigue design methods are inadequate for some of these mechanisms under multiaxial non-proportional loading conditions. This study presents a framework to assess fatigue damage at RD welded joints, considering the different crack mechanisms based on the equivalent structural stress method and its extension to multiaxial non-proportional fatigue, which is the path-dependent maximum stress range (PDMR) cycle counting algorithm. The method is validated for uniaxial loading by using experimental data from the literature. Additionally, non-proportional fatigue damage at RD welded joints of a suspension bridge girder is investigated under simulated random traffic loading. The analyses reveal the limitations of the nominal stress approach to account for complex stress field variations. The PDMR method, more suited to capture the stress path dependency of non-proportional fatigue damage than the hot spot and critical plane-based methods, predicts higher fatigue damage. A comprehensive fatigue test campaign of full-scale RD welded joints is necessary to better understand their fatigue behaviour under multiaxial loading. Until more experimental data are available, the PDMR method is recommended for fatigue verifications of welded RD joints as it yields safer predictions.

1. Introduction

Orthotropic steel bridge decks (OSBDs) have become standard components of long-span bridges. They typically feature a deck plate reinforced longitudinally by trapezoidal stiffeners, also referred to as ribs, and transversally by diaphragms or crossbeams. The constitutive elements are welded together, leading to multiple potential fatigue crack initiation sites. Fatigue cracks have been reported [1,2,3,4] in existing OSBDs, in some instances only after a few years of service. The rib–deck (RD) welded joints are particularly susceptible to fatigue cracking, which can result in asphalt damage, jeopardizing traffic safety.
In recent experimental works [5,6,7,8,9], four types of crack as illustrated in Figure 1 have been identified. Fatigue cracks can initiate from the weld toe (Type I) or the weld root (Type II) and propagate into the deck. Cracks were also reported to start at the weld toe from the rib and propagate into the rib (Type III). Cracks can also initiate from the weld root and propagate into the weld (Type IV).
The guidelines provided by AASHTO [10] and Eurocode [11,12] for fatigue design are mainly based on the nominal stress approach. As discussed by Radaj [13], one of the main shortcomings of the nominal stress approach is its inability to account for the interaction between different stress components in the presence of multiaxial loading conditions. The hot spot stress approach, formally adopted by Eurocode [11], is more suitable for studying details with high-stress gradients. However, it is only applicable to Types I and III crack mechanisms. Hobbacher [14] provides guidelines regarding the stress extrapolation procedure and the treatment of details undergoing proportional multiaxial stress states. The effective notch stress, described by Fricke [15] is also evaluated. However, its applicability to predict fatigue damage under non-proportional multiaxial stress states has not yet been established.
Dong’s concept of equivalent structural stress [16] is the first novel approach to be incorporated into a design standard, namely the ASME Div Code [17]. Further validation of this approach is required for all four types of cracks in OSBDs, and the significance of the associated methodology should be discussed with complex case studies. Fermer [18] developed a similar method, known as the Volvo method, adopted in BS 7608 [19]. The performance of the Volvo method to assess the fatigue life of RD welded joints is also evaluated in the present study.
The present paper provides a framework to assess the fatigue life of RD welded joints considering the four identified potential crack mechanisms based on the equivalent structural stress method and its extension to multiaxial non-proportional fatigue, which is the path-dependent maximum stress range counting algorithm. A general nodal-based framework hinged on the equivalent structural stress (ESS) concept is presented in Section 2. The relevance of the method is verified by comparing the experimental fatigue lives with the predicted fatigue lives of RD specimens under uniaxial loading in Section 3. The RD welded joints of bridges undergo, under service loading, complex multiaxial stress states distinct from the conditions seen in the scaled experiments discussed in Section 3. This prompts the need to identify and select adequate multiaxial fatigue assessment methods for RD welded joints as discussed in Section 4. In Section 5, a long-span suspension bridge is used as a case study to illustrate that RD welded joints experience alternately proportional and non-proportional biaxial stress states. Fatigue damage of the critical RD welded joints of the bridge, accumulated over the entire design life, is calculated using selected multiaxial fatigue models and compared. The accuracy, applicability, and significance of the selected methods are finally discussed.

2. Equivalent Structural Stress Method in a Nodal Force-Based Framework

2.1. Background

The equivalent structural stress proposed by Dong [16] and now adopted by the ASME Div Code relies on the following principles: (i) the real through-thickness stress distribution along a hypothetical crack plane can be represented by the superposition of a membrane stress σ m , bending stress σ b , and a nonlinear component σ n l ; (ii) the sum of unique membrane and bending components shall satisfy equilibrium conditions; and (iii) the local notch stress nonlinearity is accounted for by enforcing conditions of equilibrium as the nonlinear component σ n l is self-equilibrated. The enforcement of force equilibrium conditions effectively reduces the mesh-dependency of the technique. This approach stems from fracture mechanics considerations proving that crack propagation can be modelled by the superposition of three modes of cracking with growth rates governed by stress intensity factors. Dong [16] demonstrated that these factors can be expressed in terms of membrane and bending stress ranges. The equivalent structural stress approach can be used to predict the fatigue life of welded details from a single material-dependent Master S-N curve described in [17].

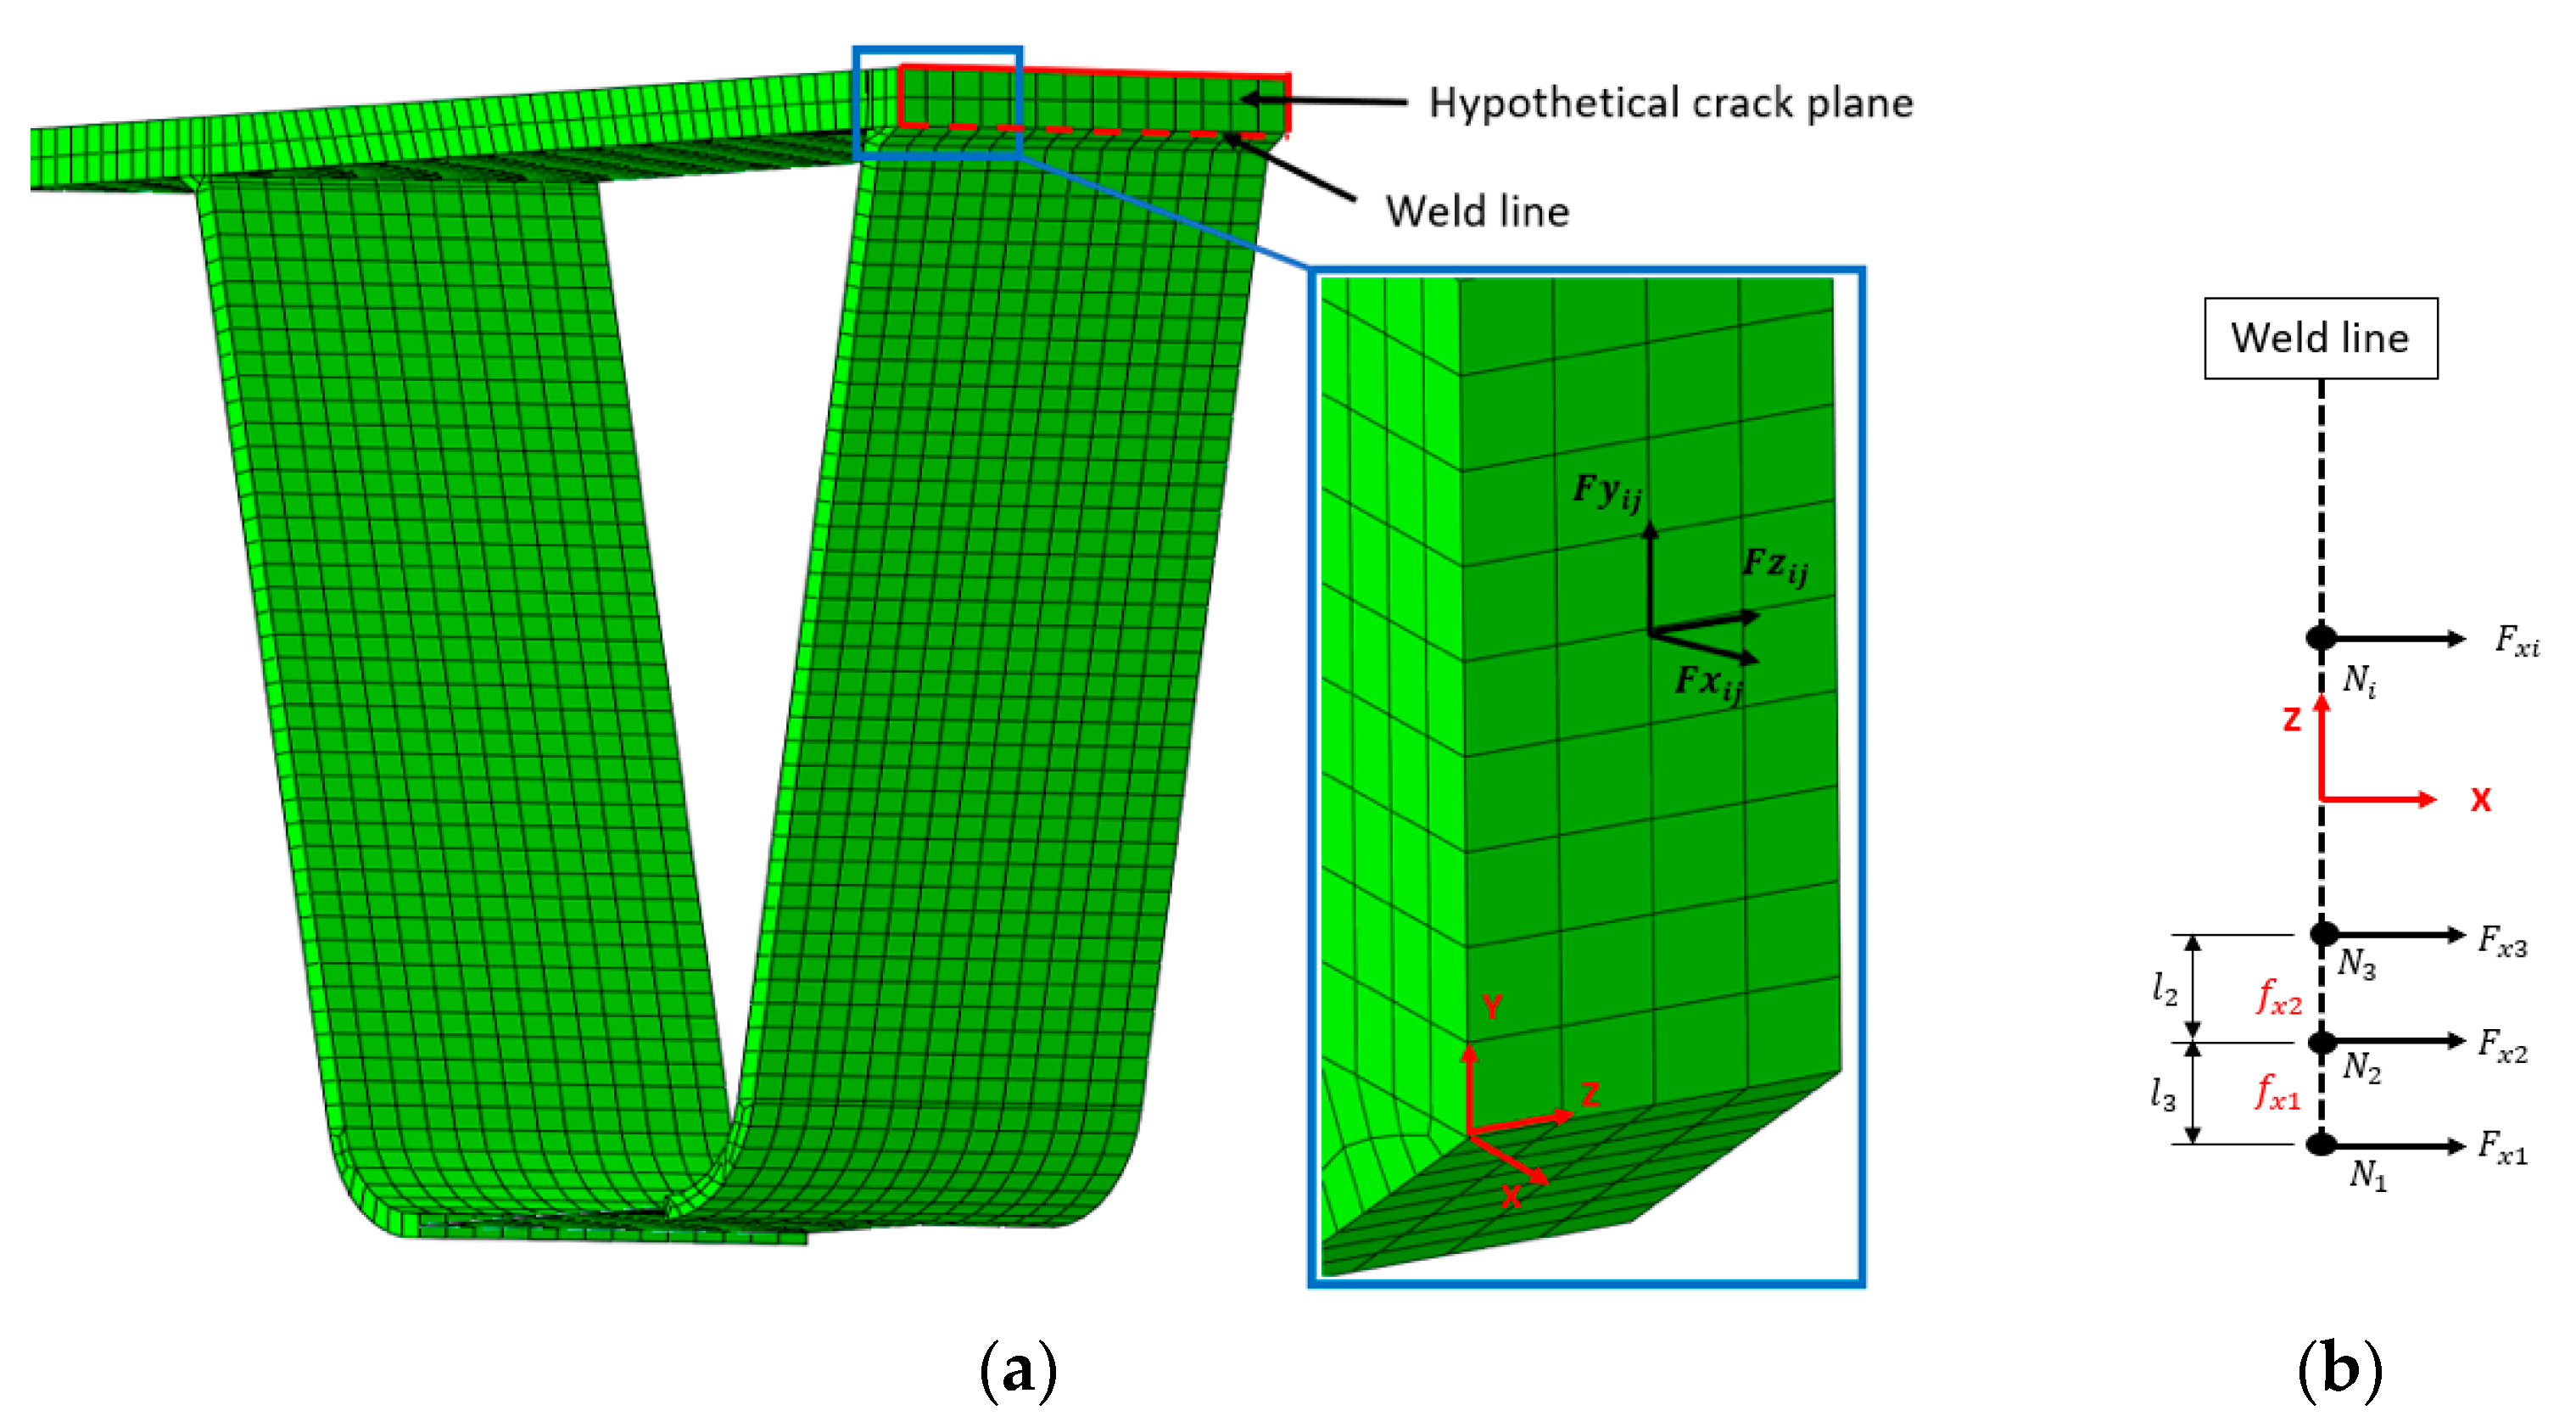
2.2. Nodal Force-Based Framework

Dong [20] presented a procedure to evaluate the structural stress components based on the extraction of nodal forces along a free body cut at the expected crack plane location. In a displacement-based finite element formulation, the self-equilibrium conditions are automatically satisfied. The efficiency of the approach has been demonstrated by Dong [21,22]. The extraction of nodal forces for Type I cracks is illustrated in Figure 2. The methodology described below can be extrapolated to all four crack mechanisms.
The nodes contained in the hypothetical crack plane define a grid. At each position i and j in the Z- and Y-directions, nodal force components ( F x i j , F y i j , and F z i j ) can be extracted from the general-purpose finite element software Abaqus 2020. The equivalent nodal force at each node along the Z-direction is obtained by summation of the nodal forces along the Y-direction as shown in Equation (1).
F x i F y i F z i = j F x i j j F y i j j F z i j ,
The equivalent line forces ( f x i , f y i , and f z i ) in the X-, Y-, and Z-directions, partially shown in Figure 2b, are obtained after conversion of the equivalent nodal forces from Equation (1). The statically equivalent line forces are obtained after the inversion of the transfer matrix T given in Equation (2).
F x 1 F x 2 F x 3 F x n = l 1 3 l 1 6 0 0 0 l 1 6 l 1 + l 2 3 l 2 6 0 0 0 l 2 6 l 2 + l 3 3 l 3 6 0 l n 2 + l n 1 3 l n 1 6 0 l n 6 l n 1 3 · f x 1 f x 2 f x 3 f x n   = T   · f x 1 f x 2 f x 3 f x n ,
The Equation above can be used to convert nodal forces into equivalent line forces in the X-direction. Similar relations can be obtained in the Y- and Z-directions by transposing indices. In a similar manner, nodal moments ( M x i , M y i , and M z i ) can be converted to equivalent line moments ( m x i , m y i , and m z i ).

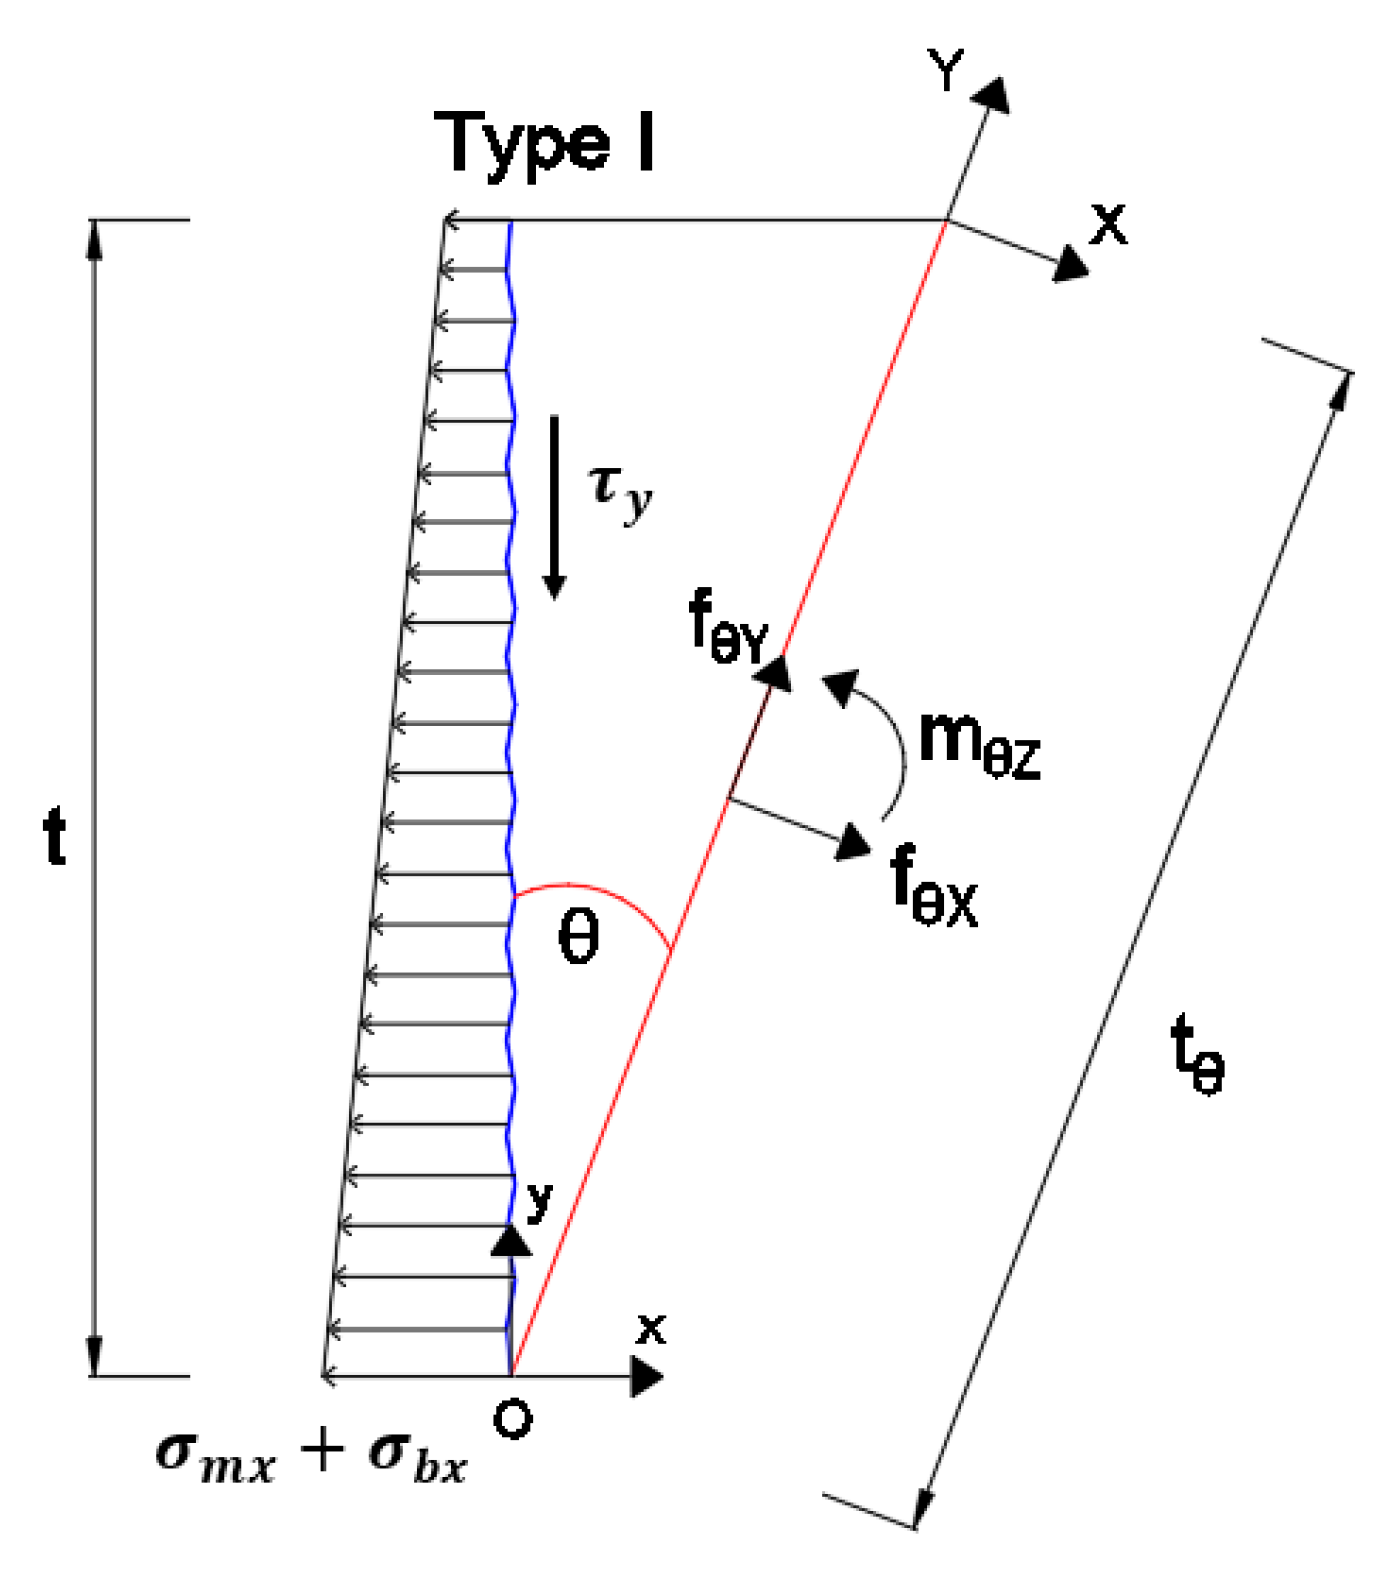
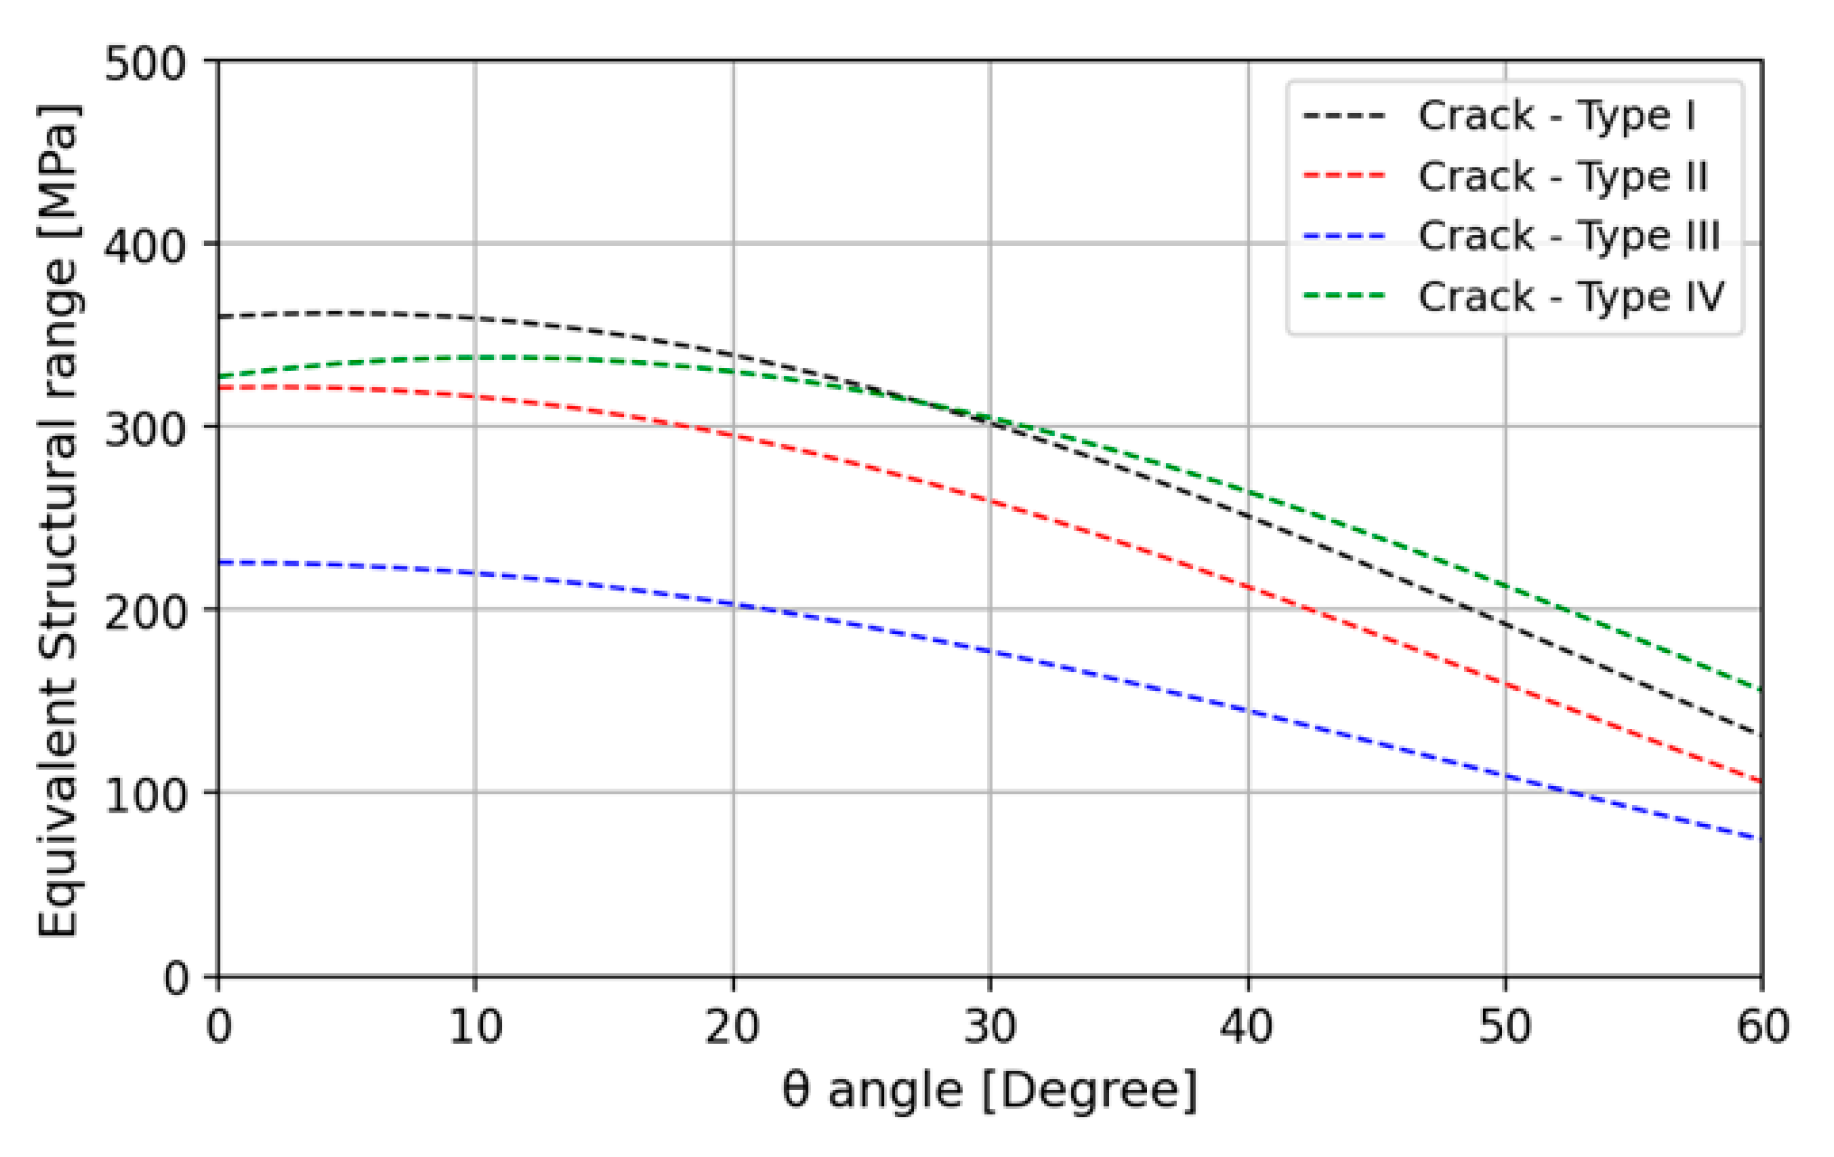
2.3. Crack Plane Orientation

While studying the strength of fillet welds, Nie [23] observed significant deviations in crack plane orientation. The crack plane might deviate from its theoretical orientation represented in blue in Figure 1. Without losing generality, an element containing the reference crack plane of Type I and an alternative plane inclined at an angle θ is represented in Figure 3.
The structural stress components σ m x , σ b x , and τ y refer to the membrane, bending, and shear stresses along the theoretical crack plane while f θ x , f θ y , and m θ z denote the equivalent line forces in the X- and Y-directions on the inclined plane and the line moment about point O. The line forces can be obtained from the equilibrium conditions of forces and moments with respect to the considered inclined plane coordinate system, as expressed in Equations (3)–(5).
f θ X . cos θ + f θ Y . sin θ σ m x . t = 0 ,
- f θ X . sin θ + f θ Y . cos θ τ y . t = 0 ,
σ m x . t 2 2 σ b x . t 2 6 f θ X . t a 2 + m θ Z = 0 ,
The three structural stress components on the inclined plane are given in Equations (6)–(8):
σ s x , i ( θ ) = σ m x , i ( θ ) + σ b x , i ( θ ) = f θ x , i t θ + 6 m θ x , i t θ 2 ,
τ s y , i ( θ ) = f θ y , i t θ ,
σ s z , i ( θ ) = σ m z , i ( θ ) + σ b z , i ( θ ) = f θ z , i t θ + 6 m θ z , i t θ 2 ,
where t θ refers to the through-thickness of the considered potential crack expressed as a function of its orientation.

2.4. Equivalent Stress Range

The equivalent structural stress range S E S S is finally derived by scaling the governing traction structural stress ranges from Equation (9) given in [17]:
S E S S = 1 F ( δ ) σ S t e s s 2 m m . I r 1 m . f R 2 + 3 τ S t e s s 2 m m . I r 1 m 2 ,
where t e s s is equal to the plate thickness in mm, or 16 if the plate thickness is below 16 mm; the bending stress ratio r is given in Equation (10).
r = σ b σ b + σ s
I(r) is a dimensionless function of r and is explicitly defined as follows:
I ( r ) = 1.23 0.364 r 0.17 r 2 1.007 0.306 r 0.178 r 2
The parameter f R is a function of the ratio between the maximum and minimum traction stresses. If the mean stress does not exceed half the yield strength, which is the case for all the applications considered in this study, then f R can be taken as equal to 1. The parameter F ( δ ) was introduced to account for the effect of multiaxiality where δ is the phase difference between the stress components σ s and τ s . If σ s and τ s are in phase, then F ( δ ) can be taken as equal to 1. In the presence of non-proportional random multiaxial loading, the value of δ will vary at each step, and Equation (9) can no longer be used.
Finally, the equivalent structural stress range can then be related to the number N of expected cycles to fatigue failure by means of Equation (12):
S E S S = C m e a n 2 s t d . N h ,
where the parameters C and h are material-dependent and can be read from Table 1.

3. Validation of Equivalent Structural Stress Method for RD Welded Joints

The ESS method is employed to predict the fatigue lives of RD welded joints tested at the Federal Highway Administration (FHWA) and the Centre de Recherches scientifiques et techniques de l’Industrie des Fabrications metalliques (CRIF) facilities. The results are then compared with experimental fatigue lives to evaluate the accuracy of the methods. Additionally, the fatigue lives predicted by these methods are compared with those predicted by standard methods (i.e., nominal stress, hot spot stress, and effective notch stress methods).

3.1. Experimental Data

Orcel [24] published the compiled results of fatigue tests conducted on 159 RD specimens under bending cyclic loading of constant amplitude at the FHWA facilities. Janss [25] performed fatigue tests on 36 RD joints with intentionally poor weld quality at the CRIF facilities, with the aim to explore the consequences of insufficient weld penetration on fatigue life. A detailed description of the test setup and geometry of the specimens is available in the original publications by Orcel and Janss.

3.2. Analysis of Fatigue Tests

3.2.1. Fatigue Life Calculated by Standard Methods

The nominal stress is defined in [11] as the bending stress in the rib and is calculated as half the stress difference between the rib edges. The detail category FAT 71 was used for the fatigue life assessment. The hot spot stress at the weld toe along the rib and the deck plate was estimated using the guidelines provided by Hobbacher [14] to minimize the mesh sensitivity of the stress extrapolation procedure. The fatigue class FAT 100 was selected. The effective notch stress was estimated in compliance with the recommendations from Fricke [15] where fictitious notches of 1 mm radius were introduced at the weld root and the weld toes on the rib and deck plates. The effective notch stress is defined as the maximum principal stress in the notch, in which case the detail category FAT 225 can be used.
Figure 4a–c show the experimentally obtained and calculated numbers of cycles to failure for both the FHWA and CRIF fatigue test specimens from the nominal stress, hot spot stress, and effective notch stress methods. All safety coefficients and load factors were set to unity in order to facilitate the comparison between the different methods. The fatigue tests conducted by FHWA follow a setup similar to the tests analyzed by Kolstein [5], for which the nominal stress approach provided satisfactory fatigue life predictions.

3.2.2. Fatigue Life Estimation by the ESS Method

The ESS approach is applied to the FHWA and CRIF series, necessitating computationally demanding three-dimensional solid elements. The submodelling capabilities of Abaqus were explored. An initial model shown in Figure 5a consisted of both solid and shell elements. The shell elements are connected to the adjacent solid elements by means of the shell-to-solid coupling tool. A submodel, as illustrated in Figure 5b, with a more refined mesh, is used to extract the nodal forces along the four highlighted potential crack planes. Solid elements of type C3D8 are used.
One of the important features of the ESS approach is its mesh-insensitivity. Different mesh sizes have been considered in the case of the first specimen of the SA4 series described in Section 3. It can be seen in Figure 6, that the structural stress range is indeed mesh-insensitive as stated by Dong.
The equivalent structural stress range is calculated for the four potential crack planes forming an angle up to 60 degrees with the reference crack plane for all four crack mechanisms, based on Equations (6)–(8). The equivalent structural stress range is shown in Figure 7 for the different crack types for one selected specimen along different crack plane orientations. The ESS ranges are typically maximum along the reference crack plane orientation, as shown in Figure 1. The maximum ESS range was then retained for fatigue life evaluation.
The ESS ranges were calculated at all locations along the weld line as illustrated in Figure 2 for all potential crack mechanisms. The results for both series are shown in Figure 8a with the mean, mean ± 95%, and mean ± 99% confidence intervals of the Master S-N curve. The anticipated number of cycles based on the ESS approach was calculated using Equation (12) and the results are displayed in Figure 8b. The numbers of cycles to failure for both series, calculated using the Master (mean—2 standard deviation) S-N curve, are all on the conservative side, confirming the validity of the ESS approach as a viable fatigue design approach. The low welding penetration rates of the CRIF series result in higher ESS ranges compared with the FHWA series, leading to a conservative estimation of the expected number of cycles to failure.

3.2.3. Fatigue Life Estimation by the Volvo Method

The method developed by Fermer [18] at the request of Volvo was the first method to incorporate a nodal force-based framework for the determination of the membrane and bending stress components. Like the ESS method described in Section 2, the Volvo method derives the linearized stress components from line forces and moments as expressed in Equation (6). However, it differs from the ESS method on the following points:
  • Only the stress component σ s x perpendicular to the weld line is considered in the fatigue life analysis of welded joints.
  • The Volvo method introduces two reference S-N curves provided in Equation (13). The selection of the S-N curves is based on the value taken by the bending stress ratio r given in Equation (10). If 0.5 r 1 , the structural stress is considered to be governed by bending moments, while if 0 < r 0.5 , normal forces are assumed to dominate.
    σ s x = 1627 . N 1 / 7.0   i f   0.5 r 1 σ s x = 3047 . N 1 / 4.4   i f   0 r < 0.5
  • A mean stress correction factor [18] is incorporated. The S-N curves expressed in Equation (13) were derived from fatigue tests conducted at a constant stress ratio ( R = 1 ), where R = σ m a x / σ m i n . The equivalent stress, σ s x , e q , after mean stress correction is given in Equation (14), where σ m refers to the mean stress associated with the considered loading cycle.
    σ s x , e q R = 1 = σ s x + M 1   . σ m   if   R < 0 σ s x , e q R = 1 = 1 + M 1 σ s x + M 2 . σ m 1 + M 2     if   R > 0
            Fermer recommends using 0.25 for M 1   and 0.097 for M 2 .
  • BS 7608 [19] introduces a reduction coefficient for the fatigue strength of welded joints between plates whose thickness exceeds a reference thickness t B taken as 16 mm. The corrected strength S can then be calculated from the reference fatigue strength S B by Equation (15). But Gurney [26] proved experimentally that the correction factor could be applied to lower plate thicknesses down to 2 mm.
    S = S B t B t 0.25
The Volvo method is applied to the FHWA and CRIF test series. In Figure 9, the structural stress ranges are plotted together with the two reference S-N curves. The results presented correspond to the most damaging cracking mechanism.
Most of the FHWA series results are scattered around the bending moment-dominated S-N curve. However, the CRIF series results are located well above the reference S-N curves. The number of cycles to failure calculated by the Volvo method, without correction factors, is shown in Figure 10a. The predicted fatigue lives for the FHWA series are found to be on the conservative side but within a scatter band defined by a factor of 4 with respect to the perfect prediction line. The calculated numbers of cycles to failure for the CRIF series test results are excessively conservative, with all test results well below the scatter band. The governing cracking mechanism for the CRIF series is Type IV for all specimens. As the joints are welded with a low penetration rate, the welds are subjected to high stress levels. In addition, the specimens of the CRIF series are tested under negative stress ratios, resulting in the presence of compressive mean stresses. The effect of the mean stress and thickness corrections discussed above was investigated individually as shown in Figure 10b,c. Their combined effect can be seen in Figure 10d, resulting in a clear improvement in fatigue life predictions, particularly for the CRIF series.

3.3. Comparison and Discussion

The fatigue lives predicted by the nominal stress, the hot spot stress, and the effective notch stress (ENS) methods for the FHWA and CRIF series are summarized in Figure 4. The number of cycles to failure calculated with the ESS and the Volvo methods can be found, respectively, in Figure 8 and Figure 10. The following observations can be made:
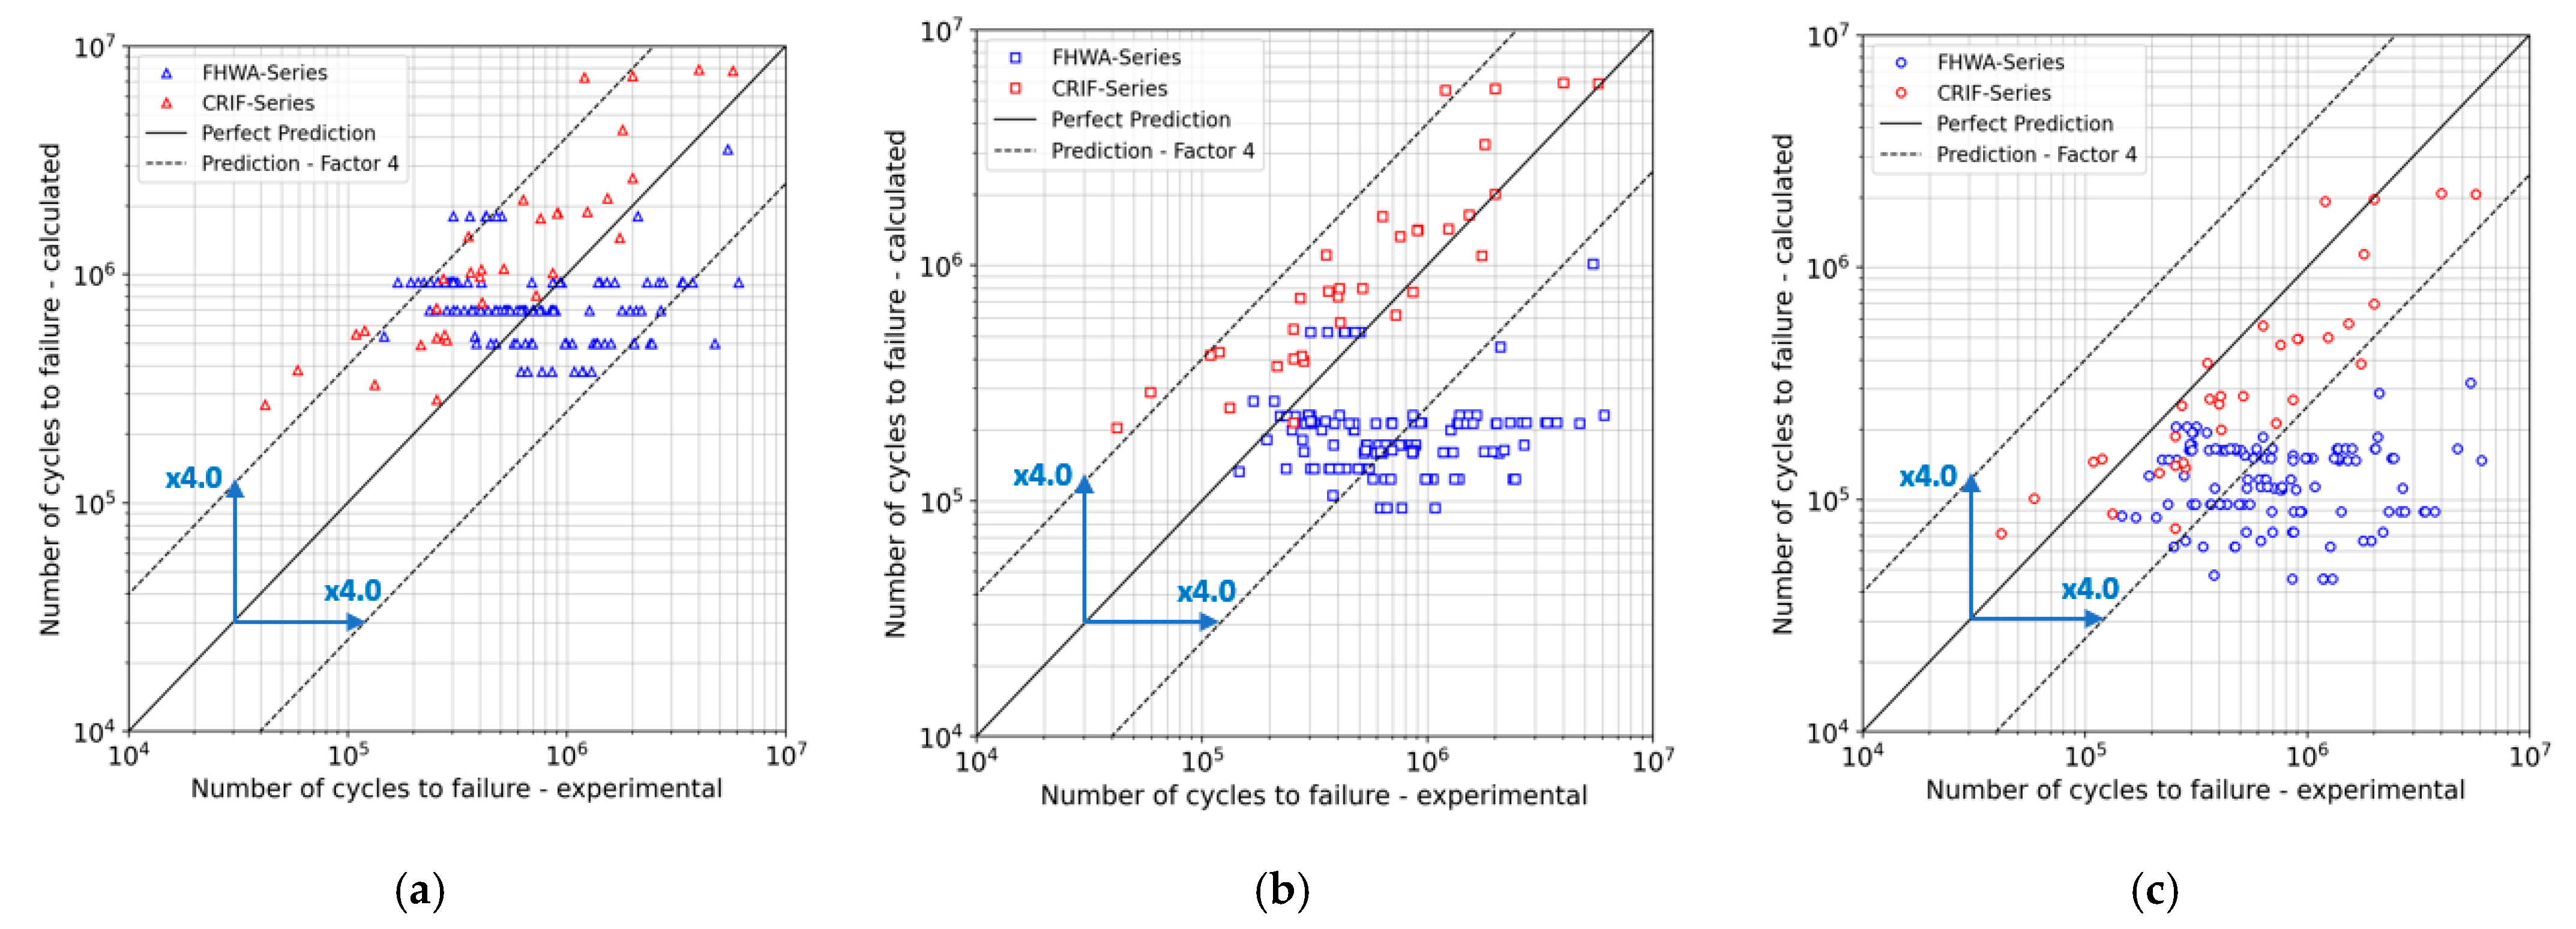
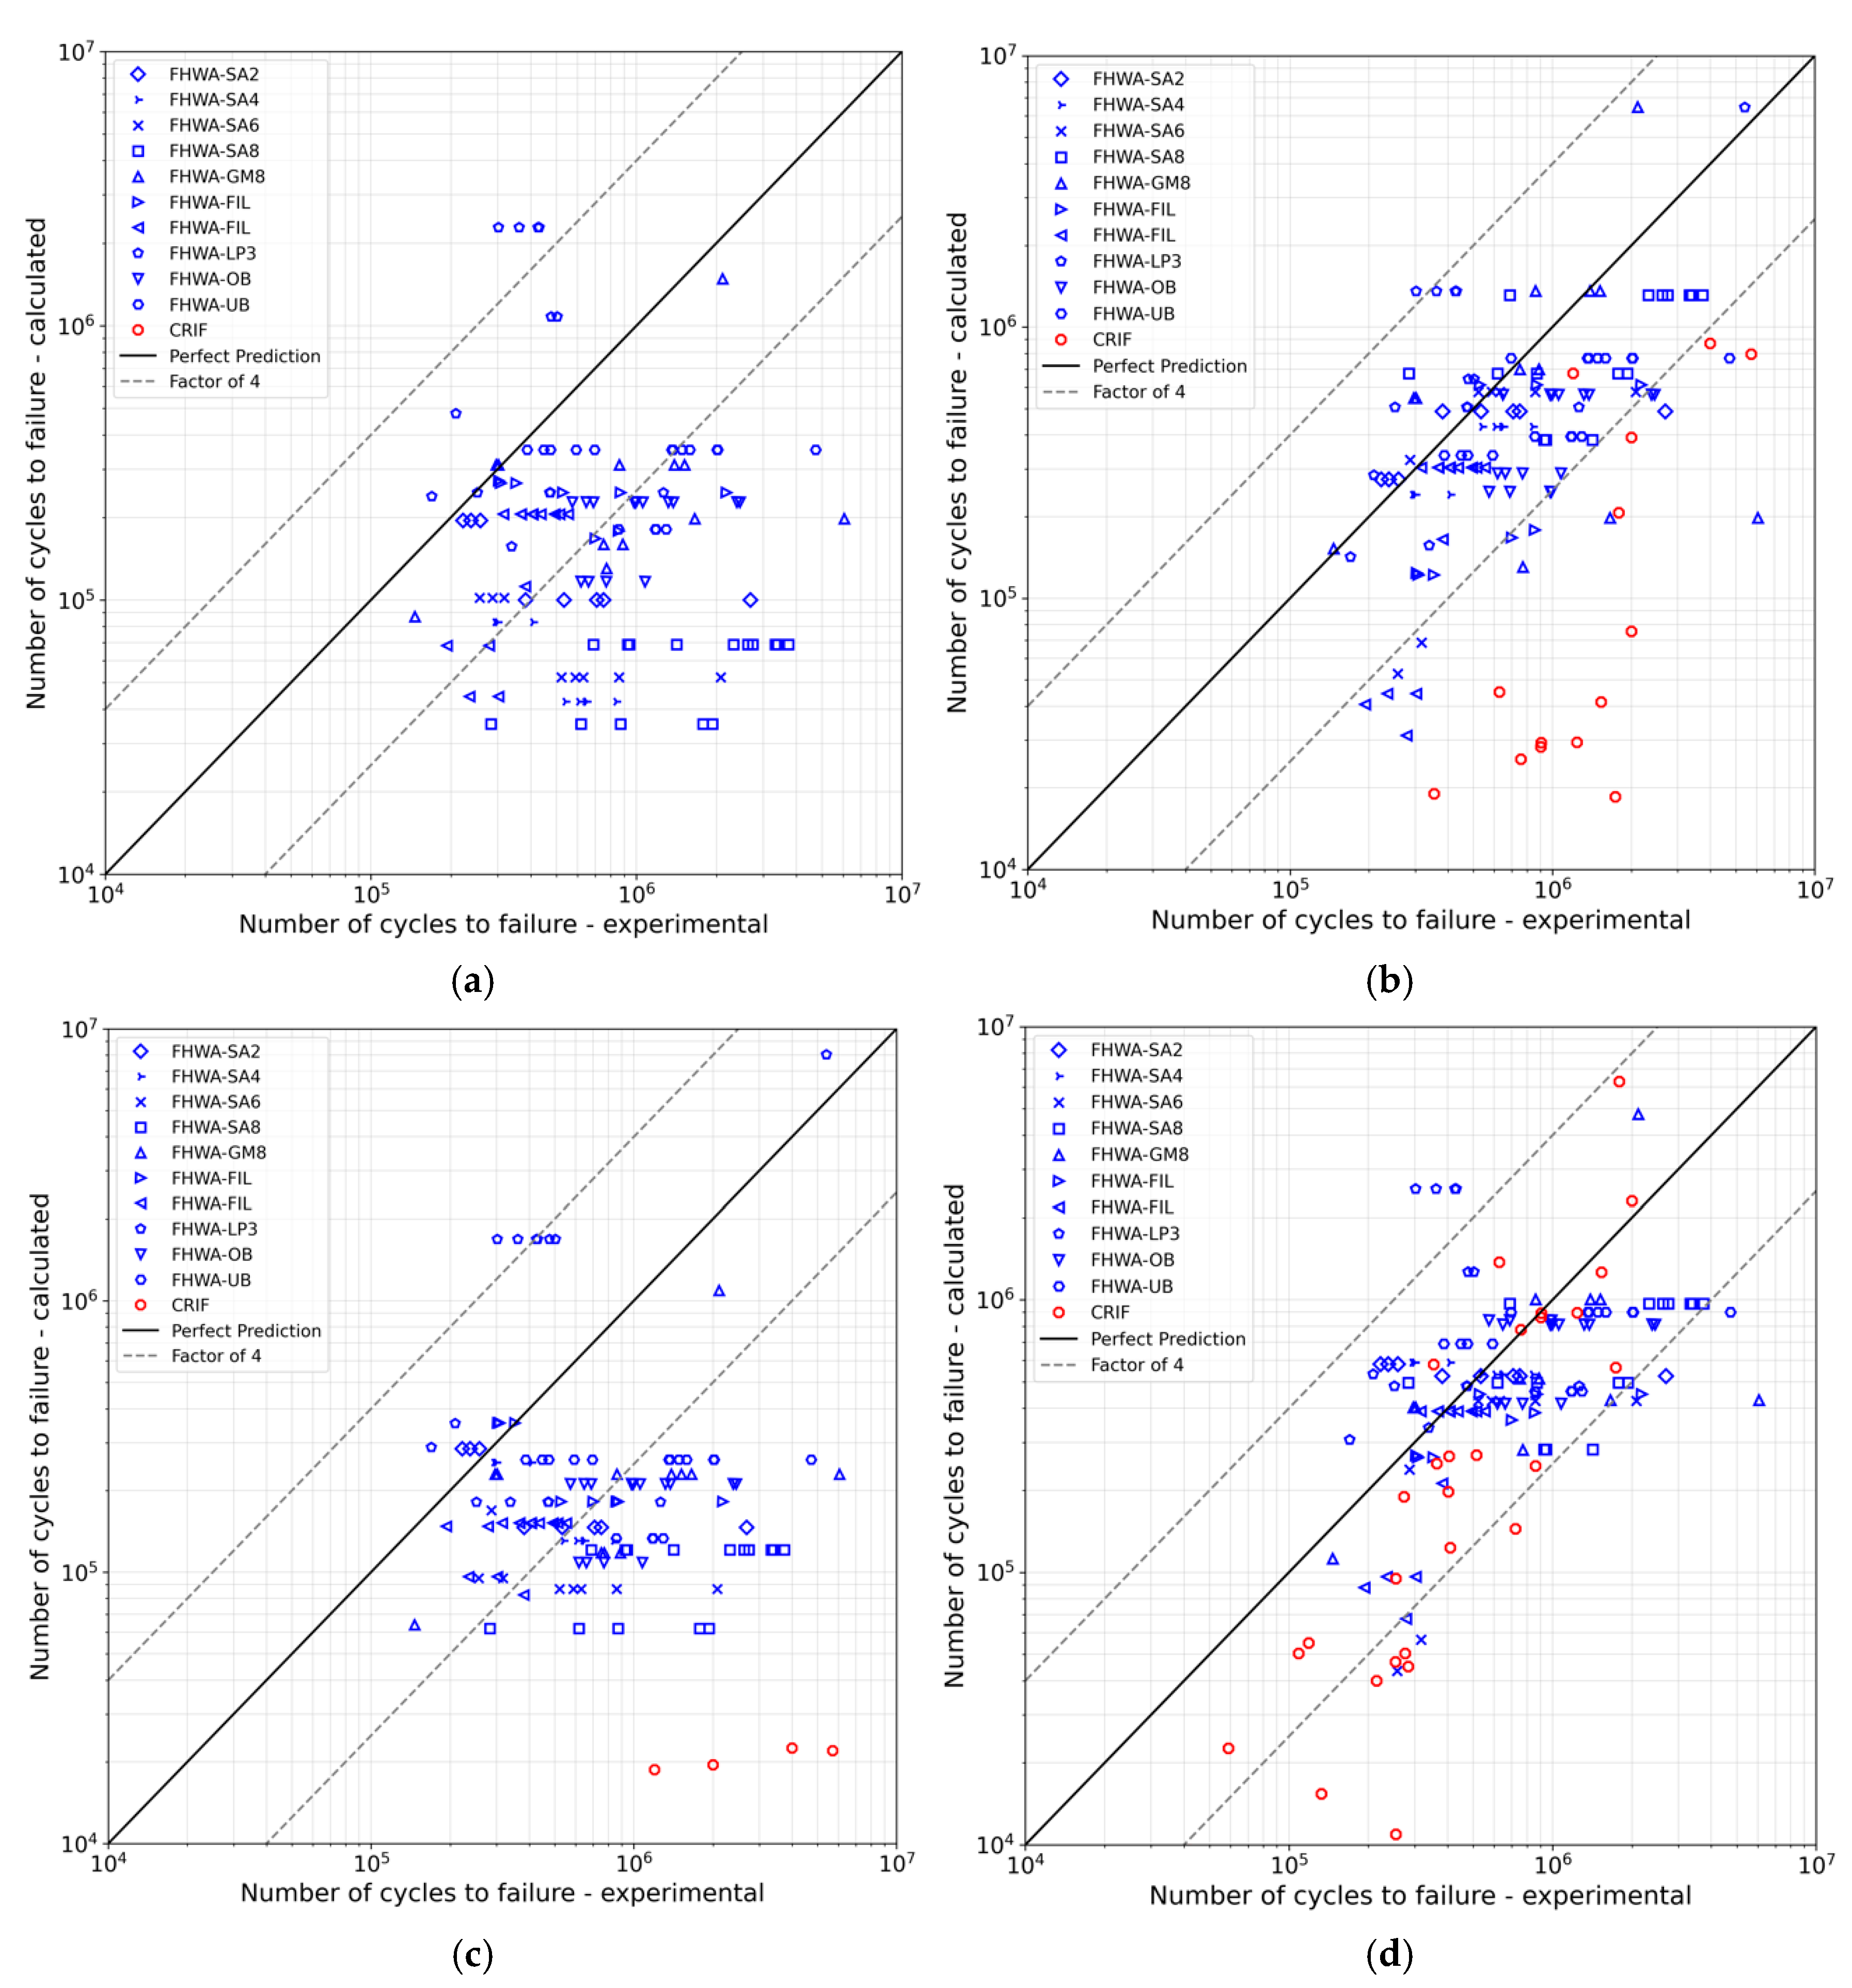
  • The fatigue lives predicted by the nominal stress approach are evenly scattered around the perfect prediction line for the FHWA series. Only nonconservative fatigue life predictions were obtained for the CRIF series.
  • The hot spot and effective notch stress methods provide only conservative fatigue assessments for the FHWA series. However, for the CRIF series, the hot spot method fails to account for stress concentration effects due to low weld penetration, resulting in nonconservative fatigue estimates.
  • The effective notch stress (ENS) method yields mostly conservative fatigue life predictions. The ENS method introduces fictitious notches at the weld toes and weld root and, for this reason, detects the high stress concentration taking place at weld roots of the CRIF series.
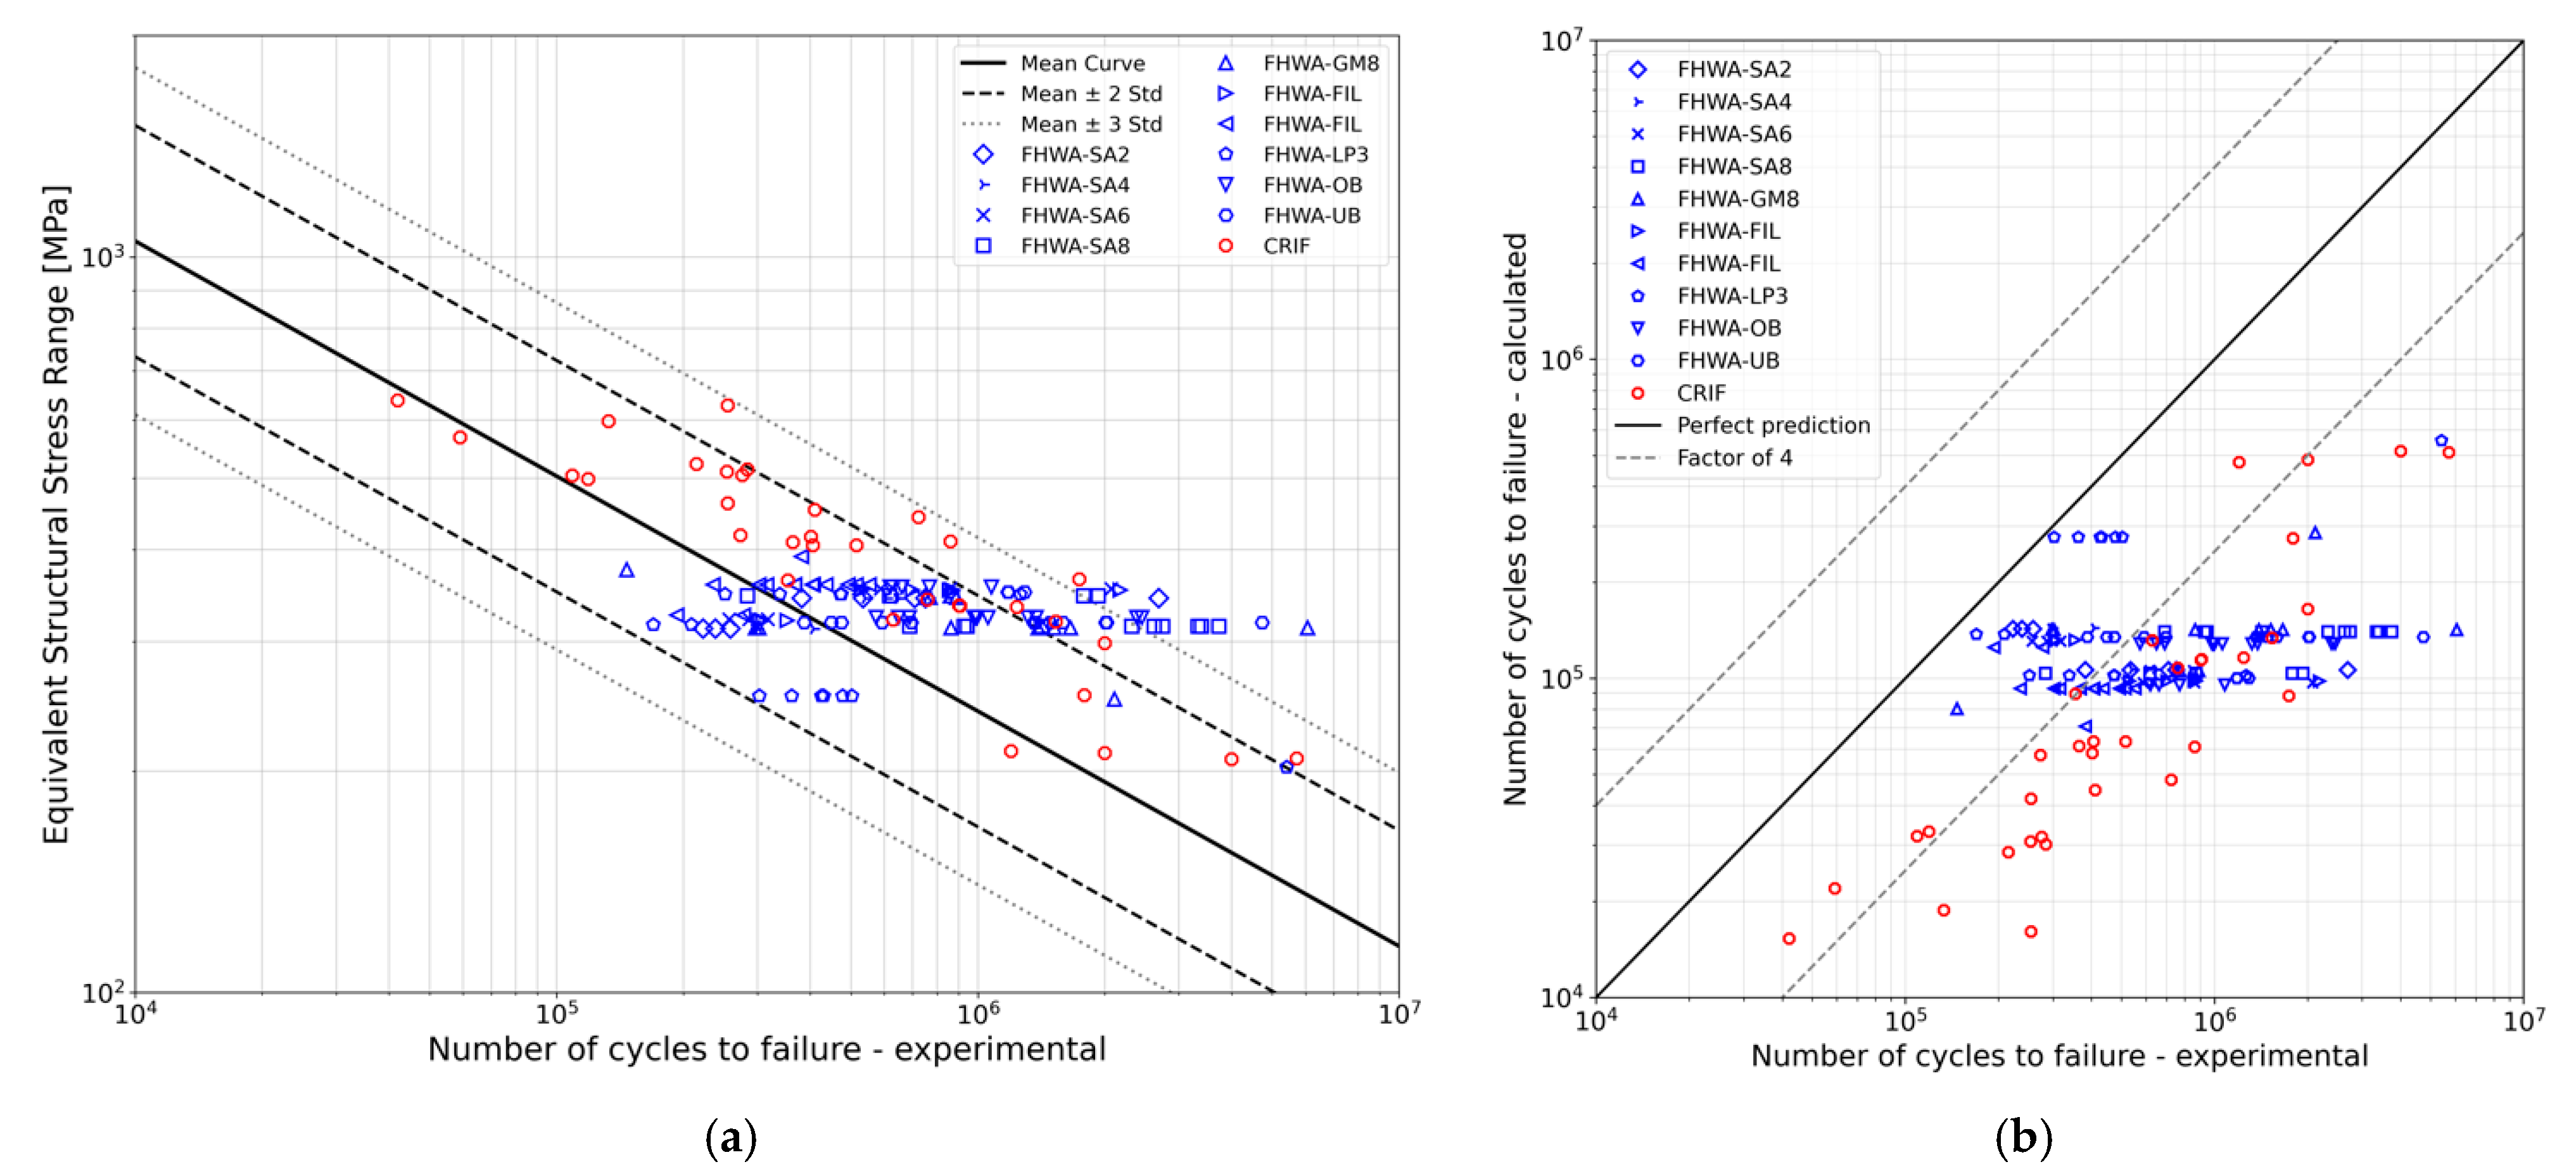
  • The ESS method, assuming purely linear behaviour, yields only conservative fatigue life predictions. The determination of the ESS ranges is related to the stress gradients expected along the considered potential crack plane. As a result, the ESS method captures the detrimental effect of insufficient weld penetration that characterizes the CRIF series.
  • Finally, the Volvo method is found to provide, for both test series, improved fatigue life predictions in comparison to the ESS method when incorporating the thickness and mean stress corrections. The difference between the Volvo and the ESS method can be explained by the selection of S-N curves. The ESS method introduces a design Master S-N curve corresponding to a probability of failure of 5%, while the two S-N curves used in the Volvo method are derived as mean S-N curves from the fatigue tests selected for its validation.

4. Selection of Multiaxial Fatigue Life Assessment Methods for RD Joints

In the fatigue tests discussed in Section 3, RD specimens were subjected to uniaxial constant amplitude cyclic loading. Because of the difference in boundary conditions, RD joints in bridge structures undergo multiaxial random loading under the complex action of random traffic loading. Multiaxial stress states can be categorized as either proportional or non-proportional, depending on whether the principal stress directions remain constant or vary over time. RD welded joints of OSBDs in suspension bridges generally experience, in service, alternately non-proportional and proportional loading. There is experimental evidence [27,28,29] that standard fatigue evaluation methods can lead to nonconservative results in the presence of non-proportional stress states. Non-proportional loading is likely to incur more damage than proportional loading because of the additional hardening resulting from the rotation of the principal axes and the activation of multiple slip systems [30]. Multiaxial fatigue assessment approaches can be divided into three main categories: equivalent stress- or strain-based approaches, which are typically implemented in design standards, critical plane-based approaches, and the more recently proposed stress path-dependent method. The performance of the Volvo method in the presence of multiaxial stress states was also investigated.

4.1. Methods Recommended in Design Standards

The Eurocode and the IIW [14] recommend addressing multiaxial stress states through an equivalent stress-based approach. The IIW stipulates that non-proportional loading shall be expected to result in higher fatigue damage than proportional loading. If the maximum principal stress direction varies less than 20 degrees over the loading history, the maximum principal stress should be regarded as the governing component for fatigue damage. Otherwise, the damage caused by axial and shear stresses should be estimated independently and finally combined through an interaction formula as shown in Equation (16), where σ R , d and τ R , d refer to the normal and shear design resistance ranges:
σ e q σ R , d 2 + τ e q τ R , d 2 C V ,
In the presence of non-proportional loading, it is suggested to limit the acceptable damage level CV to 0.5 or even 0.2 if the mean stress varies, which is often the case for complex random loading.
The commentary section in DNV-RP-C203 [31], which discusses multi-directional fatigue, acknowledges that the detrimental effects of non-proportional loading on fatigue life are not captured by conventional methods. It is then recommended to use Equation (17) for all potential critical planes, where σ n , C P and τ C P refer to the stress range being normal to the considered plane and the shear stress range being on the same plane. The factor γ is to be set to 1 in the presence of proportional loading. However, no guidance on the selection of γ values is provided for non-proportional loading.
σ m u l t i , D N V = γ σ n , C P + 0.81 τ C P ,
The IIW [14] provides guidelines for hot spot stress-based fatigue estimation in the presence of biaxial loading. The damage criterion is defined as the maximum principal stress if its associated vector forms an angle below 60° with the direction perpendicular to the weld line; otherwise, the stress component parallel with the extrapolation line should be selected.

4.2. Critical Plane-Based Approaches

None of the standard methods discussed above can quantify the effect of non-proportionality, thus creating the need for alternative methods. Many critical plane-based approaches can be found in the literature; the authors do not intend to provide a comprehensive account of all the variations of the method but rather present their motivation behind the selected critical plane approach. Critical plane approaches can be divided into strain-based and stress-based categories. Energy-based critical plane methodologies exist, but to the authors’ knowledge, their applicability to welded joints in the high-cycle regime remains to be demonstrated. Consequently, energy-based methods are not explored in the present study.
The strain-based critical plane approaches include, among others, the Fatemi and Socie model [32], the Smith–Watson–Topper model [33], and the Wang–Brown model [34]. The strain-based approaches hinge on the Manson–Coffin–Basquin relation, which poses challenges due to the limited availability of the material parameters it requires. In addition, the performance of the Manson–Coffin–Basquin relation has been questioned in the high-cycle regime beyond 1 million cycles [35]. The authors applied the FS and SWT models to the case study presented in Section 5. Only negligible damage levels were predicted.
The stress-based critical plane approaches were inspired by the Gough–Pollard criterion [36], which is one of the first attempts to quantify the combined detrimental effect of shear and normal stress variations on fatigue life. The criterion was first developed for non-welded specimens and later extended to welded joints. Gough proposed an interaction formulation that underpins the elliptical relation of Equation (13) proposed by IIW. As shear and axial stresses are treated separately, the loss of phase information makes the approach inadequate to treat cases with non-proportional multiaxial loading. Among the stress-based critical plane models proposed in the literature, Findley’s approach [37] and the modified Wöhler curve method [38] are still in use. However, they have been proven by Bibbo [39] to be nonconservative under non-proportional loading and are not further considered in this study.
Carpinteri [40] proposed to derive the critical plane orientation from a weighted average of the principal directions. The proposed critical plane criterion provided satisfactory fatigue life prediction for specimens under non-proportional loading. Vantadori [41] adapted the approach to fillet welds subjected to arbitrary multiaxial loading. Therefore, this approach is selected for fatigue assessments conducted in the case study of Section 5. Further details are provided in Section 5.3.

4.3. Path-Dependent Maximum Range Cycle Counting Method

As Mei [42] discussed, critical plane-based approaches depend on the a priori selection of a dominant stress or strain component on which cycle counting is performed, thus overlooking potentially detrimental stress or strain paths. The importance of the load stress path was recognized by Fatemi [32]. Dong [43] introduced a new cycle-counting algorithm capable of accounting for the stress or strain path effect. The proposed path-dependent maximum range (PDMR) counting algorithm can be regarded as an extension of the ESS concept presented in Section 2. A more detailed description of the algorithm can be found in [43,44], but the main steps of the algorithms are summarized below for the stress-based alternative:
  • The stress history is converted into the σ β τ plane, where σ and τ represent the linearized structural stress components discussed in Section 2. A value of 3 for the fatigue strength equivalency factor β was recommended by Dong from his previous work as it provided the best fit for the fatigue test data used for validation.
  • The maximum possible stress range of the segmented time history is identified. As expressed in Equation (18), an effective stress range ∆Se is calculated as the cumulated lengths of the stress path connecting extremities P and Q of the maximum range. Then, the algorithm sequentially considers the successive positions of the mapped stress history; the subsequent intermediate position R is retained only if the distance PR from the initial stress point P increases. If the distance PR decreases, the algorithm reverts to the previous position of R and introduces a new virtual position R* defined as the intersection between an arc of radius PR centred in P and the remaining stress path segments considered in chronological order. The stress path is complete when the current position R reaches Q.
    S e = P Q d S e = P Q d σ 2 + β d τ 2 ,
  • The process described above is repeated on the remaining mapped stress history until all segments have been counted. It is important to note that each calculated effective stress range corresponds to half a cycle as it is not fully reversed.
The stress-based PDMR method is also selected for the fatigue assessment of RD welded joints of OSBDs in the case study and further details are provided in Section 5.4.

4.4. Volvo Method

Wei [45] conducted a comparative analysis between the ESS method and the Volvo method. He underlined the current limitations of the Volvo method in the treatment of multiaxial loading. The Volvo method, in its present formulation, is solely based on the structural stress normal to the considered potential crack plane. The method does not include a specific treatment procedure for multiaxial stress states.
In the presence of complex variable loading, Wei suggests using a weighted average value r b , a v   of the bending ratio, which is calculated by means of Equation (19):
r b , a v = i r b , i . S x , i 2 i S x , i 2
where r b , i and S x , i designate, respectively, the bending ratio and the structural stress at each time step t i . The average value r b , a v is then applied to all counted cycles. Using r b , a v as a unique value for the bending stress ratio, the Volvo method can be applied to multiaxial loading, following the procedure described in Section 3.2.3.

5. Case Study: RD Welded Joints in the OSBD of a Suspension Bridge

The structural behaviour of RD welded joints as components of OSBDs differs from that of the specimens studied in Section 3. The different boundary conditions will result in a dominantly biaxial stress state under the action of axle loads from traffic. To illustrate the importance of considering the multiaxial loading conditions and the applicability of the assessment methods selected in Section 4, several RD joints of a long-span suspension bridge girder were studied.

5.1. Considered Bridge

The Hardanger bridge is currently the longest suspension bridge in Norway with a main span of 1308 m. Its cross-section, a conventional OSBD, and the typical RD joint geometry are shown in Figure 11. The girder is made of steel grade S355.
The Hardanger bridge was designed to meet the requirements of the no-longer-used Norwegian standard HB185 [46], which deviates from the Eurocode on the important aspects discussed below:
  • The fatigue load model (FLM) consists of five different types of lorries with the same number of axles and distance between axles but is characterized by different load intensities as illustrated in Figure 12.
  • The HB185 standard ignores the transverse frequency distribution of vehicles and recommends considering that all traffic damage accumulates at the most detrimental lateral position contained within 0.3 m of either side of the bridge centreline.
Figure 12. Fatigue load model (HB185).
Civileng 06 00007 g012
The fatigue verification of the Hardanger bridge is conducted with an assumed average daily traffic of 1500 lorries. The design life of the bridge is 100 years.
A global model of the bridge was developed in Abaqus to determine the global influence lines and the boundary conditions for a 16 m long local model. Six degrees of freedom springs are introduced at the extremities of the local model to recreate the constraints by the structural components not included in the Abaqus local model. The six stiffness components of the springs are summarized in Table 2.
The structural stress approach requires extracting, along the potential crack planes, nodal forces which are only available in computationally demanding solid elements. The modelling strategy, illustrated in Figure 13, involves four levels of submodelling. The first two submodels consist only of shell elements transitioning to solid elements using the shell-to-solid coupling technique.
Eight RD joints, located beneath the slow traffic lane, were selected for fatigue assessment as shown in Figure 14. The FLM was assumed to circulate on the bridge with eccentricities of 0.30 m on either side of the centreline with increments of 0.15 m. Traffic loading was modelled using moving pressure loads generated by a Fortran subroutine.

5.2. Fatigue Assessments by Methods Given in Standards

5.2.1. Nominal Stress Approach

The nominal stress-based evaluation of RD joints was conducted in compliance with the recommendations from the Eurocode. The nominal stress is conservatively estimated as the bending stress acting at the rib weld toe. No stress range above the fatigue limit corresponding to detail category FAT 71 was detected.

5.2.2. Hot Spot Stress Approach

The hot spot stress method was implemented to evaluate potential Type I and Type III cracks, using a Python 3.9 script to extrapolate the hot spot stress at weld toes and derive the principal stresses. The meshing and stress extrapolation procedures recommended by IIW [15] were followed. The detail category FAT 100 was used for damage calculations. Accumulated damage was evaluated using Miner’s rule.

5.3. Fatigue Assessment by Critical Plane-Based Approach

The critical plane approach was implemented for Type I and Type III cracks for all RD joints. In compliance with Vantadori’s proposed methodology [41], the instantaneous stress tensor σ(t) was derived from a hot spot stress extrapolation of the different stress components. The instantaneous orientation of the principal stresses 1 ^ (t), 2 ^ (t), and 3 ^ (t) can be described by means of the principal Euler angles ϕ ( t ) , θ ( t ) , and ψ ( t ) described in Carpinteri’s publication [40].
For each vehicle passage of duration Ti for a given eccentricity ei of the lorry, the average principal Euler angles Φ ^ , θ ^ , and ψ ^ are given by Equation (20):
Φ ^ = 1 W 0 T i Φ t W t d t ,   θ ^ = 1 W 0 T i θ t W t d t ,   ψ ^ = 1 W 0 T i ψ t W t d t ,
where W(t) is a function defined as follows:
W t = H ( σ t σ m a x ) ,
The Heaviside step function, denoted by H(x), takes the value 1 for positive x values and 0 for strictly negative x values. W is the average value of W(t) over the interval [0,Ti]. For each vehicle passage, the average principal Euler angles correspond to the frame defined by the principal stress directions at the instant when the maximum principal stress is reached. The fatigue verification is performed with respect to the critical plane defined by the normal vector w obtained by rotating the averaged principal stress 1 ^ towards 3 ^ by an angle δ expressed in degrees in Equation (22):
δ = 3 2 1 τ a f , 1 σ a f , 1 2 45 ,
where σ a f , 1 and τ a f , 1 are, respectively, the normal and shear fatigue strengths of the considered detail. The selected detail category is FAT 100 as it is associated with manual fillet welds carried out from one side only. For fillet welds transmitting shear forces, the detail category FAT 80 (Table 8.5, detail 8 of Eurocode [11]) can be selected.
The stress vector S w acting on the critical plane defined by the normal w is given by the following:
S w = σ · w ,
The normal and shear stress vectors, respectively, N and C, can be derived using Equations (24) and (25). The stress vector N is then normal to the critical plane while C is the projection of S w onto the critical plane.
N = ( w · S w ) · w
C = S w N ,
The main aspects of the cycle counting methodology proposed by Vantadori are summarized below:
  • The peaks and valleys of the series of magnitude N ( t ) t ϵ [ 0 , T i ] are extracted for each vehicle passage, forming a new series of scalar values N * .
  • The values taken by the shear stress vector concomitantly with the peaks and valleys of the normal stress vector are stored in a new scalar series C * . A reduction procedure is applied to the shear stress series to ensure that the shear stress amplitude between two extremes of the N series is preserved.
  • The N * series is then rainflow counted. For each identified cycle, the maximum value of N * and the maximum amplitude C a , m a x of C * are identified.
  • For the j-th of the Nreversals of the N * series, an equivalent stress range is defined in Equation (26).
    σ e q , j = N m a x * 2 + τ a f , 1 σ a f , 1 2 C a , m a x * 2 ,
For each vehicle passage corresponding to eccentricity ei, the accumulated damage is expressed in Equation (27), where σ D is the fatigue strength at 5 million cycles. A bilinear S-N curve is used as suggested by the Eurocode when dealing with variable amplitude loading. The term n r e v e r s a l s , j refers to the number of reversed loadings at the considered equivalent stress range σ e q , j .
D p a s s a g e i = Δ σ e q , j σ D n r e v e r s a l s , j 5 . 10 6 σ D σ e q , j 5 + Δ σ e q , j > σ D n r e v e r s a l s , j 5 . 10 6 σ D σ e q , j 3

5.4. Fatigue Assessment by Volvo Method

A maximum damage of 4.5% of accumulated damage is predicted for crack Type IV at welded joint RD51 for the intended design life. The low level of damage predicted by the Volvo method can be attributed to the selection of the reference S-N curves derived as mean curves using fatigue tests. The other fatigue assessment approaches considered in this study are based on S-N curves corresponding to a probability of failure of 5%, resulting in more conservative fatigue life predictions. In addition, the Volvo method considers only one structural stress component, thus ignoring the detrimental effect of non-proportional loading.

5.5. Fatigue Assessment by PDMR Method

The individual structural stress components σ x , σ y , and σ z were derived using Python scripts to post-process the extracted nodal forces as described in Section 2. As revealed for some selected details in Figure 15a,c, the RD joints experience alternately proportional and non-proportional loading under the action of traffic. Figure 15a shows the time series of the three structural components acting on the Type I crack plane of joint RD52 for a vehicle eccentricity of −0.3 m. Figure 15b shows the time series mapped in the ( σ x , β σ z ) plane where the non-proportionality of the stress state becomes apparent. It also becomes clear that the RD joints undergo biaxial stress states dominated by the σ x and σ z components. The joint RD31 experience on a Type III potential crack plane proportional biaxial stress states is shown in Figure 15c,d.
The PDMR cycle counting algorithm was implemented in Python to extract the direct stress ranges and the corresponding path lengths for each vehicle passage. For the j-th identified half reversal, the equivalent structural stress range Δ S P D M R , j was obtained by a relation similar to Equation (9) with the alterations suggested by Mei [42] as summarized in Equations (28)–(30). The number of cycles to failure for the stress range Δ S P D M R , j can be calculated by using Equation (12).
σ b , e = σ b , x 2 + β σ b , z 2 and   σ m , e = σ m , x 2 + β σ m , z 2 ,
r e = σ b , e σ m , e + σ b , e ,
S P D M R , j = σ P D M R t e s s 2 m m I ( r e ) ,
Finally, the damage corresponding to the passage of a vehicle with an eccentricity ei was obtained by applying Miner’s rule to sum the contribution of all stress ranges as expressed in Equation (31). The coefficient 0.5 in the numerator stems from the identification of only half cycles in the PDMR cycle counting method is discussed in Section 4.3.
D p a s s a g e i = Δ S P D M R , j 0.5 C Δ S P D M R , j 1 h ,
In the above expression, Δ S P D M R , j refers either to the direct stress range or the stress path length. The results are presented for both cases to illustrate the importance of stress path dependency of the RD joints under traffic loading as shown in Figure 16.

5.6. Comparison of Results and Discussion

The accumulated damage over the entire design life was calculated based on the nominal and hot spot stress approaches, the critical plane approach, and the PDMR method defined for both the path-independent stress range and the stress path-dependent alternatives.
In compliance with the HB185 standard, traffic damage accumulation is calculated for the most detrimental vehicle eccentricity. The accumulated fatigue damages were calculated by the four methods described in the present section when applicable and in Figure 16. The hot spot stress and the critical plane methods can only be applied to crack mechanisms of Types I and III. As discussed in Section 5.2, no damage is predicted by the nominal stress method. The hot spot stress and critical plane yielded comparable levels of damage for Types I and III. On the other hand, the PDMR cycle counting method revealed significantly higher levels of damage with the exception of Type III cracks.
The difference between path-independent and path-dependent alternatives of the PDMR method in the case of Type II and Type IV can be regarded as evidence of high levels of non-proportionality. The present work is not intended as a fatigue design verification of the RD joints of the Hardanger bridge but rather as a comparative study of different fatigue assessment methods. For this reason, all material factors are set to unity.
The fatigue damage levels predicted by the PDMR method align with the conclusions from publications [42,44], which demonstrated that this method tends to give conservative fatigue life predictions in the high-cycle regime for welded joints under random variable amplitude loading. The significant predicted fatigue damage can also be explained by the conservative approach recommended by the Norwegian standard HB185.

6. Conclusions

A nodal-force based framework was implemented to study fatigue tests conducted on rib–deck welded joints under uniaxial loading conditions. The calculated equivalent structural stresses generally fall within the typical scatter band of the Master curves defined in the ASME Div Code. This study also includes a comparison of predicted damage levels for RD welded joints within the OSBD of a long-span suspension bridge. Multiaxial fatigue caused by complex traffic loading was evaluated using five multiaxial fatigue assessment methods. The following conclusions can be drawn:
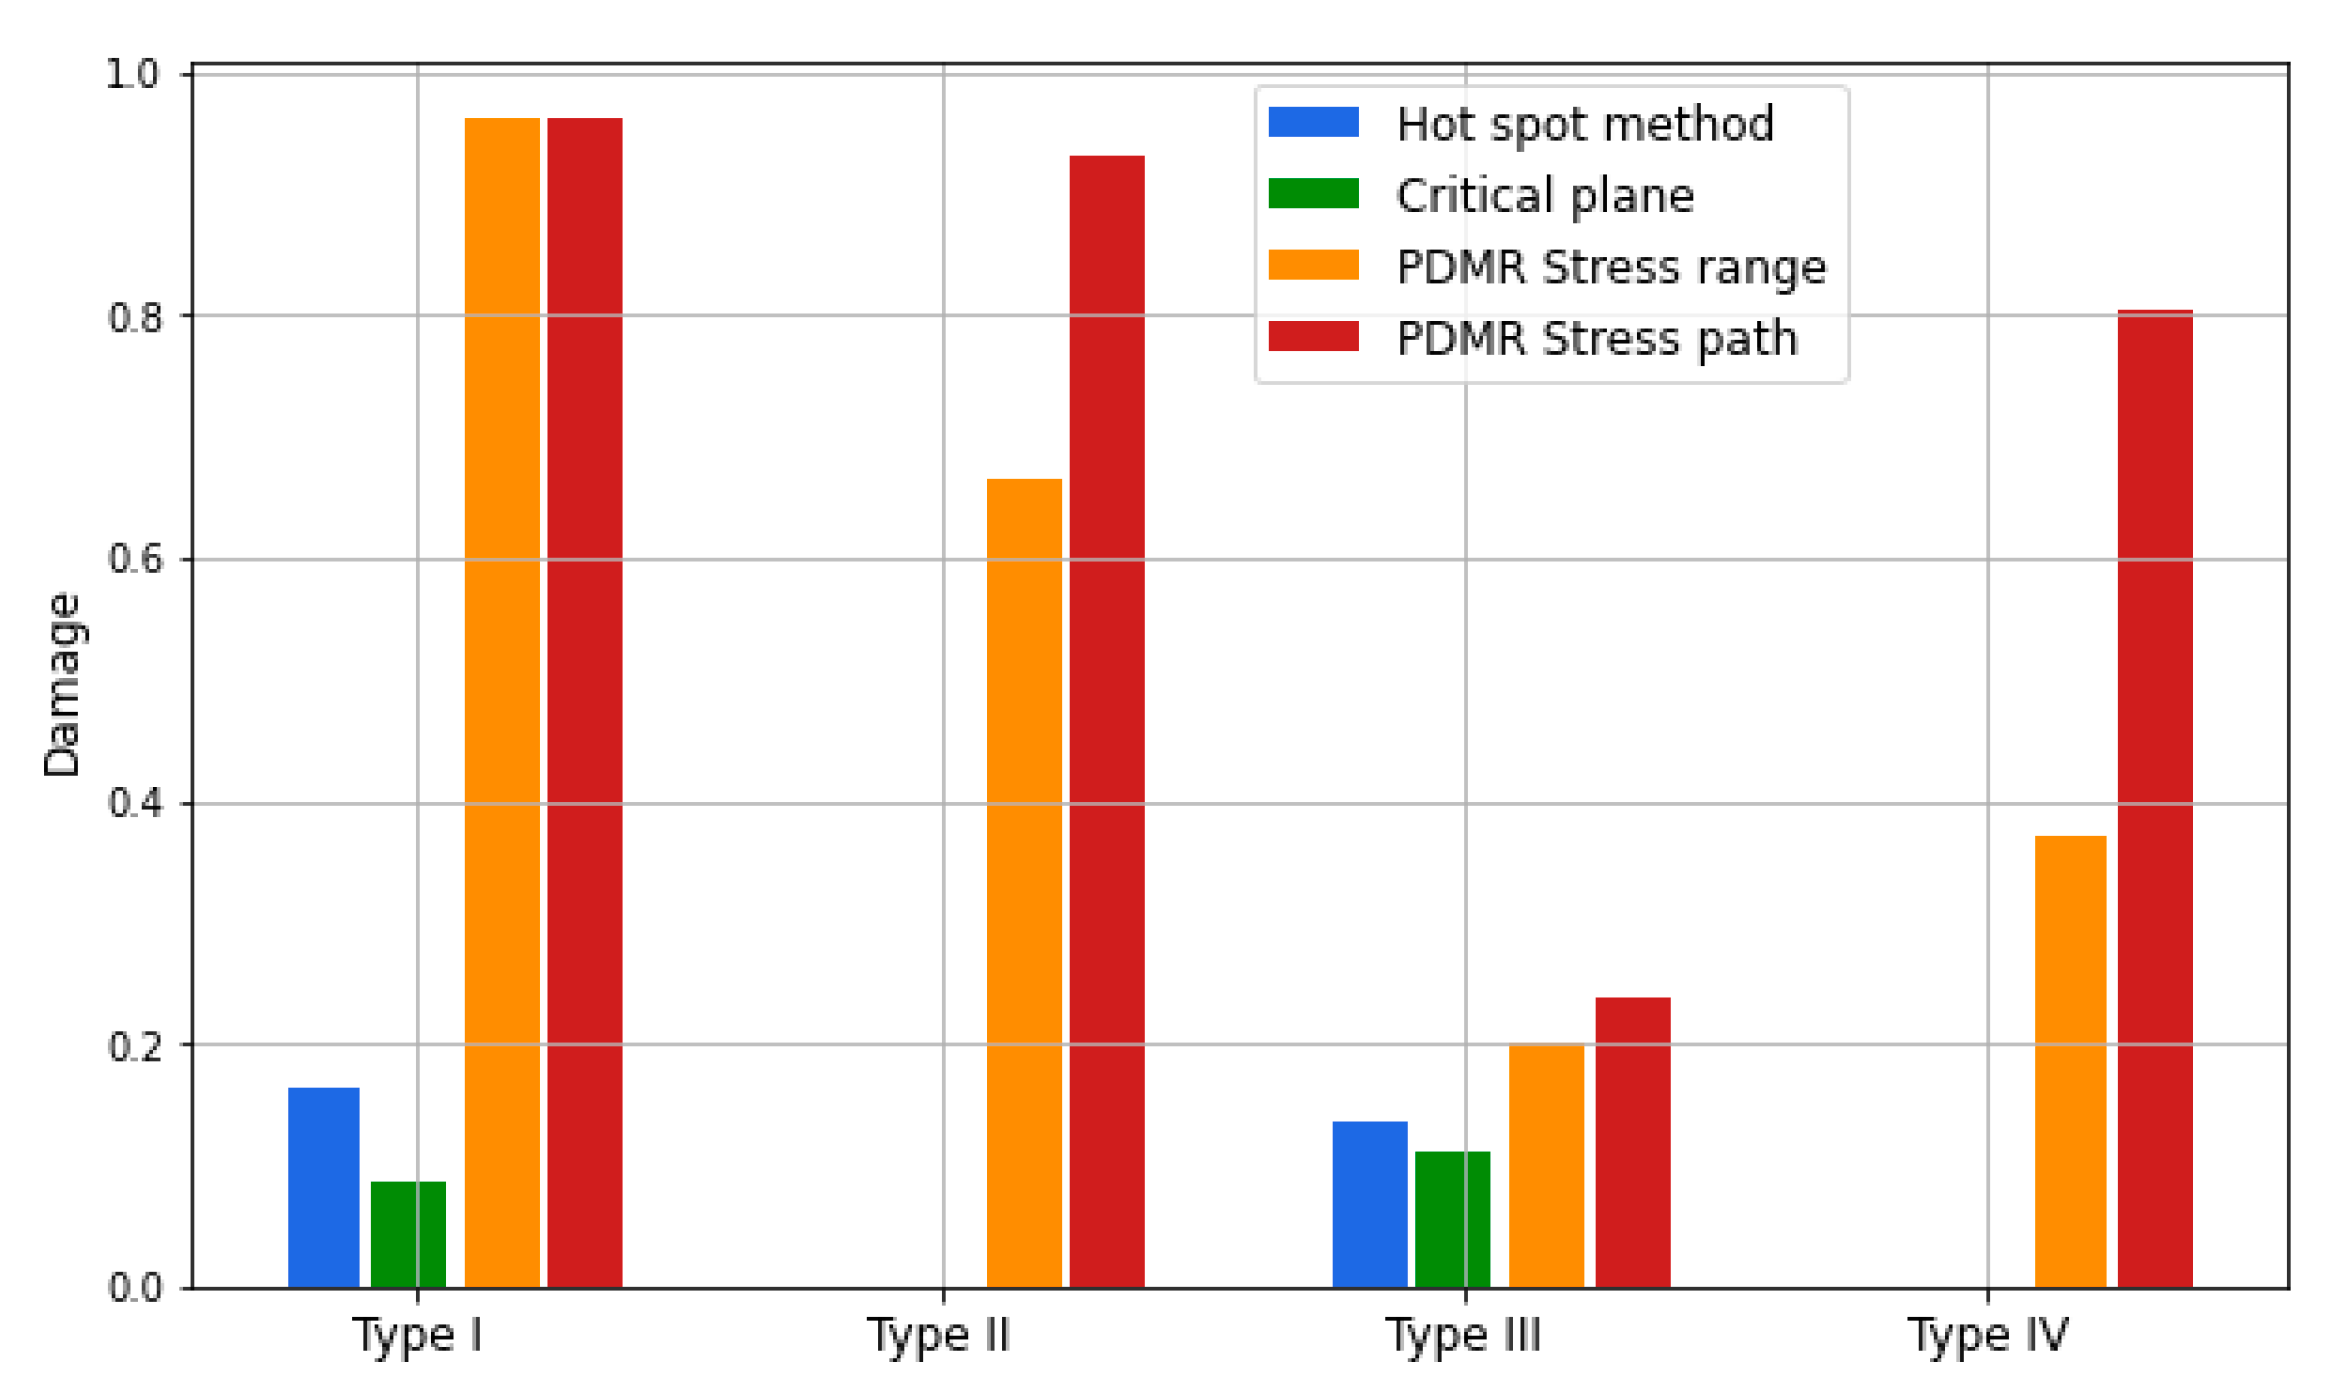
  • The nominal stress-based approach recommended by the Eurocode for the assessment of RD welded joints provides a satisfactory fatigue life prediction under uniaxial loading conditions. However, when dealing with RD welded joints as integrated bridge components, the method yields significantly less conservative predictions than the alternative methods. The method fails to capture the detrimental effect of the complex non-proportional multiaxial loading experienced by RD welded joints under traffic loading.
  • Moderate damage levels are anticipated by the critical plane and hot spot stress methods for the potential crack mechanisms Types I and III.
  • The Volvo method accurately predicts the fatigue life of RD welded joints under uniaxial loading when the mean stress and plate thickness correction factors are included. However, as the method has not yet been developed to predict fatigue damage induced by complex multiaxial loading, only small levels of damage are predicted at the RD welded joints under traffic loading.
  • The path-dependent maximum range (PDMR) cycle counting method predicts larger accumulated fatigue damage. Because of the well-documented stress path dependency of non-proportional fatigue, the authors believe that the PDMR method provides a valuable quantification of the fatigue damage induced by random traffic loading on RD welded joints. However, the method generally gives conservative fatigue life prediction in the high-cycle regime.
With the present study, the authors wish to highlight the limitations of current practice for fatigue life assessment of rib–deck welded joints in OSBDs but also emphasize the uncertainty related to existing multiaxial fatigue assessment methods when applied to such complex welded structural details. The difference in damage levels predicted by two established multiaxial fatigue prediction approaches leads the authors to stress the need for fatigue tests on large-scale specimens to gain a better understanding of the fatigue behaviour of RD welded joints under non-proportional loading conditions. In the absence of extensive experimental data, practising engineers are advised to consider the PDMR method to evaluate the fatigue life of RD welded joints of OSBDs as it tends to provide safer predictions.

Author Contributions

Conceptualization, B.V. and S.C.S.; methodology, B.V.; software, B.V.; validation, B.V., S.C.S. and J.B.J.; formal analysis, B.V., S.C.S. and J.B.J.; investigation, B.V., S.C.S. and J.B.J.; resources, B.V.; data curation, B.V.; writing—original draft preparation, B.V.; writing—review and editing, B.V., S.C.S. and J.B.J.; visualization, B.V.; supervision, S.C.S. and J.B.J.; project administration, S.C.S.; funding acquisition, B.V. All authors have read and agreed to the published version of the manuscript.

Funding

This research was funded by the Research Council of Norway, grant number 311895.

Data Availability Statement

Data are contained within the article.

Acknowledgments

The authors wish to express their gratitude to the Norwegian Public Roads Administration and the Research Council of Norway for their support and funding.

Conflicts of Interest

The authors declare no conflicts of interest.

References

  1. De Jong, F.B.P. Overview fatigue phenomenon in orthotropic bridge decks in the Netherlands. In Proceedings of the 1st International Orthotropic Bridge Conference, Sacramento, CA, USA, 25–27 August 2004. [Google Scholar]
  2. Mehue, P. Cracks in steel orthotropic decks. In Bridge Management; Springer: Boston, MA, USA, 1990; pp. 633–642. [Google Scholar]
  3. Zhang, Q.H.; Bu, Y.Z.; Li, Q. Review on Fatigue Problems of Orthotropic Steel Bridge Deck. China J. Highw. Transp. 2017, 30, 14–30. [Google Scholar]
  4. Chatterjee, S.; Parkman. Strengthening and refurbishment of Severn Crossing. Part 1: Introduction. Proc. Inst. Civ. Eng. Struct. Build. 1992, 94, 1–5. [Google Scholar] [CrossRef]
  5. Kolstein, M.H. Fatigue Classification of Welded Joints in Orthotropic Steel Bridge Decks; Delft University of Technology: Delft, The Netherlands, 2007. [Google Scholar]
  6. Cheng, B.; Ye, X.H.; Cao, X.; Mbako, D.D.; Cao, Y. Experimental study on fatigue failure of rib-to-deck welded connections in orthotropic steel bridge decks. Int. J. Fatigue 2017, 103, 157–167. [Google Scholar] [CrossRef]
  7. Ya, S.; Yamada, K.; Ishikawa, T. Fatigue evaluation of rib-to-deck welded joints of orthotropic steel bridge deck. J. Bridge Eng. 2011, 16, 492–499. [Google Scholar] [CrossRef]
  8. Sim, H.B.; Uang, C.M. Stress analyses and parametric study on full-scale fatigue tests of rib-to-deck welded joints in steel orthotropic decks. J. Bridge Eng. 2012, 17, 765–773. [Google Scholar] [CrossRef]
  9. Kainuma, S.; Yang, M.; Jeong, Y.S.; Inokuchi, S.; Kawabata, A.; Uchida, D. Experiment on fatigue behavior of rib-to-deck weld root in orthotropic steel decks. J. Constr. Steel Res. 2016, 119, 113–122. [Google Scholar] [CrossRef]
  10. AASHTOLRFD Bridge Design Specifications. 9th Edition. Available online: https://aashtojournal.transportation.org/aashto-issues-updated-lrfd-bridge-design-guide/ (accessed on 14 January 2025).
  11. EN 1993-1-9; Eurocode 3: Design of Steel Structures—Part 1–9: Fatigue. European Committee for Standardization: Brussels, Belgium, 2005.
  12. EN 1993-2:2006; Eurocode 3: Design of Steel Structures—Part 2: Steel Bridges. European Committee for Standardization: Brussels, Belgium, 2005.
  13. Radaj, D.; Sonsino, C.M.; Fricke, W. Fatigue Assessment of Welded Joints by Local Approaches; Woodhead Publishing: Cambridge, UK, 2006. [Google Scholar]
  14. Hobbacher, A. Recommendations for Fatigue Design of Welded Joints and Components; Springer International Publishing: Cham, Switzerland, 2016; Volume 47. [Google Scholar]
  15. Fricke, W. IIW Recommendations for the Fatigue Assessment of Welded Structures by Notch Stress Analysis: IIW-2006-09; Woodhead Publishing: Cambridge, UK, 2012. [Google Scholar]
  16. Dong, P. A structural stress definition and numerical implementation for fatigue analysis of welded joints. Int. J. Fatigue 2001, 23, 865–876. [Google Scholar] [CrossRef]
  17. ASME Boiler and Pressure Vessel Code, an International Code. Sec VIII, Div. 2 (ASME BPVC-VIII-2 e2007); The ASME Publishers: New York, NY, USA, 2007.
  18. Fermér, M.; Andréasson, M.; Frodin, B. Fatigue Life Prediction of MAG-Welded Thin-Sheet Structures. SAE Trans. 1998, 107, 1280–1286. [Google Scholar]
  19. BS 7608; Code of Practice for Fatigue Design and Assessment of Steel Structures. British Standard Institution: London, UK, 1993.
  20. Dong, P. A robust structural stress method for fatigue analysis of offshore/marine structures. J. Offshore Mech. Arct. Eng. 2005, 127, 68–74. [Google Scholar] [CrossRef]
  21. Dong, P.; Jeong, K.H.; De Jesus, A.M. Analysis of recent fatigue data using the structural stress procedure in ASME Div 2 rewrite. J. Press. Vessel. Technol. 2007, 129, 355–362. [Google Scholar] [CrossRef]
  22. Dong, P.; Hong, J.; Dean, S. A robust structural stress parameter for evaluation of multiaxial fatigue of weldments. J. ASTM Int. 2006, 3, 1–17. [Google Scholar] [CrossRef]
  23. Nie, C.; Pingsha, D. A traction stress based shear strength definition for fillet welds. J. Strain Anal. Eng. Des. 2012, 47, 562–575. [Google Scholar] [CrossRef]
  24. Ocel, J.M.; Cross, B.; Wright, W.J.; Yuan, H. Optimization of Rib-to-Deck Welds for Steel Orthotropic Bridge Decks; No. FHWA-HRT-17-020; Federal Highway Administration: Washington, DC, USA, 2017. [Google Scholar]
  25. Janss, J. Fatigue of welds in orthotropic bridge deck panels with trapezoidal stiffeners. J. Constr. Steel Res. 1988, 9, 147–154. [Google Scholar] [CrossRef]
  26. Gurney, T.R. Fatigue of Thin Walled Joints Under Complex Loading; Woodhead Publishing: Cambridge, UK, 1997. [Google Scholar]
  27. Maddox, S.J.; Razmjoo, G.R. Interim fatigue design recommendations for fillet welded joints under complex loading. Fatigue Fract. Eng. Mater. Struct. 2001, 24, 329–337. [Google Scholar] [CrossRef]
  28. Bäckström, M.; Marquis, G. A review of multiaxial fatigue of weldments: Experimental results, design code and critical plane approaches. Fatigue Fract. Eng. Mater. Struct. 2001, 24, 279–291. [Google Scholar] [CrossRef]
  29. Sonsino, C.M. Multiaxial fatigue life response depending on proportionality grade between normal and shear strains/stresses and material ductility. Int. J. Fatigue 2020, 135, 105468. [Google Scholar] [CrossRef]
  30. Fatemi, A.; Shamsaei, N. Multiaxial fatigue: An overview and some approximation models for life estimation. Int. J. Fatigue 2011, 33, 948–958. [Google Scholar] [CrossRef]
  31. DNVGL-RP-C203; Fatigue Design of Offshore Steel Structures. Det Norske Veritas: Olso, Norway, 2019.
  32. Fatemi, A.; Socie, D.F. A critical plane approach to multiaxial fatigue damage including out-of-phase loading. Fatigue Fract. Eng. Mater. Struct. 1988, 11, 149–165. [Google Scholar] [CrossRef]
  33. Smith, K.N.; Watson, P.; Topper, T.H. A stress-strain parameter for the fatigue of metals. J. Mater. 1970, 5, 767–778. [Google Scholar]
  34. Wang, C.H.; Brown, M.W. Life prediction techniques for variable amplitude multiaxial fatigue—Part 1: Theories. J. Eng. Mater. Technol. 1996, 118, 367–370. [Google Scholar] [CrossRef]
  35. Radhakrishnan, V.M. On bilinearity of Manson-Coffin low-cycle-fatigue relationship. NASA Tech. Memo. 1992, 105840, 11.c. [Google Scholar] [CrossRef]
  36. Gough, H.J.; Pollard, H.V. The strength of metals under combined alternating stresses. Proc. Inst. Mech. Eng. 1935, 131, 3–103. [Google Scholar] [CrossRef]
  37. Findley, W.N. A theory for the effect of mean stress on fatigue of metals under combined torsion and axial load or bending. J. Eng. Ind. 1959, 81, 301–305. [Google Scholar] [CrossRef]
  38. Susmel, L.; Lazzarin, P. A bi-parametric Wöhler curve for high cycle multiaxial fatigue assessment. Fatigue Fract. Eng. Mater. Struct. 2002, 25, 63–78. [Google Scholar] [CrossRef]
  39. Bibbo, N.D.; Baumgartner, J.; Arora, V. Comparative study of critical plane fatigue criteria on multiaxial variable amplitude loaded welded test specimens. Int. J. Fatigue 2022, 158, 106670. [Google Scholar] [CrossRef]
  40. Carpinteri, A.; Spagnoli, A.; Vantadori, S. Multiaxial fatigue life estimation in welded joints using the critical plane approach. Int. J. Fatigue 2009, 31, 188–196. [Google Scholar] [CrossRef]
  41. Vantadori, S.; Iturrioz, T.; Carpinteri, A.; Greco, F.; Ronchei, C. A novel procedure for damage evaluation of fillet-welded joints. Int. J. Fatigue 2020, 136, 105599. [Google Scholar] [CrossRef]
  42. Mei, J.; Dong, P. An equivalent stress parameter for multi-axial fatigue evaluation of welded components including non-proportional loading effects. Int. J. Fatigue 2017, 101, 297–311. [Google Scholar] [CrossRef]
  43. Dong, P.; Wei, Z.; Hong, J.K. A path-dependent cycle counting method for variable-amplitude multi-axial loading. Int. J. Fatigue 2010, 32, 720–734. [Google Scholar] [CrossRef]
  44. Wei, Z.; Dong, P. Multiaxial fatigue life assessment of welded structures. Eng. Fract. Mech. 2010, 77, 3011–3021. [Google Scholar] [CrossRef]
  45. Wei, Z.; Hamilton, J.; Yang, F.; Luo, L.; Lin, S.; Kang, H.; Dong, P. Comparison of Verity and Volvo Methods for Fatigue Life Assessment of Welded Structures. SAE Tech. Pap. 2013, 2013-01-2357. [Google Scholar] [CrossRef]
  46. Håndbok 185 Bruprosjektering, Versjon Oktober 2009. Statens Vegvesen Vegdirektoratet. Available online: https://vegvesen.brage.unit.no/vegvesen-xmlui/handle/11250/196364 (accessed on 14 January 2025).
Figure 1. Potential crack locations at rib–deck (RD) welded joints.
Civileng 06 00007 g001
Figure 2. (a) Nodal forces along the hypothetical crack plane. (b) Nodal forces along the weld line.
Civileng 06 00007 g002
Figure 3. Structural stresses acting on an inclined plane.
Civileng 06 00007 g003
Figure 4. Comparison of the experimental number of cycles to failure with calculated fatigue lives by (a) the nominal stress method, (b) the hot spot stress method, and (c) the effective notch stress method.
Civileng 06 00007 g004
Figure 5. (a) Abaqus finite element model; (b) submodel with highlighted potential crack mechanisms.
Civileng 06 00007 g005
Figure 6. Structural stress range for different mesh sizes for all crack types (specimen SA4-1).
Civileng 06 00007 g006
Figure 7. Structural stress range for different plane orientations for specimen GM8-4.
Civileng 06 00007 g007
Figure 8. (a) Equivalent structural stress ranges versus number of cycles to failure and (b) fatigue life prediction using the ESS method.
Civileng 06 00007 g008
Figure 9. Structural stress versus number of cycles to failure: Volvo method.
Civileng 06 00007 g009
Figure 10. Experimental fatigue life versus predicted life using the Volvo method: (a) no mean stress or thickness correction; (b) mean stress correction; (c) thickness correction; and (d) mean stress and thickness correction.
Civileng 06 00007 g010
Figure 11. Hardanger Bridge: girder cross-section and RD joints.
Civileng 06 00007 g011
Figure 13. Submodelling strategy.
Civileng 06 00007 g013
Figure 14. Position of the considered RD welded joints.
Civileng 06 00007 g014
Figure 15. (a) ESS for RD52 (Type I) and (b) corresponding stress history mapped in the σ x β σ z plane and (c) ESS for RD31 (Type III) and (d) corresponding stress history mapped in the σ x β σ z plane.
Civileng 06 00007 g015
Figure 16. Total damage for all crack types estimated from the hot spot stress, critical plane, and PDMR methods.
Civileng 06 00007 g016
Table 1. Parameters for Master S-N curve—for steel [17].
Statistical BasisCh
Mean curve19,930.20.31950
Upper 68% prediction interval (mean + 1 standard deviation)23,885.8
Lower 68% prediction interval (mean − 1 standard deviation)16,629.7
Upper 95% prediction interval (mean + 2 standard deviation)28,626.5
Lower 95% prediction interval (mean − 2 standard deviation)13,875.7
Table 2. Boundary conditions of the local Abaqus model: spring stiffness.
Axial Stiffness [MN/m]Transverse Stiffness [MN/m]Vertical Stiffness [MN/m]Torsional Stiffness [MN.m/rad]Bending Stiffness–Vertical Axis [MN.m/rad]Bending Stiffness–Horizontal Axis [MN.m/rad]
95.43.691.4744728,4007705
Disclaimer/Publisher’s Note: The statements, opinions and data contained in all publications are solely those of the individual author(s) and contributor(s) and not of MDPI and/or the editor(s). MDPI and/or the editor(s) disclaim responsibility for any injury to people or property resulting from any ideas, methods, instructions or products referred to in the content.

