Article

A Quantitative Approach to Evaluating Multi-Event Resilience in Oil Pipeline Incidents

by
Labiba N. Asha
1,
Nita Yodo
2,* and
Ying Huang
2
1
Department of Industrial Engineering, University of Arkansas, Fayetteville, AR 72701, USA
2
Department of Civil, Construction, and Environmental Engineering, North Dakota State University, Fargo, ND 58102, USA
*
Author to whom correspondence should be addressed.
CivilEng 2025, 6(1), 1; https://doi.org/10.3390/civileng6010001
Submission received: 16 October 2024 / Revised: 11 December 2024 / Accepted: 24 December 2024 / Published: 28 December 2024
(This article belongs to the Collection Recent Advances and Development in Civil Engineering)

Abstract

:
This study introduces a quantitative approach to evaluating the resilience of oil pipeline systems against various natural and physical disruptions. Resilience is increasingly essential in critical infrastructure to ensure continuous operations and minimize disruption impacts. However, existing quantitative methods often need specific time-dependent data, making measuring resilience in pipeline infrastructure challenging. To address this gap, this paper proposed a comprehensive framework by integrating the existing incident database with key features of assessing failure probabilities based on historical events and developing multi-event resilience indicators based on system performance under various disruptions. The methodology employs event tree analysis to quantify the probabilities of multiple failure scenarios and their impact on pipeline operations and recovery efforts. The practical application of the proposed approach was demonstrated using real-world oil pipeline incident data from across the United States, covering the period from 2010 to 2022. The focus was on multiple event scenarios involving pipeline disruptions, followed by shutdowns, examining how these events collectively impact pipeline resilience. The results indicate that corrosion failure, equipment failure, and natural hazard damage significantly impact oil pipeline resilience. Corrosion and equipment failures affect resilience primarily due to their frequency, while natural hazard damage, despite its lower occurrence rate, is more unpredictable and often requires more frequent shutdowns. Understanding these failure causes and their impacts is essential for enhancing the resilience and sustainable operation of oil pipeline systems.

1. Introduction

Oil pipelines play a pivotal role in the global energy infrastructure, serving as essential channels facilitating efficient and reliable transportation of crude oil from production sites to refineries [1]. According to the U.S. Energy Information Administration, oil (40%) and natural gas (25%) together constitute 65% of the nation’s total energy consumption [2]. Consequently, the energy distribution infrastructure in the United States comprises an extensive network of pipelines spanning more than 2.5 million miles [2]. A meticulously managed and well-protected pipeline network guarantees an uninterrupted flow of energy resources, mitigating the potential for supply disruptions, which is crucial for pipeline infrastructure [3].
Despite their importance, pipelines are vulnerable to numerous risks, including natural disasters, human-made hazards, and operational failures. The magnitude of these risks is underscored by significant incidents, as detailed in Refs. [4,5,6,7], which highlight catastrophic explosions and hazardous toxic releases with severe economic and environmental repercussions. Analyzing historical incidents allows for understanding the fundamental causes, enabling the development of effective prevention, mitigation, and resilience strategies for future challenges [8]. This underscores the necessity of a quantitative approach to evaluating resilience in oil pipeline incidents.
Examining historical incidents is essential for enhancing the resilience of oil pipeline systems, as it provides valuable insights into past failures and their underlying causes. Girgin and Krausmann [8] emphasized the importance of historical incident data in analyzing disruptions caused by natural hazards in onshore hazardous liquid pipelines. By studying past events, they could identify triggers, failure mechanisms, and occurrence patterns, which provided valuable insights into preparing more effective preventive and mitigation measures. Similarly, Sovacool [6] conducted an extensive review of significant energy-related accidents between 1907 and 2007, offering an in-depth look at the societal and economic impacts of these accidents. His work revealed the frequency, severity, and recurring themes of fatalities, property damage, and other consequences, highlighting the critical need for safety improvements based on historical data.
Further analysis by Biezma et al. [3] of the ten deadliest oil and pipeline accidents identified key factors contributing to these events, offering insights to improve safety protocols and drive technological advancements in the oil and gas pipeline transportation network. Ramírez-Camacho et al. [9] conducted a retrospective study of 1063 onshore pipeline accidents, underscoring the risks associated with accidental releases and their severe consequences for people, equipment, and the environment. Similarly, Restrepo et al. [10] used regression modeling to investigate the causes and financial impacts of accidents in U.S. hazardous liquid pipelines, providing guidance for industry leaders to enhance risk management strategies and resource allocation. Siler-Evans et al. [11] analyzed trends in U.S. natural gas and hazardous liquid pipeline accidents, revealing a decline in fatalities and injuries but an increase in property damage over time.
While resilience assessment methodologies abound, a significant gap persists in achieving a robust, quantitative understanding of how multiple events following a disruption affect resilience in oil pipelines or other critical infrastructure in general [12]. Depending on the infrastructure, what is determined as resilience property and system performance can vary, leading to numerous ways to quantify resilience [13]. Traditional approaches often rely on qualitative assessments from several stages or resilience properties. Additionally, the complexity of various time-dependent or stage-dependent resilience scenarios highlights the challenges of adopting a comprehensive one-size-fits-all resilience metric to effectively quantify multi-event resilience. Existing resilience quantitative methods often face challenges due to their dependency on specific datasets, which may be difficult to acquire, impeding universally approved resilience assessments. Therefore, this study addresses this gap by proposing a comprehensive multi-event [14,15] quantitative framework to systematically measure and analyze resilience in oil pipeline incidents by integrating historical incident data with advanced analytical techniques.

2. Literature Review

Over the years, numerous researchers and practitioners have significantly advanced this field. Many academic studies have examined different approaches to assessing the quantitative risk analysis pipeline infrastructure to identify root causes and better prevention methods. For instance, Han and Weng [16] introduced a comprehensive quantitative risk assessment approach within pipeline networks, incorporating probabilistic accident assessment, consequence analysis, and risk evaluation. Lawson [17] compared probabilistic and deterministic approaches to pipeline corrosion risk assessment, highlighting the advantages of probabilistic methods in managing uncertainties. Li et al. [18] introduced a risk-based accident model utilizing Bayesian networks for quantitative risk analysis of submarine pipeline leakage, enhancing accuracy by addressing uncertainties and dependencies. GIS-based models and the HAZUS methodology have been applied to assess seismic risks for pipelines, highlighting significant damage probabilities, ignition risks, and variations in vulnerabilities under earthquake scenarios [19,20,21]. Asha et al. [22] further contributed by quantifying the sustainability risks associated with oil pipeline incidents. Their findings indicated that corrosion and equipment failure present the greatest threats, resulting in significant social, economic, and environmental consequences.
Advancements in pipeline research have addressed both risk assessment and the need for effective strategies to enhance resilience. While foundational risk analysis frameworks have greatly advanced our understanding of pipeline vulnerabilities, recent innovations have focused on improving the accuracy and efficiency of detecting and localizing these vulnerabilities in real time. Recognizing that early identification of damage is critical to reducing risks, researchers have developed advanced methods to address challenges in identifying damage under complex and noisy conditions. For example, entropy-based detection methods have significantly enhanced damage identification in buried pipelines, as demonstrated by Ceravolo et al. [23]. Similarly, kurtosis-based transfer functions have refined fault localization in complex pipeline systems, enabling more precise identification of vulnerabilities and supporting proactive pipeline management [24]. Recent advancements in structural health monitoring (SHM) have further enhanced real-time assessment of buried pipelines, improving safety, reliability, and leak detection to mitigate risks from both natural and man-made damages [25].
Besides the detection and localization advancements, resilience analysis has emerged as a critical area of focus to ensure that pipeline systems can not only withstand disruptions but also recover and adapt effectively. Resilience analysis considers not only the likelihood of failure but also the ability to recover and adapt after incidents [1]. Ma et al. [26] established a comprehensive framework for assessing and enhancing the resilience of oil pipeline networks when exposed to earthquakes. The model utilized Monte Carlo simulations to evaluate how different subsystems perform over time under various earthquake scenarios. Ahmadian et al. [27] introduced the concept of component criticality, which uses quantitative analysis to evaluate a network’s ability to adapt to disruptions by identifying critical components that could fail. Their work provided a decision-making tool to assess current resilience, prioritize improvement efforts, and evaluate the costs associated with resilience enhancements, all within specified budget constraints. Frameworks such as the one proposed by Argyroudis et al. [28] extended this approach by integrating multi-hazard resilience assessments that considered the nature, sequence, and impacts of various hazards such as earthquakes, landslides, and fires.
Despite these advances, resilience studies often fail to address the compounding effects of subsequent disruptive events, which may accelerate system failures and prolong recovery times. Rehak et al. [29] introduced the Comprehensive Infrastructure Ecosystem Resilience Analysis (CIERA) methodology, focusing on robustness, recovery, and adaptability to enhance critical infrastructure resilience. Sathurshan et al. [30] identified inconsistencies in resilience assessments and advocated for an integrated approach across disaster phases to guide investment decisions. To further address resilience challenges, Yazdi et al. [31] used a dynamic Bayesian network approach to assess subsea pipeline resilience, considering the system’s time-varying and interdependent stochastic conditions. Their probabilistic model allowed for a comprehensive resilience evaluation over time, offering practical solutions to the challenges posed by evolving conditions. Golara and Esmaeily [32] presented a quantitative framework for assessing the resilience of high-pressure natural gas networks, introducing a delivery importance index to evaluate how pipelines perform under natural and man-made hazards. Their framework can be adapted to other infrastructure systems such as power and water. Okoro et al. [33] presented a framework for quantifying the resilience of offshore pipelines based on the system’s time-dependent reliability, adaptability, and maintainability.
Quantifying the resilience of pipelines, including their inspections and maintenance strategies, is essential [34]. This approach, inspired by practices in other industries, such as transportation and utilities, plays a critical role in ensuring that pipelines can withstand and recover from disruptions. Regular inspections using advanced technologies, such as drones, sensors, and ultrasonic testing, help identify potential weaknesses, corrosion, or damage that could compromise the system’s integrity [35]. Additionally, detection and severity evaluation using machine learning algorithms are becoming increasingly important in enhancing the accuracy and efficiency of pipeline monitoring [36]. These technologies leverage deep learning algorithms to analyze inspection data, such as imagery and sensor readings, to detect subtle patterns indicative of potential failures [37]. By assessing the severity of detected issues, these methods allow for prioritizing maintenance efforts, improving decision-making, and reducing downtime. Maintenance, including proactive repairs and replacing degraded components, is integrated into resilience models to predict failure probabilities and assess recovery time [38]. These practices help develop more accurate risk assessments and enhance the overall reliability and resilience of pipeline systems against environmental and operational challenges.
Although there have been advances in improving oil pipelines or general critical infrastructures’ resilience [39], additional negative events occurring after a disruption can still significantly impact a system’s overall resilience. These events often exhibit compounding impacts, increase stress on pipeline systems, strain resources, and may lead to more severe failures and longer recovery times. However, the effects of these multiple subsequent events are rarely addressed in the existing literature. Following the disruption, the operational state of the pipeline may necessitate a shutdown before recovery efforts can be implemented. Considering these subsequent events creates a multi-event resilience scenario that often cannot be adequately captured by a single resilience metric. Therefore, this study contributes a quantitative method to evaluate the multi-event resilience of oil pipeline systems using resilience indicators that consider various subsequent events. The framework provides a practical approach for assessing how pipeline systems can withstand and recover from disruptions by integrating the probability of pipeline disruptions, the possibility of shutdowns warranted, and the relative recovery duration for each failure cause.
The proposed approach aims to enhance theoretical understanding of how multiple events shape pipeline resilience scenarios. By applying this framework to real-world oil pipeline incidents across the United States from 2010 to 2022, this study demonstrates the applicability of the proposed methodology to real-world oil pipeline incident scenarios. The practical implementation of the proposed framework demonstrates how it can be readily integrated into existing pipeline incident reporting systems. This comprehensive framework provides stakeholders with important insights to improve infrastructure resilience and enhance the overall sustainability of pipeline operations by focusing on the intermediate events that occur after a disruption.
Additionally, the proposed multi-event resilience framework provides a scalable foundation for larger datasets and more complex scenarios. It can also be adapted for other critical infrastructure sectors facing similar challenges in quantifying resilience. However, caution is needed when transferring a resilience framework designed for one type of infrastructure, such as the proposed pipeline system, to another critical infrastructure, such as road networks. While resilience principles are widely applicable across different infrastructure systems, each sector has unique characteristics that can challenge the direct application of a given framework. For example, in road network applications, disruptions affect not only the road network components but also the buildings and urban areas connected to them [40]. Such disruptions can have cascading effects on both individual components and the overall network [38]. To overcome these challenges, Maino et al. proposed a framework to reduce functionality loss in road networks during disasters, improving resilience, and speeding recovery [40]. Afrin et al. proposed a data-driven framework leveraging machine learning and spatiotemporal data to enhance predictive resilience by addressing traffic uncertainty and forecasting road conditions [41]. Adapting the proposed framework to other critical infrastructure systems may require addressing unique challenges, such as geographical locations and cascading effects on interconnected urban systems.

3. Methodology

The proposed methodology establishes a robust framework to quantify multi-event resilience in oil pipeline systems, leveraging existing incident reporting and database infrastructure, as depicted in Figure 1.
Data processing begins with these databases to identify the causes of failures, their frequency, and the resulting consequences. This involves a detailed evaluation of how these causes impact overall system performance. Once causes and consequences are determined, the framework proceeds to assess the sequence of intermediate events following a disruption with event tree analysis, resulting in multiple failure consequence scenarios as the outcomes. Further, the resilience indicator is developed based on the probability of multi-event failure and the respective recovery time, calculated from reported shutdown or downtime periods. The methodology focuses on assessing the resilience of each identified cause. This assessment evaluates the system’s ability to absorb shocks and adapt to natural and physical disruptions. By analyzing the resilience of individual causes, operators can gain insight into the pipeline system’s overall capacity to recover and maintain functionality during and after unexpected incidents. Finally, the methodology interprets the results of resilience assessments to provide a clear understanding of how identified intermediate events after a disruption affect the overall resilience of the oil pipeline system.

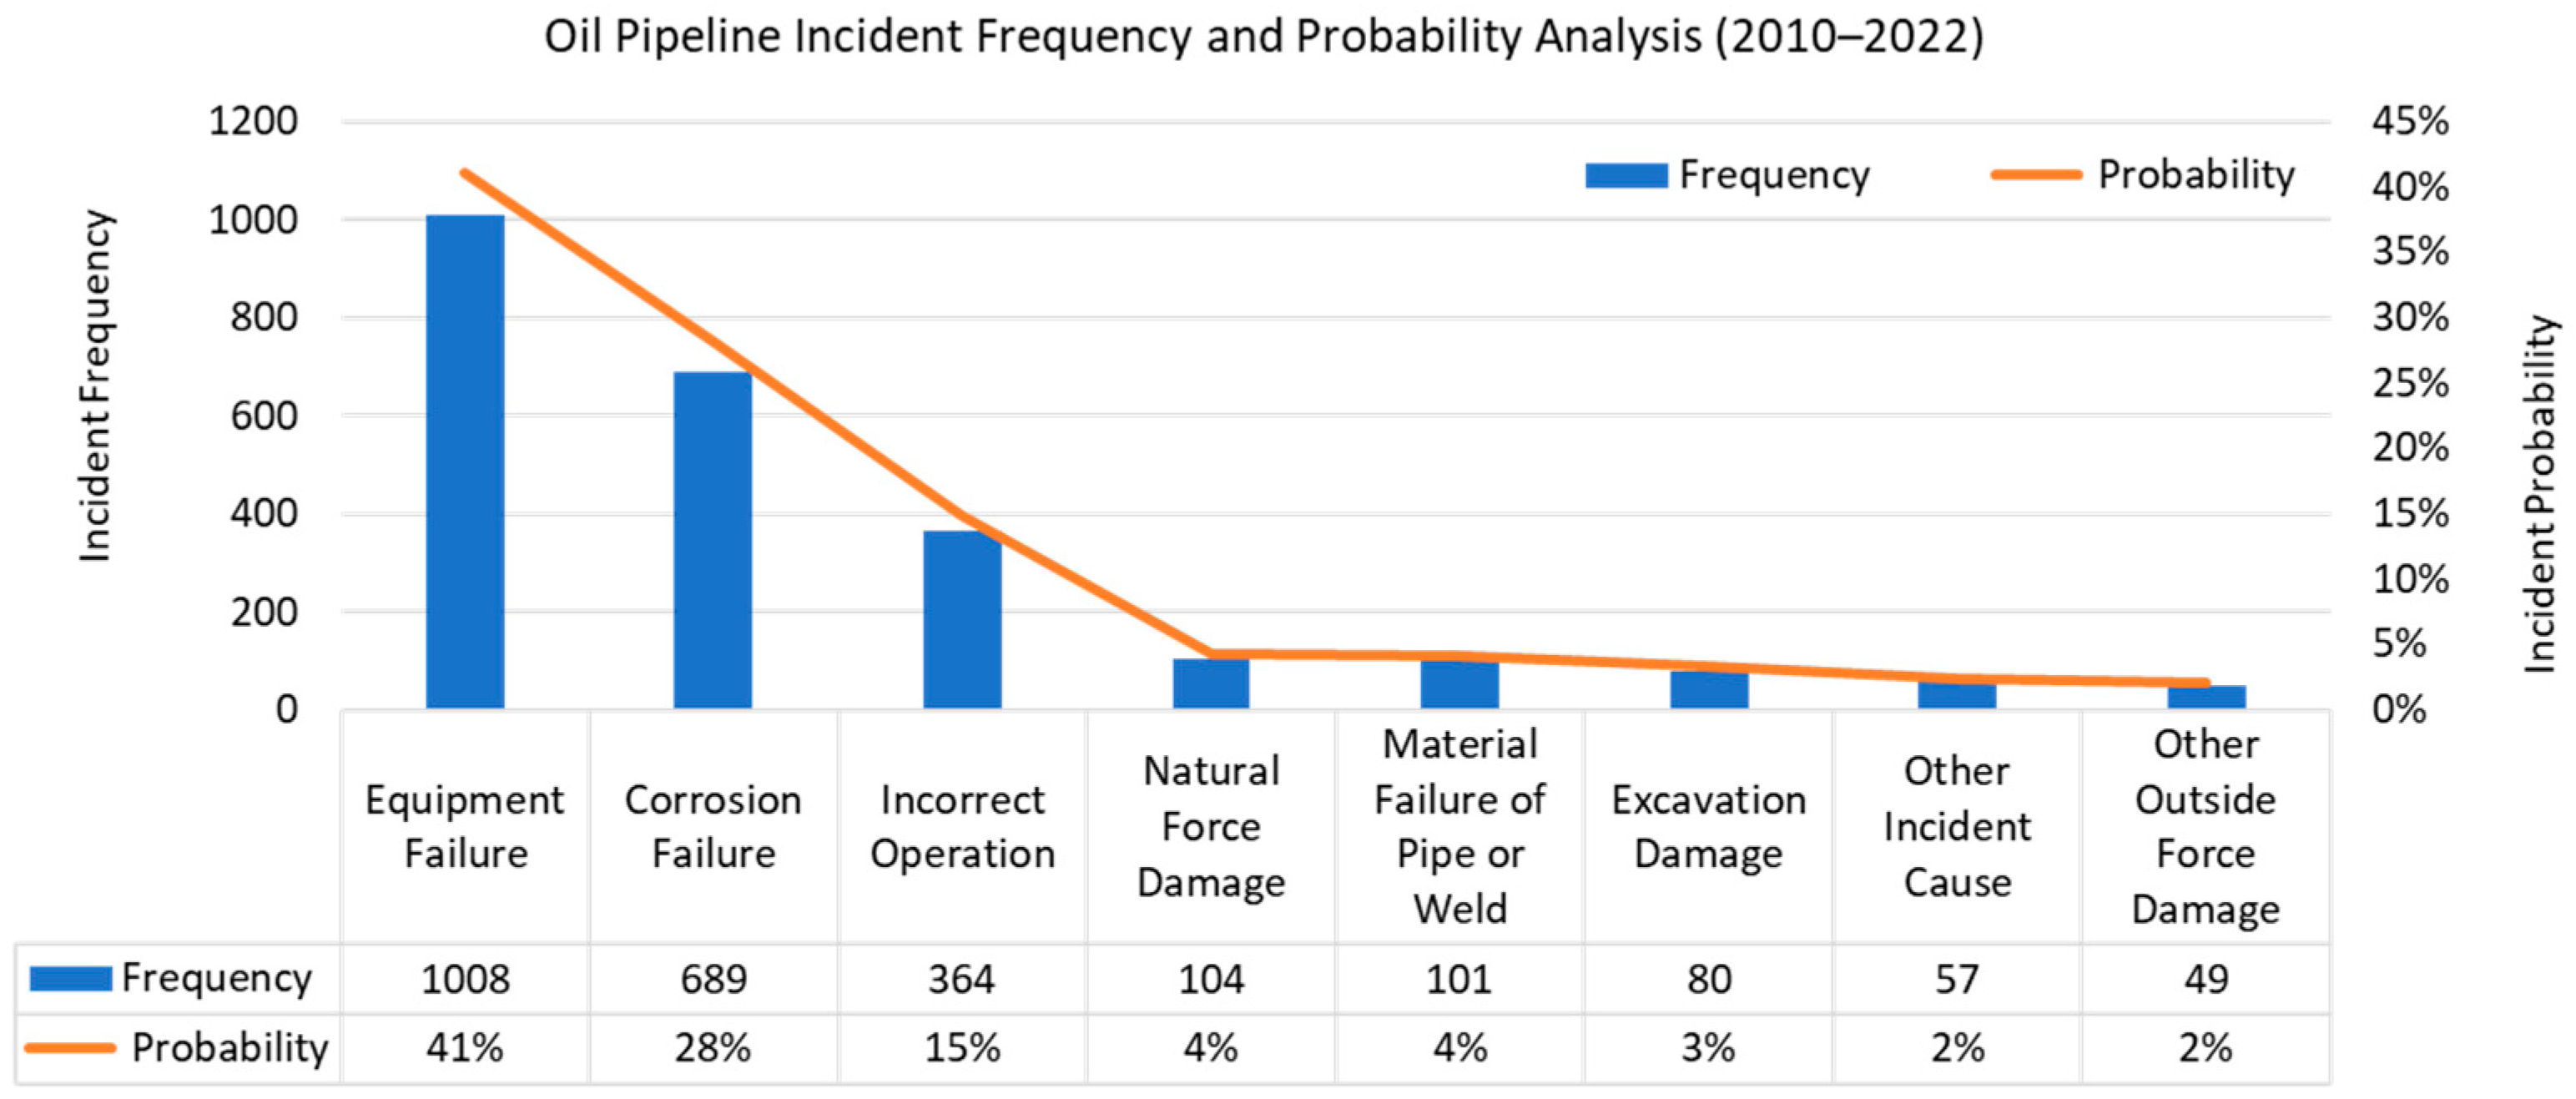
3.1. Failure Cause Identification

3.1.1. PHMSA Failure Category

The Pipeline and Hazardous Material Safety Administration (PHMSA) is responsible for safely transporting hazardous materials, including pipelines, to transport oil, gas, and other potentially dangerous substances. The data are sourced from the PHMSA incident database, which provides a historical trend assessment of pipeline incidents from 2010 to 2022 [42]. In Table 1, PHMSA categorizes eight causes of failure in oil pipeline infrastructure incident reporting. Since one objective of the proposed framework is to ensure easy integration with existing infrastructure, the same failure category label was used in the case study.

3.1.2. Pipeline Incident

Having identified the various causes of oil pipeline incidents, it is essential to have concrete information on how often these incidents occur and the likelihood of their recurrence. Understanding the frequency of specific failure causes allows for a better assessment of their impact on system operability and resilience. By analyzing historical incident data and trends, the likelihood of pipeline incident occurrences can be evaluated as follows [22].
P I i = n i N × 100 %
where P I i is the probability or likelihood of pipeline incidents due to failure cause i , n i is the total number of pipeline incidents caused by failure cause i, and N is the cumulative count of oil pipeline incidents that occurred within a specific time period regardless of the failure cause.
From the incident-based point of view, frequency, and probability have similar but distinct meanings. Frequency refers to the number of occurrences of an event within a dataset or over a time period. It is absolute and does not account for all of the total possible outcomes. Probability represents the likelihood of an event occurring, expressed as a fraction or percentage of the total possible outcomes [43]. It is always normalized, ranging from 0 to 1 (0% to 100% when expressed as a percentage). In this context, frequency is often used to estimate the incident probability by dividing the observed frequency of an incident by the total number of observations [44,45].
After data cleaning and processing the incident data, 2452 reported scenarios were studied; the pipeline disruption frequency and likelihood for each failure category leading to an oil pipeline incident are presented in Figure 2. The failure categories are sorted from the most frequent to the least frequent based on the frequency and probability of occurrence analysis from 2010 to 2022. The top three leading causes of oil pipeline incidents were equipment failure, corrosion failure, and incorrect operation, with a probability of 41%, 28%, and 15% chance, respectively. The probability of 41% pipeline incidents caused by equipment failure was obtained by applying Equation (1), where the frequency for pipeline incidents caused by equipment failure was found to be 1008 occasions out of the 2452 reported events considered in this study. Since probability is based on incident frequency, both can show similar trends when plotted, especially in scenarios where more significant frequencies correlate with higher probabilities. Therefore, in this incident-based approach, frequency is raw data based on actual occurrences, while probability offers a normalized measure of the likelihood of an event, which can help make predictions and compare different outcomes.

3.2. Multi-Event Incident Sequence Assessment

Having established the failure frequency and likelihood of various causes leading to oil pipeline incidents, assessing the consequences of multiple intermediate events related to different failure scenarios is essential. For this purpose, event tree analysis was performed to evaluate potential outcomes following an initiating failure event systematically [26]. The approach taken to construct an event tree was as follows: (1) identify initiating events that consider the eight oil pipeline failure causes previously discussed, (2) determine the sequence of events following a failure by going through the operational documents and emergency management protocols, and (3) construct a tree-like graphical representation, as shown in Figure 3, starting with initiating events and the branches indicating the probable subsequent events and outcomes. The decision criteria for including specific events in the event tree analysis were based on their relevance to pipeline resilience, operational impact, and the availability of historical incident data from the PHMSA database (2010–2022). Events with high frequency, significant consequences, and the potential to disrupt operations were prioritized to ensure the analysis captures critical failure pathways and real-world conditions effectively.
From an operational perspective concerning the pipeline operation condition of time X(t), Figure 3 presents an event tree analysis highlighting four primary patterns of potential failure consequences following oil pipeline incidents. The normal pipeline operation condition X(t) is shown as a solid straight line, indicating the desired operational performance without any disturbances. The initiating event (IE) refers to a failure cause that can disrupt the performance of the oil pipeline (Event 1), potentially resulting in oil leakage as a commodity loss. This compromised performance over time is denoted as a dashed line of X(t). Often, when pipeline performance is disrupted, Event 2 of a shutdown (SH) may be necessary to address the issue or to prevent potentially catastrophic consequences, leading to an outcome of the failure consequences outlined in Scenario 1.
If the initiating event and pipeline disruption are not severe enough, a shutdown may not be required (Scenario 2). This is because minor disruptions can often be managed through adjustments in pressure, flow rates, or temporary pipeline rerouting [46]. Additionally, operational protocols for emergency and safety systems are designed to handle certain levels of anomalies without necessitating a complete shutdown [47]. Thus, for this scenario, the pipeline can be considered resilient. Figure 4 shows the independent distribution of subsequent Event 1 and Event 2 after initial analysis for the 2010–2022 oil pipeline incident study period categorized based on the failure cause as the initiating event. Event 1 represents pipeline disruptions, while Event 2 indicates whether a pipeline shutdown occurred following the disruptions. Although there may be compromised performance following an initiating event, not all scenarios warrant a shutdown. For example, in cases of equipment failure, approximately 850 out of more than 1000 reported incidents indicated compromised performance, yet only about 450 of these incidents necessitated an operational shutdown. This difference highlights how certain failures can often be managed through temporary fixes or monitoring without requiring a full shutdown. In the no-shutdown-required scenario, operators may be able to implement temporary fixes or monitoring strategies to manage the compromised performance situation without the need to halt pipeline operations [47]. On the other hand, for initiating events such as corrosion failure or material failure of pipes, shutdowns are far more common due to the higher risk of escalation. Scenarios where no shutdown is required are more frequent than those that necessitate a shutdown and are also observed for pipeline failures caused by incorrect operations, natural hazard damage, and other incident causes.
Figure 5 shows the total scenario count distribution based on various initiating failure categories. The event tree analysis revealed that regardless of the initiating failure event, Scenario 1 or Scenario 2 occurred most frequently, indicating that most initiating failure events ultimately led to pipeline operation disruptions. For most failure causes, such as corrosion failure, material failure of pipe or weld, and excavation damage, Scenario 1 was found to occur more often than Scenario 2. This suggests that these initiating events would most likely necessitate a pipeline shutdown to address or resolve the pipeline disruption issues. On the other hand, for equipment failure and incorrect operation, Scenario 2 was observed to occur more frequently than Scenario 1. This indicates that a pipeline shutdown was generally not necessary when addressing failures initiated by equipment issues or incorrect operation. In scenarios where performance remains unaffected following an initiating event that is not overly severe, a shutdown may still be required to prevent further damage or to comply with emergency protocols until the hazard has passed (Scenario 3). Lastly, the pipeline system is considered completely resilient (Scenario 4) if its performance remains unaffected following an initiating event. In this scenario, minor disturbances or operational anomalies do not compromise the pipeline’s operability, allowing it to continue operating normally without needing a shutdown or immediate intervention [13].

3.2.1. Multi-Event Probability

Following an initiating event and subsequent events, multiple failure consequences scenarios can arise as outcomes of a disruption in the pipeline. To quantify the compounded impacts of the disturbances in an event tree analysis, the probability of reaching a specific outcome is calculated by multiplying the probabilities along the path to that outcome, as expressed below:
P M E ( O u t c o m e ) = P I E   P E v e n t   1   P E v e n t   2 P ( E v e n t   j )
where PME is the probability of a specific outcome scenario following a multi-event path and P(IE) is the probability of initiating events occurring. In this application, P(IE) is regarded as the probability of an incident P I . P(Event j) is the probability of each subsequent event j occurring after the initial event, and j denotes the number of possible events. There are two subsequent events considered in this case, where P(Event 1 = Pipeline Disruption) and P(Event 2 = Pipeline Shutdown). The sum of the probability for each branch should equal 1. The details of the intermediate events can be scaled up, given appropriate data. This indicates that the event tree can be scaled to include additional events by multiplying the probabilities of each new event along the path. It helps to provide flexibility for more complex scenarios if additional data are available for the calculation. For the event tree analysis presented, the multi-event probability for each outcome scenario is as follows:
P M E ( S c e n a r i o   1 ) = P I E   P P D   P S H P M E S c e n a r i o   2 = P I E   P P D   ( 1 P S H ) P M E ( S c e n a r i o   3 ) = P I E   ( 1 P P D )   P S H P M E ( S c e n a r i o   4 ) = P I E   ( 1 P P D )   P ( 1 P S H )
where P(PD) is the probability of pipeline disruption (Event 1) identified by the possibility of oil leakage following a disruption, and P(SH) is the probability of pipeline shutdown (Event 2). The counterpart of the pipeline not disrupted is denoted as 1P(PD). Similarly, for the situation where pipeline shutdown is not required, the probability is expressed as 1P(SH). To calculate the total probability of all possible outcomes, the probabilities of each distinct path for Scenarios 1–4 are summed.

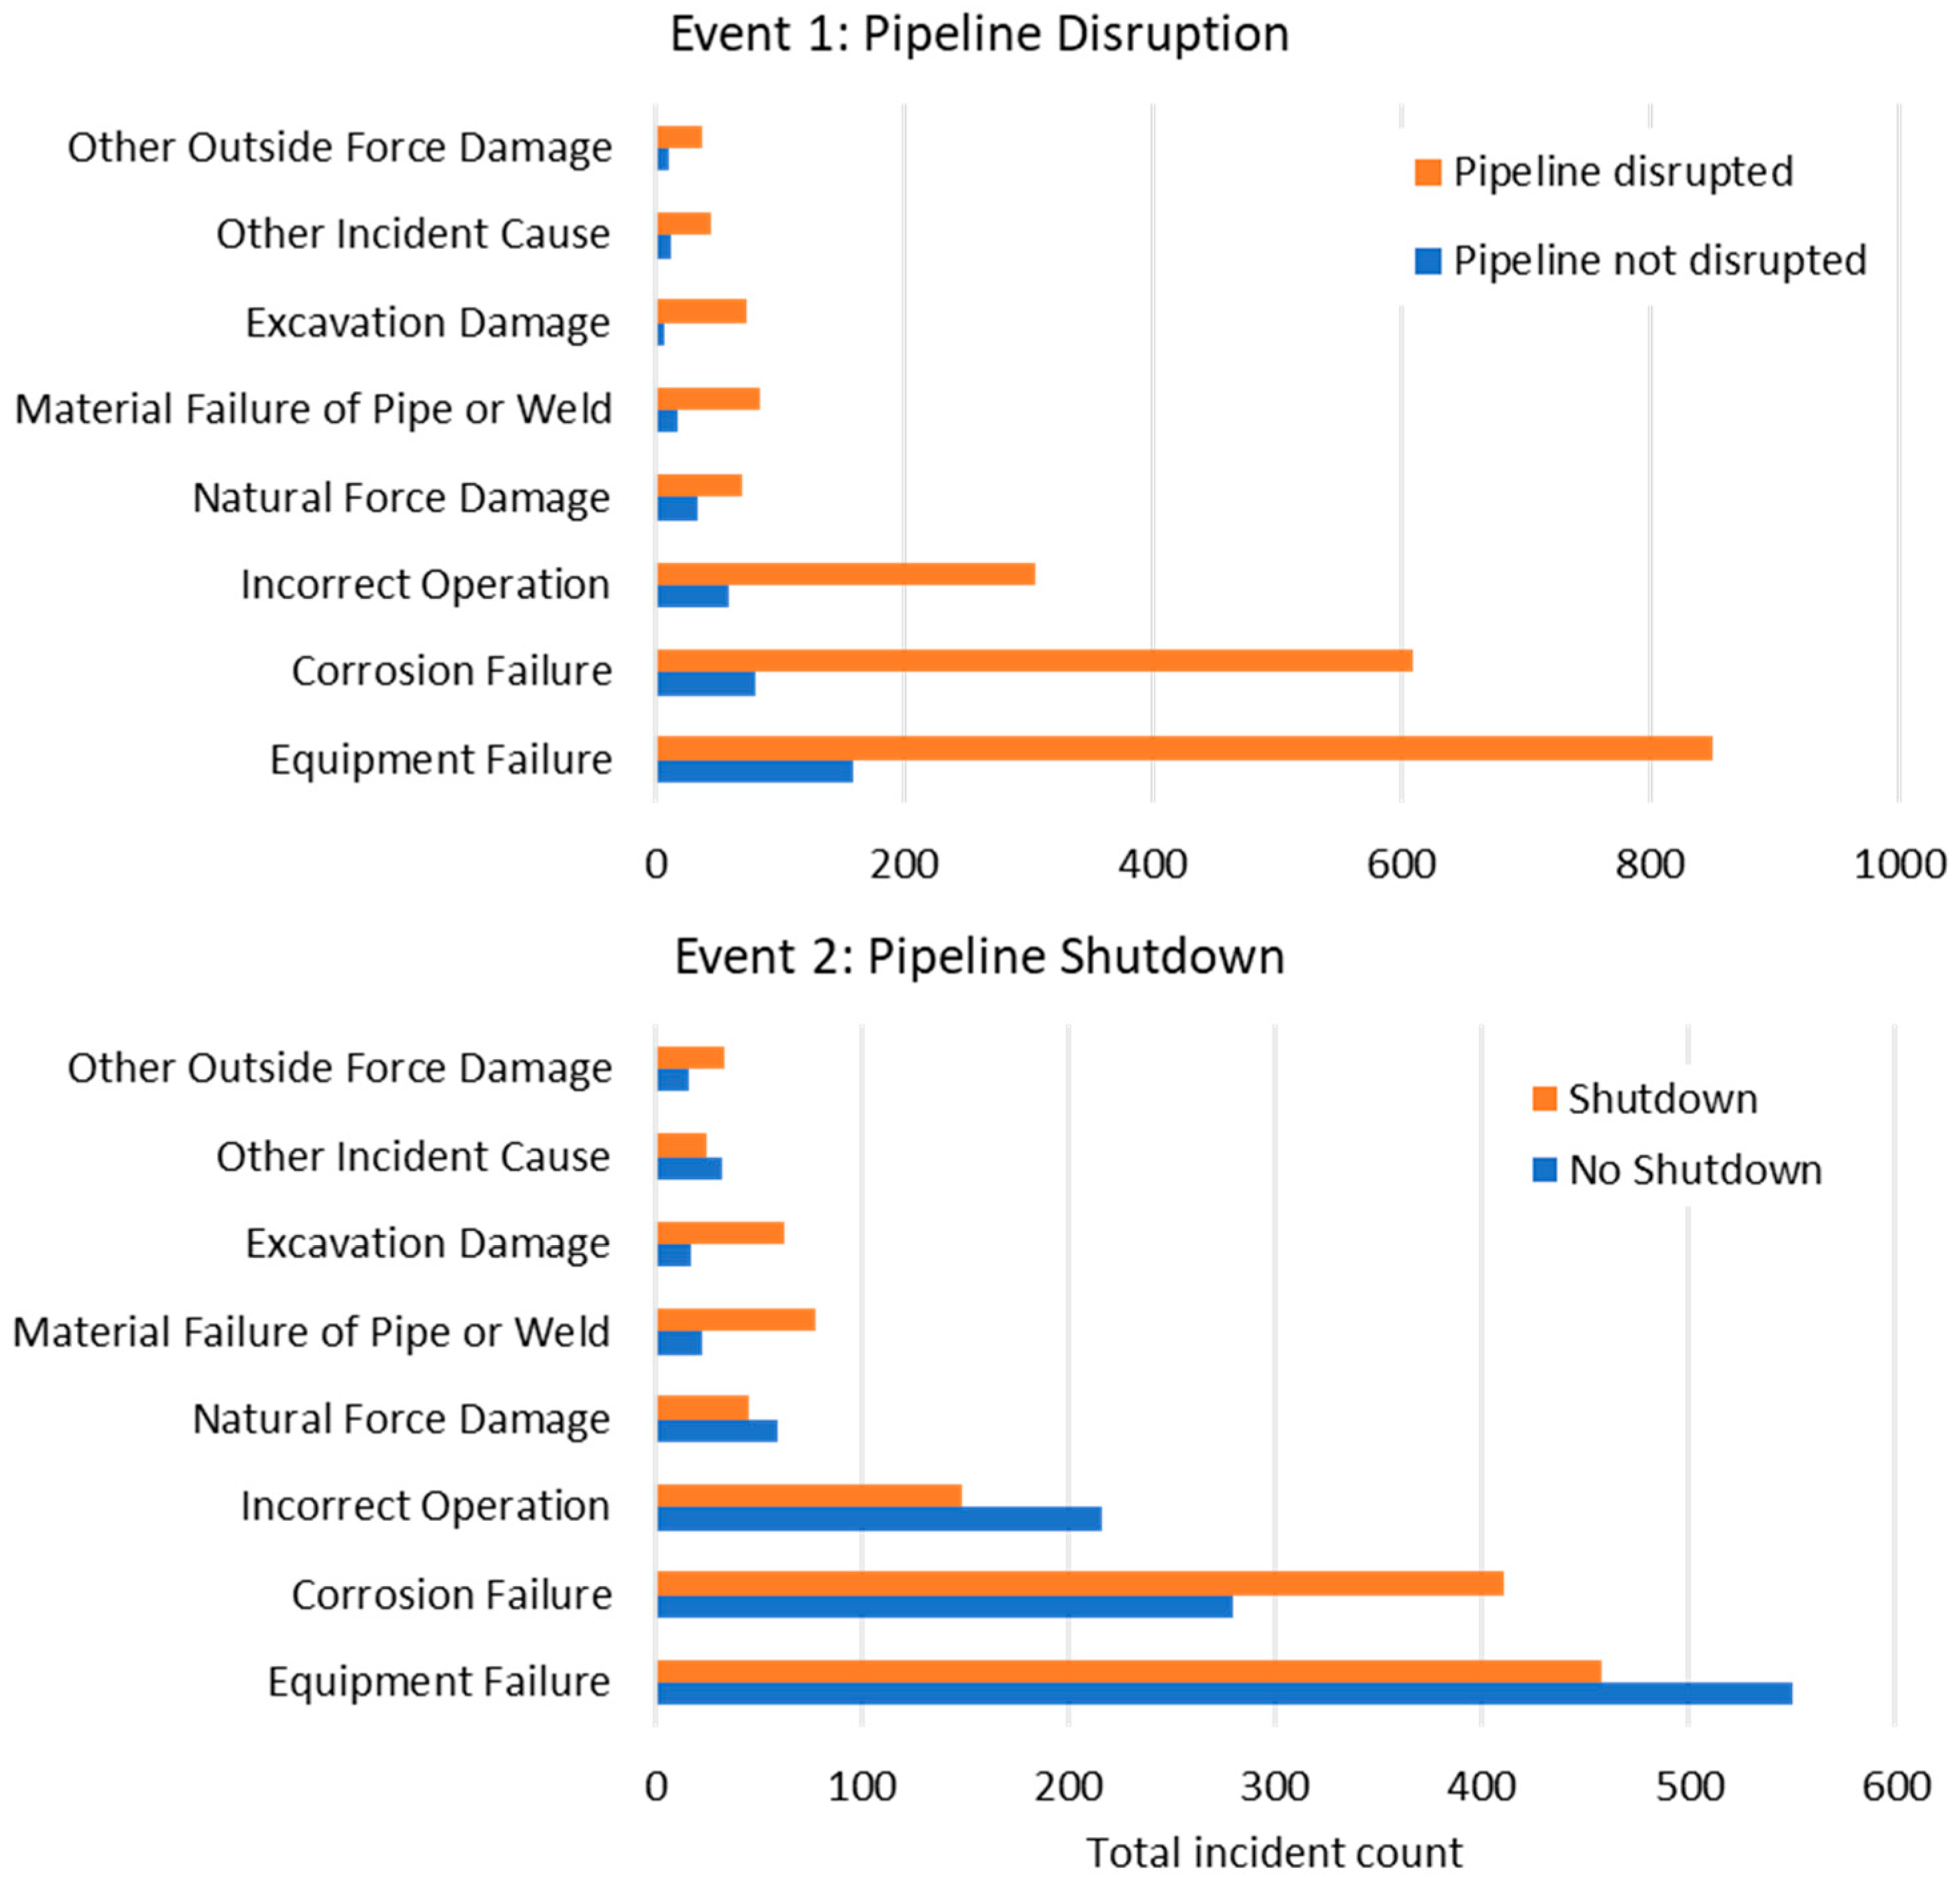
3.2.2. Probability of Pipeline Disruption

The probability of pipeline disruption, P(PD), refers to the likelihood of incidents that can interrupt the normal operation of a pipeline system. It is related to resilience in terms of how well a pipeline system can withstand operating normally following a disruption. Generally, a lower probability of pipeline disruption indicates that the pipeline system is more resilient toward disruptions. Oil pipeline disruption can be derived from pipeline operational indicators, such as leak quantity, pressure fluctuations, flow rate changes, or temperature variations [1]. Depending on the available data, these operational indicators (OI) can be incorporated based on their associated probabilities while quantifying the probability of pipeline disruption using the following equations:
P ( P D ) = 1 k = 1 l 1 w k P O I k
where P(PD) is the probability of pipeline disruptions, wk is the weighing factor for indicator k, P(OIk) is the probability of operational indicator k leading to a disruption, and l denotes how many indicators are considered. The equation above illustrates how various operational indicators can be combined to assess the probability of pipeline disruption using a weighted approach. In this method, the importance of each indicator is reflected by assigning different weight values to specific indicators. However, in this study, all indicators are considered equally important, so the weights wk are omitted.
To obtain the probability for individual indicator k, for example, the probability of leakage or commodity released in a pipeline incident, frequency analysis from historical data or event logs can be quantified as follows:
P ( L e a k a g e ) i = n L e a k a g e i N i
where P(Leakage)i is the probability of a commodity leaking due to failure cause i , n L e a k a g e i is the number of leakages observed due to failure cause i, and Ni is the total number of pipeline incidents within the specified period due to failure cause i. If the leakage event log is in categorical data (low, medium, high), numerical conversion or frequency analysis of each level can be utilized to obtain a probability value. If there are no historical data available, expert elicitation can be employed to estimate the indicator probabilities based on their experience [22].

3.2.3. Probability of Pipeline Shutdown

The probability of shutdown, P(SH), following an incident, refers to the likelihood that the pipeline operation will need to be fully shut down in response to a specific initiating event that leads to pipeline disruption; for example, Scenario 1 and Scenario 3, discussed in Figure 3. This measure indicates how often a shutdown may be warranted to maintain the safety and operational integrity of the pipeline, which could affect the pipeline’s resiliency. A higher probability of shutdown suggests that the pipeline system is more fragile or less capable of absorbing the disturbances imposed by a particular failure cause [48]. The number of shutdown incidents can quantify the probability of a shutdown over that period. From the historical incident data, the empirical probability of failure necessitating a shutdown occurring during a specific period can be calculated as follows:
P ( S H ) i = n S H i N i
where P ( S H ) i is the probability or likelihood of shutdown due to failure cause i , n S H i is the number of shutdowns due to failure cause i, and N is the total number of pipeline incidents within the specified period due to failure cause i. For repetitive pipeline failure incidents where time intervals or rates are more of a concern, the probability of shutdowns due to failure cause i can also be expressed in terms of the shutdown frequency or shutdowns per unit time. This approach relates to the probability of shutdown more in terms of the operational time frame.
If there are no historical shutdown incident data, the expected number of shutdowns due to failure cause i can be used in place of the number of showdowns ( n s i ). The expected total number of shutdowns E(SH) can be estimated from the probability of an incident (PI) and the pipeline operation condition that led to a shutdown (OCSH) for each failure cause i. The total expected number of shutdowns can be aggregated from all eight categories of failure causes.
E ( S H ) = i = 1 8 P I i O C S H i

3.3. Resilience Quantification

Although many other resilience quantification metrics and frameworks have been proposed for various applications and functionality [13], this paper approaches the resilience indicator using the concepts of the multi-event probability derived from pipeline disruption and shutdown and the expected recovery period to understand how well a system can withstand and recover from disruptions. The reason multi-event probability and resilience indicators were selected is that they reflect both the likelihood of disruptions and the system’s recovery ability. These metrics are considered to provide a more comprehensive assessment of pipeline resilience compared to single-event approaches.

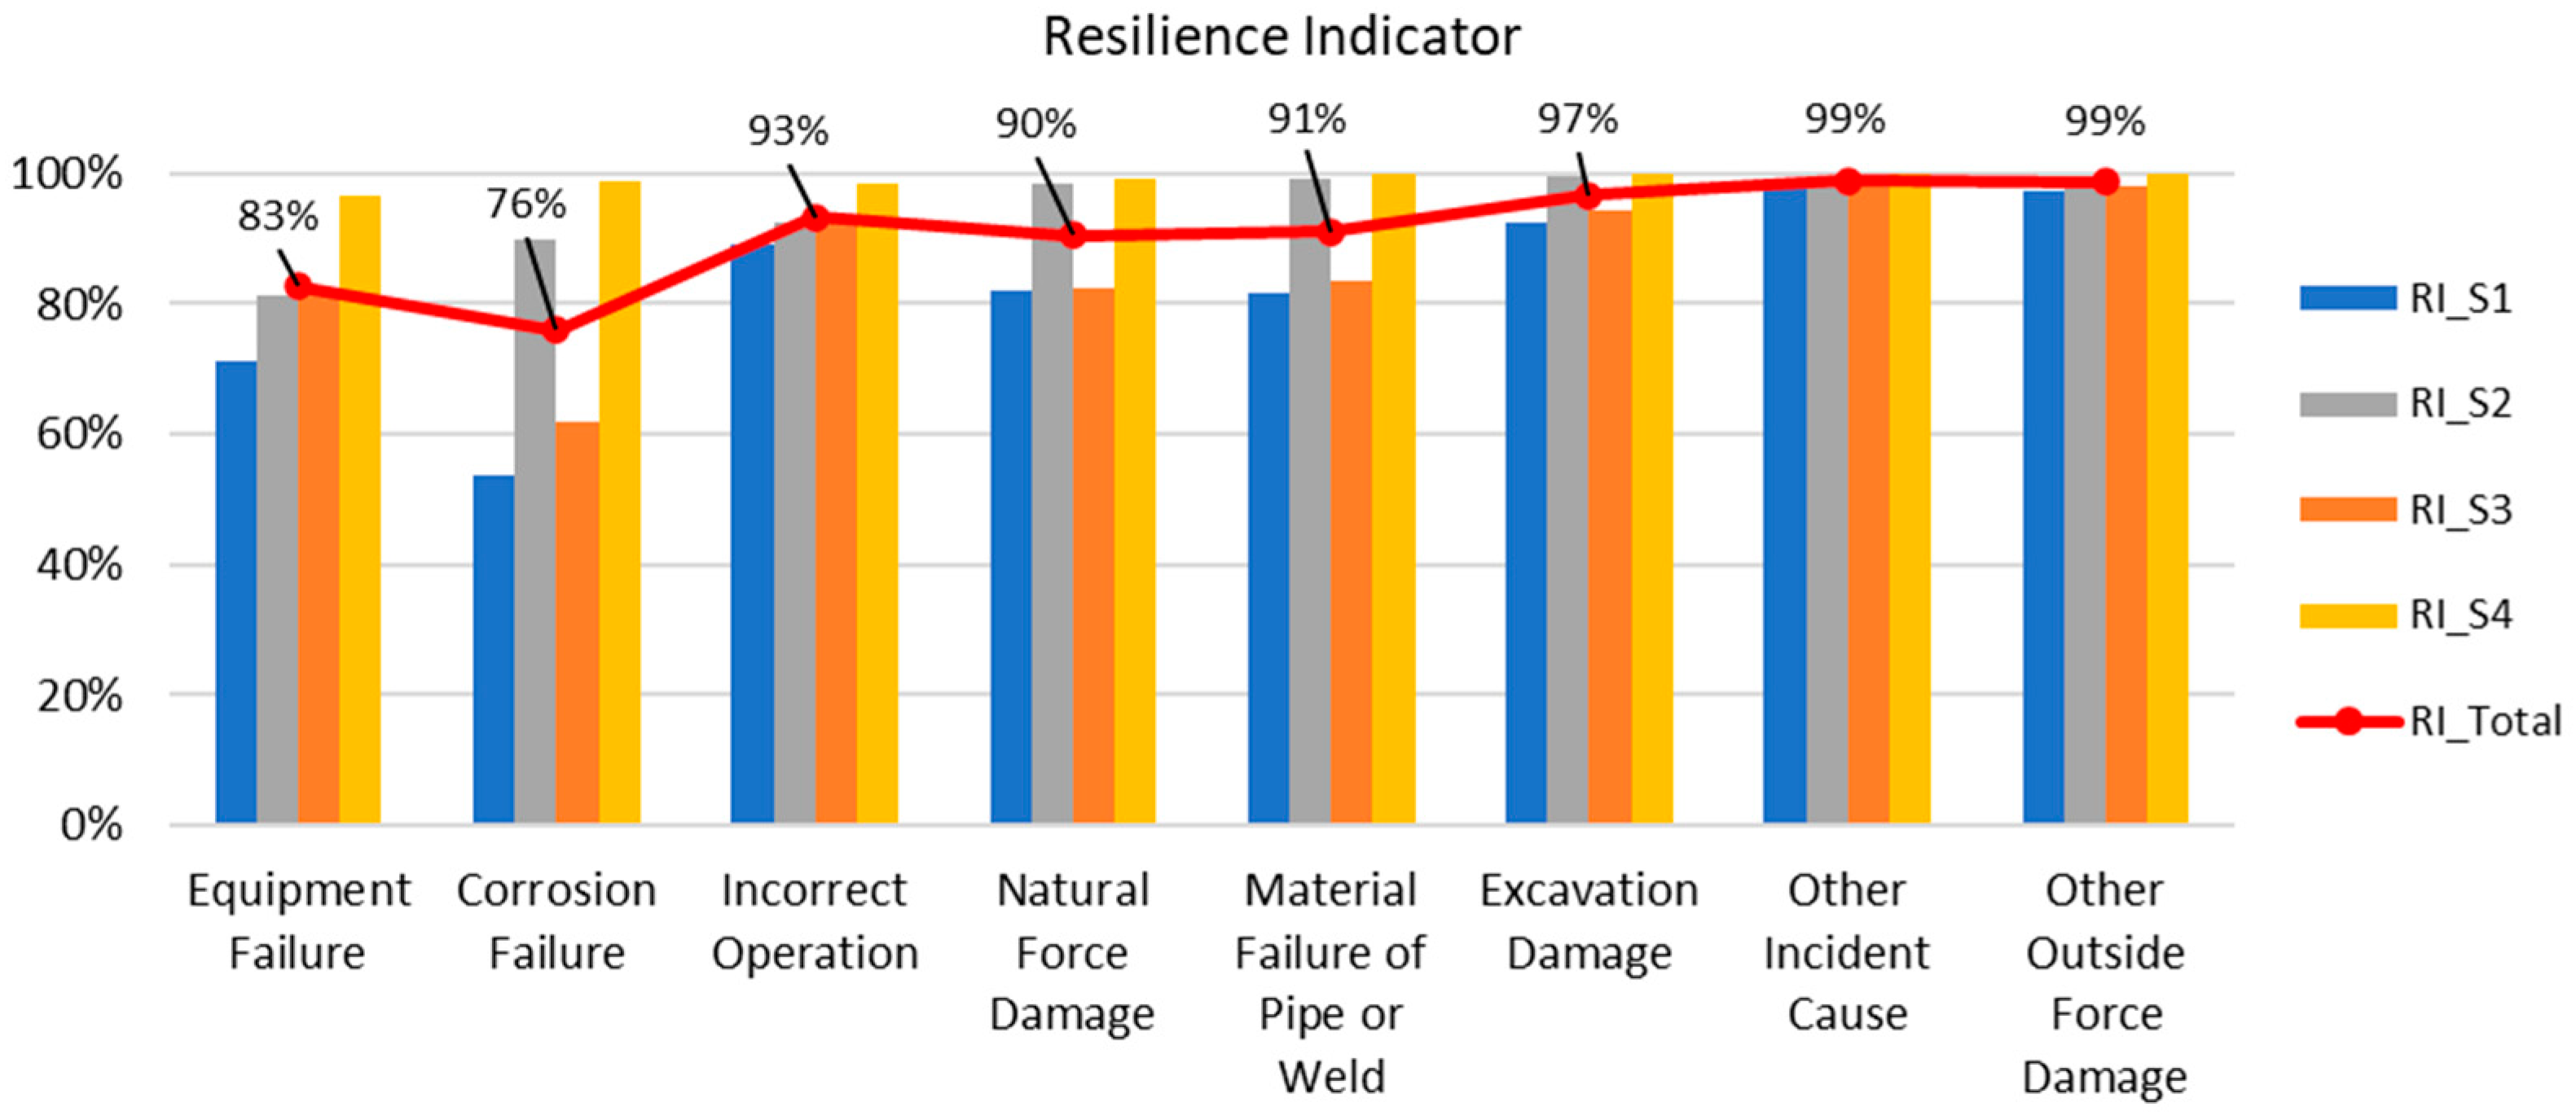
3.3.1. Resilience Indicator

The proposed resilience indicator in this paper is derived by integrating the probabilities of multiple events, PME, related to pipeline disruption and shutdown, along with the time required for recovery, RP. The resilience indicator due to failure cause i ( R I i ) provides a quantitative measure of the pipeline system’s adaptability and ability to recover following pipeline incidents or disruptions under the following conditions:
R I i = 1 P M E i R P i 1 P M E i i f   R P i 0 o t h e r w i s e
where R I i is the resilience indicator due to the cause i , P M E i is the probability of multi-event impacts due to the failure cause i , and R P i is the relative recovery period due to the cause i . If there is a recovery period after a shutdown is warranted, the recovery period is considered (Scenario 1 and Scenario 3). Otherwise, the resilience indicator is solely based on multi-event impact (Scenario 2 and Scenario 4). RI can take any values from 0 to 1, with 1 meaning the system is resilient, and 0 meaning the system is not resilient. To obtain the aggregate value of RI from all failure causes i, an average or weighted average value can be implemented [41]. This indicator offers a holistic view of historical incidents that have affected the pipeline system’s resilience, capturing its capacity to adapt, recover, and maintain functionality despite unexpected disruptions.
The first term in the equation represents the direct contribution of multi-event probability due to pipeline disruption and potential shutdown events. The probability of the frequency causing disruption and shutdown is explicitly determined due to the cause i . This probability reflects the likelihood of a failure event triggered by a specific cause, leading to various disruptions and shutdown situations within the pipeline network. If the probability of PME is high, it indicates a greater likelihood of disruption and shutdown impacting overall pipeline resilience.
The second term accounts for the scenario, indicating the probability of success due to the implementation of recovery efforts. For this, the relative recovery period R P i due to cause i is considered. This duration signifies the time it takes for the pipeline system to recover and resume normal operations following a shutdown warranted due to failure cause i. The relative recovery duration provides valuable insights into the pipeline’s ability to restore functionality after an incident. Additionally, when a shutdown is not warranted, the resilience of the pipeline is influenced only by the downtime period, and the second term, RPi, is discarded instead of being assigned a value of 0. This approach ensures that the analysis to quantify RI remains focused on scenarios where recovery actions were taken. If RPi is assigned a value of 0, this situation would mean that any disruption to the oil pipeline left unaddressed can lead to gradual performance degradation, ultimately resulting in a complete system shutdown or failure, where RI is also equal to 0 [48].

3.3.2. Recovery Period

In resilience assessment, recovery periods are critical in quantifying the level of resilience a system possesses. In this application, the recovery or restoration period refers to the duration it takes for a system to restore normal operations following an incident that necessitates a shutdown condition [49]. Generally, a system is claimed to be more resilient with a shorter recovery period, reflecting its ability to overcome disturbances quicker [48]. Various factors can influence the recovery efforts in an oil pipeline incident, which may eventually lead to a more extensive recovery period [47]. Some of these factors are the disruption severity, the disturbances imposed on the system, the shutdown period, the effectiveness of emergency response intervention, and the robustness of the inherent system [50]. Since the proposed approach is based on the existing infrastructure of incident reporting and available data, the recovery period required for failure cause i (RPi) can be calculated by assessing the relative duration of the pipeline shutdown and the restart date and time compared to the maximum allowable recovery time:
R P i = 1 t R E i t S H i T m a x
where the shutdown time (tSH) refers to the time of disruption to the pipeline operation, and the restart time (tRE) refers to the time when normal operations resume. Tmax is the maximum allowable recovery period.
The difference between shutdown and restart time calculates the maximum length of operation downtime that the oil pipeline experienced due to a specific failure cause i. Since the recovery period is based on time duration, it should be normalized to be dimensionless to reflect the expected recovery period. Hence, taking the ratio reflects how quickly the pipeline system can operate normally when recovery efforts are deemed successful. It is important to note that a longer duration indicates a worst-case scenario. Thus, the formula incorporates a 1-ratio adjustment to reflect this relationship. If no recovery effort is performed (Scenario 2 and Scenario 4), RPi is discarded rather than assigned a value of 0. This is because a value of 0 could misleadingly suggest that the pipeline system is either in a state of normal operation that does not require any recovery efforts or the system is in a state of complete failure that cannot be recovered, which would not accurately reflect the reality of the situation following a disruption.

4. Results and Discussion

The incident data were sourced from the PHMSA open-source database, which provides a historical overview of pipeline incidents over 20 years. However, only detailed information on pipeline incidents across all U.S. states from 2010 to 2022 was used in this study. This dataset includes all the essential elements needed to identify the resilience indicators related to each cause of the incident. In the following sub-sections, the results derived from analyzing this dataset will be discussed in detail.

4.1. Multi-Event Analysis

An event tree was employed to evaluate the incident sequence and outcome. Based on the available incident data, two subsequent events of pipeline disruption and shutdown requirements were considered and analyzed. The probability of the subsequent event for each failure cause is summarized in Table 2.
Except for natural hazard damage, Table 2 revealed more than 75% chance for the oil pipeline infrastructure to be disrupted following an incident. Excavation damage posed the highest expected disturbances in the pipeline operation. Following disturbances in pipeline operations due to specific causes of failure, such as equipment failure, operator error, natural hazard damage, and other incident causes, these incidents only mandate about 40% of shutdowns. This may be due to several factors that are already in place for effective pipeline operation, such as proactive monitoring, preventive maintenance, operational control, and various emergency responses [47]. Approximately 60% of incidents due to corrosion failure and other outside force damage may necessitate an operational pipeline shutdown for a particular duration. Additionally, excavation damage and material failure of pipes or welds account for over 75% of shutdowns. This higher percentage of shutdowns may be due to the strict safety protocol when responding to these types of failures to ensure the safety of personnel and the surrounding environment [49,51].
Although the proposed technique and results presented in this study are based on the PHMSA database, which covers oil pipeline incidents in the US, the proposed multi-event quantification methodology is generalizable. It can be applied to other regions given that there is an appropriate dataset available for other regions. It should be noted that specific probabilities and outcomes in Table 2 may vary depending on regional factors, such as pipeline design, operating conditions, regulatory frameworks, and environmental influences. Adapting the proposed technique to other geographical regions, countries, or continents would require local data to ensure the probabilities accurately reflect regional conditions, making the methodology robust across different geographic and regulatory settings [52].

4.2. Recovery Period Analysis

Since the dataset was based on the operational entry log, it contains incomplete data. In the shutdown scenario, there were instances in which a shutdown occurred, but no corresponding restart time was recorded. To address this issue, several assumptions were made in consultation with experts and personnel from the PHMSA data repository as part of the expert elicitation process while evaluating the recovery periods for the pipeline incident dataset. The assumptions were considered based on the following circumstances. For events detected and resolved during an on-site visit, the restart time is considered equivalent to the on-site time visit. This implies that the recovery period is quantified based on the difference between the on-site time visit and the shutdown time. In cases where a shutdown occurred after an on-site visit, it was assumed that the shutdown time aligns with the restart time. This scenario indicates that the pipeline was operational until the shutdown points and resumed operations after an on-site assessment. This approach provided a practical way to estimate recovery periods while ensuring that the analysis utilizes all feasible data. However, this is not the only method for handling missing data, and alternative procedures can also be considered.
Additionally, there were events in the dataset where the shutdown information remained unidentified, lacking specific details about the shutdown occurrences for these events. These instances were not considered in the quantification process. Lastly, the dataset also included over 1000 pipeline incidents in which no shutdown was required, indicating that these incidents did not necessitate a shutdown response, which falls under either Scenario 2 or Scenario 4 of the event tree analysis. The recovery duration and relative recovery period after the pipeline shutdown event for various failure causes are summarized in Table 3.
The relative recovery period was determined mainly based on the frequency and recovery duration required for each pipeline incident category. A lower relative recovery period score denotes a higher failure frequency, and more recovery efforts were dedicated to that particular failure cause. The failure cause was sorted based on the most frequent to the least frequent occurrences in the 2010–2022 oil pipeline incident period. From Table 3, the top three failure categories that required the most recovery support were corrosion failure, natural hazard damage, and material failure of pipe or weld. Corrosion failure, which obtained the lowest RP score, was deemed the failure cause that required the highest recovery effort, although it ranked second in incident frequency. Similarly, pipeline incidents resulting from natural hazard damage ranked fourth in occurrence and necessitated the second-longest recovery duration. This may be attributed to the complexity and inherent nature of pipeline repairs needed to address the underlying issues caused by corrosion and natural hazards. Corrosion often requires thorough inspections and comprehensive maintenance to restore pipeline integrity [17,53], while pipeline incidents from natural hazards may involve significant structural assessments and repairs [3]. These factors contribute to the prolonged recovery durations associated with these failures.
On the other hand, pipeline incidents resulting from incorrect operations had a minimal impact on recovery duration despite being the third most frequent type of incident, with an RP score of 0.94. This may be because such incidents often involve straightforward corrective and preventive actions, resulting in a rapid recovery duration. The training and protocols in place for pipeline operational procedures were likely to contribute to this recovery efficiency, enabling pipeline operators to address any operational issues that arose immediately [47]. Pipeline incidents’ external force, either from other incident causes or other outside force damage, exhibit shorter recovery duration. This observation is likely due to the fewer incidents reported during the 2010–2022 pipeline incident period.
The incident data primarily relied on operator entries. When data were not recorded at the time of the incident, it was challenging to recover the missing information, as operators may not recall the exact shutdown and restart times. To address gaps in the dataset, assumptions were made, such as using on-site visit times or aligning shutdown and restart times based on available data. While these assumptions provide a practical approach to estimating recovery periods, they may introduce some level of uncertainty. Moving forward, obtaining more complete data would enhance the robustness of the analysis and reduce reliance on these assumptions. By incorporating more accurate and comprehensive data, the potential for uncertainty can be minimized, leading to more precise results. Additionally, exploring alternative methods for handling missing data in future research could further improve the proposed framework’s accuracy and applicability in different scenarios.

4.3. Resilience Analysis

The resilience analysis was conducted for all possible failure outcomes from the event tree analysis in Scenarios 1 through 4 (S1–S4). Scenario 1 was characterized as a failure outcome involving a disrupted pipeline condition requiring a shutdown. In Scenario 2, the pipeline was disrupted, but a shutdown was not warranted. Scenario 3 described the situation in which a failure occurred, resulting in little to no pipeline disruption, yet a shutdown was still required. Lastly, Scenario 4 represented a completely resilient system in which the pipeline performance remained unaffected despite the presence of a failure cause, and no shutdown was necessary. The resilience indicator for all four scenarios is summarized in Table 4.
From the resilience indicators, regardless of the failure cause, it can be interpreted that Scenario 1 and Scenario 3 generally resulted in lower resilience than Scenario 2 and Scenario 4. This was because a pipeline shutdown was required in Scenarios 1 and 3, while no shutdown was necessary in either Scenario 2 or Scenario 4. When a shutdown is required, the pipeline system’s resilience depends on the recovery period or how long it takes to return to normal operational mode. Additionally, the resilience indicator in Scenario 1 was lower than in Scenario 3, while Scenario 2 exhibited less resilience than Scenario 4. This difference was attributed to the significant pipeline disturbances in Scenarios 1 and 2, whereas Scenarios 3 and 4 experienced minor or no pipeline disturbances. Although Scenario 4 is considered the ideal resilience scenario, the resilience indicator did not reach a complete 100% resilience; instead, it was found to be around 96.5–99.9%. This was because, even in Scenario 4, there exists a possibility of minor vulnerabilities and potential disruptions due to the frequency of initiating events that could affect pipeline performance. To summarize, the scenarios ranking from most resilient to least resilient are Scenario 4, Scenario 2, Scenario 3, and Scenario 1
Comparing failure causes in pipeline resilience analysis is crucial for understanding the root causes of pipeline incidents. It enables better resource allocation to prioritize the most critical failure causes. To interpret oil pipeline resilience based on the causes of the initial failure, the resilience indicator was averaged across all scenarios to obtain a single point value, referred to as RI_Total. The objective was to obtain a comprehensive assessment of resilience by consolidating data from multiple scenarios to provide a clearer overall picture of how various initiating events impact pipeline resilience performance. Figure 6 presents a bar graph comparing the resilience indicators for each scenario and their averages based on the different failure causes.
It should be noted that the failure causes in Figure 6 are sorted from left to right, from the most frequent to the least frequent occurrences. The three lowest pipeline resilience indicators were associated with the initiating events of corrosion failure, equipment failure, and natural hazard damage. Corrosion failure was assessed to have a resilience of 76%, while equipment failure demonstrated a resilience of 83% during the 2010–2022 oil pipeline incident period. Several factors contribute to the lower resilience indicator, failure frequency that leads to pipeline disruption, and the recovery period [54]. For the study period, it was found that pipeline incidents due to equipment failures occurred more frequently than corrosion failures, and pipeline incidents due to corrosion failures required a more extended recovery period compared to equipment failures.
Apart from equipment failure and corrosion failure, the RI_total value for other initiating events exhibited a 90% or higher resilience indicator. This high resilience value indicates that these failure causes are less likely to occur compared to equipment and corrosion failures, with less than a 15% chance of occurrence, based on Figure 2. Even when they happen, they tend to result in less significant pipeline disruptions and/or shutdowns, as indicated in Figure 4 and Figure 5. This suggests that the pipeline system can effectively manage and recover from these incidents with minimal impact on overall performance. One thing to point out for incidents due to natural hazard damage, with its fourth likelihood of occurrence, is that it exhibits the third-lowest resilience indicator. This is because the unpredictable nature and severity of incidents caused by natural hazards often necessitate more frequent pipeline shutdowns and make it challenging to restore normal operations quickly [8,34,55]. As shown in Table 3, natural hazard damage has the second-longest recovery period. As a result, even infrequent incidents can impact overall pipeline resilience.

5. Conclusions

The study proposed a quantitative way to assess the resilience of oil pipelines based on various initiating failure causes from 2010 to 2022. Through event tree analysis, the impact of multiple subsequent events leading to four different failure outcome scenarios was analyzed. These successive events were quantified regarding the effects of the initiating event failures on operational pipeline disruption and the necessity for further pipeline shutdowns. Resilience indicators were then calculated for each scenario to evaluate how well the pipeline system could withstand and recover from disruptions or shutdowns. Additionally, the resilience indicators from all scenarios were averaged to obtain an overall resilience indicator that reflected the impact of the different failure causes.
With the oil pipeline incident datasets from PHMSA from 2010 to 2022, the case study results showed that corrosion and equipment failures had lower resilience indicators than other causes, primarily due to their higher frequency and extended recovery periods. While pipeline incidents due to natural hazard damage may occur less frequently, their inherent unpredictability often necessitates more frequent shutdowns, affecting overall pipeline resilience.
From a broader perspective, including practical applications, this study contributes to pipeline management by providing a comprehensive multi-event analysis of resilience indicators associated with various failure causes. This resilience framework helps pipeline operators prioritize maintenance for frequent failures such as corrosion and prepare contingency plans for rare but high-impact events such as natural hazard damage. It provides practical insights for allocating resources effectively, minimizing disruptions, and improving overall operational reliability.
The proposed study has several limitations, including its reliance on historical data from 2010 to 2022, as 2023 data were incomplete at the time of the study, potentially missing recent trends or new failure causes. Validating the resilience framework with updated data or simulation models is a key focus for future research to enhance its robustness. Additionally, the analysis simplifies failure scenarios into two subsequent events, potentially overlooking complex interactions that could impact resilience. This limitation could be addressed by expanding the event tree to include more complex or rare events, provided sufficient data are available.
Additionally, geographical variations, such as climate and terrain, were not the focus of this study, which may have influenced how the resilience indicators were applied. To address these limitations, for future work, an expansion of data collection to include more recent information and a more comprehensive range of failure scenarios will be implemented. Exploring geographical differences in resilience analysis may provide a better understanding of improving resilience in unpredictable pipeline incidents, such as those caused by natural hazard damage. The multi-event resilience analysis presented can be integrated towards developing targeted strategies to enhance oil pipeline resilience, ultimately leading to more sustainable operations against various causes of failure.

Author Contributions

Conceptualization, L.N.A. and N.Y.; methodology, L.N.A., N.Y. and Y.H.; formal analysis, L.N.A. and N.Y.; investigation, L.N.A. and N.Y.; resources, N.Y. and Y.H.; data curation, L.N.A. and Y.H.; writing—original draft preparation, L.N.A. and N.Y.; writing—review and editing, N.Y. and Y.H.; visualization, L.N.A. and N.Y.; supervision, N.Y. and Y.H.; project administration, Y.H.; funding acquisition, Y.H. All authors have read and agreed to the published version of the manuscript.

Funding

This research is made possible through funding from the National Science Foundation (NSF) EPSCoR RII Track-2 Program under the NSF award # 2119691. The findings and opinions presented in this manuscript are those of the authors only and do not necessarily reflect the perspective of the sponsors.

Data Availability Statement

The data are available upon request.

Conflicts of Interest

The authors declare no conflicts of interest.

References

  1. Mahmood, Y.; Afrin, T.; Huang, Y.; Yodo, N. Sustainable Development for Oil and Gas Infrastructure from Risk, Reliability, and Resilience Perspectives. Sustainability 2023, 15, 4953. [Google Scholar] [CrossRef]
  2. US Department of Transportation, Pipeline and Hazardous Materials Safety Administration (PHMSA). Pipeline Basics. Available online: https://primis.phmsa.dot.gov/comm/PipelineBasics.htm (accessed on 15 August 2024).
  3. Biezma, M.V.; Andrés, M.A.; Agudo, D.; Briz, E. Most fatal oil & gas pipeline accidents through history: A lessons learned approach. Eng. Fail. Anal. 2020, 110, 104446. [Google Scholar] [CrossRef]
  4. Cozzani, V.; Campedel, M.; Renni, E.; Krausmann, E. Industrial accidents triggered by flood events: Analysis of past accidents. J. Hazard. Mater. 2010, 175, 501–509. [Google Scholar] [CrossRef] [PubMed]
  5. Anifowose, B.; Lawler, D.M.; van der Horst, D.; Chapman, L. Attacks on oil transport pipelines in Nigeria: A quantitative exploration and possible explanation of observed patterns. Appl. Geogr. 2012, 32, 636–651. [Google Scholar] [CrossRef]
  6. Sovacool, B.K. The costs of failure: A preliminary assessment of major energy accidents, 1907–2007. Energy Policy 2008, 36, 1802–1820. [Google Scholar] [CrossRef]
  7. Zhu, Y.; Qian, X.-M.; Liu, Z.-Y.; Huang, P.; Yuan, M.-Q. Analysis and assessment of the Qingdao crude oil vapor explosion accident: Lessons learnt. J. Loss Prev. Process Ind. 2015, 33, 289–303. [Google Scholar] [CrossRef]
  8. Girgin, S.; Krausmann, E. Historical analysis of U.S. onshore hazardous liquid pipeline accidents triggered by natural hazards. J. Loss Prev. Process Ind. 2016, 40, 578–590. [Google Scholar] [CrossRef]
  9. Ramírez-Camacho, J.G.; Carbone, F.; Pastor, E.; Bubbico, R.; Casal, J. Assessing the consequences of pipeline accidents to support land-use planning. Saf. Sci. 2017, 97, 34–42. [Google Scholar] [CrossRef]
  10. Restrepo, C.E.; Simonoff, J.S.; Zimmerman, R. Causes, cost consequences, and risk implications of accidents in US hazardous liquid pipeline infrastructure. Int. J. Crit. Infrastruct. Prot. 2009, 2, 38–50. [Google Scholar] [CrossRef]
  11. Siler-Evans, K.; Hanson, A.; Sunday, C.; Leonard, N.; Tumminello, M. Analysis of pipeline accidents in the United States from 1968 to 2009. Int. J. Crit. Infrastruct. Prot. 2014, 7, 257–269. [Google Scholar] [CrossRef]
  12. Yang, Z.; Xiang, Q.; He, Y.; Peng, S.; Faber, M.H.; Zio, E.; Zuo, L.; Su, H.; Zhang, J. Resilience of Natural Gas Pipeline System: A Review and Outlook. Energies 2023, 16, 6237. [Google Scholar] [CrossRef]
  13. Yodo, N.; Wang, P. Engineering resilience quantification and system design implications: A literature survey. J. Mech. Des. 2016, 138, 111408. [Google Scholar] [CrossRef]
  14. Zobel, C.W.; Khansa, L. Characterizing multi-event disaster resilience. Comput. Oper. Res. 2014, 42, 83–94. [Google Scholar] [CrossRef]
  15. Nguyen, S.; Chen, P.S.-L.; Du, Y. Risk assessment of maritime container shipping blockchain-integrated systems: An analysis of multi-event scenarios. Transp. Res. Part E Logist. Transp. Rev. 2022, 163, 102764. [Google Scholar] [CrossRef]
  16. Han, Z.Y.; Weng, W.G. An integrated quantitative risk analysis method for natural gas pipeline network. J. Loss Prev. Process Ind. 2010, 23, 428–436. [Google Scholar] [CrossRef]
  17. Lawson, K. Pipeline corrosion risk analysis—An assessment of deterministic and probabilistic methods. Anti-Corros. Methods Mater. 2005, 52, 3–10. [Google Scholar] [CrossRef]
  18. Li, X.; Chen, G.; Zhu, H. Quantitative risk analysis on leakage failure of submarine oil and gas pipelines using Bayesian network. Process Saf. Environ. Prot. 2016, 103, 163–173. [Google Scholar] [CrossRef]
  19. Farahani, S.; Tahershamsi, A.; Behnam, B. Earthquake and post-earthquake vulnerability assessment of urban gas pipelines network. Nat. Hazards 2020, 101, 327–347. [Google Scholar] [CrossRef]
  20. Toprak, S.; Taskin, F. Estimation of Earthquake Damage to Buried Pipelines Caused by Ground Shaking. Nat. Hazards 2007, 40, 1–24. [Google Scholar] [CrossRef]
  21. Eskandari, M.; Omidvar, B.; Modiri, M.; Nekooie, M.A.; Alesheikh, A.A. Geospatial Analysis of Earthquake Damage Probability of Water Pipelines Due to Multi-Hazard Failure. ISPRS Int. J. Geo-Inf. 2017, 6, 169. [Google Scholar] [CrossRef]
  22. Asha, L.N.; Huang, Y.; Yodo, N.; Liao, H. A Quantitative Approach of Measuring Sustainability Risk in Pipeline Infrastructure Systems. Sustainability 2023, 15, 14229. [Google Scholar] [CrossRef]
  23. Ceravolo, R.; Civera, M.; Lenticchia, E.; Miraglia, G.; Surace, C. Damage detection and localisation in buried pipelines using entropy in information theory. In Proceedings of the 1st International Electronic Conference on Applied Sciences, Online, 27 October–10 November 2023; pp. 30–36. [Google Scholar]
  24. Lee, S.-H.; Park, C.-S.; Yoon, D.-J. Source location and anomaly detection for damage identification of buried pipelines using kurtosis-based transfer function. Struct. Health Monit. 2024, 23, 1742–1765. [Google Scholar] [CrossRef]
  25. Arun Sundaram, B.; Kesavan, K.; Parivallal, S. Recent Advances in Health Monitoring and Assessment of In-service Oil and Gas Buried Pipelines. J. Inst. Eng. (India) Ser. A 2018, 99, 729–740. [Google Scholar] [CrossRef]
  26. Ma, J.; Chen, G.; Zeng, T.; Zhou, L.; Zhao, J.; Zhao, Y. Methodology for resilience assessment of oil pipeline network system exposed to earthquake. Sustainability 2023, 15, 972. [Google Scholar] [CrossRef]
  27. Ahmadian, N.; Lim, G.J.; Cho, J.; Bora, S. A quantitative approach for assessment and improvement of network resilience. Reliab. Eng. Syst. Saf. 2020, 200, 106977. [Google Scholar] [CrossRef]
  28. Argyroudis, S.A.; Mitoulis, S.A.; Hofer, L.; Zanini, M.A.; Tubaldi, E.; Frangopol, D.M. Resilience assessment framework for critical infrastructure in a multi-hazard environment: Case study on transport assets. Sci. Total Environ. 2020, 714, 136854. [Google Scholar] [CrossRef]
  29. Rehak, D.; Senovsky, P.; Hromada, M.; Lovecek, T. Complex approach to assessing resilience of critical infrastructure elements. Int. J. Crit. Infrastruct. Prot. 2019, 25, 125–138. [Google Scholar] [CrossRef]
  30. Sathurshan, M.; Saja, A.; Thamboo, J.; Haraguchi, M.; Navaratnam, S. Resilience of Critical Infrastructure Systems: A Systematic Literature Review of Measurement Frameworks. Infrastructures 2022, 7, 67. [Google Scholar] [CrossRef]
  31. Yazdi, M.; Khan, F.; Abbassi, R.; Quddus, N. Resilience assessment of a subsea pipeline using dynamic Bayesian network. J. Pipeline Sci. Eng. 2022, 2, 100053. [Google Scholar] [CrossRef]
  32. Golara, A.; Esmaeily, A. Quantification and Enhancement of the Resilience of Infrastructure Networks. J. Pipeline Syst. Eng. Pract. 2017, 8, 04016013. [Google Scholar] [CrossRef]
  33. Okoro, A.; Khan, F.; Ahmed, S. A methodology for time-varying resilience quantification of an offshore natural gas pipeline. J. Pipeline Sci. Eng. 2022, 2, 100054. [Google Scholar] [CrossRef]
  34. Ahmed, T.; Mahmood, Y.; Yodo, N.; Huang, Y. Weather-Related Combined Effect on Failure Propagation and Maintenance Procedures towards Sustainable Gas Pipeline Infrastructure. Sustainability 2024, 16, 5789. [Google Scholar] [CrossRef]
  35. Huang, Y.; Liang, X.; Azarmi, F. Innovative Fiber optic sensors for pipeline corrosion monitoring. In Pipelines 2014: From Underground to the Forefront of Innovation and Sustainability; ASCE: Reston, VA, USA, 2014; pp. 1502–1511. [Google Scholar] [CrossRef]
  36. Sresakoolchai, J.; Kaewunruen, S. Detection and severity evaluation of combined rail defects using deep learning. Vibration 2021, 4, 341–356. [Google Scholar] [CrossRef]
  37. Shang, L.; Zhang, Z.; Tang, F.; Cao, Q.; Yodo, N.; Pan, H.; Lin, Z. Deep learning enriched automation in damage detection for sustainable operation in pipelines with welding defects under varying embedment conditions. Computation 2023, 11, 218. [Google Scholar] [CrossRef]
  38. Afrin, T.; Yodo, N. A Hybrid Recovery Strategy toward Sustainable Infrastructure Systems. J. Infrastruct. Syst. 2022, 28, 04021054. [Google Scholar] [CrossRef]
  39. Yodo, N.; Afrin, T.; Yadav, O.P.; Wu, D.; Huang, Y. Condition-based monitoring as a robust strategy towards sustainable and resilient multi-energy infrastructure systems. Sustain. Resilient Infrastruct. 2022, 8, 170–189. [Google Scholar] [CrossRef]
  40. Miano, A.; Civera, M.; Aloschi, F.; De Biagi, V.; Chiaia, B.; Parisi, F.; Prota, A. Efficiency Assessment of Urban Road Networks Connecting Critical Node Pairs under Seismic Hazard. Sustainability 2024, 16, 7465. [Google Scholar] [CrossRef]
  41. Afrin, T.; Aragon, L.G.; Lin, Z.; Yodo, N. An Integrated Data-Driven Predictive Resilience Framework for Disaster Evacuation Traffic Management. Appl. Sci. 2023, 13, 6850. [Google Scholar] [CrossRef]
  42. PHMSA ALL REPORTED INCIDENT 20 YEAR TREND, P.a.H.M.S. Administration, Editor. 2023. Available online: https://www.phmsa.dot.gov/data-and-statistics/pipeline/pipeline-incident-20-year-trends (accessed on 15 August 2023).
  43. Yodo, N.R. Melvin, Statistics. Math. Cyber Res. 2022, 303. [Google Scholar] [CrossRef]
  44. Nagel, E. A frequency theory of probability. J. Philos. 1933, 30, 533–554. [Google Scholar] [CrossRef]
  45. Garthwaite, P.H.; Kadane, J.B.; O’Hagan, A. Statistical methods for eliciting probability distributions. J. Am. Stat. Assoc. 2005, 100, 680–701. [Google Scholar] [CrossRef]
  46. Muhlbauer, W.K.; Murray, J. Pipeline Risk Management. In Handbook of Pipeline Engineering; Springer: Berlin/Heidelberg, Germany, 2024; pp. 939–957. [Google Scholar] [CrossRef]
  47. Murray, A. Pipeline emergency response protocols and incident investigation. In Handbook of Pipeline Engineering; Springer: Berlin/Heidelberg, Germany, 2024; pp. 1005–1036. [Google Scholar] [CrossRef]
  48. Yodo, N.; Wang, P.; Rafi, M. Enabling resilience of complex engineered systems using control theory. IEEE Trans. Reliab. 2017, 67, 53–65. [Google Scholar] [CrossRef]
  49. Hainen, A.M.; Harbin, K.B.; Dye, D.; Lindly, J.K. Duration analysis of emergency shutdown incidents regarding hazardous liquid pipelines. J. Perform. Constr. Facil. 2020, 34, 04020040. [Google Scholar] [CrossRef]
  50. Valinejad, J. Measuring and Enhancing the Resilience of Interdependent Power Systems, Emergency Services, and Social Communities. 2022. Available online: https://vtechworks.lib.vt.edu/items/3bae12e5-5f6e-4636-9d02-973bf538b376 (accessed on 15 October 2024).
  51. Bonvicini, S.; Antonioni, G.; Cozzani, V. Assessment of the risk related to environmental damage following major accidents in onshore pipelines. J. Loss Prev. Process Ind. 2018, 56, 505–516. [Google Scholar] [CrossRef]
  52. Asha, L.N.; Aragon, L.G.; Dey, A.; Yodo, N. Location Optimization Strategies for Corn Production and Distribution towards Sustainable Green Supply Chain. Logistics 2024, 8, 78. [Google Scholar] [CrossRef]
  53. Tan, X.; Fan, L.; Huang, Y.; Bao, Y. Detection, visualization, quantification, and warning of pipe corrosion using distributed fiber optic sensors. Autom. Constr. 2021, 132, 103953. [Google Scholar] [CrossRef]
  54. Lustenberger, P.; Schumacher, F.; Spada, M.; Burgherr, P.; Stojadinovic, B. Assessing the performance of the European natural gas network for selected supply disruption scenarios using open-source information. Energies 2019, 12, 4685. [Google Scholar] [CrossRef]
  55. Iqbal, H.; Tesfamariam, S.; Haider, H.; Sadiq, R. Inspection and maintenance of oil & gas pipelines: A review of policies. Struct. Infrastruct. Eng. 2017, 13, 794–815. [Google Scholar] [CrossRef]
Figure 1. A visual representation of the quantitative resilience framework integrated with existing incident reporting infrastructure.
Civileng 06 00001 g001
Figure 2. Ranking failure causes based on the frequency and probability of occurrence during the 2010–2022 oil pipeline incident period.
Civileng 06 00001 g002
Figure 3. Event tree analysis of multiple intermediate events following an initiating event.
Civileng 06 00001 g003
Figure 4. Incident count of subsequent events during the 2010–2022 oil pipeline study period.
Civileng 06 00001 g004
Figure 5. Counts of failure consequences for Scenarios 1 through 4 during the 2010–2022 oil pipeline incident period.
Civileng 06 00001 g005
Figure 6. Resilience analysis results for all failure cause categories.
Civileng 06 00001 g006
Table 1. The category of failure causes in oil pipelines, with descriptions and examples [2,3].
Failure CausesDescriptionExamples
Corrosion
failure
Time-dependent threats occur as metals deteriorate through a natural electrochemical process called oxidation, often leading to leakage from affected metal body.
  • External and internal corrosion
  • Stress corrosion cracking (SCC)
  • Microbiologically influenced corrosion (MIC)
  • Stray current interference corrosion
  • Selective seam corrosion
  • Leakage from corrosion-induced pinholes or cracks
Equipment
failure
Failure involving pipeline components or devices other than the pipe itself: either a specific part of the equipment fails, or the whole equipment fails to operate correctly, sometimes resulting in leakage.
  • Pumps and compressors
  • Control and relieve valves
  • Meters and metering equipment
  • Leakage from faulty seals or gaskets
  • Other (storage tanks, couplings, fittings, flanges, gauges, instrument tubing, samplers, seals or gaskets, thermowell)
Excavation
damage
Damage from various excavation activities such as digging, grading, trenching, boring, and other related operations around the pipeline area, potentially causing punctures, leaks, or fractures.
  • External coating damage
  • Direct pipeline damage (dents, deformations, scrape, surface abrasions, cuts, holes, or other form of punctures)
  • Leakage or fractures due to direct impact from excavation equipment
Incorrect
operation
Indirect failure occurs when human or operating errors by personnel lead to pipeline or equipment failures which may result in unintended leakage, fatigue, or other malfunctions.
  • Leave the incorrect valve open
  • Overfill or over-pressuring
  • Noncompliance with procedures
  • Misjudge a situation
  • Misuse of tools or equipment, potentially causing fatigue or leakage over time
Material failure of pipe or weld Failure occurs when defects or weaknesses in the materials or welds lead to leaks, fractures, or fatigue cracking under repeated stresses, affecting pipeline integrity.
  • Pinhole, toe cracks, off-seam weld, undercutting, incomplete fusion, porosity, slag inclusions (often found in the construction process)
  • Burn pipe edges, incomplete fusion, hook cracks, cold welds, weld metal cracks (associated with the pipe manufacturing process)
  • Fracture or fatigue cracking from repetitive stresses
Natural hazard damageDisruptions of unpredictable force toward pipeline operations and their associated facilities because of naturally occurring events.
  • Earth movement, landslides, earthquakes
  • Heavy rain and flooding
  • High winds, tornadoes, hurricanes
  • Extreme temperatures
  • Lightning
Other outside force damageDamage includes activities caused by outside parties or forces other than through excavation or naturally occurring events.
  • Vehicle or equipment contact, automobile crash
  • Accidents or fires from nearby facilities
  • Vandalism, sabotage, and terrorism causing physical damage, including leaks or fractures
Other incident causeIncidents caused by unspecified internal or external factors lead to pipeline disruptions that do not fall into any of the previously discussed categories.
Table 2. The expected outcome of a disrupted and shutdown pipeline.
Failure Cause, iPipeline Disrupted
P(Event 1)
Pipeline Shutdown
P(Event 2)
Equipment Failure0.840.45
Corrosion Failure0.880.60
Incorrect Operation0.840.41
Natural Hazard Damage0.670.43
Material Failure of Pipe or Weld0.820.77
Excavation Damage0.910.79
Other Incident Cause0.790.44
Other Outside Force Damage0.780.67
Table 3. Recovery duration and relative recovery period due to pipeline shutdown.
Failure Cause, iRecovery Duration (hours)Relative Recovery Period
(RPi)
Equipment Failure35,7570.84
Corrosion Failure84,6700.63
Incorrect Operation14,0910.94
Natural Hazard Damage39,0810.83
Material Failure of Pipe or Weld36,7520.84
Excavation Damage12,1560.95
Other Incident Cause23840.99
Other Outside Force Damage35210.98
Table 4. Resilience indicators for failure outcome Scenarios 1 through 4.
Failure Cause, iResilience Indicator
Scenario 1
(RI_S1)
Scenario 2
(RI_S2)
Scenario 3
(RI_S3)
Scenario 4
(RI_S4)
Equipment Failure71.1%81.1%81.9%96.5%
Corrosion Failure53.6%89.9%61.7%98.7%
Incorrect Operation89.1%92.6%92.9%98.6%
Natural Hazard Damage81.9%98.4%82.4%99.2%
Material Failure of Pipe or Weld81.7%99.2%83.4%99.8%
Excavation Damage92.5%99.4%94.5%99.9%
Other Incident Cause98.2%99.0%98.7%99.7%
Other Outside Force Damage97.4%99.5%98.2%99.9%
Disclaimer/Publisher’s Note: The statements, opinions and data contained in all publications are solely those of the individual author(s) and contributor(s) and not of MDPI and/or the editor(s). MDPI and/or the editor(s) disclaim responsibility for any injury to people or property resulting from any ideas, methods, instructions or products referred to in the content.

