Article

A Systematic Approach to Identify and Manage Interface Risks between Project Stakeholders in Construction Projects

by
Michael C. Okika
1,*,
Andre Vermeulen
1 and
Jan-Harm C. Pretorius
2
1
Postgraduate School of Engineering Management, University of Johannesburg, Auckland Park, P.O. Box 524, Johannesburg 2006, South Africa
2
Faculty of Engineering and the Built Environment, University of Johannesburg, Auckland Park, P.O. Box 524, Johannesburg 2006, South Africa
*
Author to whom correspondence should be addressed.
CivilEng 2024, 5(1), 89-118; https://doi.org/10.3390/civileng5010005
Submission received: 24 October 2023 / Revised: 13 December 2023 / Accepted: 10 January 2024 / Published: 15 January 2024

Abstract

:
Interface risks are inherent in every construction project from start to finish. Identifying and managing these risks effectively in every project phase is crucial for actualising project objectives. This paper shows a comprehensive framework showing several relationships between project stakeholders and how the interface risks between them that influence project execution are identified and managed for the overall construction project success. Firstly, a literature review on interfaces and interface risks and a discussion on how organisations managed interface risks were carried out, and secondly, the collection of quantitative data was conducted by means of structured online questionnaires. The sample consisted of 205 construction project professionals who were selected randomly. This group included individuals with various roles in the construction industry. The data were analysed using descriptive statistical methods, including factor analysis, reliability assessment, and calculations of frequencies and percentages. The results showed all the factors, work cultures, and organisational approaches that influence interface risk management and ways to identify and manage interface risks effectively. Effective stakeholder management is crucial for effective interface risk management since many interface risks are created by the numerous stakeholders involved in the project and the proposed frameworks will effectively mitigate the consequences and causes of interface risks. Effectively mitigating these risks involves effective stakeholder management, building information modelling volume strategy, and creating a virtual construction model during the construction phase; in addition, construction supply chain risks must be carefully identified during the interfaces establishment stages; interface risks must be carefully identified during the conceptualisation; and the planning, construction, and execution stages and standard methods and procedures must be defined to effectively identify and manage interface risks as the occur in the project lifecycle plus implementing the proposed risk mitigation frameworks.

1. Introduction

In the present economic age, a sizable proportion of huge construction projects has been steadily expanding. Concurrently, the pandemic-induced economic crisis in 2020 strongly demonstrated that successful project delivery is dependent on sustainable project lifecycle management as well as project management principles and methodologies [1]. Interfaces are points of interaction between two or more aspects of a project which might be between clients, contractors, subcontractors, and other project stakeholders. Poor interface management gives rise to interface risks. Interface risks and the failure to manage them effectively is a common cause of problems in construction projects, which can negatively affect project objectives and goals.
The construction industry encounters interface risks which are complex, difficult, and require diverse solution to solve and manage, involving interface risk management (IRM). Interface risks are the most commonly encountered problem in the industry. In the highly risky and complex environment of a construction project, if effective decisions are not made in the conceptualisation, planning, design, contracting, procurement, and execution phases, then disagreements, loss of profit, claims, industrial actions, disputes, conflicts, change orders, and claims can occur at any phase of the construction project. The traditional construction industry usually depends on the project participants’ work experiences to solve interface risk problems, including issues between designers, owners, project team members, main contractors, subcontractors, host communities, licensing and regulatory bodies, vendors, maintenance contractors, and material suppliers. Formal risk management plans are rarely used in executing construction projects because contractors and subcontractors rely on their past experiences and judgements, and this can result in unforeseen circumstances that can negatively impact project objectives since these individuals are not fully equipped with the tools to effectively manage the unidentified risks and uncertainties associated with interfaces and numerous stakeholders. Stakeholder management is often not effectively incorporated into risk management plans as the numerous stakeholders and their roles and influences are not carefully identified in the conceptualisation stage of a project, and this gives rise to additional interface risks.
Interface risk management is primarily overseen and regulated by project managers. However, the intricate handling of these interface incidents is frequently evaluated and appraised based on the expertise of engineers. The involvement of a systematic approach to interface problems is infrequent. In essence, the conventional approach to interface problem solving lacks objectivity, relies heavily on subjective experiences, and lacks a systematic framework for identifying interface issues and proposing comprehensive solutions. The professionalisation of interface risk management (IRM) practise has been shown to have a positive impact on the project performance of construction projects [2]. This, in turn, leads to enhanced social benefits for public projects. While the advantages of interface risk management (IRM) may be more readily apparent in large-scale projects, the effective management of interfaces is considered significant for projects of all sizes and levels of complexity. Furthermore, recent research conducted by [3,4] has revealed that project managers have utilised building information modelling (BIM) to effectively oversee extensive construction projects and address the challenges associated with interfaces. In addition to its academic significance, this study also demonstrates its social relevance by potentially contributing to the professionalisation of IRM. The academic literature suggests that IRM holds promising benefits. One can anticipate several benefits from improving the exchange of information and reducing costs associated with interface issues, such as the promotion of inter-organizational collaboration [2,5].
Construction projects employ principles and protocols that encompass a multitude of complexities in the management of various stakeholders, including owners; technical clients; and engineering, procurement, and construction (EPC) contractors. The reason for this is that the phases of the construction project encompass numerous contracts that involve a diverse range of contractors. According to [6], therefore, it is important to recognise that the application of principles and approaches may vary among different stakeholders, both internal and external. Firstly, it is not feasible to effectively manage the relational connections between a singular project team consisting of the general contractor, client, designer, and customer [7]. Furthermore, the premise of a singular project team is predicated on the explicit consideration of the individual interests and objectives of all the participants [8]. In practical applications, the interests of the individuals engaged in a construction endeavour exhibit variation and frequently encompass multiple facets. This phenomenon arises in scenarios where the proprietor aims to reduce the expenses associated with construction, while the general contractor or subcontractor seeks to augment the construction costs. Additionally, the technical customer plans to delegate the tasks and coordination work to the design firm, thereby necessitating supplementary compensation [9]. According to [10], when considering the selection of the most economically efficient alternatives, the practicality of implementing a sole project team is questionable. The contractor expresses a favourable perspective regarding the evaluation of the most financially advantageous construction project. Nevertheless, the limited availability of construction orders to contractors can be attributed to competition from other industry players and market conditions. The primary concern for customers is the fulfilment of technical construction orders. Interface risk management is commonly employed in intricate projects and overseen by multiple stakeholders with diverse areas of expertise, resulting in a multitude of overlapping activities. Stakeholder management is one of the major challenges faced in construction projects as these numerous stakeholders have personal and diverse interests and objectives ranging from personal monetary gains, political and economic interests, opportunities, and favours and these, in essence, compromise the objectives of the project to successfully and in a timely fashion complete the project. This paper identifies and proposes new methods to manage stakeholders and, in essence, mitigate interface risks from these stakeholders and interfaces.
Interface risk management is a potential solution for effectively managing the complexities of construction projects. It primarily involves the management of communications, relationships, and deliverables among project stakeholders. By establishing improved methods for identifying, documenting, monitoring, and tracking project interfaces and the associated risks, interface risk management can contribute to the successful execution of construction projects. The present study undertakes a comprehensive review of relevant literature in order to establish a solid theoretical foundation for the research. The term “interfaces” in the context of construction projects refers to the points of connection or interaction between different components, systems, or stakeholders involved in the project. These interfaces play a crucial role in ensuring the successful coordination and integration of various elements within the construction process. Interfaces are significant for the overall project execution.
The study objective was to carry out a literature review on interfaces in construction, as well as interface risks and interface risk management. The study three main objectives were:
  • To identify the consequences of poor and ineffective interface risk management approaches and how they influence construction project delivery.
  • To identify the current interface risk management methods utilised by organisations.
  • To identify the causes of interface risks and how they influence project objectives.
To support the objectives of the study, these three research questions were asked. Respondents were asked to identify:
  • The causes of interface risks.
  • The consequences of poor and ineffective interface risk management approaches.
  • The interface risk management approaches implemented by their organisations.
The study focuses on a systematic approach of identifying and managing risks associated with every interface in construction projects in every phase. The literature review was carried out to identify critical areas of knowledge in the field of study, with the purpose of presenting a summary of the recent literature on the topic. The primary objective of the study was to develop a framework on how to identify and manage interface risks in construction for overall project success.
This paper is composed of the following: the study background is discussed after the Introduction, then Section 3 discusses the materials and methods used, Section 4 encompasses the findings and analysis, and the results and discussion are given in Section 5, followed by the conclusion in Section 6.

2. Background

2.1. Definition and Significance of Interfaces in Construction Projects

The concept of the interface was initially introduced by Wren, D.A., within the realm of organisational management. It was defined as the point of contact between interacting organisations that possesses a certain degree of autonomy. According to [11], there is a need to prioritise factors such as information sharing, degree of cooperation, and response time among organisational interfaces in construction projects. The concept of interface management encompasses the effective information management, coordination, and responsibility across contractual, physical, and organisational boundaries. It is widely recognised as a valuable approach for fostering friendly collaboration between project organisations within the construction industry [12]. The effective management of interfaces in the construction industry is widely recognised as a socially oriented activity that extends beyond formal practises and procedures [5]. In the context of interface classification, [13] employed the term “internal” to denote interactions occurring exclusively within the confines of a single project environment. Conversely, the term “external” refers to relationships established with entities that have no direct involvement in the project. In a survey conducted by [13], a range of interface issues were identified by industry experts. These issues included permits, change orders, contract obligations, poor quality of works, government laws, environmental problems, long lead items, poor contracting strategy, and wrong specifications.

2.2. Interface Risk Management

According to [13], there exists a differentiation between interface management and integration management. Integration management primarily concerns itself with the coordination of various project elements, encompassing the associated processes. On the other hand, interface management primarily involves the identification of stakeholder points of contact and the associated risks. According to scholars in the construction industry, interface management is widely recognised as a means to enhance goal alignment, mitigate conflicts, and improve cooperation efficiency among participants. Considering the evident significance of systems thinking in addressing interfaces, it was anticipated that the existing body of general systems engineering (SE) literature would offer comprehensive information on the organisation of information management (IM). Contrary to the previous statement, the opposite holds true. The book authored by Hsu (2020) regarding the foundations of software engineering in industrial practise exhibits limited focus on the subject matter. The primary emphasis of this study pertains exclusively to physical interfaces, encompassing their identification using various tools and their management through control documents. Hence, it is understandable that scholars advocate for the formalisation of interface management through the implementation of a methodical approach. As a result, recent scholarly endeavours have predominantly concentrated on the advancement of formal governance approaches through the utilisation of standardised procedures and information technology [2,5]. According to [5], research indicates that individuals involved in projects lack a comprehensive understanding of the necessary components for proficiently managing interfaces. People prefer to collaborate with people they like and trust, and they are more tolerant of conflict and differences. Controlling and supervisory behaviours emerge when people cooperate with someone they do not trust. This circumstance, known as Guanxi, is common in Chinese culture and has the potential to foster widespread social relationships [14]. Guanxi, as hypothesized by [15], can attenuate the influence of contractual control on project conflict, demonstrating that human interactions have a significant impact on inter-organizational trust relationships. Owners in the construction business frequently expect that contractors will engage in opportunistic conduct at any cost. Contractors, on the other hand, strive to delight owners in order to build trust in their organizations [16].
The implementation of practical guidelines has the potential to have a positive impact on individuals’ behaviours towards interface management. Additionally, it can foster a collective comprehension of interface management, which is considered crucial for enhancing its application [5]. According to [2], there is a positive correlation between the enhanced construction project outcome and the improved interface risk management performance.
Coordination-related issues, such as improper communication, the mismatch of owner expectations, rampant bureaucracy, dishonest practices, and disputes, are frequently observed on projects. Such coordination challenges necessitate synergies through continuous interface management [17,18,19,20]. Trust, openness, and communication are believed to aid in achieving strong interface management performance in terms of quality, time, and cost. The foundation of interface management is trust between parties. Project participants are more likely to be open to share their valuable resources if they have trust and mutual commitment, allowing for more porous and flexible organizational boundaries. However, simply being open is not enough to obtain high interface management performance. To communicate correct and comprehensive interface information and to promote efficient information sharing, actions such as building effective communication channels that adapt to organizational structure and characteristics are required. It is critical to design moderate interface mechanisms for interdisciplinary and multiorganizational communication amongst parities in order to achieve timely communication, coordination, and cooperation [21]. Transaction cost is one of the contributing factors to interface risks, and according to the Standish Group’s released reports, project costs are routinely surpassed by 21% to 100% (60% of project cost overruns). Furthermore, 4% of initiatives had a cost overrun that cause the project’s final cost to be higher than four times previously predicted. Standish believed that the group analysis of construction projects in the United Kingdom revealed cost variances ranging from 50 to 80%, which is significant for a construction project [22,23]. According to [23], some of the factors that affect transaction costs are payment schedule, quality of project, type of project, value of project, complexity of the project, similar experience, parties’ relationships, change order, the efficiency of the organisation, the duration of the project, and many more, and if these factors are not carefully considered during the project lifecycle, the projects will be adversely affected. Some of these costs are incurred to secure the delivery of high-quality developments or environmental enhancement, but it is often evident that the costs are exorbitant and the procedure is overly long and inefficient. Identifying and decreasing such costs assists planners and decision makers in improving the efficiency, efficacy, and acceptability of their projects and processes [24,25,26].

3. Materials and Methods

The primary data were collected from project managers, civil/structural engineers, mechanical engineers, risk managers, architects, quantity surveyors, electrical engineers, construction managers, HSE managers, estate managers, and other construction industry professionals actively working in construction projects in South Africa through an online questionnaire developed specifically for this study in order to answer the research questions and to realise the research objectives. Secondary data were collected through a review of the relevant literature, articles, and journals in the construction industry. A total of 205 research questionnaires were distributed to participants active in the construction industry. The study focused only on the South African construction industry and active industry professionals. All respondents were South African residents and had experience in the South African construction industry. Industry professionals living outside of South Africa were not part of the study. Every participant was involved in the conceptualisation, planning, contracting, subcontracting, procurement, construction, execution, HSE management, or commissioning phases of a project. These three Likert-type scale response anchors were chosen for the questionnaire in order to find out the level of agreement with the individual statements in the questionnaire and the frequencies of each statement or items in the questionnaire, and the extent scale was used to find out the extent to which each statement or item in the questionnaire influences construction projects. The data collection process commenced by administering a biographical questionnaire to ascertain the appropriate research participants in Section A; this included size of the organisation, profession, age, and highest academic qualifications. Section B had three subsections, namely B2, B3, and B4. Section B2 involved questions related to the consequences of poor and ineffective interface risk management approach, where respondents were asked to identify these consequences and rate them according to the extent scale. Section B3 comprised questions related to interface risk management methods currently adopted by their organisations and the extent to which they influenced project objectives, and Section B4 comprised questions related to the causes of interface risks and the respondents were asked to identify the extents the causes of interface risks influenced the successful execution of construction projects.
The items or questions in each section were coded for ease of analysis. For the five-point Linkert scale chosen, “rarely” was coded as a 2, “sometimes” was coded as a 3, “often” was coded as a 4, and “always” was coded as a 5. Also, “strongly disagree” was coded as a 1, “disagree” was coded as a 2, “neutral” was coded as a 3, “agree” was coded as a 4, and “strongly agree” was coded as a 5. In addition, “to no extent” was coded as a 1, “to a small extent” was coded as a 2, “to a moderate extent” was coded as a 3, “to a large extent” was coded as a 4, and “to a very large extent” was coded as a 5.
The data obtained from the questionnaire were coded, recorded, and analysed utilising the Statistical Package for the Social Sciences (SPSS, V25). Factor analysis was conducted in order to identify the latent dimensions underlying the measured variables, as these variables are expected to exhibit correlations or anticipated correlations. This study aims to assess the impact of measured variables and examine the interrelationships among a predetermined set of defined, observed, and quantifiable constructs. According to the guidelines provided in the SPSS manual, the Kaiser–Meyer–Olkin (KMO) measurement and the Bartlett’s test of sphericity were employed to assess the suitability of the correlation matrix as an identity matrix, thereby determining the appropriateness of the factor model.

4. Findings and Analysis

The study employed the Kaiser–Meyer–Olkin (KMO) measurement and Bartlett’s test to assess the interrelationships among variables, thereby informing the decision to proceed with the factor analysis of the collected data. A comprehensive set of 205 responses was obtained from the designated target population, which primarily comprised individuals within the construction industry, as described in the context of questionnaire design and target group identification. Table 1 below shows the summary of the biographical data of the respondents who participated in the online survey.
As seen in Table 1 above, out of the 205 responses from the online questionnaire, 16 respondents were quantity surveyors, 9 were architects, 7 were builders, 8 were project engineers, 9 were project administrators, 10 were safety officers/engineers/managers, 10 were risk managers, 20 were mechanical engineers, 13 were construction engineers, 18 were project managers, 8 were estate managers, 22 were electrical engineers, 25 were construction managers, 27 were civil/structural engineers, and 3 respondents were other construction professionals. Table 2 below shows age distribution of participants.
As seen in Table 2 above, out of the 205 respondents, 4 respondents were in the age group of 21–25 years, 16 were in the age group of 26–30 years, 32 were in the age group of 31–35 years, 42 were in the age group of 36–40 years, 53 were in the age group of 41–45 years, and 46 respondents were in the age group of 46 years and above. Table 3 below shows the academic qualifications of the respondents.
As seen in Table 3 above, 11 respondents out of the 205 respondents, which represented 5.4% of the respondents, had post-matric certificates or diplomas as their highest academic qualifications; 55 (26.8%) had Bachelor’s degrees; 28 (13.7%) had Honours degrees; 70 (34.1%) had Master’s degrees; and 41 respondents, which represented 20.0% of the total respondents, had doctoral degrees. Table 4 below shows the size of the respondents’ organizations.
As seen in Table 4 above, 72 respondents, which represents 35.1% of the total respondents, work in the small-sized industries, and 74, which represents 36.1%, work at medium-sized industries, while 59 of the respondents, which represents 28.8%, work in large-scale construction industries.
Table 5 below represents the frequency distribution for question 1 (How often do you encounter interface risks between project stakeholders in a project?)
As seen in Table 5 above, 11 (5.4%) respondents chose “rarely”, 63 (30.7%) chose “sometimes”, 66 (32.2%) chose “often”, and 65 (31.2%) of the total respondents chose “always”. Table 6 below shows the mean and standard deviation for research question 1.
As seen in Table 6 above, the mean was 3.90, which was slightly below “often” (4), and most people answered “sometimes” (3) and “always” (5). The median was 4.00, which means that half of the respondents chose between “often” and “always”, and the other half chose between “often” and “always”. The mode was 4, which means most people chose “often”. Table 7 below shows the responses for the research question 2 on work cultures related to interface risks. Interfaces are points of interaction between two or more aspects of a project, which might be between clients, contractors, subcontractors, or other project stakeholders, while interface risks are risks generated because of poor interface management in construction projects.
Table 7 above shows the responses for questions on work culture related to interface risks. The respondents were asked to answer the questions and rank them according to their level of agreement.
For the first statement (“Interface risks between project stakeholders can be classified as uncertainties.”), 1 respondent strongly disagreed with the statement, which represents 0.5% of the total responses; 15 (7.3%) respondents disagreed; 39 (19.0%) respondents were neutral; 129 (62.9%) agreed; while 21 (10.2%) of the respondents strongly agreed.
For the second statement (“Interface risks between project stakeholders can be classified as unidentified risks.”), 1 respondent strongly disagreed with the statement, which represents 0.5% of the responses; 12 (5.9%) disagreed with the statement; 57 (27.8%) respondents were neutral; 118 (57.6%) agreed; while 17 (8.3%) respondents strongly agreed.
For the third statement (“Identification of hard interface risks encourages effective collaboration between project stakeholders.”), 1 respondent strongly disagreed with the statement, which represents 0.5% of the responses; 2 (1.0%) disagreed with the statement; 11 (5.4%) respondents were neutral; 119 (58.0%) agreed; while 72 (35.1%) respondents strongly agreed.
For the fourth statement (“Identification of soft interface risks encourages effective collaboration between project stakeholders.”), no respondent strongly disagreed with the statement, which represented 0.0% of the responses; 6 (2.9%) disagreed with the statement; 27 (13.2%) respondents were neutral; 107 (52.2%) agreed; while 65 (31.7%) respondents strongly agreed.
Table 8 below shows the KMO and Bartlett’s test for research objective 1 (consequences of poor and ineffective interface risk management approach). KMO seeks to determine the applicability of a result to a set of measures when conducting factor analysis, where the values must be greater than 0.6, while Bartlett’s test of sphericity must be less than 0.05 to establish the applicability of factor analysis.
As shown in Table 8 above, the Kaiser–Meyer–Olkin measure of sampling adequacy was 0.898, which was greater than 0.6 and demonstrates that factor analysis can be carried out. For the Bartlett’s test of sphericity, the significance, which is the p value, was less than 0.001, and thus was less than 0.05, and this supports its factorability. Table 9 below shows the KMO and Bartlett’s test for research objective 2 (interface risk management approaches by organisations).
As shown in Table 9 above, the Kaiser–Meyer–Olkin measure of sampling adequacy was 0.915, which was greater than 0,6, and therefore, factor analysis can be carried out. For Bartlett’s test of sphericity, the significance, which is the p value, is 0.000, which is less than 0.05, and this supports its factorability. Table 10 below represents KMO and Bartlett’s test for research objective 3 (causes of interface risks).
As shown in Table 10 above, the Kaiser–Meyer–Olkin measure of sampling adequacy was 0.917, which was greater than 0.6 and shows that the factor analysis can be carried out. For Bartlett’s test of sphericity, the significance, which is the p value, was 0.000, which is less than 0.05, and this supports its factorability. Table 11 below shows the responses received for research objective 1 for B2, which is related to consequences of a poor and ineffective interface risk management approach. The respondents were asked to rank these consequences according to the extent scale.
As can be seen in Table 11 above, project delays, the extension of project delivery time, poor safety standards, stakeholders’ complaints, project overall failure, poor workflow planning and development, the loss of profit, additional costs, the reputational damage of an organisation, and claims for damage were identified as the major consequences of a poor and ineffective interface risk management approach in construction projects according to the responses received. Table 12 below shows the responses received for research objective 2—the extent to which interface risk management approaches influence project goals and objectives and the successful execution of construction projects in South Africa. The respondents rated their answers using the extent scale.
As shown in Table 12 above, alliancing and partnering agreements, the identification of construction supply chain risks during interface establishment, conflict resolution carried out by parties involved, clash detection as an integral part of the construction process for interface risk management, interface risk management by all the parties involved, clash detection as an integral part of the design process for interface risk management, assessing third parties’ dependencies to identify new interfaces, the identification of interface risks in the conceptualisation stage of a project, the identification of interface risks in the interface’s establishment phases, the identification of interface risks in the execution stage, defining standard methods and procedures, establishing a building information modelling (BIM) volume strategy, and creating a virtual construction model during the construction phase were identified as the major interface risk management approaches that have the most impact on project goals and objectives and the successful execution of construction projects in South Africa. Table 13 below shows the responses received regarding to what extent the following are causes of interface risks in construction projects.
As can be seen in Table 13 above, the responses indicated that disorganized construction supply chain management, incompetency, poor workflow planning and development, subcontractors’ negative attitudes towards teamwork, unpredictable and low delivery reliability, poor inventories, a lack of knowledge sharing, procurement delays, ineffective communication in site layout changes with stakeholders, a poor understanding of the construction project process among project stakeholders, not updating changes in site layout with stakeholders, and disorganized construction supply chain management were identified as the major causes of interface risks in construction projects.

4.1. Exploratory Factor Analysis

Since the sample size was 205, exploratory factor analysis was performed to reduce the data or summarise using a smaller set of factors or components. This was achieved by looking for groups among the intercorrelations of the set of variables. By using factor analytic techniques, data were refined and reduced to form a smaller number of related variables to a more manageable number before using them in other analyses. The factorability of the correlation matrix was as follows: to be considered suitable for factor analysis, the correlation matrix should show at least have some correlations of r = 0.3 or greater. Barlett’s test of sphericity should be statistically significant at p < 0.05, and the Kaiser–Meyer–Olkin values should be 0.6 or above. These values are presented as part of the output of the factor analysis. Table 14 below depicts the exploratory factor analysis for research objective 1.
As shown in Table 14 above, the consequences of poor and ineffective interface risk management approaches were loaded on two factors with eigenvalues of 6.206 and 1.438. These two factors explained 58.805% of the variance before rotation and 51.576% of the variance after rotation, and they represent the major and minor consequences of poor and ineffective interface risk management approaches. Table 15 below shows the corelation matrix for research objective 1.
As can be seen in Table 15 above, many of the correlations were greater than 0.3. B2.2 and B2.1 had a correlation of 0.267, B2.6 and B2.1 had a correlation of 0.288, B2.11 and B2.2 had a correlation of 0.298, B2.2 and B2.5 had a correlation of 0.259, and B2.1 and B2.10 had a correlation of 0.265. Table 16 below shows the communalities for research objective 1–B2.
As shown in Table 16 above, the extractions were all above 0.3, which means there was at least a 30% common variance shared among the items in Section B2. Figure 1 below shows the scree plot for Section B2.
In Figure 1 above, variables 3 to 13 were not significant, so they were not added to the factor rotation. For the first factor, the eigenvalue was around 6.2; for the second factor, the eigenvalue was around 1.4. Table 17 below depicts the rotated factor matrix for research objective 1–B2.
Table 17 shows that these items were grouped into two factors based on the ten key performance factors (KPIs) that are related to construction projects, namely time, cost, people, quality, safety and health, internal and external stakeholder, client satisfaction, financial performance, environment, information, and technology and innovation. Factor 1 items are associated with quality, people, IT and innovations, time, cost, safety and health, and environment and client satisfaction, while items in factor 2 items are associated with cost, time, external and internal stakeholders, financial performance, people, environment, and client satisfaction. Table 18 below represents the exploratory factor analysis for research objective 2 (“What are the interface risk management approaches by organisations?”)
As seen in Table 18 above, “Interface risk management approaches by organisation” the values were loaded on four factors with eigenvalues of 11.460, 2.787, 1.581, and 1.209. These four factors explained 70.987% of the variance before rotation and 65,383% of the variance after rotation. Table 19 below shows the correlation matrices for research objective 2–B3.
As shown in Table 19 above, many of the correlations were greater than 0.3. B3.13 and B3.24 had a correlation of 0.221, B3.2 and B3.9 had a correlation of 0.286, B3.5 and B3.22 had a correlation of 0.265, B3.4 and B3.1 had a correlation of 0.265, and B3.2 and B3.23 had a correlation of 0.263. Table 20 below shows the communalities for research objective 2–B3.
Table 20 above shows that the extractions are all above 0.3, which means there was at least a 30% common variance shared between them. Figure 2 below shows the scree plot of research objective 2–B3.
As can be seen in the scree plot above, variables 5 to 24 are not significant, so they were not added in the factor rotation. For the first factor, the eigenvalue was around 11.460; for the second factor, the eigenvalue was around 2.787; for the third factor, the eigenvalue was about 1.581; and for the fourth factor, the eigenvalue was 1.209. Table 21 below is the rotated factor matrix for Section B3.
As seen in Table 21 above, B3.11, B3.19, B3.15, B3.17, B3.23, B3.9, B3.5, B3.7, B3.1, B3.13, and B3.21 were grouped into factor 1, while B3.8, B3.6, B3.10, B3.12, and B3.14 were grouped into factor 2 and B3.18, B3.20, B3.22, B3.16, and B3.24 were grouped into factor 3, while B3.4 and B3.2 were grouped into factor 4. These items were grouped into two factors based on the KPIs listed above; they are associated with as stated earlier. Factor 1 items are associated with quality, people, IT and innovations, time, financial performance, cost, safety and health, environment, internal and external stakeholders, and client satisfaction, while items in factor 2 items are associated with cost, time, environment, quality, client satisfaction, information technology and innovation, external and internal stakeholders, people, environment and client satisfaction; factor 3 are items associated with environment, client satisfaction, safety and health, and external and internal stakeholders; and factor 4 are items associated with internal and external stakeholders. 
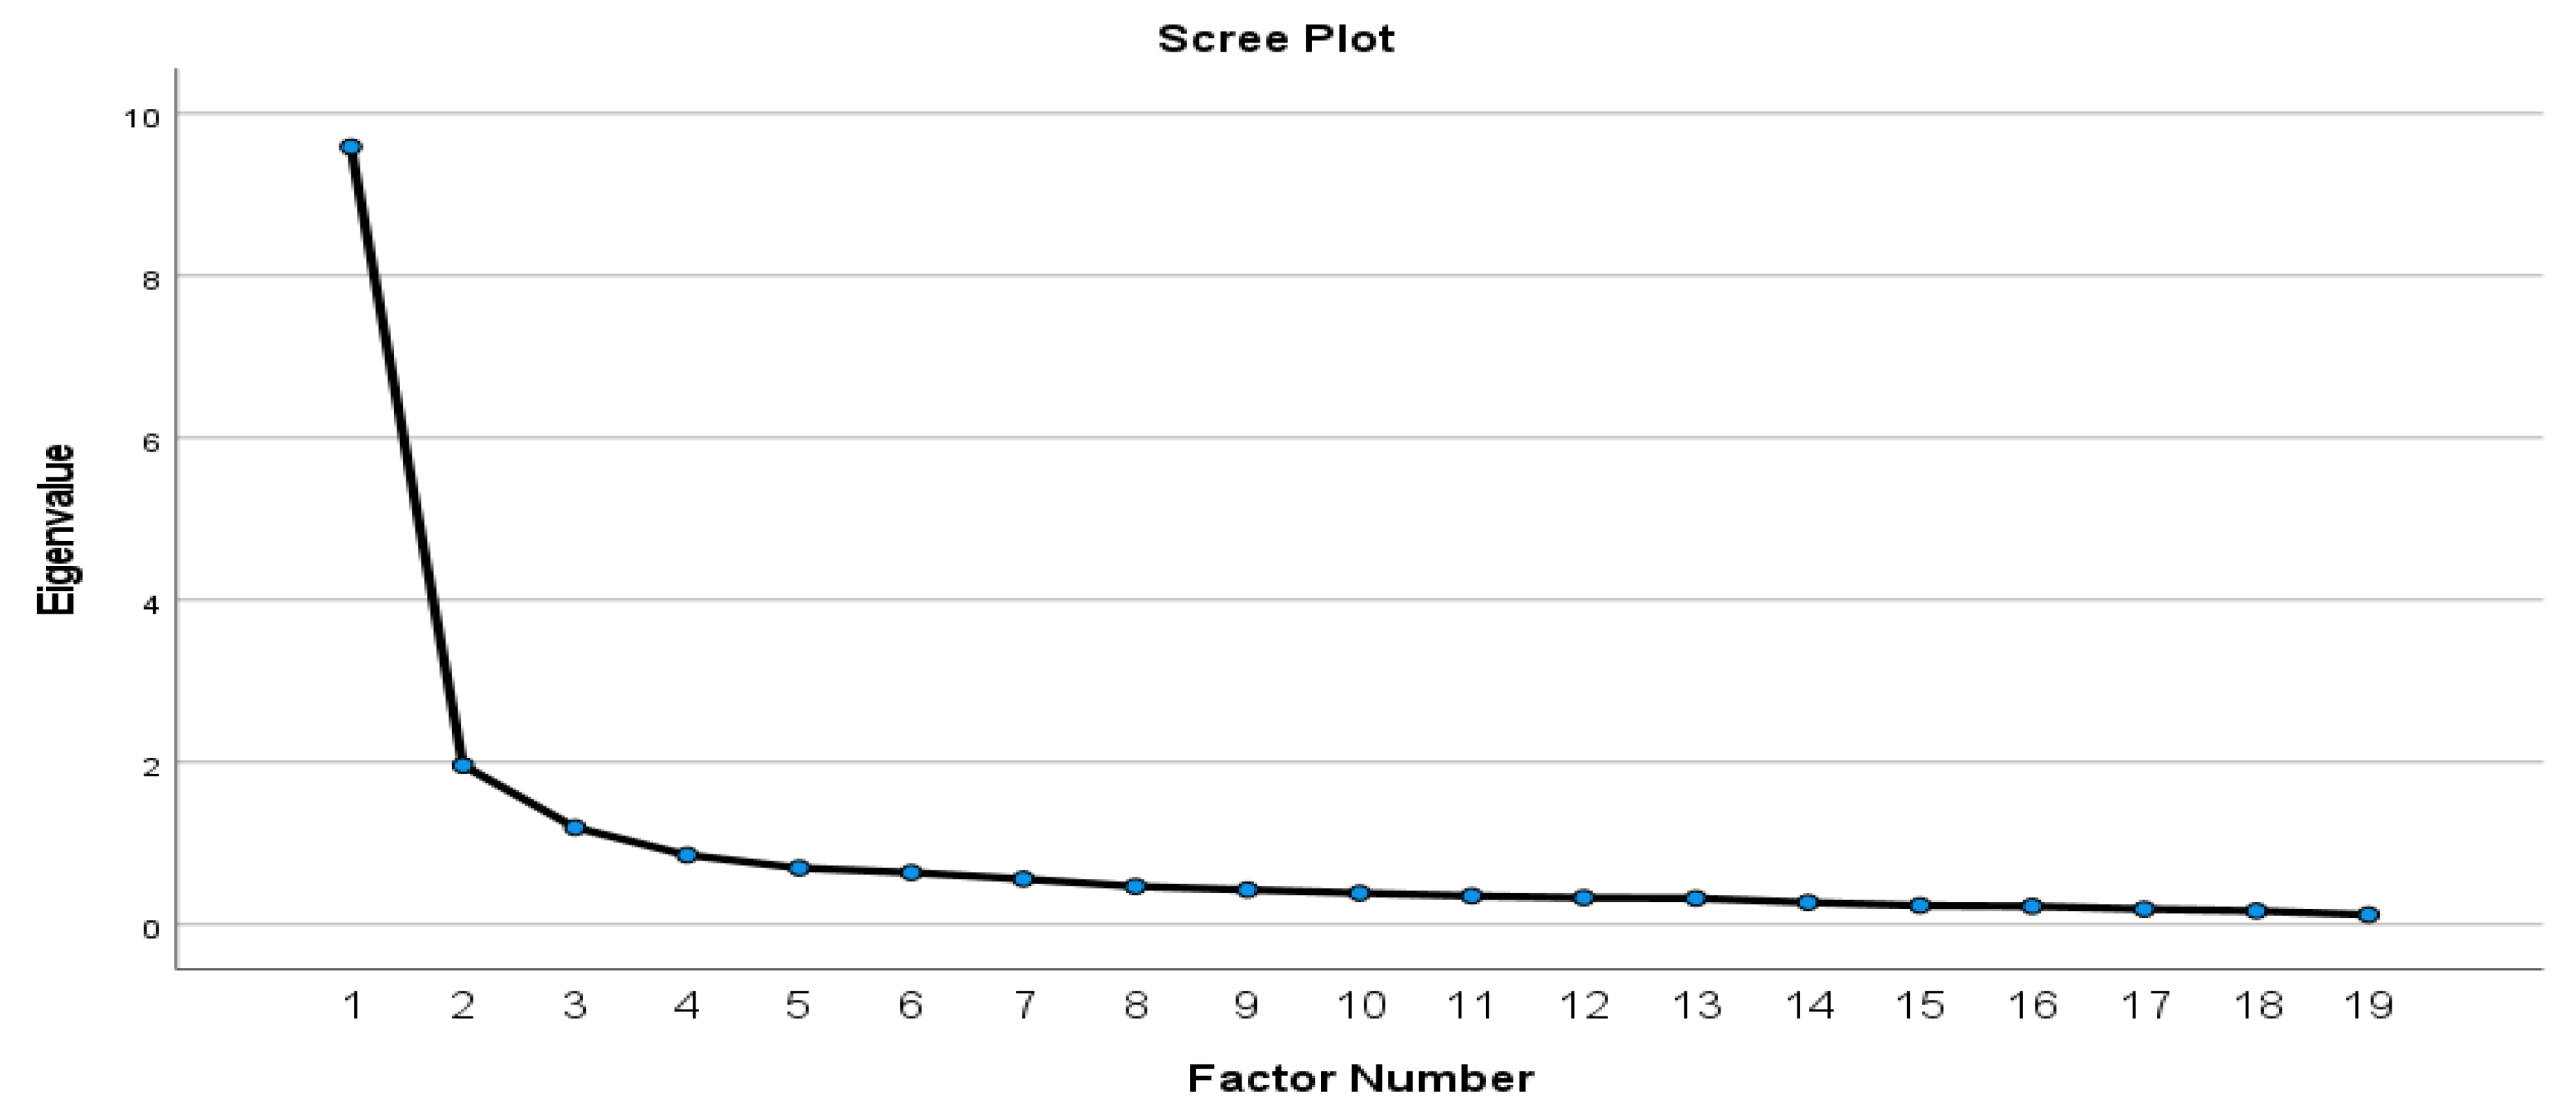
Table 22 below shows the exploratory factor analysis for research objective 3 (“The causes of interface risks”).
As shown in Table 22 above, the causes of interface risks were loaded on three factors with eigenvalues of 9.587, 1.960, and 1.194. These three factors explained 67.061% of the variance before rotation and 61.014% of the variance after rotation. Table 23 below shows the communalities for research objective 3.
Table 23 below depicts the communalities for research objective 3–B4.
As seen in Table 23 above, the extractions are all above 0.3, which means there was at least a 30% common variance shared among them. Figure 3 below shows the scree plot for research objective 3–B4.
As can be seen in the scree plot above, variables 4 to 19 are not significant, so they were not added to the factor rotation. For the first factor, the eigenvalue was around 9.587; for the second factor, the eigenvalue was around 1.960; and for the third factor, the eigenvalue was about 1.194. Table 24 below is the rotated factor matrix for research objective 3–B4.
As shown in Table 24 above, each item was grouped into factors based on the KPIs they are associated with, as stated earlier. B4.7, B4.1, B4.5, B4.9, B4.11, B4.15, B4.17, and B4.19 were grouped into factor 1; B4.10, B4.6, B4.8, B4.14, B4.4, and B4.2 were grouped into factor 2; and B4.18, B6.16, B4.13, and B4.12 were grouped into factor 3.

4.2. Reliability Statistics of Collected Data

4.2.1. Reliability Statistics of Theoretical Factors

To establish the consistency of the data, the value of the Cronbach’s alpha (coefficient alpha) was determined. Table 25 below shows the reliability statistics for research objective 1, and Cronbach’s alpha coefficients must be greater than 0.7 to confirm reliability and internal consistency.
As shown in the above Table 25, Cronbach’s alpha is 0.907, which was above 0.7; therefore, it is reliable. Table 26 below shows the item-total statistics for research objective 1.
Table 26 above contains total statistics for all the items in B2 for research objective1.
Table 27 below shows a Cronbach’s alpha value of 0.952, which was above 0.7; therefore, it is reliable. Table 28 below shows the item-total statistics for research objective 2.
Table 28 above contains total statistics for all the items in B3 for research objective 2. Table 29 below depicts the reliability statistics for research objective 3–B4.
As seen in Table 29 above, Cronbach’s alpha is 0.945; therefore, it is reliable. Table 30 below shows the item-total statistics for research objective 3–B4 (“The causes of interface risks.”).
Table 30 above contains total statistics for all the items in B4 for research objective 3. Please see Appendix A on page 32 for the item- statistics for the research objectives 1, 2 and 3 and the correlation matrix for research objective 3–B4.

4.2.2. Reliability Statistics of Empirical Factors

To confirm reliability and internal consistency, the reliability of the empirical factors was identified, and Table 31 below depicts the reliability statistics for research objective 1–B2–factor 1.
As seen in Table 31 above, Cronbach’s alpha is 0.880, which is greater than 0.7; therefore, it is reliable. Table 32 below shows the reliability statistics for research objective 1–B2–factor 2.
Table 32 above shows a Cronbach alpha value of 0.861, which is greater than 0.7; therefore, it is reliable. Table 33 below illustrates the reliability statistics for research objective 2–B3–factor 1.
As seen in Table 33 above, the Cronbach alpha is 0.941, which is above 0.7; so, it is reliable. Table 34 below illustrates the reliability statistics for research objective 2–B3–factor 2.
Table 34 above has a Cronbach alpha value of 0.903, which was above 0.7; therefore, it is reliable. The reliability statistics for research objective 2–B3–factor 3 is illustrated in Table 35 below.
As shown in Table 35 above, the Cronbach alpha is 0.895, which is greater than 0.7; therefore, it is reliable. Table 36 below shows the reliability statistics for research objective 2–B3–factor 4.
As shown in Table 36 above, the Cronbach Alpha is 0.826, which is greater than 0.7; therefore, it is reliable. Table 37 below shows the reliability statistics for research objective 3–B4–factor 1.
As shown in Table 37 above, the Cronbach alpha is 0.926, so it is reliable. Table 38 below shows the reliability statistics for research objective 3–B4–factor 2.
Table 38 above shows a Cronbach alpha of 0.881; therefore, it is reliable. Table 39 below shows the reliability statistics for research objective 3–B4–factor 3.
As shown in Table 39 above, the Cronbach alpha is 0.836, which is higher than 0.7, and this confirms its reliability.

5. Results and Discussion

The respondents were asked to answer questions on work culture related to interface risks. As depicted in Table 7 above, 1 respondent strongly disagreed that interface risks between project stakeholders can be classified as uncertainties, which represents 0.5% of the total responses; 15 (7.3%) respondents disagreed; 39 (19.0%) respondents were neutral; 129 (62.9%) agreed; while 21 (10.2%) of the respondents strongly agreed. A total of 1 respondent strongly disagreed that interface risks between project stakeholders can be classified as unidentified risks, representing 0.5% of the responses; 12 (5.9%) disagreed with the statement; 57 (27.8%) respondents were neutral; 118 (57.6%) agreed; while 17 (8.3%) respondents strongly agreed with the statement. The responses showed that 119 (58%) respondents agreed that the identification of hard interface risks encourages effective collaboration between project stakeholders, while 72 (35.1%) respondents strongly agreed. A total of 107 (52.2%) respondents agreed that the identification of soft interface risks encourages effective collaboration between project stakeholders, while 65 (31.7%) respondents strongly agreed.
For research objective 1, Spearman’s rho showed that there is a correlation between the consequences of poor and ineffective interface risk management approaches and their influence on a project, since the values of the Spearman’s coefficient are greater than 0.3 and, as shown in Table 8 above, for Bartlett’s test of sphericity, the significance, i.e., the p value, was less than 0.001, which was less than 0.05. This means that the higher the probability of the consequences, such as project delays, poor quality, industrial actions, additional costs, etc., the higher the impacts on the project. The Kaiser–Meyer–Olkin measure of sampling adequacy was 0.898, which was greater than 0.6 and demonstrates that factor analysis can be carried out.
For the research objective 2, Spearman’s rho showed that there was a correlation between the interface risk management approaches and their influences on the project goals and objectives and the successful execution of construction projects, since the values of Spearman’s coefficient were greater than 0.3 and, as shown in Table 9 above, for Bartlett’s test of sphericity, the significance, i.e., the p value, was 0.000, which was less than 0.05. This means that the higher the probability of the interface risk management approaches, such as defining standard methods and procedures, creating a virtual construction model during the construction phase, establishing a building information modelling (BIM) volume strategy, etc., the higher the impacts on the project goals and objectives. The Kaiser–Meyer–Olkin measure of sampling adequacy was 0.915, which was greater than 0.6, which shows that factor analysis can be carried out.
For the research objective 3, Spearman’s rho showed that there was correlation between the extent to which the following causes of interface risks influences construction projects, since the values of Spearman’s coefficient are greater than 0.3. And, as shown in Table 10 above, for the Bartlett’s test of sphericity, the significance, p value was 0.000, which was less than 0.05. This means that the higher the probability of the causes of interface risks, such as incompetency, poor inventories, lack of knowledge sharing, procurement delays, etc., the higher the impacts on the project execution. The Kaiser–Meyer–Olkin measure of sampling adequacy was 0.917, which was greater than 0.6 and shows that factor analysis can be carried out.

Proposed New Framework

Discussion

This study investigated interface risks, the various causes of interface risks, the consequences of poor interface risk management and their levels of influence on projects, and interface risk management approaches by organisations and how they influence the overall project objectives. Figure 4 below depicts the new proposed framework to identify and manage interface risks in construction projects.
As shown in Figure 4 above, for an effective interface risk assessment, it is recommended that construction industry must effectively establish a building information modelling volume strategy and create a virtual construction model during the construction phase; in addition, construction supply chain risks must be carefully identified during the interfaces establishment stages; interface risks must be carefully identified during the conceptualisation; and planning, construction, and execution stages and standard methods and procedures must be defined to effectively identify and manage interface risks as the occur in the project lifecycle. Effective stakeholder management is also crucial for effective interface risk management since many interface risks are created by the numerous stakeholders involved in the project. The proposed stakeholder management approaches will be shown in Figure 5 below.
As shown in the proposed framework in Figure 5, for an effective stakeholder management in construction projects, it is recommended that construction industry must encourage and implement alliancing and partnering agreements, conflicts resolution must be carried out by every party involved in the project, clash detection and avoidance must integrated into the construction and design processes for interface risk management, third parties’ dependencies must be carefully and continually identified and assessed in order to identify and manage new interfaces, and interface risk management must be carried out by all parties involved for overall project success. Stakeholder mapping must be carried out to determine how stakeholders influence the project and how the project influences the stakeholders. 
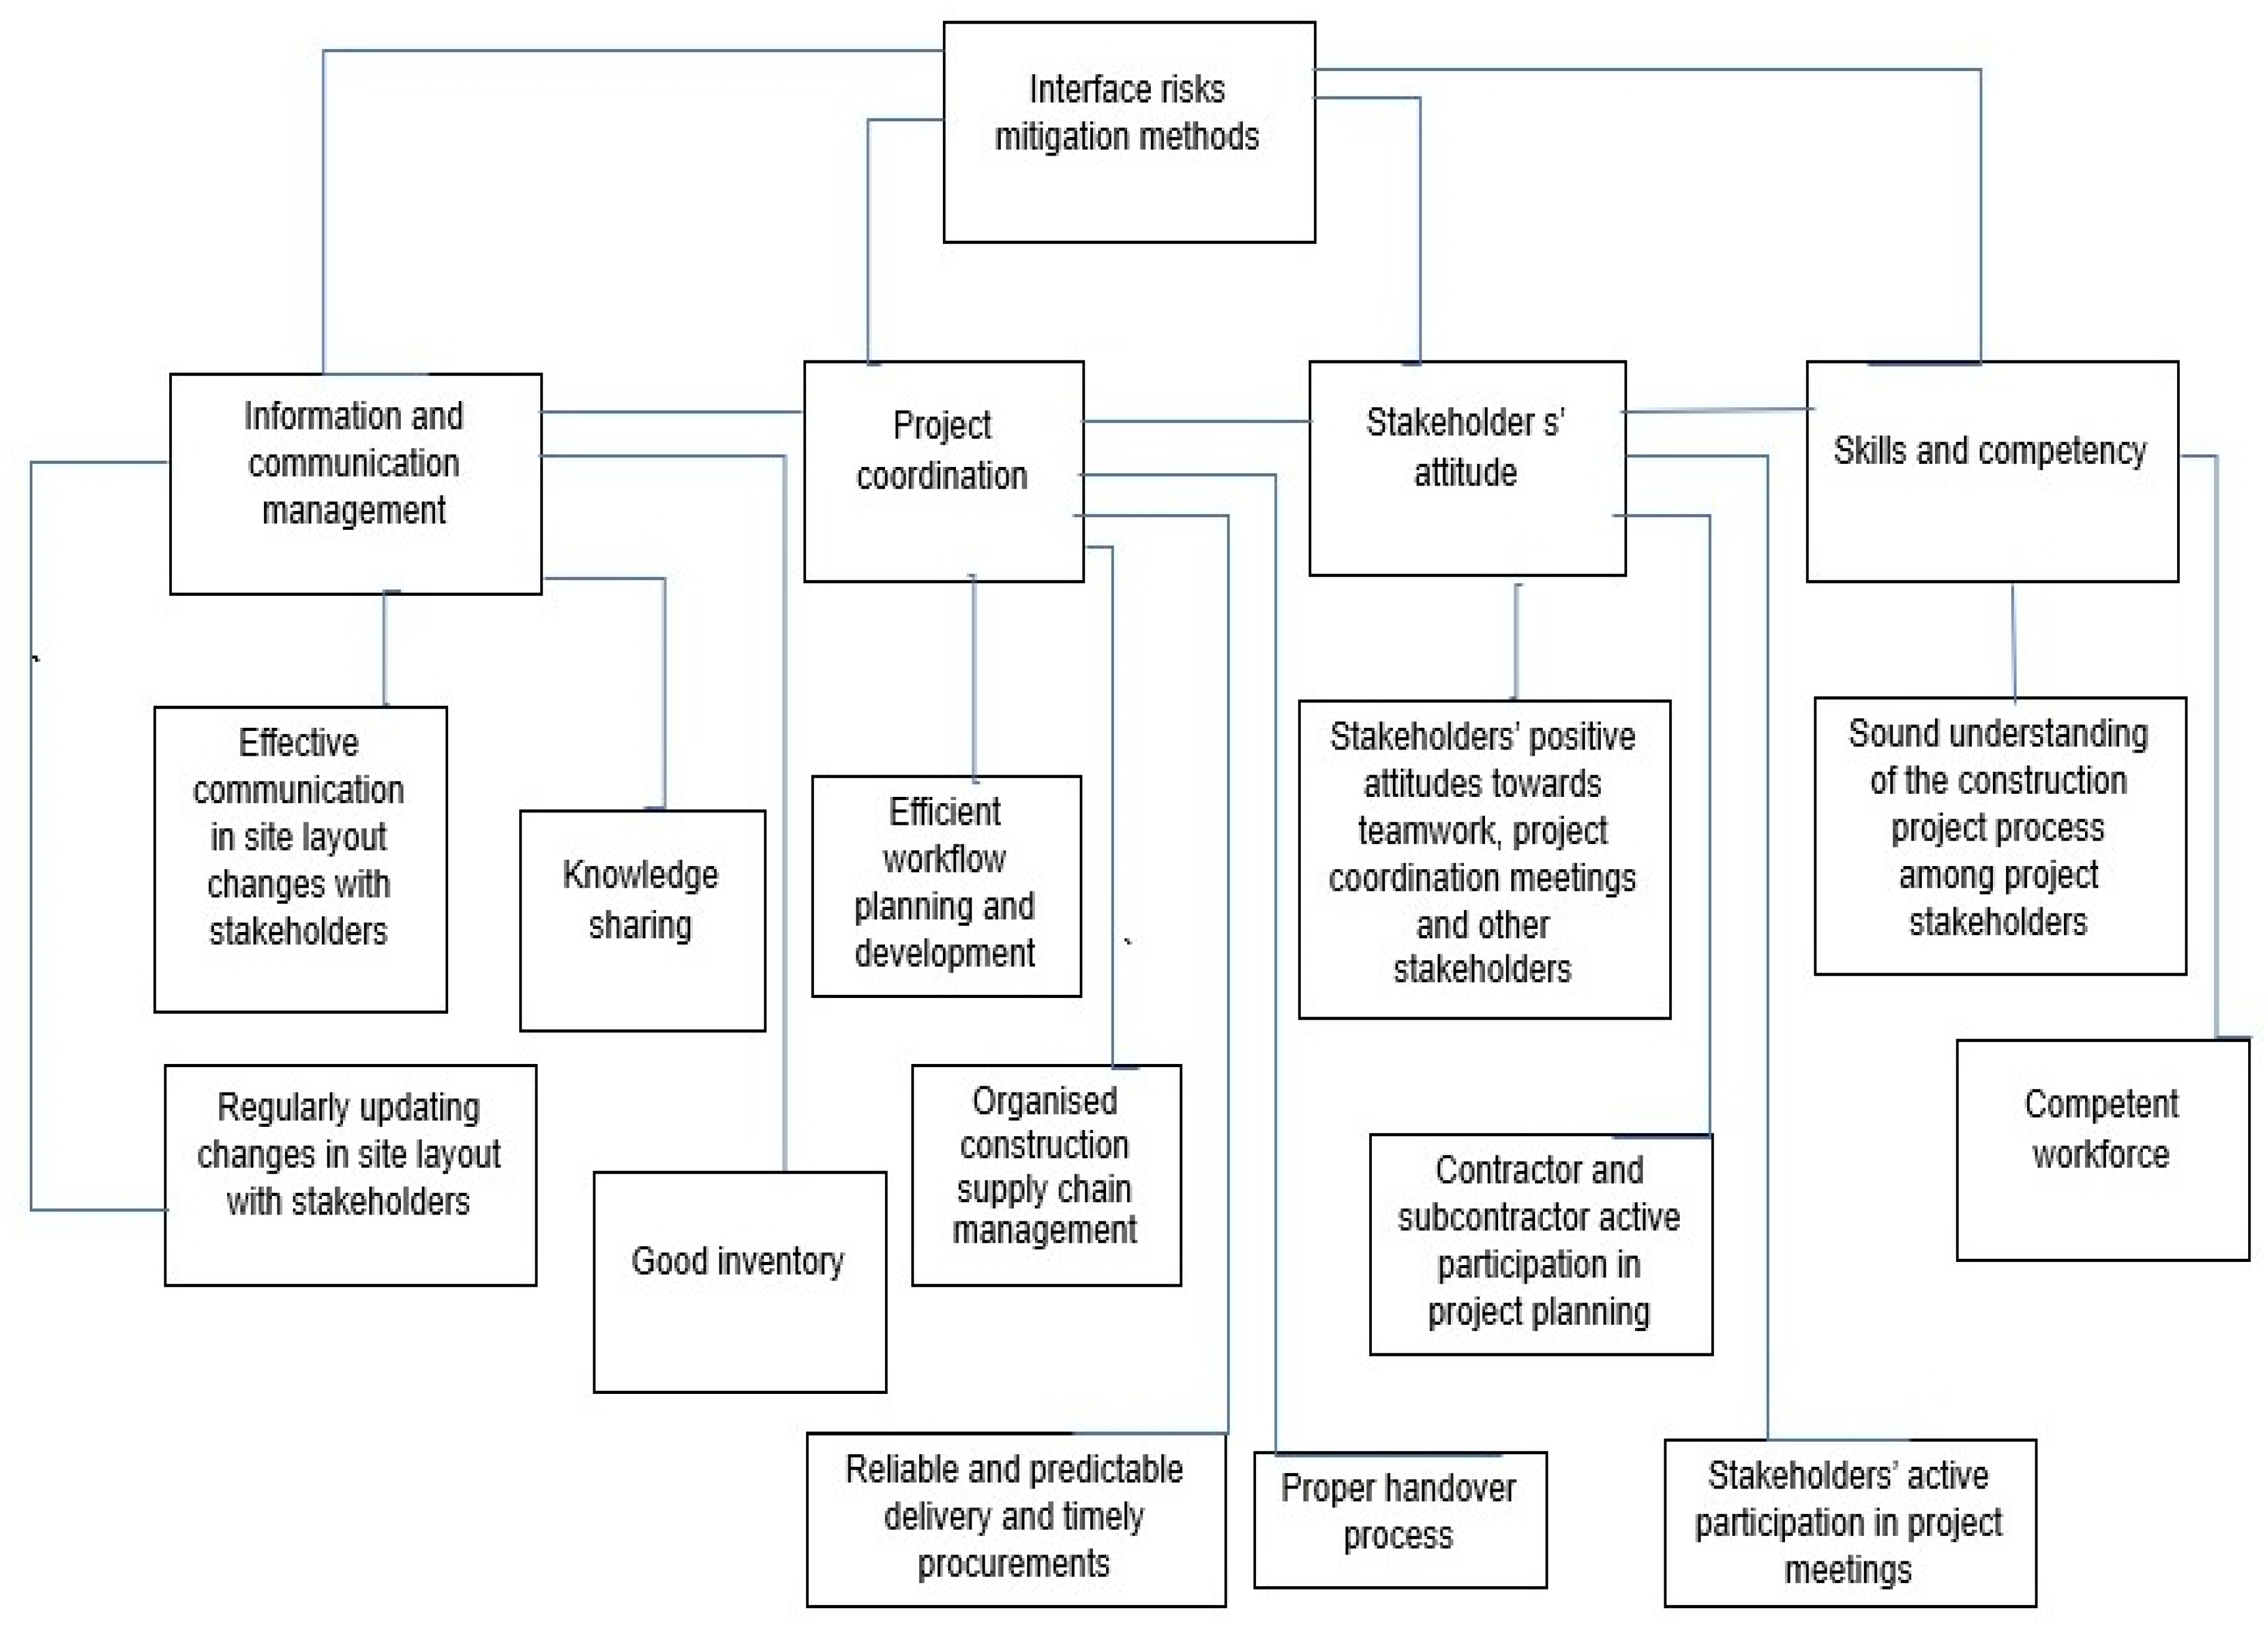
Figure 6 below shows the proposed interface risk mitigation methods.
The proposed framework in Figure 6 above ensures that information and communication are effectively managed throughout the project, that project coordination is improved and effective, that stakeholders’ attitudes produce positive outcomes, and that appropriate skills and competent workers are adequately utilized in all phases of the project to minimise interface risk occurrence and effectively manage them as they occur in the project in order to realise project objectives. The last chapter will focus on the conclusion of the results, findings, proposed frameworks and recommendations.

6. Conclusions

Interface risk is one of the major challenges facing the construction industry because construction projects are complex by nature—involving many activities and participants with different responsibilities and tasks. It is crucial to carefully identify and manage these risks arising from the interfaces since they are inherent in all the construction project phases according to the findings of this research. This study revealed that most construction projects encountered interface risks throughout a project lifecycle, and if they were not carefully and properly identified and managed during the project, they had negative influences on project objectives and could evidently lead to project failure or abandonment. Interface risks must be continually identified and managed during the conceptualisation, planning, and interface establishment phases and must be carefully assessed, monitored, and managed throughout the project. Stakeholder management was identified as one of the main ways to effectively manage interface risks because stakeholders play vital roles in interface risk management.
The effective communication, knowledge, and information sharing among project stakeholders have positive impacts on the success of the project because coordinated and evenly distributed knowledge and information flow on site layout changes and construction processes facilitate successful project delivery as well as identifying both soft and hard interface risks, as these encourage effective collaboration, alliancing, and partnering agreements between project stakeholders and, in essence, mitigate conflicts and clashes among stakeholders. The integration of clash detection and avoidance into a project’s lifecycle is vital for success, as this provides the project team with initial tools and ideas to effectively identify and manage such events and mitigate them in advance. Suppliers, vendors, clients, contractors, and subcontractors must communicate effectively to ensure timely and reliable delivery, procurement, and timely funding in order not to delay the project or incur additional costs. Clients must provide timely and sufficient funding because poor and delayed funding results in supply chain disruptions and labour and material delays, which ultimately prolong the project and result in additional costs. Effective interface risk management in construction projects will minimise and save costs and time; mitigate industrial action and damage claim; improve and maintain project quality and safety; protect the environment; facilitate good workflow planning and development; and protect the reputation of the organisation that would have been damaged as a result of regulatory infringements, industrial actions, damage claims, extended projected delivery time, stakeholder complaints, project abandonment, and failure. Identifying and assessing parties’ dependencies to identify and manage new interfaces is vital for project success. For effective interface risk management, standard methods and procedures must be defined, a building information modelling volume strategy must be established and utilised effectively, and a virtual construction model must be created and monitored regularly. Regular meetings with stakeholders facilitate effective interface risk management because every stakeholder will have updated and firsthand information on the project’s progress and schedule. Stakeholders’ attitudes towards project coordination are vital to project success as they determine how effectively each project phase will be completed. Clash detection and avoidance must be integrated into the planning, design, and construction stages and conflicts must be resolved by every party involved. Effective construction supply chain management is important in project delivery, and procurement deliveries must be timely, predictable, and reliable to avoid material and labour shortages or surplus, and inventories must be updated regularly for effective project site coordination and workflows. An incompetent labour force; a poor understanding of construction project processes; and contractors’, clients’, and subcontractors’ negative attitudes generate many interface risks, and these must be carefully identified and managed during the planning and contracting stages of a project. Changes in site layout must be updated and communicated to project participants. To save time; minimise costs; and maintain anticipated project quality, safety, and standards, interface risks must be carefully identified and managed by project participants, and every stakeholder must participate in project coordination meetings, comply with the project guidelines, and actively participate in identifying and managing interface risks throughout the project for its successful execution. Implementing the proposed stakeholder management framework and integrating it into the interface risk management framework will greatly minimise the risks involved that are generated by every party in a construction project.

Author Contributions

Conceptualization, M.C.O., A.V. and J.-H.C.P.; investigation, M.C.O.; methodology, M.C.O.; supervision, A.V. and J.-H.C.P.; writing—original draft, M.C.O.; writing—review and editing, A.V. and J.-H.C.P. All authors have read and agreed to the published version of the manuscript.

Funding

This research is funded by the University of Johannesburg, South Africa.

Data Availability Statement

All data and materials are available on request from the corresponding author.

Conflicts of Interest

The authors declare no conflicts of interest.

Appendix A

Table A1 above shows the mean scores and standard deviations of all the Section B2 items—research objective 1 (“The consequences of poor and ineffective interface risk management approach.”). The mean scores were in between “moderate extent” (3) and slightly above “large extent” (4), which means for each item, most respondents chose in between “moderate extent” (slightly above “moderate extent”) and slightly towards “very large extent”—a bit above “large extent”.
Table A1. Item statistics for research objective one.
Item Statistics
MeanStd. DeviationN
B2.14.000.789205
B2.24.030.813205
B2.34.350.723205
B2.44.060.826205
B2.53.810.845205
B2.64.220.751205
B2.73.730.805205
B2.84.130.756205
B2.94.150.809205
B2.103.910.729205
B2.114.240.734205
B2.124.000.741205
B2.134.170.744205
Table A2 above shows the mean scores and standard deviations of all the items in Section B3—research objective 2 (“Interface risk management approaches by organisation.”). The mean scores were in between “moderate extent” (3) and slightly above “large extent” (4), which means for each item, most respondents chose in between “moderate extent” and slightly towards “very large extent”.
Table A2. Item statistics for research objective two.
Item Statistics
MeanStd. DeviationN
B3.14.220.697205
B3.23.910.765205
B3.33.910.861205
B3.43.850.785205
B3.53.940.884205
B3.64.140.782205
B3.74.220.779205
B3.84.100.834205
B3.94.120.792205
B3.104.160.704205
B3.114.230.774205
B3.124.250.687205
B3.134.080.813205
B3.144.120.700205
B3.154.080.819205
B3.163.940.683205
B3.173.910.853205
B3.183.920.723205
B3.193.840.860205
B3.203.880.747205
B3.213.930.808205
B3.224.180.694205
B3.234.340.766205
B3.244.300.689205
The above Table A3 contains the mean and standard deviations of Section B4.
The mean scores were in between “moderate extent” (3) and slightly above “large extent” (4), which means for each item, most respondents chose in between “moderate extent” and slightly towards “very large extent”.
Table A3. Item statistics for research objective three.
Item Statistics
MeanStd. DeviationN
B4.14.290.680205
B4.24.000.728205
B4.34.020.770205
B4.43.970.754205
B4.54.000.813205
B4.64.250.742205
B4.74.220.740205
B4.84.010.764205
B4.94.350.750205
B4.104.240.727205
B4.113.940.768205
B4.123.820.827205
B4.134.040.827205
B4.144.250.701205
B4.154.030.785205
B4.163.940.725205
B4.173.630.928205
B4.183.490.905205
B4.193.960.756205
As shown in Table A4 above, many of the correlations were greater than 0.3. B4.2 and B4.1 had a correlation of 0.267, B4.4 and B4.13 had a correlation of 0.277, B4.6 and B4.17 had a correlation of 0.275, B4.2 and B4.17 had a correlation of 0.276, B4.11 and B4.14 had a correlation of 0.266, B4.2 and B4.9 had a correlation of 0.261, B4.17 and B4.14 had a correlation of 0.231, and B4.13 and B4.14 had a correlation of 0.287.
Table A4. Correlation matrix for research objective 3–B4.
Correlation Matrix
B4.1B4.2B4.3B4.4B4.5B4.6B4.7B4.8B4.9B4.10B4.11B4.12B4.13B4.14B4.15B4.16B4.17B4.18B4.19
CorrelationB4.11.0000.2670.5390.4370.6000.3310.6480.3600.5570.3900.5610.3620.4670.3400.5430.3730.5040.4170.549
B4.20.2671.0000.3240.5630.3810.5360.3370.4590.2610.5000.3250.5700.4150.4520.3600.5390.2760.4610.419
B4.30.5390.3241.0000.5170.6650.3410.6360.3660.5030.3750.5670.3610.4450.3700.5750.3540.5890.4610.583
B4.40.4370.5630.5171.0000.4560.5220.4510.6310.4090.6040.4040.5260.2770.4680.3740.4360.4260.4520.368
B4.50.6000.3810.6650.4561.0000.3630.6090.4100.5360.4210.5970.4460.5020.3070.5830.4240.6190.5090.534
B4.60.3310.5360.3410.5220.3631.0000.4510.5300.5030.6690.3550.5110.3270.5590.3740.4550.2750.4370.317
B4.70.6480.3370.6360.4510.6090.4511.0000.4800.6790.4350.6210.4170.4980.3830.6130.3720.5920.4930.570
B4.80.3600.4590.3660.6310.4100.5300.4801.0000.4280.6470.4700.5470.2400.5330.4240.5330.4440.4360.358
B4.90.5570.2610.5030.4090.5360.5030.6790.4281.0000.5080.5410.3530.4600.4110.5900.3990.4390.3360.503
B4.100.3900.5000.3750.6040.4210.6690.4350.6470.5081.0000.3790.5360.2530.6110.4170.5390.3150.4570.394
B4.110.5610.3250.5670.4040.5970.3550.6210.4700.5410.3791.0000.5460.5750.2660.6700.4340.6350.4400.553
B4.120.3620.5700.3610.5260.4460.5110.4170.5470.3530.5360.5461.0000.5900.4730.5360.6770.4910.6260.489
B4.130.4670.4150.4450.2770.5020.3270.4980.2400.4600.2530.5750.5901.0000.2870.5940.4370.5230.4650.637
B4.140.3400.4520.3700.4680.3070.5590.3830.5330.4110.6110.2660.4730.2871.0000.4410.5970.2310.3700.428
B4.150.5430.3600.5750.3740.5830.3740.6130.4240.5900.4170.6700.5360.5940.4411.0000.6050.6470.4900.696
B4.160.3730.5390.3540.4360.4240.4550.3720.5330.3990.5390.4340.6770.4370.5970.6051.0000.4560.5970.541
B4.170.5040.2760.5890.4260.6190.2750.5920.4440.4390.3150.6350.4910.5230.2310.6470.4561.0000.7410.662
B4.180.4170.4610.4610.4520.5090.4370.4930.4360.3360.4570.4400.6260.4650.3700.4900.5970.7411.0000.576
B4.190.5490.4190.5830.3680.5340.3170.5700.3580.5030.3940.5530.4890.6370.4280.6960.5410.6620.5761.000

References

  1. Flyvbjerg, B. Introduction: The iron law of megaproject management. In The Oxford Handbook of Megaproject Management; Flyvbjerg, B., Ed.; Oxford University Press: Oxford, UK, 2017; pp. 1–18. [Google Scholar]
  2. Shen, W.; Tang, W.; Wang, Y.; Duffield, C.F.; Hui FK, P.; Zhang, L. Managing Interfaces in Large-Scale Projects: The Roles of Formal Governance and Partnering. J. Constr. Eng. Manag. 2021, 147, 04021064. [Google Scholar] [CrossRef]
  3. Paik, S.M.; Leviakangas, P.; Choi, J. Making most of BIM in design: Analysis of the importance of design coordination. Int. J. Constr. Manag. 2022, 22, 2225–2233. [Google Scholar] [CrossRef]
  4. Sami Ur Rehman, M.; Thaheem, M.J.; Nasir, A.R.; Khan, K.I.A. Project schedule risk management through building information modelling. Int. J. Constr. Manag. 2022, 22, 1489–1499. [Google Scholar] [CrossRef]
  5. Shen, W.; Choi, B.; Lee, S.; Tang, W.; Haas, C.T. How to improve interface management behaviors in EPC projects: Roles of formal practices and social norms. J. Manag. Eng. 2018, 34, 04018032. [Google Scholar] [CrossRef]
  6. Gusakova, E. Organizational and technological genesis as a tool for strategic planning of large-scale real estate development projects. In MATEC Web of Conferences; EDP Sciences: Les Ulis, France, 2018; Volume 170, p. 01015. [Google Scholar]
  7. Malla, V.; Delhi, V.S.K. Determining interconnectedness of barriers to interface management in large construction projects. Constr. Econ. Build. 2022, 22, 69–101. [Google Scholar]
  8. Pavlov, A.S.; Ginzburg, A.V.; Gusakova, E.A.; Kagan, P.B. Management of large-scale projects for the construction of industrial facilities. In Monograph. Ministry of Science and Higher Education of the Russian Federation, National Research Moscow State University of Civil Engineering; Publishing House MISI-MGSU: Moscow, Russia, 2019. [Google Scholar]
  9. Ding, Z.; Liu, S.; Liao, L.; Zhang, L. A digital construction framework integrating building information modeling and reverse engineering technologies for renovation projects. Autom. Constr. 2019, 102, 45–58. [Google Scholar] [CrossRef]
  10. Hazır, Ö.; Ulusoy, G. A classification and review of approaches and methods for modeling uncertainty in projects. Int. J. Prod. Econ. 2020, 223, 107522. [Google Scholar]
  11. Zhao, S.; Wang, J.; Ye, M.; Huang, Q.; Si, X. An evaluation of supply chain performance of China’s prefabricated building from the perspective of sustainability. Sustainability 2022, 14, 1299. [Google Scholar] [CrossRef]
  12. Ahn, S.; Shokri, S.; Lee, S.; Haas, C.T.; Haas, R.C. Exploratory study on the effectiveness of interface-management practices in dealing with project complexity in large-scale engineering and construction projects. J. Manag. Eng. 2017, 33, 04016039. [Google Scholar]
  13. Mhlanga, N.; Babatunde, D.O.K. Improving Interface Management on a Mega Construction Project. Ph.D. Thesis, University of the Witwatersrand, Faculty of Engineering and the Built Environment, Johannesburg, South Africa, 2018. [Google Scholar]
  14. Zhang, S.B.; Fu, Y.F.; Gao, Y.; Zheng, X.D. Influence of trust and contract on dispute negotiation behavioral strategy in construction subcontracting. J. Manag. Eng. 2016, 32, 04016001. [Google Scholar]
  15. Lee, G.; Shin, G.C.; Haney, M.H.; Kang, M.; Li, S.; Ko, C. The impact of formal control and guanxi on task conflict in outsourcing relationships in China. Ind. Mark. Manag. 2017, 62, 128–136. [Google Scholar] [CrossRef]
  16. Li, Y.; He, N.; Li, H.; Liu, Z.; Qi, J. Influencing factors on inter-organizational trust asymmetry behavior in construction projects: Evidence from China. Eng. Constr. Archit. Manag. 2021, 28, 308–331. [Google Scholar]
  17. Araujo, A.G.; Carneiro, A.M.; Palha, R.P. Sustainable construction management: A systematic review of the literature with meta-analysis. J. Clean. Prod. 2020, 256, 120350. [Google Scholar] [CrossRef]
  18. Chen, Q.; Hall, D.M.; Adey, B.T.; Haas, C.T. Identifying enablers for coordination across construction supply chain processes: A systematic literature review. Eng. Constr. Archit. Manag. 2020, 28, 1083–1113. [Google Scholar]
  19. Durdyev, S.; Hosseini, M.R. Causes of delays on construction projects: A comprehensive list. Int. J. Manag. Proj. Bus. 2020, 13, 20–46. [Google Scholar]
  20. Kadry, M.; Osman, H.; Georgy, M. Causes of construction delays in countries with high geopolitical risks. J. Constr. Eng. Manag. 2017, 143, 04016095. [Google Scholar] [CrossRef]
  21. Shen, W.; Tang, W.; Wang, S.; Duffield, C.F.; Hui FK, P.; You, R. Enhancing trust-based interface management in international engineering-procurement-construction projects. J. Constr. Eng. Manag. 2017, 143, 04017061. [Google Scholar] [CrossRef]
  22. Simion-Melinte, C. Characteristics of Cost Management in Construction Projects. Descrierea CIP a Bibliotecii Naţionale a României Globalization and Intercultural Dialogue: Multidisciplinary; Arhipelag XXI Press: Târgu-Mureş, Romania, 2014; Volume 811. [Google Scholar]
  23. Abdel-Galil, E.; Ibrahim, A.H.; Alborkan, A. Assessment of transaction costs for construction projects. Int. J. Constr. Manag. 2022, 22, 1618–1631. [Google Scholar] [CrossRef]
  24. Buitelaar, E. A transaction-cost analysis of the land development process. Urban Stud. 2004, 41, 2539–2553. [Google Scholar]
  25. Sadler, G.; Shahab, S. Self-Build and Custom Housebuilding Registers in England: A Transaction-Cost and Effectiveness Analysis. Sustainability 2021, 13, 4912. [Google Scholar] [CrossRef]
  26. Shahab, S. Transaction costs in planning literature: A systematic review. J. Plan. Lit. 2022, 37, 403–414. [Google Scholar] [CrossRef]
Figure 1. Scree plot for research objective 1–B2.
Civileng 05 00005 g001
Figure 2. Scree plot of research objective 2–B3.
Civileng 05 00005 g002
Figure 3. Scree plot for research objective 3–B4.
Civileng 05 00005 g003
Figure 4. Proposed interface risk assessment approach framework.
Civileng 05 00005 g004
Figure 5. Proposed stakeholder management approach framework.
Civileng 05 00005 g005
Figure 6. Proposed interface risk mitigation methods.
Civileng 05 00005 g006
Table 1. Survey participants’ professions in the South African construction industry.
ProfessionFrequencyPercentValid PercentCumulative
Percent
Quantity surveyor167.87.87.8
Architect94.44.412.2
Civil engineer/structural engineer2713.213.225.4
Builder73.43.428.8
Construction manager2512.212.241.0
Electrical engineer2210.710.751.7
Mechanical engineer209.89.861.5
Estate manager83.93.965.4
Project manager188.88.874.1
Construction engineer136.36.380.5
Project engineer83.93.984.4
Project administrator94.44.488.8
Safety officer/engineer/manager104.94.993.7
Risk manger104.94.998.5
Other construction professionals31.51.5100.0
Total205100.0100.0
Table 2. Age distribution of respondents.
Age GroupFrequencyPercentValid PercentCumulative Percent
21–25 years42.02.02.0
26–30 years167.87.89.8
31–35 years3215.615.625.4
36–40 years4220.520.545.9
41–45 years5325.925.971.7
46 years and above5828.328.3100.0
Total205100.0100.0
Table 3. Academic qualifications of the respondents.
Highest Academic QualificationFrequencyPercentValid PercentCumulative Percent
Post-Matric Certificate or Diploma115.45.45.4
Bachelor’s degree5526.826.832.2
Honours Degree2813.713.745.9
Master’s degree7034.134.180.0
Doctorate Degree4120.020.0100.0
Total205100.0100.0
Table 4. Size of respondents’ organizations.
Organisation SizeFrequencyPercentValid PercentCumulative Percent
Small (1–100 staff)7235.135.135.1
Medium (101–500)7436.136.171.2
Large (501–5000+)5928.828.8100.0
Total205100.0100.0
Table 5. Frequency distribution for research question 1.
How Often Do You Encounter Interface Risks between Project Stakeholders in a Project?
FrequencyPercentValid PercentCumulative
Percent
ValidRarely115.45.45.4
Sometimes6330.730.736.1
Often6632.232.268.3
Always6531.731.7100.0
Total205100.0100.0
Table 6. Statistics for research question 1.
How Often Do You Encounter Interface Risks between Project Stakeholders in a Project?
NMeanMedianModeStd.
Deviation
MinimumMaximum
ValidMissing
20503.904.0040.91325
Table 7. Responses on work culture related to interface risks.
Work Culture Related to Interface RisksStrongly DisagreeDisagreeNeutralAgreeStrongly AgreeTotal
Interface risks between project stakeholders can be classified as uncertainties.Count1153912921205
Row N%0.5%7.3%19.0%62.9%10.2%100.0%
Interface risks between project stakeholders can be classified as unidentified risks.Count1125711817205
Row N%0.5%5.9%27.8%57.6%8.3%100.0%
Identification of hard interface risks encourages effective collaboration between project stakeholders.Count121111972205
Row N%0.5%1.0%5.4%58.0%35.1%100.0%
Identification of soft interface risks encourages effective collaboration between project stakeholders.Count062710765205
Row N%0.0%2.9%13.2%52.2%31.7%100.0%
Table 8. KMO and Bartlett’s test for research objective 1 for B2 (consequences of poor and ineffective interface risk management approach).
KMO and Bartlett’s Test
Kaiser–Meyer–Olkin Measure of Sampling Adequacy.0.898
Bartlett’s Test of SphericityApprox. Chi-Square1309.488
Df78
Sig.<0.001
Table 9. KMO and Bartlett’s test for research objective 2 for B3 (interface risk management approaches by organisations).
KMO and Bartlett’s Test
Kaiser–Meyer–Olkin Measure of Sampling Adequacy.0.915
Bartlett’s Test of SphericityApprox. Chi-Square4068.497
Df276
Sig.0.000
Table 10. KMO and Bartlett’s test for research objective 3 for B4 (causes of interface risks).
KMO and Bartlett’s Test
Kaiser–Meyer–Olkin Measure of Sampling Adequacy.0.917
Bartlett’s Test of SphericityApprox. Chi-Square2767.160
Df171
Sig.0.000
Table 11. Responses for the research objective 1 for B2—the consequences of a poor and ineffective interface risk management approach.
Section B2 (B2.1–B2.13)To no ExtentTo a Small ExtentTo a Moderate ExtentTo a Large ExtentTo a Very Large ExtentTotal
Stakeholders’ complaintsCount154210156205
Row N%0.5%2.4%20.5%49.3%27.3%100.0%
Claims for damageCount08409463205
Row N%0.0%3.9%19.5%45.9%30.7%100.0%
Loss of profitCount12188797205
Row N%0.5%1.0%8.8%42.4%47.3%100.0%
Reputational damage of an organisationCount08408968205
Row N%0.0%3.9%19.5%43.4%33.2%100.0%
Industrial actionsCount012608845205
Row N%0.0%5.9%29.3%42.9%22.0%100.0%
Project delaysCount222210277205
Row N%1.0%1.0%10.7%49.8%37.6%100.0%
Regulatory infringementsCount24778636205
Row N%1.0%2.0%37.6%42.0%17.6%100.0%
Poor workflow planning and developmentCount242311363205
Row N%1.0%2.0%11.2%55.1%30.7%100.0%
Project overall failureCount262410172205
Row N%1.0%2.9%11.7%49.3%35.1%100.0%
Poor qualityCount154311838205
Row N%0.5%2.4%21.0%57.6%18.5%100.0%
Additional costsCount212110279205
Row N%1.0%0.5%10.2%49.8%38.5%100.0%
Poor safety standardsCount153511648205
Row N%0.5%2.4%17.1%56.6%23.4%100.0%
Extension of project delivery timeCount152110969205
Row N%0.5%2.4%10.2%53.2%33.7%100.0%
Table 12. Responses received for research objective 2 for B3—the extent to which interface risk management approaches influence project goals and objectives and the successful execution of construction projects in South Africa.
Section B3 (B3.1–B3.24)To no ExtentTo a Small ExtentTo a
Moderate Extent
To a Large
Extent
To a Very Large
Extent
Total
Alliancing and partnering agreementsCount032310574205
Row N%0.0%1.5%11.2%51.2%36.1%100.0%
Identifying third parties’ dependencies to identify new interfacesCount084610843205
Row N%0.0%3.9%22.4%52.7%21.0%100.0%
Assessing third parties’ dependencies to identify new interfacesCount015419752205
Row N%0.0%7.3%20.0%47.3%25.4%100.0%
Identifying third parties’ dependencies to manage new interfacesCount165610141205
Row N%0.5%2.9%27.3%49.3%20.0%100.0%
Assessing third parties’ dependencies to manage new interfacesCount014448760205
Row N%0.0%6.8%21.5%42.4%29.3%100.0%
Defining standard methods and proceduresCount162610270205
Row N%0.5%2.9%12.7%49.8%34.1%100.0%
Establishing a building information modelling (BIM) volume strategyCount07239283205
Row N%0.0%3.4%11.2%44.9%40.5%100.0%
Creating a virtual construction model during the construction phaseCount292310467205
Row N%1.0%4.4%11.2%50.7%32.7%100.0%
Regular meetings between project stakeholdersCount08299870205
Row N%0.0%3.9%14.1%47.8%34.1%100.0%
Identification of construction supply chain risks during interface establishments.Count141911962205
Row N%0.5%2.0%9.3%58.0%30.2%100.0%
Identification of interface risks in the conceptualisation stage of a projectCount07229383205
Row N%0.0%3.4%10.7%45.4%40.5%100.0%
Identification of interface risks in the planning stage of a projectCount041710876205
Row N%0.0%2.0%8.3%52.7%37.1%100.0%
Identification of interface risks in the execution stage of a projectCount14428969205
Row N%0.5%2.0%20.5%43.4%33.7%100.0%
Identification of interface risks in the interface’s establishment phasesCount052411759205
Row N%0.0%2.4%11.7%57.1%28.8%100.0%
Identification of interface risks in the execution stageCount07408870205
Row N%0.0%3.4%19.5%42.9%34.1%100.0%
Stakeholders’ management strategies to predict how the project will affect stakeholdersCount083013334205
Row N%0.0%3.9%14.6%64.9%16.6%100.0%
Stakeholders mapping to predict how stakeholders will affect the projectCount110489353205
Row N%0.5%4.9%23.4%45.4%25.9%100.0%
Clash avoidance as an integral part of the construction process for interface risk managementCount074111839205
Row N%0.0%3.4%20.0%57.6%19.0%100.0%
Clash avoidance as an integral part of the design process for interface risk managementCount013558849205
Row N%0.0%6.3%26.8%42.9%23.9%100.0%
Clash detection as an integral part of the construction process for interface risk managementCount084711238205
Row N%0.0%3.9%22.9%54.6%18.5%100.0%
Clash detection as an integral part of the design process for interface risk managementCount09479851205
Row N%0.0%4.4%22.9%47.8%24.9%100.0%
Conflicts resolution carried out by parties involvedCount042211267205
Row N%0.0%2.0%10.7%54.6%32.7%100.0%
Collaboration between project stakeholdersCount14198299205
Row N%0.5%2.0%9.3%40.0%48.3%100.0%
Interface risk management by all the parties involvedCount041510284205
Row N%0.0%2.0%7.3%49.8%41.0%100.0%
Table 13. Responses to research objective 3 for B4 (To what extent are the following the causes of interface risks on construction projects?).
Section B4 (B4.1–B4)To no
Extent
To a Small ExtentTo a Moderate ExtentTo a Large ExtentTo a Very Large ExtentTotal
Poor workflow planning and developmentCount131111080205
Row N%0.5%1.5%5.4%53.7%39.0%100.0%
Subcontractors’ negative attitudes towards teamworkCount133911448205
Row N%0.5%1.5%19.0%55.6%23.4%100.0%
Procurement delaysCount144010456205
Row N%0.5%2.0%19.5%50.7%27.3%100.0%
Unpredictable and low delivery reliabilityCount163711546205
Row N%0.5%2.9%18.0%56.1%22.4%100.0%
Poor inventoriesCount183710257205
Row N%0.5%3.9%18.0%49.8%27.8%100.0%
Lack of knowledge sharingCount05229583205
Row N%0.0%2.4%10.7%46.3%40.5%100.0%
Poor understanding of the construction project process among project stakeholdersCount151710676205
Row N%0.5%2.4%8.3%51.7%37.1%100.0%
Not updating changes in site layout with stakeholdersCount153710953205
Row N%0.5%2.4%18.0%53.2%25.9%100.0%
Ineffective communication in site layout changes with stakeholdersCount131982100205
Row N%0.5%1.5%9.3%40.0%48.8%100.0%
Disorganized construction supply chain managementCount141710578205
Row N%0.5%2.0%8.3%51.2%38.0%100.0%
Neglecting the handover process between two activities involving different trades in the planning stageCount074610547205
Row N%0.0%3.4%22.4%51.2%22.9%100.0%
Excluding subcontractors during the planning stage of a projectCount455210638205
Row N%2.0%2.4%25.4%51.7%18.5%100.0%
Clients’ negative attitudes toward project stakeholdersCount343610161205
Row N%1.5%2.0%17.6%49.3%29.8%100.0%
IncompetencyCount032210179205
Row N%0.0%1.5%10.7%49.3%38.5%100.0%
Absence of contractors in project coordination meetingsCount173310856205
Row N%0.5%3.4%16.1%52.7%27.3%100.0%
Absence of subcontractors in project coordination meetingsCount073911841205
Row N%0.0%3.4%19.0%57.6%20.0%100.0%
Absence of suppliers and vendors in project coordination meetingsCount218737240205
Row N%1.0%8.8%35.6%35.1%19.5%100.0%
Absence of vendors in project coordination meetingsCount325698424205
Row N%1.5%12.2%33.7%41.0%11.7%100.0%
Contractors’ negative attitudes toward project stakeholdersCount083911246205
Row N%0.0%3.9%19.0%54.6%22.4%100.0%
Table 14. Exploratory factor analysis for research objective 1–B2 (The consequences of poor and ineffective interface risk management approach).
FactorInitial EigenvaluesExtraction Sums of Squared
Loadings
Rotation Sums of Squared
Loadings
Total% of
Variance
Cumulative %Total% of
Variance
Cumulative %Total% of
Variance
Cumulative %
16.20647.74247.7425.73244.09344.0933.37325.94625.946
21.43811.06358.8050.9737.48351.5763.33225.63051.576
30.9177.05365.858
40.7155.49871.355
50.5934.55975.914
60.5364.12080.034
70.5033.86883.903
80.4543.49387.395
90.4223.24690.641
100.4023.09193.732
110.3362.58796.318
120.2531.94398.261
130.2261.739100.000
Table 15. Correlation matrix for research objective 1–B2 (The consequences of poor and ineffective interface risk management approaches.).
Correlation Matrix
B2.1B2.2B2.3B2.4B2.5B2.6B2.7B2.8B2.9B2.10B2.11B2.12B2.13
CorrelationB2.11.0000.2670.3490.3600.4870.2880.4650.3280.4440.2650.4380.3610.491
B2.20.2671.0000.4380.5520.2590.5420.3740.4870.3280.5010.2980.4480.339
B2.30.3490.4381.0000.4080.3100.4530.4740.3210.5230.3470.5680.3840.471
B2.40.3600.5520.4081.0000.3950.5080.4140.5450.4710.5940.4130.5040.342
B2.50.4870.2590.3100.3951.0000.2750.5160.3760.4420.4260.3840.3370.418
B2.60.2880.5420.4530.5080.2751.0000.2680.6410.4310.5900.5340.5110.397
B2.70.4650.3740.4740.4140.5160.2681.0000.3540.5040.4110.4850.4030.429
B2.80.3280.4870.3210.5450.3760.6410.3541.0000.3780.6160.4300.5860.379
B2.90.4440.3280.5230.4710.4420.4310.5040.3781.0000.3710.5260.4010.569
B2.100.2650.5010.3470.5940.4260.5900.4110.6160.3711.0000.4070.6720.317
B2.110.4380.2980.5680.4130.3840.5340.4850.4300.5260.4071.0000.3880.624
B2.120.3610.4480.3840.5040.3370.5110.4030.5860.4010.6720.3881.0000.364
B2.130.4910.3390.4710.3420.4180.3970.4290.3790.5690.3170.6240.3641.000
Table 16. The communalities for objective 1–B2.
Communalities
Section B2.1–B2.13InitialExtraction
B2.10.4000.416
B2.20.4750.436
B2.30.4720.437
B2.40.5160.531
B2.50.4210.368
B2.60.6040.568
B2.70.4840.470
B2.80.5590.602
B2.90.5020.549
B2.100.6260.680
B2.110.5820.555
B2.120.5380.539
B2.130.5190.553
Extraction method: principal axis factoring.
Table 17. Rotated factor matrix for research objective 1–B2.
Rotated Factor Matrix a
Factor
12
B2.10 Poor quality0.7910.233
B2.8 Poor workflow planning and development0.7270.271
B2.6 Project delays0.6890.305
B2.12 Poor safety standards0.6680.305
B2.4 Reputational damage of an organisation0.6340.359
B2.2 Claims for damage0.6060.264
B2.13 Extension of project delivery time0.2200.711
B2.9 Project overall failure0.2890.682
B2.11 Additional costs0.3190.674
B2.7 Regulatory infringements0.2810.625
B2.1 Stakeholders’ complaints0.1910.616
B2.3 Loss of profit0.3240.576
B2.5 Industrial actions0.2750.541
Extraction method: principal axis factoring. Rotation method: varimax with Kaiser normalization. a. Rotation converged in three iterations.
Table 18. Exploratory factor analysis for research objective 2 (“Interface risk management approaches by organisations.”).
FactorInitial EigenvaluesExtraction Sums of Squared
Loadings
Rotation Sums of Squared
Loadings
Total% of
Variance
Cumulative %Total% of
Variance
Cumulative %Total% of
Variance
Cumulative %
111.46047.74847.74811.12046.33346.3336.37326.55326.553
22.78711.61359.3612.45610.23556.5694.02916.78643.339
31.5816.58965.9501.2725.29861.8673.74015.58258.922
41.2095.03770.9870.8443.51765.3831.5516.46265.383
50.9473.94474.931
60.7413.08978.021
70.5902.45980.479
80.5222.17482.653
90.4942.05784.710
100.4791.99486.704
110.4451.85688.560
120.3761.56890.128
130.3181.32591.452
140.2901.21092.662
150.2581.07593.738
160.2330.97094.708
170.2100.87795.585
180.2000.83596.420
190.1880.78597.204
200.1700.70797.911
210.1510.63198.542
220.1410.58799.129
230.1220.50999.637
240.0870.363100.000
Table 19. Correlation matrices for Section B3.
B3.1B3.2B3.3B3.4B3.5B3.6B3.7B3.8B3.9B3.10B3.11B3.12B3.13B3.14B3.15B3.16B3.17B3.18B3.19B3.20B3.21B3.22B3.23B3.24
B3.11.0000.3700.5810.2650.4830.2660.5590.2580.5370.3800.5600.2850.4800.3970.5280.3460.4280.3160.5230.3720.4880.3940.4760.353
B3.20.3701.0000.4340.7050.4490.4970.3810.4680.2860.4640.3340.4550.2640.5070.2540.4770.3480.4650.3510.4430.3550.4470.2630.425
B3.30.5810.4341.0000.4150.7140.3620.5360.3400.4550.3070.4950.2960.4660.3360.5600.3740.5700.3660.5760.3780.5480.3320.5820.295
B3.40.2650.7050.4151.0000.4680.5850.3670.4940.3760.5030.2980.5040.2870.5060.1930.4780.4130.4890.3510.4290.3480.3820.2860.398
B3.50.4830.4490.7140.4681.0000.4230.5610.3870.5360.3850.5720.3470.5320.4160.5080.3840.5910.3840.5680.3900.5920.2650.5070.238
B3.60.2660.4970.3620.5850.4231.0000.4300.6390.4550.6900.4240.6360.4140.6400.2960.5110.3350.4010.2880.4240.3100.4310.3620.513
B3.70.5590.3810.5360.3670.5610.4301.0000.5850.5360.4190.6540.3810.5610.4260.5110.3560.4800.3100.4620.2920.4770.2780.5220.277
B3.80.2580.4680.3400.4940.3870.6390.5851.0000.3160.6500.3980.5470.4010.5920.2830.4740.2600.3940.2120.3180.2140.4180.2860.376
B3.90.5370.2860.4550.3760.5360.4550.5360.3161.0000.4850.6580.4300.6550.4150.5300.3570.5600.3250.5320.3320.5040.4230.5860.382
B3.100.3800.4640.3070.5030.3850.6900.4190.6500.4851.0000.5010.7410.4500.7370.3280.5900.3500.5060.2910.4560.3120.5440.3750.490
B3.110.5600.3340.4950.2980.5720.4240.6540.3980.6580.5011.0000.5650.6880.4640.6520.3500.6020.2950.5910.3710.5900.3420.6300.368
B.120.2850.4550.2960.5040.3470.6360.3810.5470.4300.7410.5651.0000.3780.7210.3310.5430.3220.4830.3060.4790.3050.5320.4080.537
B3.130.4800.2640.4660.2870.5320.4140.5610.4010.6550.4500.6880.3781.0000.4830.7570.3970.5900.3520.5640.3300.5090.2960.5090.221
B3.140.3970.5070.3360.5060.4160.6400.4260.5920.4150.7370.4640.7210.4831.0000.4020.6910.3960.5800.3820.5440.3530.6100.3890.544
B3.150.5280.2540.5600.1930.5080.2960.5110.2830.5300.3280.6520.3310.7570.4021.0000.3760.5990.3250.6160.3440.5790.3030.5440.237
B3.160.3460.4770.3740.4780.3840.5110.3560.4740.3570.5900.3500.5430.3970.6910.3761.0000.5290.7240.5010.6480.4190.5910.3560.464
B3.170.4280.3480.5700.4130.5910.3350.4800.2600.5600.3500.6020.3220.5900.3960.5990.5291.0000.4500.8300.4440.7950.3580.5850.253
B3.180.3160.4650.3660.4890.3840.4010.3100.3940.3250.5060.2950.4830.3520.5800.3250.7240.4501.0000.5550.7980.4190.6240.3570.539
B3.190.5230.3510.5760.3510.5680.2880.4620.2120.5320.2910.5910.3060.5640.3820.6160.5010.8300.5551.0000.5340.8520.4000.5930.310
B3.200.3720.4430.3780.4290.3900.4240.2920.3180.3320.4560.3710.4790.3300.5440.3440.6480.4440.7980.5341.0000.4650.6190.3630.547
B3.210.4880.3550.5480.3480.5920.3100.4770.2140.5040.3120.5900.3050.5090.3530.5790.4190.7950.4190.8520.4651.0000.3630.5680.310
B3.220.3940.4470.3320.3820.2650.4310.2780.4180.4230.5440.3420.5320.2960.6100.3030.5910.3580.6240.4000.6190.3631.0000.5120.738
B3.230.4760.2630.5820.2860.5070.3620.5220.2860.5860.3750.6300.4080.5090.3890.5440.3560.5850.3570.5930.3630.5680.5121.0000.534
B3.240.3530.4250.2950.3980.2380.5130.2770.3760.3820.4900.3680.5370.2210.5440.2370.4640.2530.5390.3100.5470.3100.7380.5341.000
Table 20. Communalities for research objective 2–B3.
Communalities
B3.1–B3.24InitialExtraction
B3.10.6040.446
B3.20.5990.575
B3.30.6770.576
B3.40.6530.671
B3.50.6620.649
B3.60.6700.645
B3.70.6680.589
B3.80.6670.609
B3.90.6500.581
B3.100.7420.732
B3.110.7760.759
B3.120.7240.664
B3.130.7350.641
B3.140.7380.715
B3.150.6870.628
B3.160.6960.633
B3.170.7940.729
B3.180.7870.741
B3.190.8520.856
B3.200.7100.685
B3.210.7870.720
B3.220.7140.699
B3.230.6720.579
B3.240.6870.569
Extraction method: principal axis factoring.
Table 21. Rotated factor matrix for research objective 2–B3.
Factor a
1234
B3.110.7700.3900.105−0.053
B3.190.765−0.1040.4340.267
B3.150.7640.1590.141−0.007
B3.170.7400.0120.3100.291
B3.210.735−0.0400.3270.266
B3.130.7280.3230.088−0.001
B3.230.6650.2090.301−0.043
B3.90.6610.3420.166−0.011
B3.50.6390.2370.0820.422
B3.30.6360.1560.1430.356
B3.70.6180.4190.0020.179
B3.10.6000.2040.1930.081
B3.100.2340.7400.3510.081
B3.80.1900.7040.1370.240
B3.60.2160.6930.2480.238
B3.120.2230.6780.3900.044
B3.140.2530.6380.4790.120
B3.180.2110.2100.7570.281
B3.200.2560.1810.7330.221
B3.220.2140.3650.720−0.031
B3.160.2530.3530.6150.257
B3.240.1740.4100.608−0.036
B3.40.1590.4600.2700.601
B3.20.1790.4140.3030.529
Extraction method: principal axis factoring. Rotation method: varimax with Kaiser normalization. a: rotation converged in nine iterations.
Table 22. Total variance explained for research objective 3–B4 (“The causes of interface risks”).
FactorInitial EigenvaluesExtraction Sums of Squared
Loadings
Rotation Sums of Squared
Loadings
Total% of
Variance
Cumulative %Total% of
Variance
Cumulative %Total% of
Variance
Cumulative %
19.58750.46050.4609.20448.44348.4434.82025.36725.367
21.96010.31760.7761.5688.25156.6944.00721.08946.456
31.1946.28567.0610.8214.32061.0142.76614.55861.014
40.8564.50771.569
50.6973.66975.237
60.6403.37078.607
70.5612.95481.561
80.4702.47684.036
90.4292.25586.292
100.3882.04188.332
110.3531.85690.188
120.3311.74091.928
130.3231.70193.629
140.2721.43395.062
150.2351.23596.297
160.2251.18597.482
170.1901.00098.481
180.1680.88399.364
190.1210.636100.000
Table 23. Communalities for research objective 3–B4.
Communalities
InitialExtraction
B4.10.5510.556
B4.20.5600.500
B4.30.6250.578
B4.40.6240.542
B4.50.6120.598
B4.60.5880.588
B4.70.6790.719
B4.80.6240.569
B4.90.6170.598
B4.100.6580.727
B4.110.6500.605
B4.120.7020.719
B4.130.6210.541
B4.140.5720.515
B4.150.7040.663
B4.160.6720.649
B4.170.7860.687
B4.180.7320.591
B4.190.6790.647
Extraction method: principal axis factoring.
Table 24. Rotated factor matrix for research objective 3–B4.
Rotated Factor Matrix a
Factor
123
B4.7 Poor understanding of the construction project process among project stakeholders0.7750.3160.135
B4.3 Procurement delays0.6900.2420.207
B4.1 Poor workflow planning and development0.6880.2400.158
B4.5 Poor inventories0.6760.2520.280
B4.9 Ineffective communication in site layout changes with stakeholders0.6690.3860.040
B4.11 Neglecting the handover process between two activities involving different trades in the planning stage0.6590.2080.357
B4.15 Absence of contractors in project coordination meetings0.6300.2440.454
B4.17 Absence of suppliers and vendors in project coordination meetings0.6270.1050.531
B4.19 Contractors’ negative attitudes toward project stakeholders0.5800.1950.521
B4.10 Disorganized construction supply chain management0.2550.8050.121
B4.6 Lack of knowledge sharing0.2360.7170.136
B4.8 Not updating changes in site layout with stakeholders0.2840.6700.200
B4.14 Incompetency0.1910.6600.206
B4.4 Unpredictable and low delivery reliability0.3250.6350.180
B4.2 Subcontractors’ negative attitudes towards teamwork0.1160.5680.404
B4.12 Excluding subcontractors during the planning stage of a project0.2050.5070.648
B4.18 Absence of vendors in project coordination meetings0.3500.3320.598
B4.16 Absence of subcontractors in project coordination meetings0.2010.5220.580
B4.13 Clients’ negative attitudes toward project stakeholders0.4910.1190.535
Extraction method: principal axis factoring. Rotation method: varimax with Kaiser normalization. a: rotation converged in 11 iterations.
Table 25. Reliability statistics for research objective 1–B2 (“The consequences of poor and ineffective interface risk management approaches.”).
Reliability Statistics
Cronbach’s AlphaN of Items
0.90713
Table 26. Item-total statistics for research objective 1.
Item-Total Statistics
Scale Mean if Item DeletedScale Variance if Item DeletedCorrected Item-Total CorrelationCronbach’s Alpha if Item Deleted
B2.148.8041.9320.5440.904
B2.248.7841.4200.5770.902
B2.348.4641.9160.6060.901
B2.448.7540.4330.6660.898
B2.549.0041.3820.5540.904
B2.648.5941.2530.6530.899
B2.749.0841.1210.6150.901
B2.848.6841.1780.6560.899
B2.948.6640.7440.6500.899
B2.1048.9041.3280.6670.899
B2.1148.5741.3350.6620.899
B2.1248.8141.4200.6450.900
B2.1348.6441.6240.6180.901
Table 27. Reliability statistics for research objective 2–B3 (“What are the interface risk management approaches by organisation?”).
Reliability Statistics
Cronbach’s AlphaN of Items
0.95224
Table 28. Item-total statistics for research objective 2.
Item-Total Statistics
Scale Mean if Item
Deleted
Scale Variance if Item DeletedCorrected Item-
Total Correlation
Cronbach’s Alpha if Item Deleted
B3.193.35152.1700.6110.950
B3.293.66151.4990.5880.950
B3.393.66148.6070.6580.950
B3.493.72151.0570.5950.950
B3.593.63147.6950.6840.949
B3.693.43150.2070.6430.950
B3.793.35149.9820.6590.950
B3.893.47150.6620.5760.951
B3.993.45149.4350.6760.949
B3.1093.41150.8810.6820.949
B3.1193.34148.8340.7270.949
B3.1293.32151.6210.6540.950
B3.1393.49149.1140.6740.949
B3.1493.45150.3270.7190.949
B3.1593.49149.6530.6410.950
B3.1693.63151.2050.6830.949
B3.1793.66147.7160.7100.949
B3.1893.65151.0620.6510.950
B3.1993.73147.4840.7150.949
B3.2093.69150.8220.6420.950
B3.2193.64149.0360.6830.949
B3.2293.39151.8960.6300.950
B3.2393.23149.9650.6720.950
B3.2493.27152.8960.5740.951
Table 29. Reliability statistics for research objective 3–B4 (“The causes of interface risks.”).
Reliability Statistics
Cronbach’s AlphaN of Items
0.94519
Table 30. Item-total statistics for research objective 3–B4 (“The causes of interface risks.”).
Item-Total Statistics
Scale Mean if Item DeletedScale Variance if Item DeletedCorrected Item-
Total Correlation
Cronbach’s Alpha if Item Deleted
B4.172.1999.7010.6450.942
B4.272.48100.0060.5770.943
B4.372.4598.0820.6720.942
B4.472.5198.6830.6460.942
B4.572.4796.9660.7050.941
B4.672.2399.4130.6060.943
B4.772.2597.7000.7300.941
B4.872.4698.5830.6440.942
B4.972.1398.6310.6540.942
B4.1072.2398.9450.6540.942
B4.1172.5497.6420.7050.941
B4.1272.6596.6590.7120.941
B4.1372.4497.9730.6270.943
B4.1472.23100.3150.5780.943
B4.1572.4596.6900.7520.940
B4.1672.5498.5050.6870.942
B4.1772.8495.3380.7030.941
B4.1872.9995.8380.6920.942
B4.1972.5297.5250.7250.941
Table 31. Reliability statistics for research objective 1–B2–factor 1.
Reliability Statistics
Cronbach’s AlphaN of Items
0.8806
Table 32. Reliability statistics for research objective 1–B2–factor 2.
Reliability Statistics
Cronbach’s AlphaN of Items
0.8617
Table 33. Reliability statistics for research objective 2–B3–factor 1.
Reliability Statistics
Cronbach’s AlphaN of Items
0.94112
Table 34. Reliability statistics for research objective 2–B3–factor 2.
Reliability Statistics
Cronbach’s AlphaN of Items
0.9035
Table 35. Reliability statistics for research objective 2–B3–factor 3.
Reliability Statistics
Cronbach’s AlphaN of Items
0.8955
Table 36. Reliability statistics for research objective 2–B3–factor 4.
Reliability Statistics
Cronbach’s AlphaN of Items
0.8262
Table 37. Reliability statistics for research objective 3–B4–factor 1.
Reliability Statistics
Cronbach’s AlphaN of Items
0.9269
Table 38. Reliability statistics for research objective 3–B4–factor 2.
Reliability Statistics
Cronbach’s AlphaN of Items
0.8816
Table 39. Reliability statistics for research objective 3–B4–factor 3.
Reliability Statistics
Cronbach’s AlphaN of Items
0.8364
Disclaimer/Publisher’s Note: The statements, opinions and data contained in all publications are solely those of the individual author(s) and contributor(s) and not of MDPI and/or the editor(s). MDPI and/or the editor(s) disclaim responsibility for any injury to people or property resulting from any ideas, methods, instructions or products referred to in the content.

