
Assessment of Urban Land Use and Cover on Groundwater Recharge and Quality

 ,
,  ,
,  ,
,  and
and
Abstract
:1. Introduction
1.1. Importance of Groundwater
1.2. Estimation of Recharge
1.3. Importance of Groundwater for Australia
1.4. Objectives
2. Materials and Methodology
2.1. Study Area
2.2. Site Selection for Boreholes and Their Development
2.3. Hydrogeology
2.4. Soil Sampling and Analysis
2.5. Acquisition of Water Table Depths
2.6. Water Table Fluctuation Method
2.7. Water Samples Collection and Analysis
3. Result and Discussion
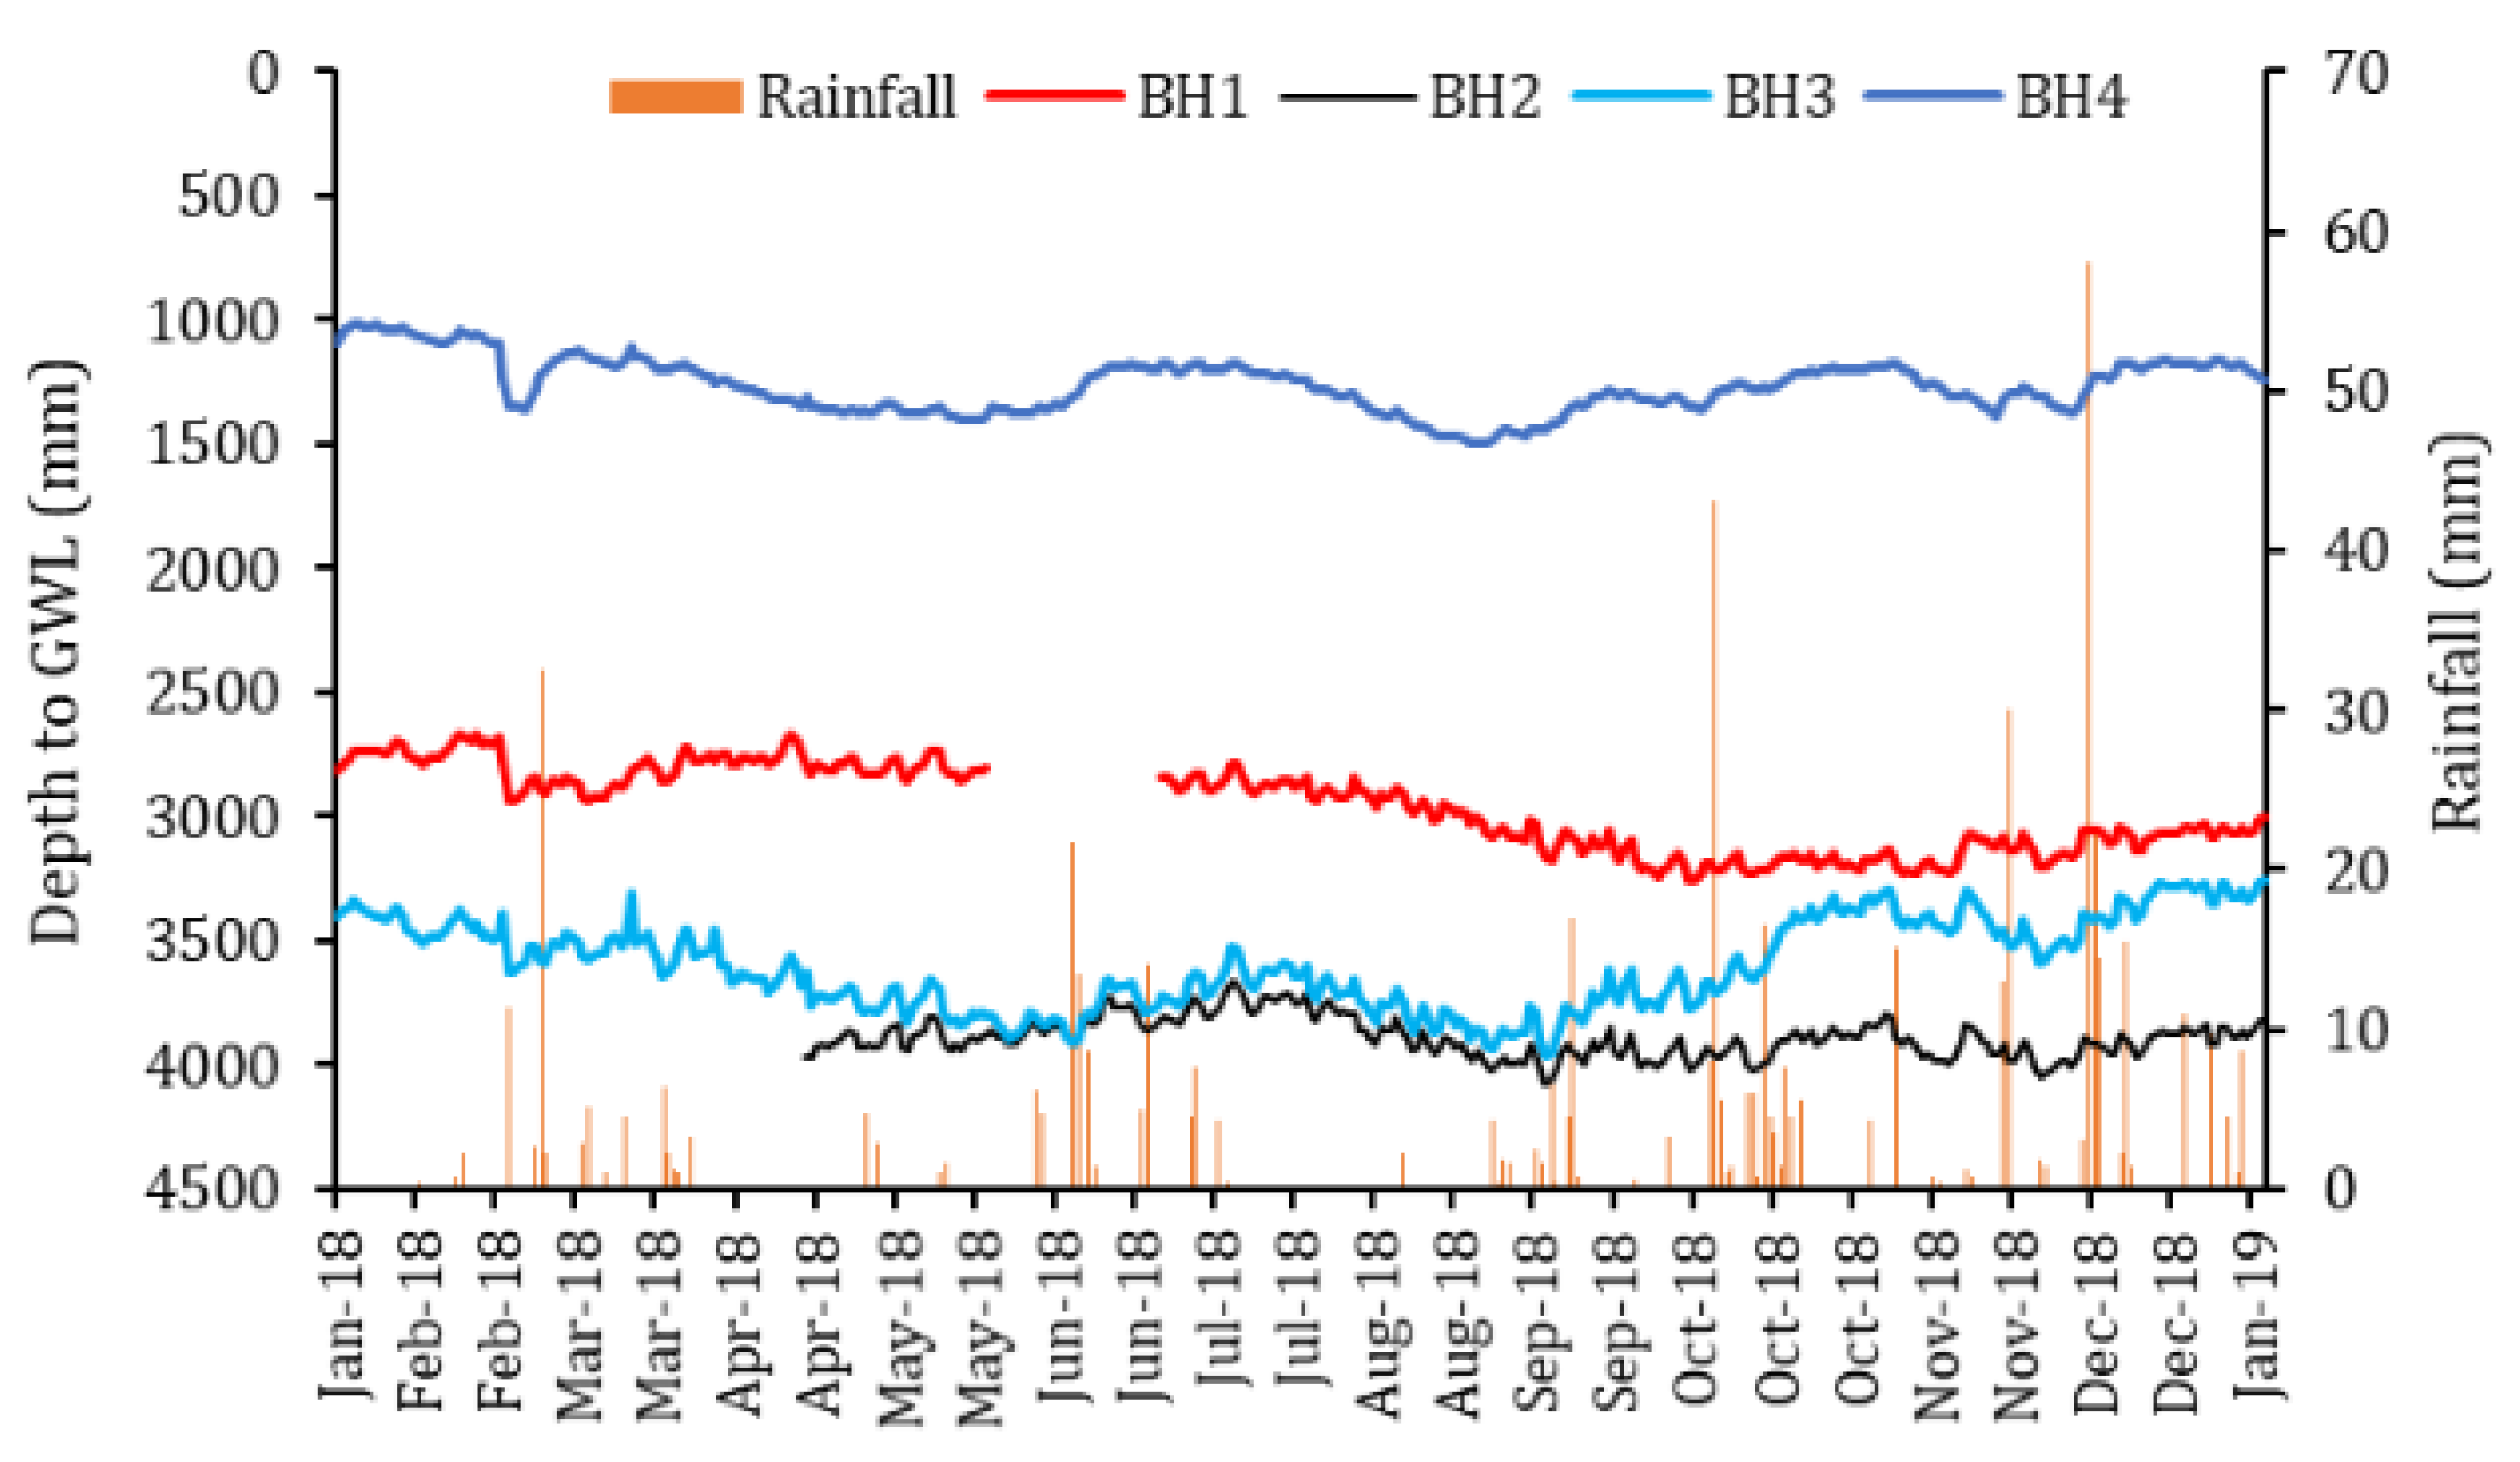
3.1. Daily Groundwater-Level Fluctuations
3.2. Soil Classification
3.3. Specific Yield Estimation
3.4. Daily Groundwater Recharge Estimate
3.5. Physico-Chemical Analysis of Borewell Water
3.6. Variation of Groundwater Quality and Its Suitability as Drinking Water Supply
3.7. Groundwater Quality for Use as Irrigation Water
3.8. Hydrogeochemical Analysis
3.9. Correlation Analysis
4. Conclusions
Author Contributions
Funding
Data Availability Statement
Acknowledgments
Conflicts of Interest
References
- Gatto, E.; Lanzafame, M. Water resource as a factor of production-water use and economic growth. In Proceedings of the 5th ERSA Conference, Amsterdam, The Netherlands, 23–27 August 2005. [Google Scholar]
- Lerner, D.N.; Harris, B. The relationship between land use and groundwater resources and quality. Land Use Policy 2009, 26, S265–S273. [Google Scholar] [CrossRef]
- Chinnasamy, P.; Maheshwari, B.; Dillon, P.; Purohit, R.; Dashora, Y.; Soni, P.; Dashora, R. Estimation of specific yield using water table fluctuations and cropped area in a hardrock aquifer system of Rajasthan, India. Agric. Water Manag. 2018, 202, 146–155. [Google Scholar] [CrossRef]
- Garcia-Fresca, B.; Sharp, J.M. Hydrogeologic considerations of urban development: Urban-induced recharge. Rev. Eng. Geol. 2005, 16, 123–136. [Google Scholar]
- Tubau, I.; Vázquez-Suñé, E.; Carrera, J.; Valhondo, C.; Criollo, R. Quantification of groundwater recharge in urban environments. Sci. Total Environ. 2017, 592, 391–402. [Google Scholar] [CrossRef]
- Thomas, A.; Tellam, J. Modelling of recharge and pollutant fluxes to urban groundwaters. Sci. Total Environ. 2006, 360, 158–179. [Google Scholar] [CrossRef] [PubMed]
- Appleyard, S. The impact of urban development on recharge and groundwater quality in a coastal aquifer near Perth, Western Australia. Hydrogeol. J. 1995, 3, 65–75. [Google Scholar] [CrossRef]
- Pant, N.; Rai, S.P.; Singh, R.; Kumar, S.; Saini, R.K.; Purushothaman, P.; Nijesh, P.; Rawat, Y.S.; Sharma, M.; Pratap, K. Impact of geology and anthropogenic activities over the water quality with emphasis on fluoride in water scarce Lalitpur district of Bundelkhand region, India. Chemosphere 2021, 279, 130496. [Google Scholar] [CrossRef] [PubMed]
- Wu, X.; Zhang, W.; Du, S.; Shi, X.F.; Yu, X.; Huan, Y.; Wang, H.; Jiao, X. Migration and transformation of manganese during the artificial recharging of a deep confined aquifer. Arab. J. Geosci. 2016, 9, 1–12. [Google Scholar] [CrossRef]
- Pant, N.; Dubey, R.K.; Bhatt, A.; Rai, S.P.; Semwal, P.; Mishra, S. Soil erosion and flood hazard zonation using morphometric and morphotectonic parameters in Upper Alaknanda river basin. Nat. Hazards 2020, 103, 3269–3301. [Google Scholar] [CrossRef]
- Smith, M.; Cross, K.; Paden, M.; Laban, P. Spring—Managing Groundwater Sustainably; IUCN: Gland, Switzerland, 2016.
- Groundwater Monitoring Event; Environmental Strategies Pty Ltd.: Liverpool, Australia, 2015; Available online: https://www.prysmiancable.com.au/wp-content/uploads/2016/03/Groundwater-Monitoring-Liverpool-Jan-2015.pdf (accessed on 28 April 2019).
- Oliveira, P.T.; Leite, M.B.; Mattos, T.; Nearing, M.A.; Scott, R.L.; de Oliveira Xavier, R.; da Silva Matos, D.M.; Wendland, E. Groundwater recharge decrease with increased vegetation density in the Brazilian cerrado. Ecohydrology 2017, 10, e1759. [Google Scholar] [CrossRef]
- Scanlon, B.R.; Reedy, R.C.; Stonestrom, D.A.; Prudic, D.E.; Dennehy, K.F. Impact of land use and land cover change on groundwater recharge and quality in the southwestern US. Glob. Change Biol. 2005, 11, 1577–1593. [Google Scholar] [CrossRef]
- Todd, D.K.; Mays, L.W. Groundwater Hydrology Edition; Wiley: Hoboken, NJ, USA, 2005. [Google Scholar]
- Tompson AF, B.; Carle, S.F.; Rosenberg, N.D.; Maxwell, R.M. Analysis of groundwater migration from artificial recharge in a large urban aquifer: A simulation perspective. Water Resour. Res. 1999, 35, 2981–2998. [Google Scholar] [CrossRef]
- Adelana, M. Understanding of Groundwater Recharge for Sustainable Water Resource Management in Northern Victoria: A Review; Project number 104237; Department of Primary Industries: Melbourne, Australia, 2011.
- Lerner, D.N. Identifying and quantifying urban recharge: A review. Hydrogeol. J. 2002, 10, 143–152. [Google Scholar] [CrossRef]
- Yang, Y.; Lerner, D.; Barrett, M.; Tellam, J. Quantification of groundwater recharge in the city of Nottingham, UK. Environ. Geol. 1999, 38, 183–198. [Google Scholar] [CrossRef]
- Lee, L.J.E.; Lawrence, D.S.L.; Price, M. Analysis of water-level response to rainfall and implications for recharge pathways in the Chalk aquifer, SE England. J. Hydrol. 2006, 330, 604–620. [Google Scholar] [CrossRef]
- Krzeminska, D.; Bogaard, T.; Debieche, T.; Cervi, F.; Marc, V.; Malet, J.P. Field investigation of preferential fissure flow paths with hydrochemical analysis of small-scale sprinkling experiments. Earth Surf. Dyn. 2014, 2, 181–195. [Google Scholar] [CrossRef] [Green Version]
- Healy, R.W.; Cook, P.G. Using groundwater levels to estimate recharge. Hydrogeol. J. 2002, 10, 91–109. [Google Scholar] [CrossRef]
- Crosbie, R.S.; Binning, P.; Kalma, J.D. A time series approach to inferring groundwater recharge using the water table fluctuation method. Water Resour. Res. 2005, 41, 1–9. [Google Scholar] [CrossRef]
- Cai, Z.; Ofterdinger, U. Analysis of groundwater-level response to rainfall and estimation of annual recharge in fractured hard rock aquifers, NW Ireland. J. Hydrol. 2016, 535, 71–84. [Google Scholar] [CrossRef] [Green Version]
- Crosbie, R.S.; Peeters, L.J.; Herron, N.; Mcvicar, T.R.; Herr, A. Estimating groundwater recharge and its associated uncertainty: Use of regression kriging and the chloride mass balance method. J. Hydrol. 2018, 561, 1063–1080. [Google Scholar] [CrossRef]
- Watson, A.; Miller, J.; Fleischer, M.; De Clercq, W. Estimation of groundwater recharge via percolation outputs from a rainfall/runoff model for the Verlorenvlei estuarine system, west coast, South Africa. J. Hydrol. 2018, 558, 238–254. [Google Scholar] [CrossRef] [Green Version]
- Varni, M.; Comas, R.; Weinzettel, P.; Dietrich, S. Application of the water table fluctuation method to characterize groundwater recharge in the Pampa plain, Argentina. Hydrol. Sci. J. 2013, 58, 1445–1455. [Google Scholar] [CrossRef] [Green Version]
- Harrington, N.; Cook, P. Groundwater in Australia; National Centre for Groundwater Research and Training: Bedford Park, SA, Australia, 2014. [Google Scholar]
- Water NSW, Western Sydney Borefields Project: Groundwater and Aquifers. 2019. Available online: Https://www.waternsw.com.au/_data/assets/pdf_file/0005/151277/Factsheet-_Groundwater-and-Aquifers.pdf (accessed on 20 July 2020).
- Sundaram, B.; Feitz, A.; De Caritat, P.; Plazinska, A.; Brodie, R.; Coram, J.; Ransley, T. Groundwater sampling and analysis—A field guide. Geosci. Aust. Rec. 2009, 27, 95. [Google Scholar]
- Wattle Grove, New South Wales. 2022. Available online: https://en.wikipedia.org/wiki/Wattle_Grove,_New_South_Wales (accessed on 10 April 2022).
- BOM Australian Groundwater Insight. Available online: http://www.bom.gov.au/water/groundwater/insight/#/hydrogeology/aquifer/upper (accessed on 29 April 2019).
- Hagare, D.; Natarajan, S.K.; Maheshwari, B.L.; Hessam, I.; Joyia, U.-T.; Rajanayake, M. Stormwater management through urban lakes. World Water Stormwater Manag. 2015, 22–26. [Google Scholar]
- Natarajan, S.K.; Hagare, D.; Maheshwari, B. Understanding socio-economic benefits of stormwater management system through urban lakes in Western Sydney, Australia. Ecohydrol. Hydrobiol. 2018, 18, 412–419. [Google Scholar] [CrossRef]
- Google Maps. Available online: https://www.google.com.au/maps/place/Wattle+Grove+NSW+2173/@-33.9533842,150.9387474,15.25z/data=!4m5!3m4!1s0x6b129573ed5b3db7:0x5017d681632cef0!8m2!3d-33.9492164!4d150.9424079?hl=en-GB (accessed on 5 June 2022).
- Branagan, D.F.; Packham, G.H. Geology of New South Wales, 3rd ed.; Department of Mineral Resources: Sydney, Australia, 2000; p. 418.
- Downes, P.M.; Pogson, D.J.; Nix, L.; Robson, D.; Sherwin, L. World-Class Mineral Deposits of the Lachlan Orogen, New South Wales—Australia; ASEG2004 Excursion Guide, Geological Survey of New South Wales, Report No. 2004/297; ASEG: Sydney, Australia, 2004. [Google Scholar] [CrossRef]
- Brinckerhoff, P. Remediation Action Plan for UPSS Replacement Moorebank Service Station (7-Eleven), Moorebank, NSW. 2014. Available online: https://www.liverpool.nsw.gov.au/trim/documents?Recordnumber=228536.2014 (accessed on 3 November 2016).
- Australian Government. Hydrogeological Characteristics of Geological Formations in the Hunter Subregion. 2015. Available online: https://www.bioregionalassessments.gov.au/assessments/11-context-statement-hunter-subregion/1141-groundwater-systems (accessed on 20 June 2020).
- Commonwealth Department of Transport and Regional Development, Australia. Geology, Soils and Water. 1997. Available online: https://www.westernsydneyairport.gov.au/sites/default/files/Draft_Environmental_Impact_Statement_1997_Second_Sydney_Airport_Proposal_Technical_Paper_7_Geology_Soils_and_Water.pdf (accessed on 5 January 2019).
- Brinckerhoff, P. Phase 1 Environmental Site Assessment Report for Moorebank Intermodal Terminal. 2014. Available online: https://simta.com.au/wordpress/wp-content/uploads/2016/07/054-Technical-Paper-5_-Environmental-Site-Assessment-Part-B.pdf (accessed on 3 November 2016).
- Australian Government. Hydrogeological Characteristics of the Sydney Basin Bioregion. 2018. Available online: https://www.bioregionalassessments.gov.au/assessments/11-context-statement-sydney-basin-bioregion/1141-groundwater-systems (accessed on 26 June 2020).
- Australian Standards. Methods of Testing Soils for Engineering Purposes. Method 3.6.1, Soil Classification Tests: Determination of the Particle Size Distribution of a Soil—Standard Method of Analysis by Sieving/[Prepared by Committee CE-009, Testing of Soils for Engineering Purposes], 2nd ed.; Standards Australia: Sydney, Australia, 2009. [Google Scholar]
- Scanlon, B.R.; Healy, R.W.; Cook, P.G. Choosing appropriate techniques for quantifying groundwater recharge. Hydrogeol. J. 2002, 10, 18–39. [Google Scholar] [CrossRef]
- Song, J.; Chen, X. Variation of specific yield with depth in an alluvial aquifer of the Platte River valley, USA. Int. J. Sediment Res. 2010, 25, 185–193. [Google Scholar] [CrossRef]
- Richards, L.A. Diagnosis and Improvement of Saline and Alkaline Soils; US Department of Agriculture: Washington, WA, USA, 1954; 160p.
- García-Gaines, R.A.; Frankenstein, S. USCS and the USDA Soil Classification System: Development of a Mapping Scheme; US Army Corps of Engineers: Washington, WA, USA, 2015. Available online: https://usace.contentdm.oclc.org/digital/collection/p266001coll1/id/3757/ (accessed on 15 February 2022).
- Zomorodi, K. Quantifying Groundwater Recharge from Detention Basins to Forested Buffers in New Jersey. In Proceedings of the International Congress on Watershed Management for Water Supply Systems, New York, NY, USA, 29 June–2 July 2003; American Water Resources Association: Middleburg, VA, USA, 2003. [Google Scholar]
- Sacks, L.A.; Swancar, A.; Lee, T.M. Estimating Ground-Water Exchange with Lakes Using Water-Budget and ChemicalMass-Balance Approaches for Ten Lakes in Ridge Areas of Polk and Highlands Counties, Florida; Water-Resources Investigations Report 98-4133; US Geological Survey: Reston, VA, USA, 1998. [Google Scholar]
- EMM. 2015–2016 Groundwater and Surface Water Monitoring Report: Camden Gas Project; EMM Consulting: Sydney, Australia, 2016; Available online: https://www.agl.com.au/-/media/aglmedia/documents/about-agl/how-we-source-energy/camden/camden-document-repository/groundwater-monitoring-reports/nov-18/j16141rp1_fy15-16-annual-water-monitoring-report_v02.pdf?la=en&hash=04F2EF8488B225E2C5E7D8E826FECA79 (accessed on 5 January 2019).
- WHO. Guidelines for Drinking-Water Quality, 4th ed.; World Health Organization: Geneva, Switzerland, 2011. [Google Scholar]
- National Health and Medical Research Council (Australia). Australian Drinking Water Guidelines 6: National Water Quality Management Strategy; Commonwealth of Australia: Sydney, Australia, 2011.
- Rhoades, J.D.; Kandiah, A.; Mashili, A.M. The Use of Saline Waters for Crop Production; FAO irrigation and drainage paper 48; FAO: Rome, Italy, 1992; Chapter 2. [Google Scholar]
- Chukwu, O. Analysis of groundwater pollution from abattoir waste in Minna, Nigeria. Res. J. Diary Sci. 2008, 2, 74–77. [Google Scholar]
- Kumar, M.; Kumari, K.; Ramanathan, A.; Saxena, R. A comparative evaluation of groundwater suitability for irrigation and drinking purposes in two intensively cultivated districts of Punjab, India. Environ. Geol. 2007, 53, 553–574. [Google Scholar] [CrossRef]
- Ackah, M.; Agyemang, O.; Anim, A.K.; Osei, J.; Bentil, N.O.; Kpattah, L.; Gyamfi, E.T.; Hanson, J.E. Assessment of groundwater quality for drinking and irrigation: The case study of Teiman-Oyarifa Community, Ga East Municipality, Ghana. Proc. Int. Acad. Ecol. Environ. Sci. 2011, 1, 186. [Google Scholar]
- Idoko, O.M. Seasonal variation in iron in rural groundwater of Benue State, middle belt, Nigeria. Pak. J. Nutr. 2010, 9, 892–895. [Google Scholar] [CrossRef]
- Fisher, R.S.; Davidson, O.B.; Goodman, P.T. Summary and Evaluation of Groundwater Quality in the Upper Cumberland, Lower Cumberland, Green, Tradewater, Tennessee, and Mississippi River Basins; Kentucky Geological Survey; University of Kentucky: Lexington, Kentucky, 2004. [Google Scholar]
- Wilcox, L.V. The Quality of Water for Irrigation Use; US Department of Agricultural Technical Bulletin: Washington, WA, USA, 1948.
- Hassen, I.; Hamzaoui-Azaza, F.; Bouhlila, R. Application of multivariate statistical analysis and hydrochemical and isotopic investigations for evaluation of groundwater quality and its suitability for drinking and agriculture purposes: Case of Oum Ali-Thelepte aquifer, central Tunisia. Environ. Monit. Assess. 2016, 188, 135. [Google Scholar] [CrossRef] [PubMed]
- Kalpana, L.; Elango, L. Assessment of groundwater quality for drinking and irrigation purpose in Pambar River sub-basin, Tamil Nadu. Indian J. Environ. 2013, 33, 1–8. [Google Scholar]
- Gowd, S.S. Assessment of groundwater quality for drinking and irrigation purposes: A case study of Peddavanka watershed, Anantapur District, Andhra Pradesh, India. Environ. Geol. 2005, 48, 702–712. [Google Scholar] [CrossRef]
- Rahman, M.M.; Hagare, D.; Maheshwari, B.; Dillon, P. Impacts of prolonged drought on salt accumulation in the root zone due to recycled water irrigation. J. Water Air Soil Pollut. 2015, 226, 90–108. [Google Scholar] [CrossRef]


| Name | Hole Diameter (mm) | Cased Hole Diameter (mm) | Metres Drilled (m) | Total Well Depth (m) | Sand (m) | Bentonite (m) | Ground Elevat-Ion (m) AHD * | North (m) | East (m) |
|---|---|---|---|---|---|---|---|---|---|
| BH1 | 125 | 50 | 12 | 12 | 7 | 2.5 | 15.011 | 6,240,566.436 | 309,614.595 |
| BH2 | 125 | 50 | 10.5 | 10 | 7.5 | 2 | 12.500 | 6,241,201.568 | 309,873.334 |
| BH3 | 125 | 50 | 10.5 | 10 | 7.5 | 2 | 11.860 | 6,241,445.934 | 309,781.393 |
| BH4 | 125 | 50 | 9 | 8.8 | 7 | 2 | 9.075 | 6,241,560.538 | 309,541.895 |
| Month | No. of Days | Rainfall (mm) | BH1 (mm) | BH2 (mm) | BH3 (mm) | BH4 (mm) | Average Differences (mm) |
|---|---|---|---|---|---|---|---|
| February-2018 | 28 | 52.4 | −82.9 | −27.7 | −135.4 | −82.00 | |
| March-2018 | 31 | 28 | 49.67 | −113.2 | −97.47 | −53.67 | |
| April-2018 | 30 | 7.8 | −68.83 | −215.27 | −92.53 | −125.54 | |
| May-2018 | 31 | 13.6 | 46.9 | 46.73 | −54.1 | −8.37 | 7.79 |
| June-2018 | 30 | 77 | −66.93 | 89 | 154.1 | 174.8 | 87.74 |
| July-2018 | 31 | 4.8 | −36.5 | −69.13 | −64.03 | −162.53 | −83.05 |
| August-2018 | 31 | 10.6 | −84.1 | −24.4 | 26.4 | −67.5 | −37.40 |
| September-2018 | 30 | 37.8 | −276.8 | −136.3 | −49.03 | 66.37 | −98.94 |
| October-2018 | 31 | 116.4 | 27 | 110.6 | 359.43 | 144.7 | 160.43 |
| November-2018 | 30 | 65.8 | 98 | −63.9 | −99.57 | −99.63 | −41.28 |
| December-2018 | 31 | 120.2 | 73.2 | 105.9 | 231.1 | 133.1 | 135.83 |
| January-2019 | 31 | 66.2 | 40.5 | −32.27 | −98.43 | −108.97 | −49.79 |
| February-2019 | 28 | 49.2 | 53.6 | −36.6 | −131.9 | −133.1 | −62.00 |
| Parameters | BH1 | BH2 * | BH3 | BH4 |
|---|---|---|---|---|
| Average Specific Yield (%) | 41.09 | 31.16 | 37.61 | 31.24 |
| Average abs (ΔH/Δt) no or less rainfall, mm/d | 1.74 | 2.23 | 4.62 | 4.16 |
| Average (ΔH/Δt) High rainfall, mm/d | 1.62 | 3.49 | 9.52 | 4.48 |
| Total ΔH/Δt, mm/d | 3.35 | 5.72 | 14.15 | 8.64 |
| Recharge (R), mm/d | 1.37 | 1.77 | 5.23 | 2.7 |
| Parameters | This Study | WHO [50] | ADWG [51] | Literature Data | ||||||
|---|---|---|---|---|---|---|---|---|---|---|
| BH1 | BH2 | BH3 | BH4 | |||||||
| Denham Court [49] | Menangle Park Site [49] | Glenlee Road [49] | Heathcote [12] | |||||||
| Mean ± SD | Mean ± SD | Mean ± SD | Mean ± SD | |||||||
| pH | 6.48 ± 0.4 | 5.78 ± 0.51 | 5.84 ± 0.61 | 5.54 ± 0.67 | 6.5–8.5 | 6.5–8.5 | 6.46–9.85 | 5.15–10.06 | 7.31–8.35 | 5.31–5.69 |
| DO (mg/L) | 2.8 ± 1.13 | 2.98 ± 0.73 | 3.18 ± 1.12 | 4.41 ± 1.73 | 0.50–2.45 | |||||
| TDS (mg/L) | 13,275.21 ± 1311.23 | 386 ± 116.84 | 768.35 ± 372.41 | 2318 ± 177.53 | 600–1000 | 4580–8510 | 525–693 | 3091–3182 | ||
| Ca (mg/L) | 187.12 ± 41.2 | 6.33 ± 2.15 | 4.08 ± 1.97 | 10.42 ± 4.65 | 100–300 | 7–337 | 3–91 | 36–11 | ||
| Mg (mg/L) | 674.05 ± 120.05 | 22.9 ± 9.98 | 16.18 ± 2.89 | 101.85 ± 5.70 | 100–300 | 3–91 | 2–30 | 64–77 | ||
| Na (mg/L) | 3654.37 ± 543.39 | 138.45 ± 42.51 | 213.94 ± 90.92 | 84.54 ± 62.94 | 200 | 1400–2470 | 100–187 | 991–999 | ||
| K (mg/L) | 27.29 ± 3.4 | 2.02 ± 0.43 | 2.52 ± 1.53 | 2.78 ± 0.48 | 12–29 | 1–13 | 34–38 | |||
| Fe (mg/L) | 3.37 ± 1.95 | 2.73 ± 1.83 | 1.73 ± 2.12 | 0.96 ± 0.62 | 0.3 | 0.3 | 0.05–7.59 | 0.05–3.7 | 0.14–0.76 | |
| EC (µS/cm) | 15,530 ± 2970 | 550 ± 160 | 1430 ± 670 | 2680 ± 1200 | 7058–13,090 | 782–1066 | 4755–4887 | 286–580 | ||
| Turbidity (NTU) | 530.50 ± 231.15 | 222.29 ± 126.97 | 268.67 ± 144.27 | 33.09 ± 31.53 | 5 | 5 | ||||
| SAR | 29.16 ± 3.62 | 5.33 ± 1.83 | 13.37 ± 1.37 | 5.18 ± 3.47 | ||||||
| % Na (%) | 72.80 ± 2.03 | 73.33 ± 7.21 | 88.15 ± 1.00 | 73.65 ± 17.14 | ||||||
| Parameters | Range | Classification | Percentage of Samples (%) | |||
|---|---|---|---|---|---|---|
| BH1 | BH2 | BH3 | BH4 | |||
| Salinity hazard (EC) [61] | <250 | Excellent | - | - | - | - |
| 250–750 | Good | - | 93 | 20 | - | |
| 750–2250 | Permissible | - | 7 | 53 | - | |
| 2250–5000 | Doubtful | - | - | 20 | 100 | |
| >5000 | Unsuitable | 100 | - | - | - | |
| Alkalinity hazard (SAR) [63] | <10 | Excellent | - | 100 | 27 | 93 |
| 10–18 | Good | - | - | 73 | 7 | |
| 18–26 | Doubtful | - | - | - | - | |
| >26 | Unsuitable | 100 | - | - | - | |
| Percent sodium (%Na) [57] | <20 | Excellent | - | 80 | - | - |
| 20–40 | Good | - | - | - | ||
| 40–60 | Permissible | - | 20 | 27 | 20 | |
| 60–80 | Doubtful | - | - | 73 | 80 | |
| >80 | Unsuitable | 100 | - | - | - | |
| EC | TDS | Turbidity | DO | pH | Na | K | Ca | Mg | Fe | |
|---|---|---|---|---|---|---|---|---|---|---|
| EC | 1 | |||||||||
| TDS | 0.812 ** | 1 | ||||||||
| Turbidity | 0.639 ** | 0.483 ** | 1 | |||||||
| DO | −0.313 * | −0.216 | −0.249 | 1 | ||||||
| pH | 0.573 ** | 0.510 ** | 0.515 ** | −0.379 * | 1 | |||||
| Na | 0.148 | 0.301 | 0.009 | 0.423 * | 0.108 | 1 | ||||
| K | 0.321 | 0.418 | −0.073 | −0.244 | 0.387 | −0.364 | 1 | |||
| Ca | 0.372 | 0.409 | −0.030 | −0.222 | 0.428 | −0.374 | 0.984 ** | 1 | ||
| Mg | 0.406 * | 0.405 * | 0.207 | −0.292 | 0.579 ** | −0.203 | 0.783 ** | 0.863 ** | 1 | |
| Fe | −0.369 | −0.240 | −0.407 | 0.119 | −0.150 | −0.015 | 0.330 | 0.267 | −0.123 | 1 |
Publisher’s Note: MDPI stays neutral with regard to jurisdictional claims in published maps and institutional affiliations. |
© 2022 by the authors. Licensee MDPI, Basel, Switzerland. This article is an open access article distributed under the terms and conditions of the Creative Commons Attribution (CC BY) license (https://creativecommons.org/licenses/by/4.0/).
Share and Cite
Hagare, D.; Ezemba, S.N.; Pant, N.; Rahman, M.M.; Maheshwari, B.; Siddiqui, Z. Assessment of Urban Land Use and Cover on Groundwater Recharge and Quality. CivilEng 2022, 3, 480-502. https://doi.org/10.3390/civileng3020029
Hagare D, Ezemba SN, Pant N, Rahman MM, Maheshwari B, Siddiqui Z. Assessment of Urban Land Use and Cover on Groundwater Recharge and Quality. CivilEng. 2022; 3(2):480-502. https://doi.org/10.3390/civileng3020029
Chicago/Turabian StyleHagare, Dharmappa, Sylvester Nnamdi Ezemba, Neeraj Pant, Muhammad Muhitur Rahman, Basant Maheshwari, and Zuhaib Siddiqui. 2022. "Assessment of Urban Land Use and Cover on Groundwater Recharge and Quality" CivilEng 3, no. 2: 480-502. https://doi.org/10.3390/civileng3020029
APA StyleHagare, D., Ezemba, S. N., Pant, N., Rahman, M. M., Maheshwari, B., & Siddiqui, Z. (2022). Assessment of Urban Land Use and Cover on Groundwater Recharge and Quality. CivilEng, 3(2), 480-502. https://doi.org/10.3390/civileng3020029