Article

Analytical Investigation on the Effect of Test Setup on Bond Strength

by
Konstantinos Tsiotsias
* and
Stavroula J. Pantazopoulou
Bergeron Centre for Engineering Excellence, Department of Civil Engineering, Lassonde School of Engineering, York University, 4700 Keele Street, Toronto, ON M3J 1P3, Canada
*
Author to whom correspondence should be addressed.
CivilEng 2021, 2(1), 14-34; https://doi.org/10.3390/civileng2010002
Submission received: 17 November 2020 / Revised: 28 December 2020 / Accepted: 30 December 2020 / Published: 1 January 2021
(This article belongs to the Special Issue Connections in Concrete)

Abstract

:
Experimental procedures used for the study of reinforcement to concrete bond have been hampered for a long time by inconsistencies and large differences in the obtained behavior, such as bond strength and mode of failure, depending on the specimen form and setup used in the test. Bond is controlled by the mechanics of the interface between reinforcement and concrete, and is sensitive to the influences of extraneous factors, several of which underlie, but are not accounted for, in conventional pullout test setups. To understand and illustrate the importance of specimen form and testing arrangement, a series of computational simulations are used in the present work on eight distinct variants of conventional bar pullout test setups that are used routinely in experimental literature for the characterization of bond-slip laws. The resulting bond strength increase generated by unaccounted confining stress fields that arise around the bar because of the boundary conditions of the test setup is used to classify the tests with respect to their relevance with the intended use of the results. Of the pullout setups examined, the direct tension pullout test produced the most conservative bond strength results, completely eliminating the contributions from eccentricity and passive confinement.

1. Introduction

Bond tests are used to support the development of design provisions for reinforcement anchorage in concrete structures for several different applications including: (a) Proof-testing and characterization of new reinforcing products in construction; (b) quantifying a dependable level of characteristic bond strength to be used in design and detailing; and (c) extracting pertinent constitutive bond slip relationships that could be used in either practical design or in numerical simulations of concrete structural members. Bond testing aims to quantify the force that may be developed by bars embedded in concrete over a known contact length.
In the first few decades of bond-related research a common type of test used was the so-called standard pullout test (SPT) [1]. In the SPT, a bar embedded in the center of a concrete prism is pulled out while the concrete block is restricted through bearing on a stationary steel plate (Figure 1a) [2,3]. This type of test is still preferred today due to its simplicity by the steel industry for proof testing and quality control, whereas many researchers use it as a benchmark for the experimental assessment of bond. The contact length of the bar being tested, its location along the embedment length, and the method of supporting the specimen, all contribute to the development or lack thereof, of transverse effects that influence the bond behavior in the pullout test.
Bond strength is obtained indirectly, by dividing the total force carried by the bar (referred to as developed force) by the lateral contact area of the embedment length, Lb, i.e.,
fb,max = Fb/(π·Db·Lb),
The use of Equation (1) relies on the implicit assumption that the distribution of bond stresses over the embedded length is uniform, or that it can be approximated as nearly uniform. This approximation is more realistic in short lengths of embedment, in the range of 3Db–5Db. It has been shown experimentally and analytically that the measured bond strength appears to reduce with the increasing length of embedment [4,5,6,7]. This is owing to the fact that the true distribution decays from the loaded end toward the unloaded end, and, in longer anchorages there is room for redistribution of stresses before the final pullout [8]. For this reason, characterization of bond strength is usually conducted using bonded lengths in the range of 5Db.
The prevalent version of the SPT [2,3,9] comprises a cubic concrete specimen, with dimensions of 10Db, where the bar is placed concentrically, it is bonded over a length of 5Db only, and extends from the specimen surface toward the gripping device [9,10]. Support is provided by a stationary steel plate, which in some cases is equipped with an intermediate layer of Teflon in order to minimize the friction on the bearing surface (SPT-T). The plate bears against the specimen on the cover surface around the bar (Figure 1b). The resisting pressures generated by the supporting plate create a triaxial state of stress in the bar, and longitudinal compression in the concrete [11]. This in turn enhances the interface between the concrete and the bar specimen and produces excessively overestimated measurements of bond strength. Experimental evidence shows that the values obtained from this test are two to three times higher than the values obtained from a variety of other experiments intended to assess the development capacity of a bar anchorage under different boundary conditions [12], and it is recognized implicitly by the early design codes which specified that the design value of bond strength should not exceed 2.25 times the tensile strength of concrete (e.g., [13]).
The most prevalent forms of alternative tests conducted to quantify the development capacity of anchorages and the dependable bond strength of concrete materials are depicted in Figure 1c–h. Through these tests the effect of specimen form and test setup arrangement has been inferred from the collective experimental evidence, but the reasoning is qualitative. The state of stress around the bar, calculated from computational mechanics simulations may be used to unequivocally quantify these effects and interpret the vast differences in the bond strength estimates obtained from the various tests. As new concrete materials are swiftly introduced in design codes in order to address the emerging industry needs (e.g., ultra-high performance fiber-reinforced concrete (UHPFRC)), it is not feasible to build a knowledge base that spans over decades as was done in conventional concrete, so as to secure conservatism of provisions that would be based on a multitude of tests. In this context, it becomes increasingly more important to identify the source and margin of systemic uncertainty in experimental testing of bond that is attributable to the method of testing [14,15]. This objective is pursued in the present study. To illustrate how boundary conditions affect the measured bond strength—slip relationship, the pullout test setups depicted in Figure 1 are compared using consistent nonlinear finite element modeling using the ATENA v5.6 software platform [16]. To eliminate other sources of difference, identical material properties, anchorage length, cover, and bar diameter have been used. Results are gauged by the development capacity of the pulled bar, the characteristics of the obtained load–slip curve, and the commensurate stress fields occurring in the concrete cover, which illustrate clearly the mechanisms responsible for causing the range in the values of resistance obtained from the array of different tests considered. Whereas bond stress is calculated from the force developed by the bar when embedded in concrete, it actually represents the response of the entire system that comprises the test hardware and concrete specimen. Therefore, bond, measured through the tests, is a function of the test arrangement and is not an intrinsic property of the interface. It is one of the primary outcomes of this study to demonstrate the interdependency of the experimental bond setups and the resulting bond strength, through analytical simulation of the mechanics of the problem.

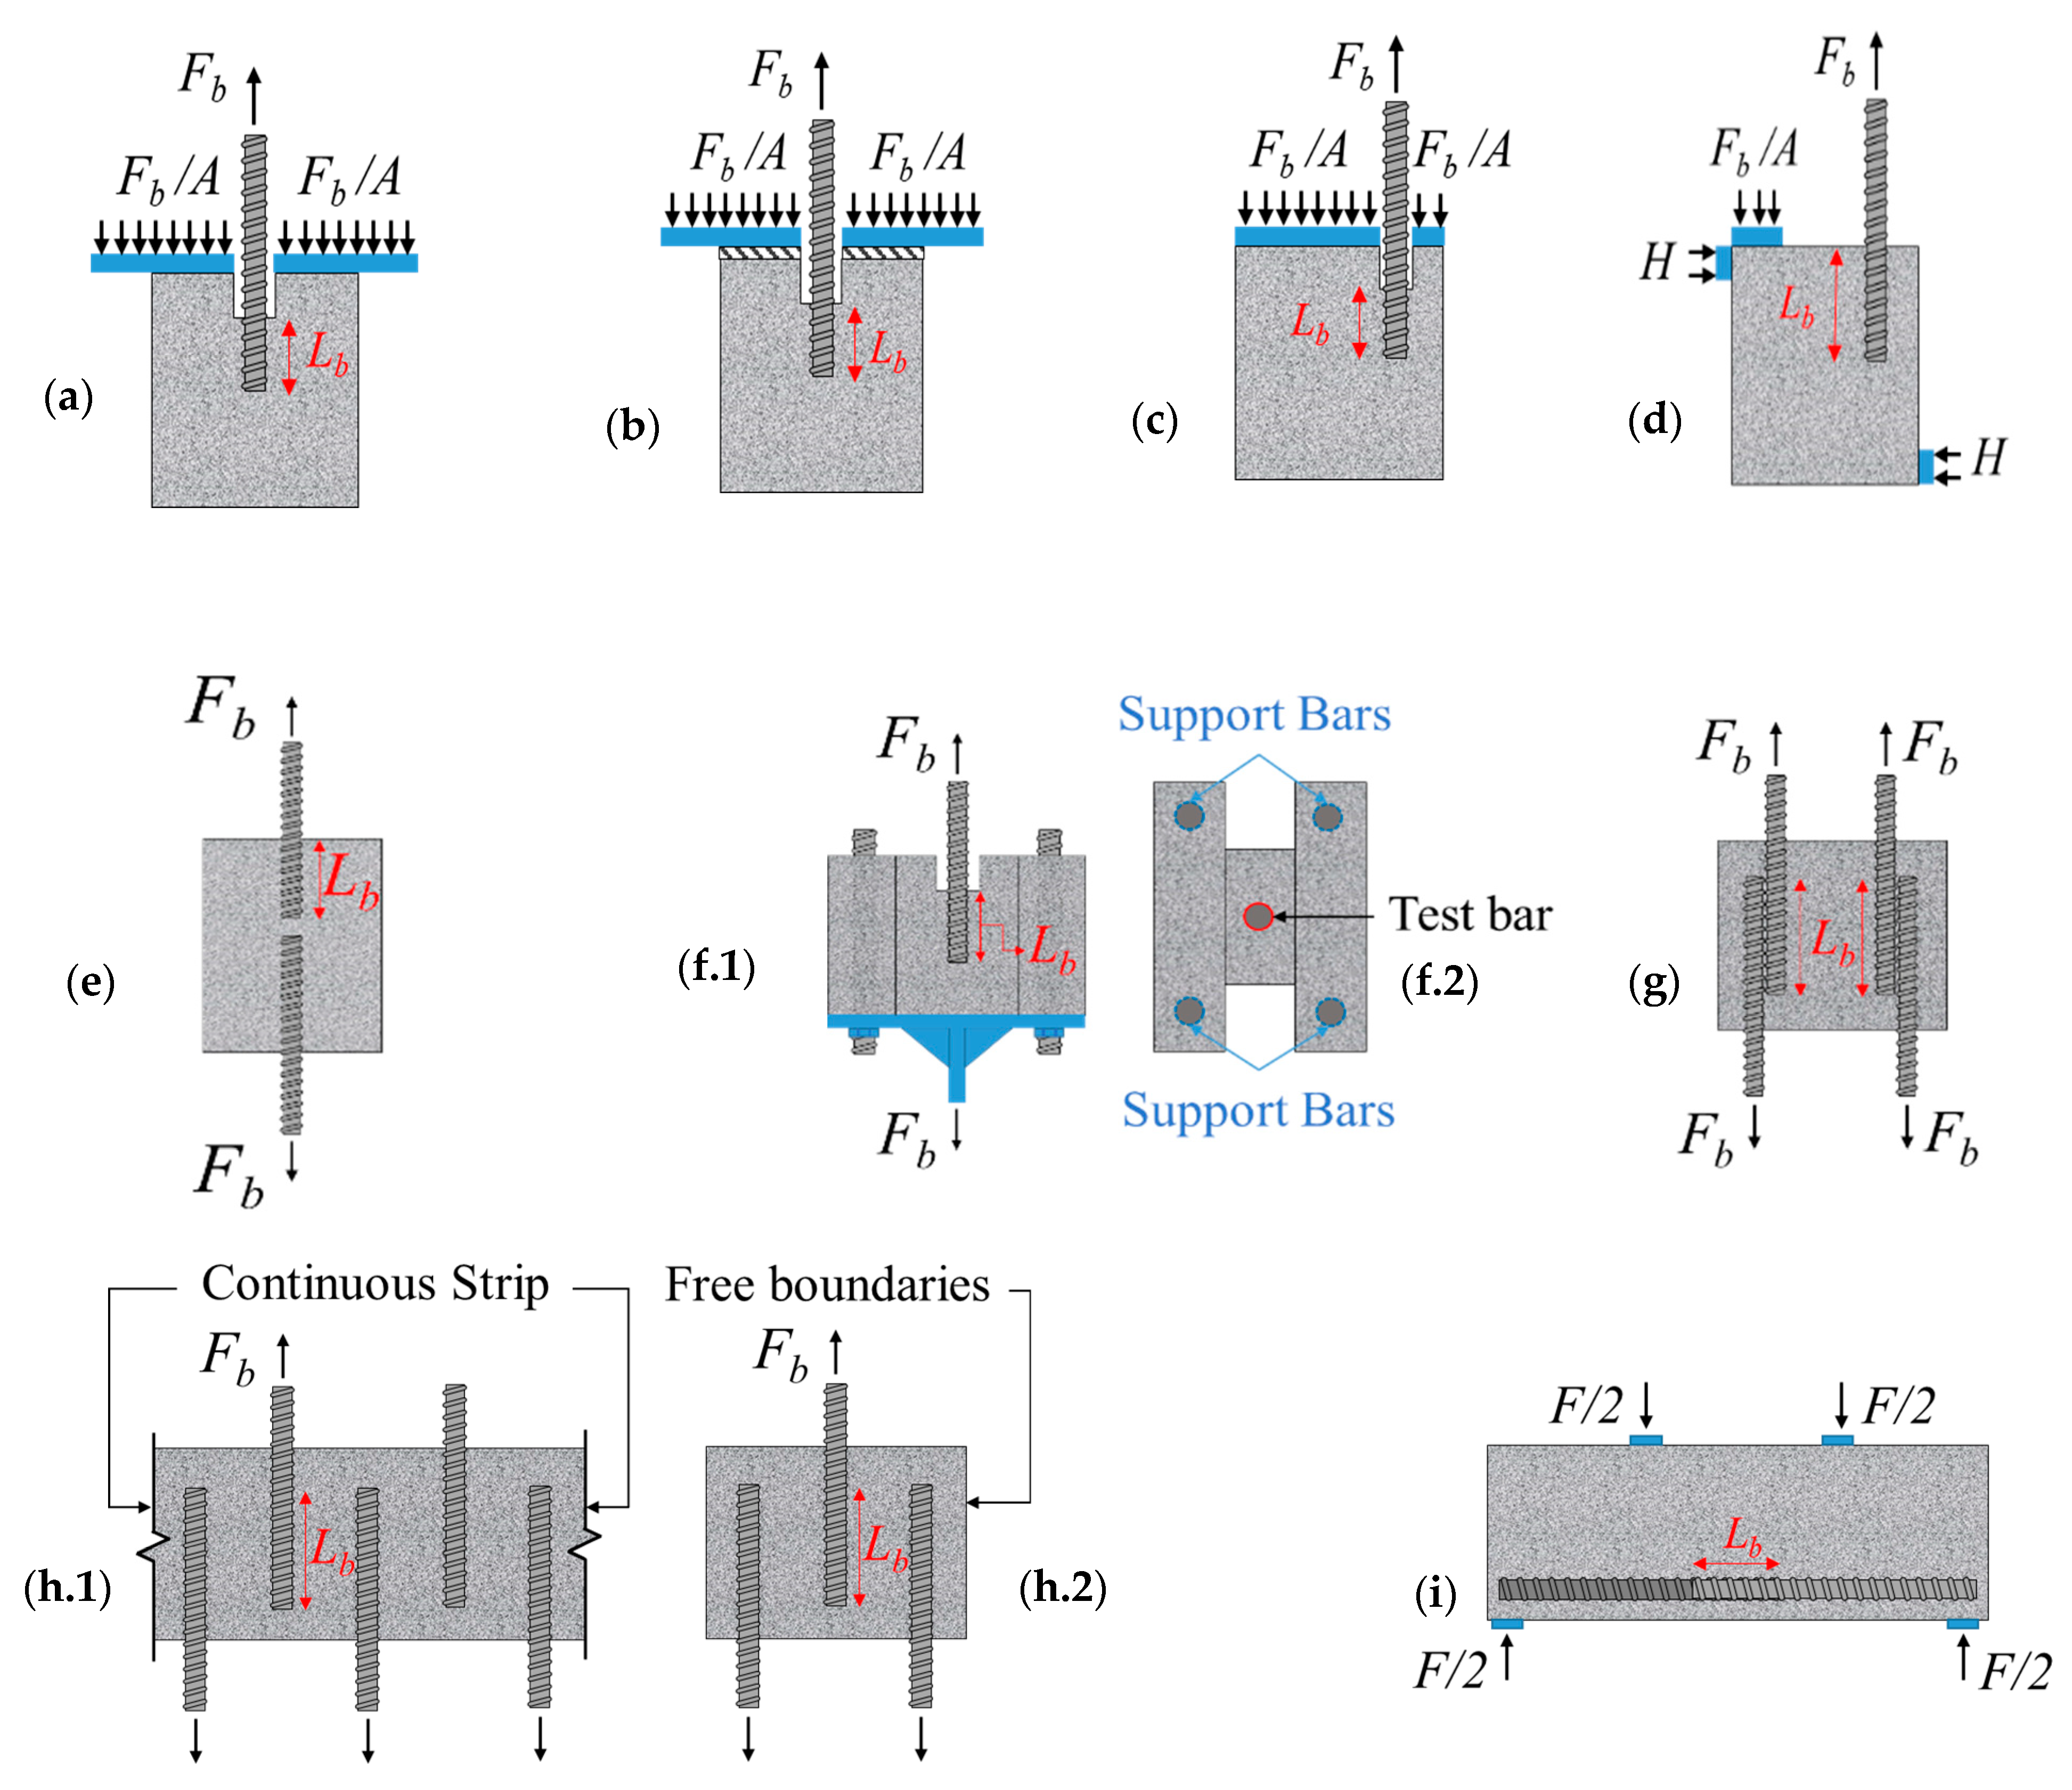
2. Alternative Test Setups Used in the Study of Bond

Alternative versions of the SPT test which have been used extensively in the literature are depicted in Figure 1. In the eccentric pullout test (EPT, Figure 1c), the bar is placed at the desirable cover depth from the surface while the loading and support scheme remain the same as with the SPT [17]; this was intended to represent more accurately the stress conditions encountered in regular structural members under a strain gradient. However, it is still susceptible to overestimating the bond strength, owing to simultaneous compression of the concrete in the proximity of the embedded bar [18,19].
Beam-end tests (BET) have been proposed as an alternative, to eliminate the undesirable compressive stress fields in the concrete of the previous options, while approximating the strain gradient conditions occurring in the cover of flexural members around the anchored tension bars (Figure 1d). These tests are thought to be more conservative than both the SPT-T and EPT [20] and are given precedence for characterization of bond in Europe [21,22]. Still, this test is susceptible to the effects of confining stresses reaching the free end of the bar, due to the inclined compression struts generated between the bearing point and the support due to shear. The compression strut path crosses the bar, causing therefore an unknown magnitude of additional development strength of the anchorage on account of the local normal pressure exerted on the bar surface. Guidelines for the BET are published by [23,24,25].
To ensure the presence of tensile stresses in both the bar and concrete as would occur in the tension zone of a flexural member, and to minimize the unaccounted for mechanisms from contributing to the fundamental bond strength of an embedded bar, direct tension pullout (DTP) tests have been developed to simulate the behavior of a bar anchorage beyond a crack [26,27]. In the direct tension tests, the test bar is anchored in concrete cover that is also under direct tension (Figure 1e) with the help of an auxiliary bar placed co-axially and back to back with the test bar and extending on the opposite side of the concrete block. The cross section of the unreinforced concrete segment between the test and auxiliary bars, either rectangular or circular as controlled by the bar cover, is designed to support the developed bar load in direct tension without failure. This is among the most conservative test setups for bond and relatively easy to conduct; a disadvantage is that it is not possible to monitor the displacements of the free end of the bar. A variation of the DTP setup is shown in Figure 1f, known as “H-shaped” DTP [28]. In this setup, the concrete specimen has an H-shaped cross section, and can be conducted using the standard test setup of the SPT. Here the test bar is placed in the geometric center of the specimen section so that bar cover can be adjusted and studied, whereas support is provided by four longitudinal rods extending through the outer corners of the section, fastened on a metallic plate on the bottom side of the specimen (Figure 1f). A small groove is provided between the web of the H-shape and the steel plate to eliminate any form of interaction with the setup in the test region.
Alternative setups similar to DTPT involve spliced connections under direct tension loading (Figure 1g) comprising two pairs of contact-lapped bars [29]. Bars protruding from each side of the specimen are connected to a tension-testing frame through pertinent gripping hardware. Splitting stresses and the bond strength of the spliced zone are evaluated in a direct tensile environment, while the risk of failure of the unreinforced concrete central region of the DTPT and the curvature effects of the BET and the LSBT are now eliminated. Yuan and Graybeal [30] evaluated the bond behavior of bars embedded in high-performance concrete using a new type of specimen. This comprises a longitudinal concrete strip and supported on the vertical bars (support bars) extending from the strip’s foundation and extending over a significant embedment length through the height of the strip. Bond is studied through another set of vertical parallel bars embedded from above into the concrete strip, extending over a test anchorage length (test bars) and spaced longitudinally at distances of four times the clear spacing between the test bar and the support bars [30], thereby creating a sequence of non-contact splice arrangements (Figure 1h). In this test setup, a single test bar is pulled out at a time; a limitation of this setup is the degree or restraint that the continuity of the strip enforces on the dilative pressures generated by the ribs of the pulled bars, at least in the longitudinal axis of the concrete strip, which contributes to partly enhance the experimentally measured bond strength.
The bulk of the data considered in the database of tests that has been used to calibrate design provisions for bond and anchorage were obtained from lap-splice beam tests [12] (LSBT, Figure 1i). The lap-splice is developed in the constant moment region of the beam under four-point bending. From the experimentally measured beam flexural strength in the constant moment region, the developed bar force is obtained either through sectional analysis or by having placed pertinent hinge hardware at the midspan in the compression zone of the specimen, so as to enable accurate definition of the internal lever arm. It has been shown that the state of stress over a lap splice under constant stress as in the case of the LSBT is comparable to that of a bar anchorage [31,32,33,34]; thus, bond strength is obtained from bar development capacity again using Equation (1). The LSBT is conservative and easy to conduct; but its objectivity is obscured by the curvature that coexists in the lap splice zone, where the interaction between bond and flexural mechanisms of behavior is not well understood.

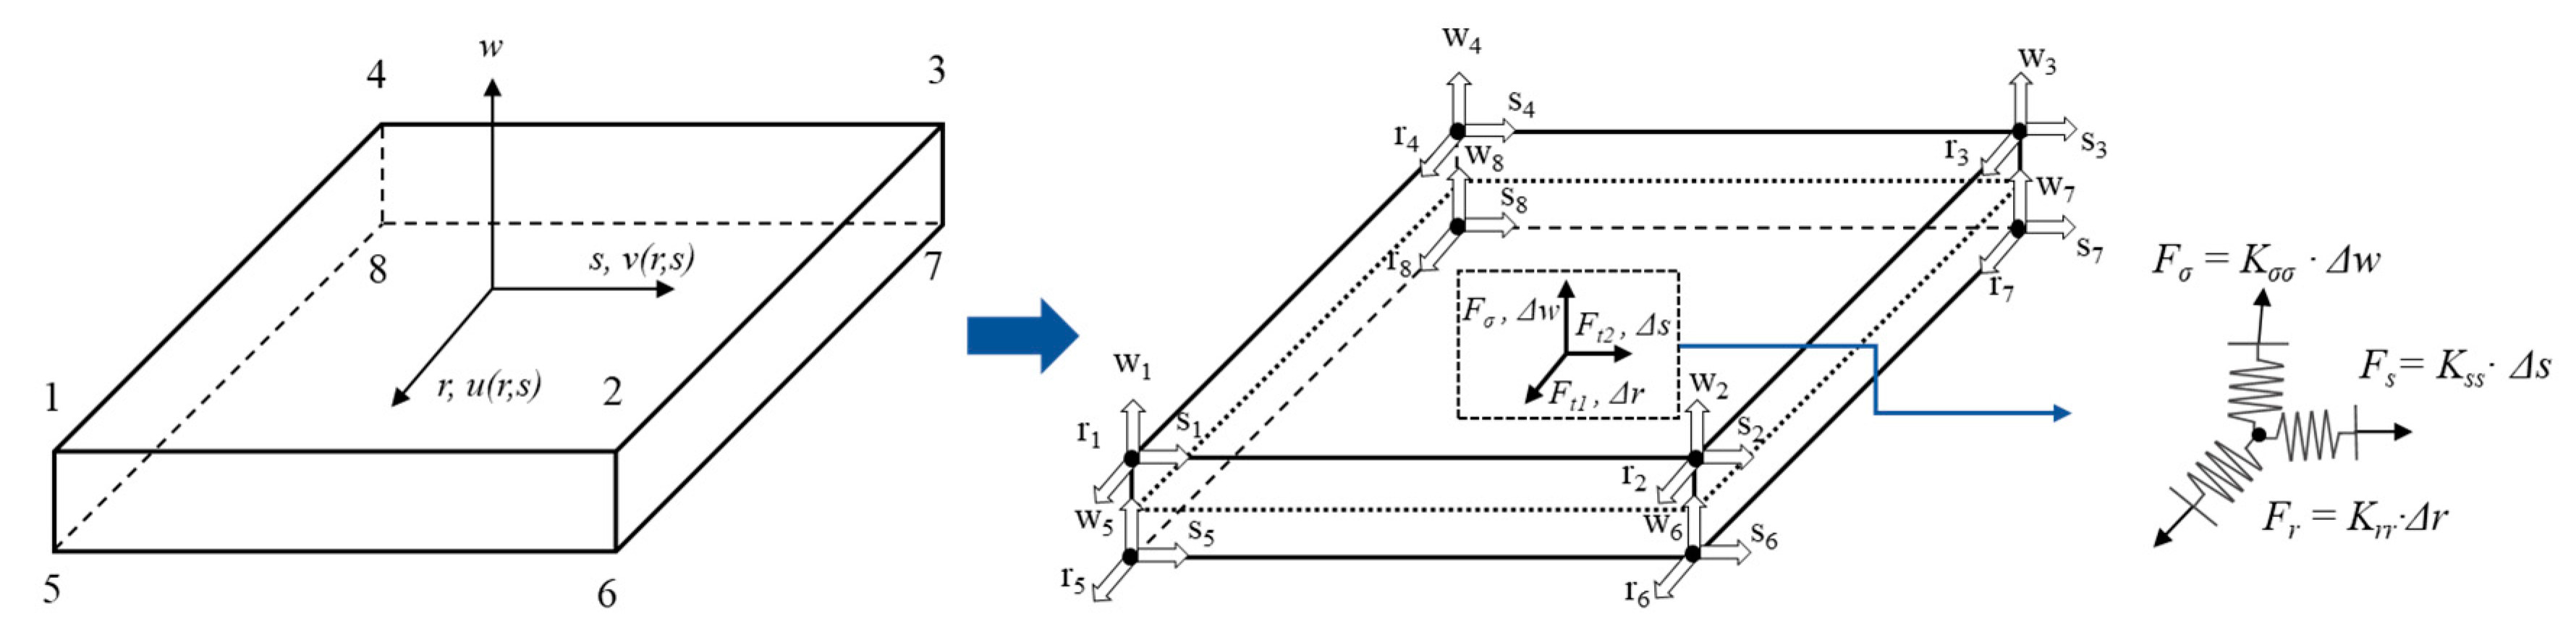
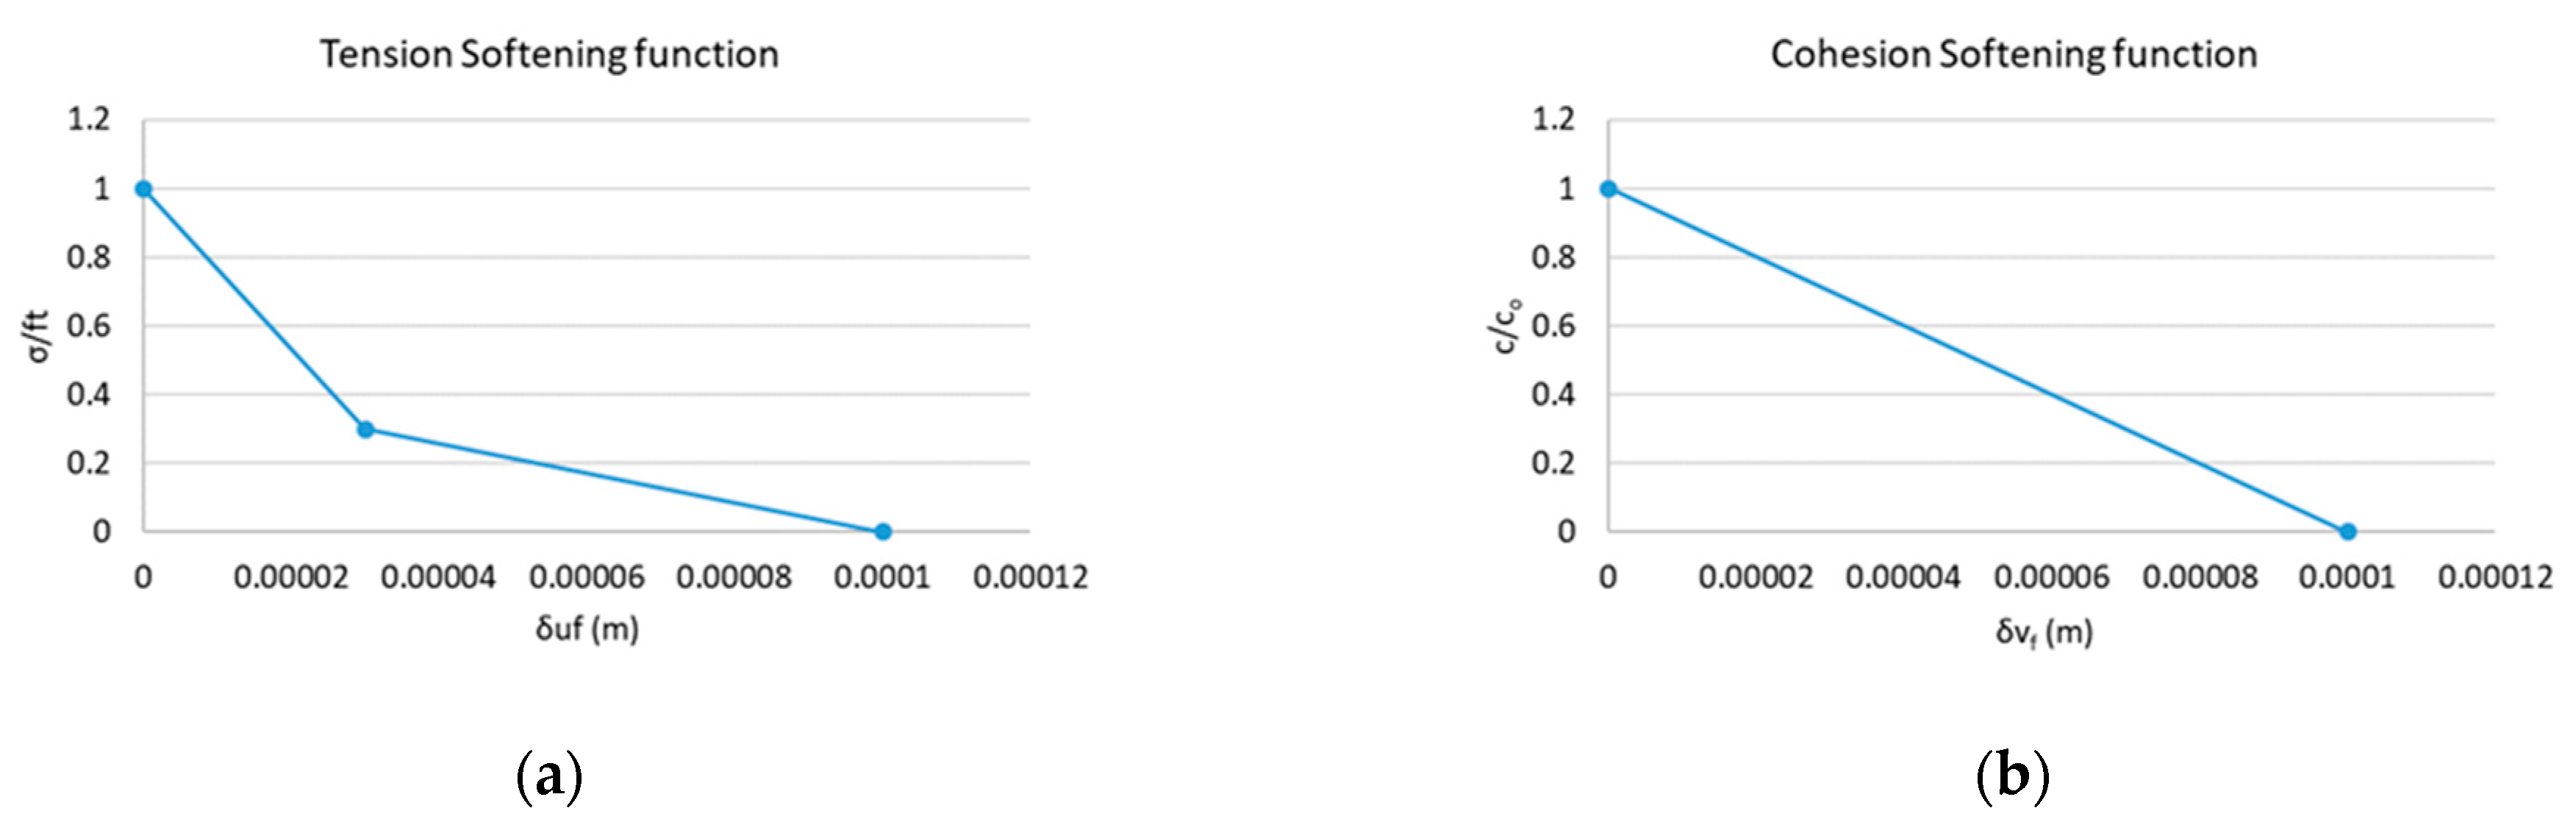
3. Interface Model and Behavior

To illustrate the effects of confinement and lateral stresses resulting from the unaccounted for boundary condition effects acting on the bar, it is imperative for the interface element on the bar surface to have the necessary pressure sensitivity so as to be able to capture the interaction between normal and tangential stresses. Pressure is a result of the dilative behavior of the bar-concrete interface, which displaces radially to accommodate the longitudinal translation of the ribs of a bar during pullout slippage [8,26]. Depending on the kinematic restraint to this lateral translation confinement pressures arise, which in turn enhance (due to the material’s pressure sensitivity) the resistance to longitudinal shear at the bar-concrete interface.
In previous literature, stress transfer between steel and concrete has been modeled using two primary methods: (a) Pointwise bond-link, or shear-lag elements, which contain one-dimensional zero-length springs connecting coincident but discrete nodes between bar and concrete [35,36,37,38]; and (b) zero-thickness contact elements placed on the surfaces of steel and concrete and connected with pairs of coincident but discrete nodes on each side [39,40,41,42]. In the former case, the bars are modeled using truss elements, whereas the local bond stress–slip relationship is specified a-priori by the user, in the form of a local bond stress–slip curve. This approach is computationally inexpensive; however, its primary limitation is the pressure insensitivity of the input bond-slip laws. Thus, the true local bond slip curve may only be calibrated through trial and error by matching the computer results with the experimental ones through adjustment of the input. Multidirectional interface models consider the complete volume both of the bar and the contact surface and are equipped with degrees of freedom that are parallel and orthogonal to the bar axis, thus enabling the simulation of transverse effects acting on the bar [40,43,44,45]. Many versions of multidirectional models exist in the literature some of which are relevant to bond modelling [40,46]. In the present investigation three-dimensional isoparametric gap elements are used, based on the Mohr-Coulomb friction law with an ellipsoidal tension cut-off (CCIsoGap element, [16]). This formulation uses quadrilateral or triangular plane elements, placed on each contact surface and connected with unidirectional springs on each degree of freedom (the general case of a quadrilateral element is shown in Figure 2). Relative displacements are obtained from interpolation between the displacement of the surface nodes on each side of the element, which are subsequently related to the traction forces, Fr and Fs, and the opening force Fσ, through pertinent constitutive relationships, as shown in Equation (2). Variables Κrr and Kss in the matrix of coefficients correspond to the traction stiffness coefficients in the local directions r and s and Kσσ to the normal stiffness coefficient in the local direction w. Δr, Δs, and Δw are the relative displacements between nodal pairs according to their respective directions depicted in Figure 2.
[ F r F s F σ ] = [ Κ r r 0 0 0 Κ s s 0 0 0 K σ σ ]   · [ Δ r Δ s Δ w ] ,
The interaction between normal and tangential stresses on the compression side is defined by the initial Mohr-Coulomb surface, as per Equation (3). For each acting stress component on the interface, a trial stress is placed on the initial surface of the sliding-opening interaction. Upon exceedance of the transverse strength of the interface, the interaction surface reduces to a residual failure surface representing dry friction. On the tension side, the strength curve follows an ellipsoidal form until the maximum value of ft, beyond which complete loss of the normal capacity of the interface and dislocation of the opposite surfaces occurs.
τ = c + σ·tan(φ),
With this approach, radial deformation generated during longitudinal bar translation gives rise to confining stresses produced by the interaction of shear and normal stresses on the bonded interface (Figure 3). A summary of the properties selected for this study are listed in Table 1, while the tension and cohesion softening laws are described in Figure 4; the same properties are used in the analysis of all the cases of test setups considered. For the extent of this study, values were selected such that the mechanical interaction between bar and concrete would be clearly demonstrated; in using this approach an extensive investigation is recommended for the determination of more applicable interface values for specific scenarios (e.g., case of smooth bars, or high rib bars). The values given in Table 1 were based on such a parametric study. Stiffnesses Knn and Ktt correspond to the stiffness coefficient in the normal direction Kσσ, and Krr and Kss in each of the transverse directions, respectively. Tensile strength ft is the outermost limit on the tension side of the failure surface curve and cohesion c is the tangential strength at the initiation of the slipping motion. The friction coefficient tanφ determines the inclination of the failure surface upon exceedance of the cohesive strength of the interface. Two additional stiffness values, namely minimum normal stiffness Knn,min and minimum tangential stiffness Ktt,min, are determined for the program input to maintain positive definiteness after exhaustion of the interface stiffness [16].

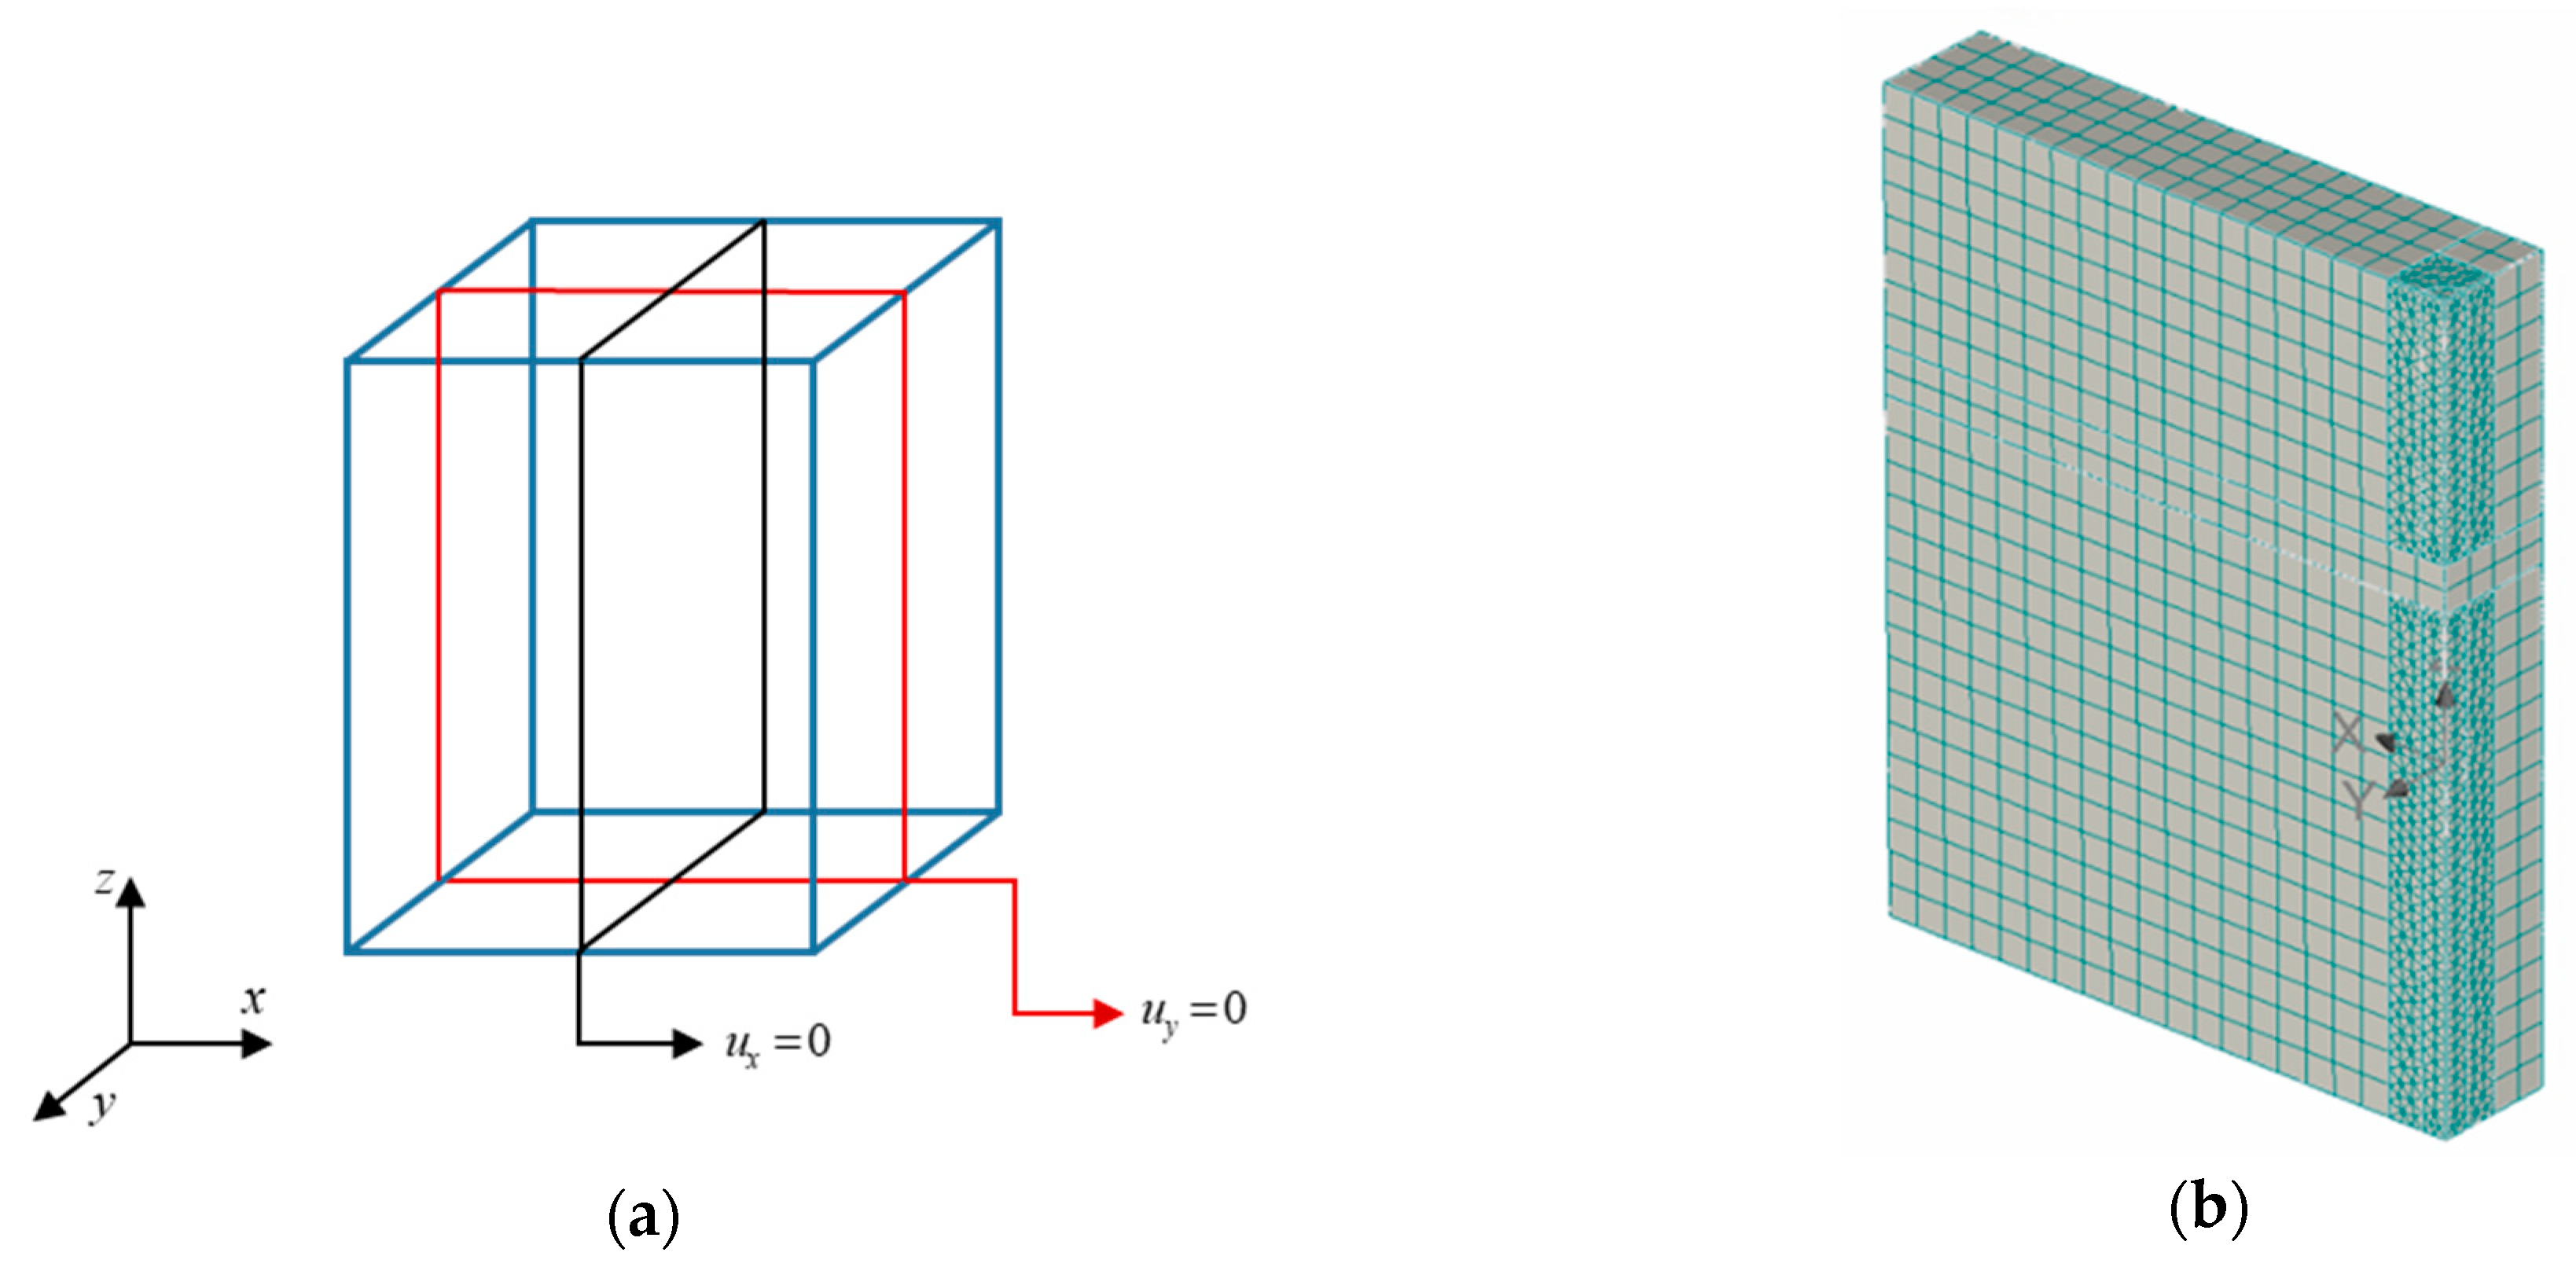
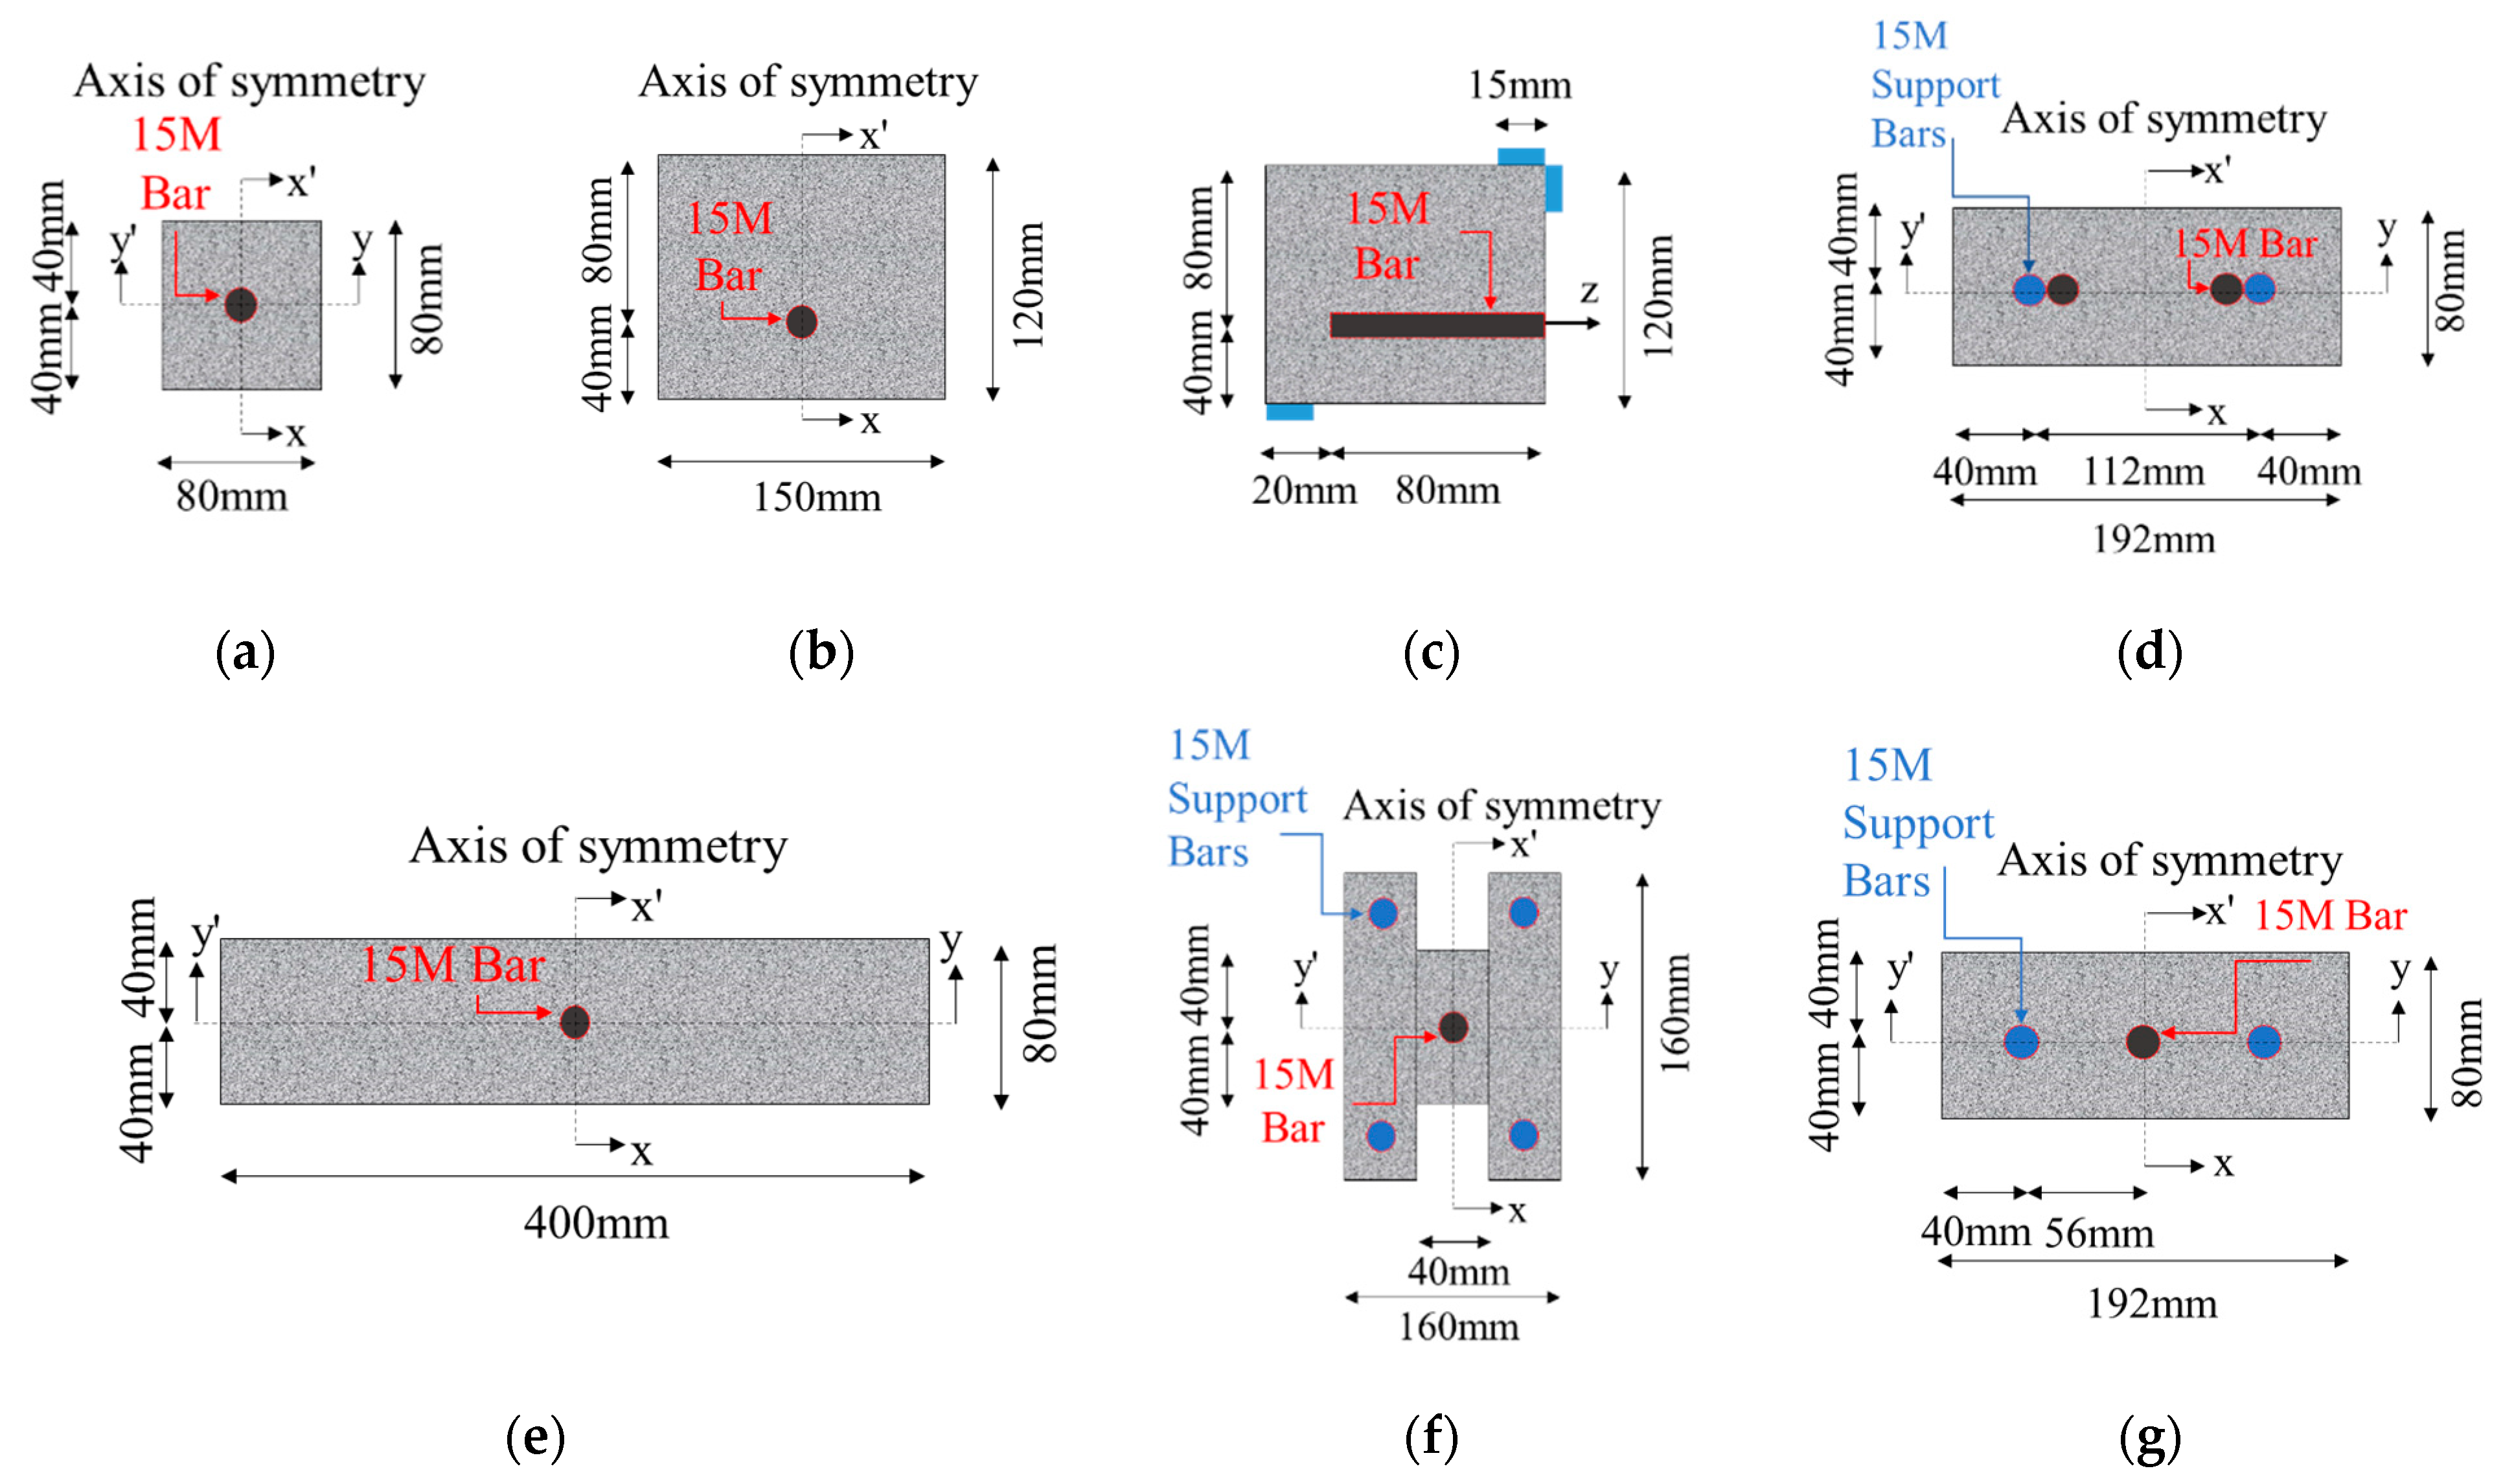
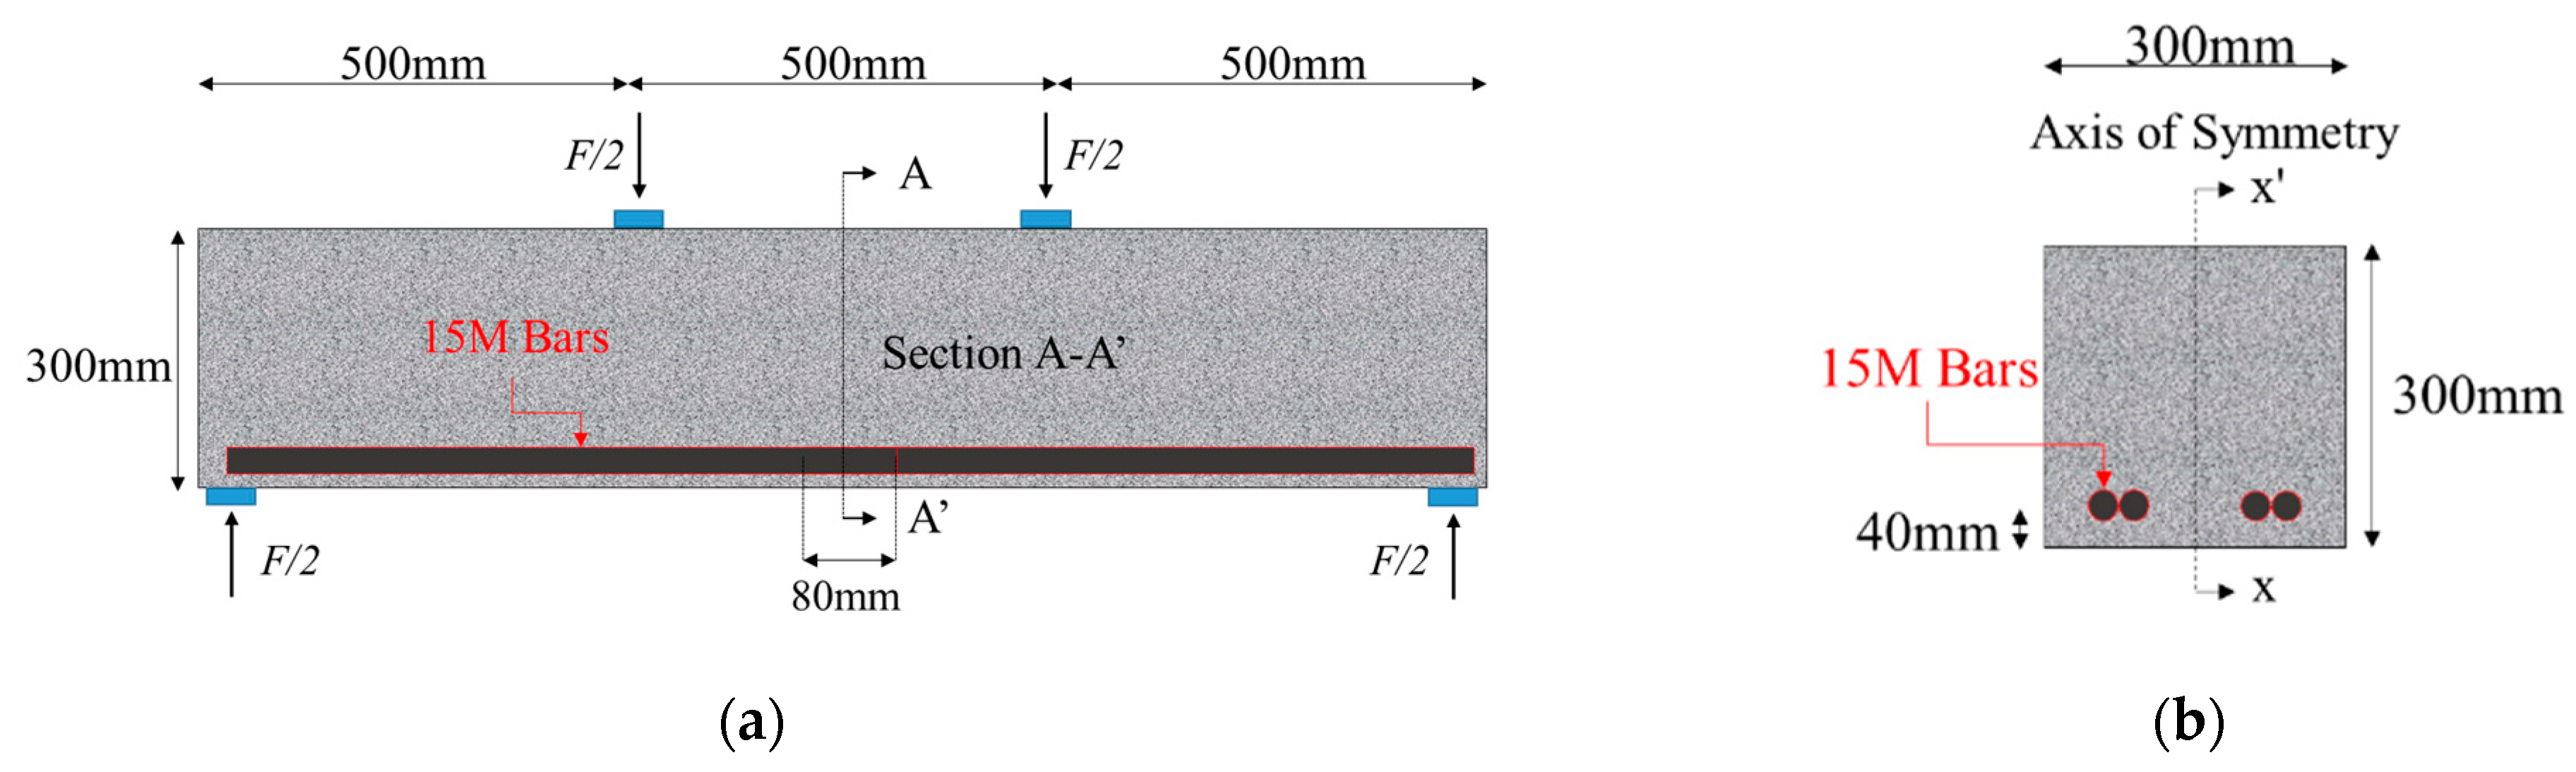
4. Finite Element Models

For every test setup evaluated in this study, brick (CCIsoBrick) and tetrahedral (CCIsoTetra) solid elements were used to model the main body of the concrete and the test bar [16]. Symmetry was utilized, when available, to reduce the high computational effort required by the finer mesh in the finite element zone around the bar; an example model and the corresponding symmetry conditions are shown in Figure 5b.
In all specimen formulations, the same amount of cover, bar diameter, and embedment length were used. The selected values for this parametric study were as follows: the concrete cover was taken equal to 2Db. To ensure that the resulting stress at peak-developed load resembled a uniform distribution, a short embedment length of 5Db was used, whereas in all cases, a 15 M bar (Db = 16 mm) was studied. For the concrete, the material CC3DNonLinCementitious2, a fracture plastic model, was used with the following properties: compressive strength fc = 25 MPa, tensile strength ft = 2.5 MPa, Poisson’s ratio ν = 0.2, elastic modulus E = 25 GPa. Default values were used for the remaining parameters (i.e., a Hognestad-type parabola for the ascending part of the compressive stress strain response, with the onset of plasticity at a compressive stress equal to 0.25fc). For the test bar, the material CC3DBiLinearSteelVonMises was used, which is defined with uniaxial bilinear stress–strain law [16], with a yield strength and elastic modulus taken as σy = 400 MPa and Es = 200 GPa, respectively. Poisson’s ratio ν was assumed to be 0.3 (steel) and no hardening was included in the material properties. An overview of the specimen cross sections and pertinent characteristics is given in Figure 6 and Figure 7 whereas the modeling details of the corresponding boundary conditions are discussed in the next section for each setup.

Idealization of Boundary Conditions of the Test Setups

SPT & SPT-T: The specimen is modeled using a rectangular 80 mm × 80 mm section with the test bar placed in the center of the section. Double symmetry enables the subdivision of the specimen volume to 1/4 of the original size. Two variations of this test are modeled: one where the top surface is restricted in all degrees of freedom, namely ux, uy, and uz, and one where only uz is restricted (the system of axes refers to Figure 5a). The former of the two corresponds to a bearing plate imposing frictional resistance onto the specimen surface and the latter simulating a frictionless surface.
EPT: In this setup the bar is placed at an offset from the section centroid, such that on one side of the bar, the clear cover is 2Db (control cover Cc) while the cover in the opposite side is 4Db. Because of the eccentric placement of the bar, only single symmetry was utilized in this case. Following similar arrangement with the SPT, the upper surface of the concrete prism is restricted from displacing in the uz direction (Figure 5a), simulating the bearing response against the supporting steel plate. Lateral deformation is allowed in this setup. Because of the eccentric placement of the bar, the specimen body was divided up to half of the total volume along the plane x-x’.
BET: This test uses a specimen formulation identical to that of the EPT, but with different applied boundary conditions: here specimen translation is restricted solely on the edge opposite to the test bar, and the only lateral support was placed on the corner of the concrete specimen facing the free end of the bar (Figure 6c). Stress conditions representative of beam elements are developed throughout the specimen, where both the bar and the surrounding concrete are subjected to longitudinal tension, while only the segment of the bar over the support and close to the free end is affected by the trajectory of the inclined confining reactions. Again, only half of the total volume of this specimen setup was modelled on account of symmetry.
DTPT: This specimen is modeled according to the DTP test arrangement shown in [27], modified by Georgiou to be used for bond testing in ECC [15]. A rectangular specimen, 80 mm × 400 mm with a concentrically placed test bar, is supported by a co-axial bar placed in the opposite end of the concrete prism. The support bar is embedded over a greater length into the concrete body to ensure failure on the shorter test bar. Support conditions in the uz direction (Figure 5a) are solely placed on the longer bar as equilibrium is achieved along the axis of the two embedded bars.
“H-Shaped” TPT: This alternative configuration of the DTPT involves placement of the support bars in the corners of an “H” shaped concrete specimen (external dimensions 160 mm × 160 mm). The support bars extend through the opposite ends of the specimen whereas the test bar is embedded in the control section (80 mm × 40 mm) between the external concrete flanges. The control section is grooved up to a depth of (2Db = 32 mm) to minimize the interaction with the supporting flanges. Double symmetry was employed in modeling this specimen.
Contact Lap Splice PT: This formulation is based on the spliced specimens proposed by [29] for the investigation of the splitting capacity of lapped joints. Two pairs of parallel bars (the test bar and the support bar) are placed on opposite ends of the concrete prism and are loaded simultaneously (Figure 6f). The same cover thickness (32 mm) with non-spliced specimens is ensured toward the external faces of the specimen whereas the lapped pairs are distanced at 112 mm to ensure failure on the control cover location. Double symmetry was employed in this specimen.
Non-Contact Lap Splice PT: This test configuration is based on the spliced configuration employed by [30]. Specimens consist of very long rectangular concrete prisms with test bars placed concentrically in sequence through the upper face of the control section while support is provided by a sequence of vertical bars placed on each side of the test bar and extending from the foundation block through the bottom face of the specimen. Each bar is pulled sequentially, so during testing, only one bar is stressed. Longer embedment lengths of the support bars ensure earlier failure of the intermediate test bar. Two variations of this setup will be employed: (a) In the first case, the side faces of the specimen will be restricted from lateral expansion (ux = 0) to simulate the restriction imposed by the continuous concrete body of this type of test as implemented by previous experimentalists [15,34]; and (b) in the second case, no restriction will be applied on the side faces to allow for lateral deformation of the concrete, which could be considered in the future as a possible modification of the original test setup in order to alleviate the kinematic restraint to dilation effected by continuity in the longitudinal direction of the prism. In the forthcoming discussion case (a) will be referred to as “continuous” strip whereas (b) as “discontinuous” strip.
LSBT: In addition to the above pullout specimens, a beam lap-spliced specimen was modeled in the four-point bending test configuration. The purpose of this model was to illustrate the stress transfer mechanisms of the spliced connection and the differences thereof when compared with the spliced pullout setups modeled in this study. This specimen comprised a beam with a square section of 300 mm × 300 mm spanning for 1500 mm, and loaded at the third points, with equidistant shear spans of 500 mm on each side of the central constant moment region. Two pairs of spliced bars were placed toward the tension side of the section, with the spliced connection developing over a length of 5Db (=80 mm), which is equal to the spliced lengths of the other pullout setups described above. The control cover was defined at the bottom face of the specimen section (taken 2Db = 32 mm). Because of symmetry, only half of the original beam was modelled. The loading protocol was maintained constant for all specimen configurations with the exception of the LSBT model with the Standard Newton–Raphson iteration using displacement control. Displacement increments of 0.01 mm were applied on the loaded end of the bar for the pullout specimens, at the beginning of the contact length, until failure of the specimen and termination of the analysis was achieved. For the LSBT case, to maintain continuity of the loading scheme, displacement increments of the same magnitude were applied to the top loading plates of the beam, which significantly contributed to computation time considering that the deformation was not directly applied to the test bars.

5. Results and Discussion

Based on the definition of the nominal bond strength fb,max from the bar development capacity Fb (Equation (1)), the obtained force–displacement curves are compared for all the test setups in Figure 8, and the maximum developed bar stresses and corresponding displacements are recorded in Table 2. Figure 9, Figure 10, Figure 11, Figure 12 and Figure 13 plot the distributions of the concrete longitudinal stress σzz, transverse stress σxx, and shear stress distributions, τxz, respectively, the latter of which represents the bond behavior obtained from each of the test setups considered.
Notable variation is observed between the overall responses of the various pullout setups, with the effect of the applied boundary conditions, along with the presence and location of the supporting bars, affecting the peak response and displacement at peak of the embedded bar. The highest development capacity among the test setups considered was obtained from the SPT (48.32 kN) and the Continuous Non-Contact Lap Splice PT (55.06 kN), for the one-bar and spliced pullout setups, respectively. The lowest bounds of tensile capacity were noted for the DTPT (26.28 kN) and Contact Lap Splice PT (26.7 kN) for each category of pullout arrangements. While the displacement at peak was significantly increased for the case of the SPT setup (0.28 mm), the average value for the one-bar specimens and spliced specimens (measured from their reference, initial position) was estimated to be 0.145 mm and 0.174 mm (doubled from the average value of 0.087 mm for the spliced specimens to include the total bar displacement relative to the support bars), respectively.
Splitting failure modes were observed in all specimen configurations, with the exception of the SPT pullout setup in which the restriction of the lateral movement of the upper surface led to crushing of the surrounding concrete. Inclined cracks (representing the bearing pressures generated from the bar surface against concrete cover) extended from the bar periphery to the outer surfaces of the concrete body until the end of the cover. Splitting was manifested by longitudinal cracks propagating on the outer surface of the control cover side of the specimen. Among the spliced pullout setups, inclined cracks generated by the stress transfer mechanism between the bars are shown to be distributed simultaneously with the longitudinal cracks occurring because of the slipping translation of the bars. The orientation and location of the intermediate cracks resembles the crack pattern encountered in flexural members.
In the following discussion the performance of the setups is explored with respect to (1) the longitudinal stresses developing in the concrete and the bar (σzz); (2) the stresses normal to the longitudinal cross section of the bar and the concrete cover; (3) shear (bond) stresses along the bar, (4) and disposition of cracking. To enable comparison between different setups the same scale (intensity to color palette) is used for the same type of stresses in the various different setups examined.

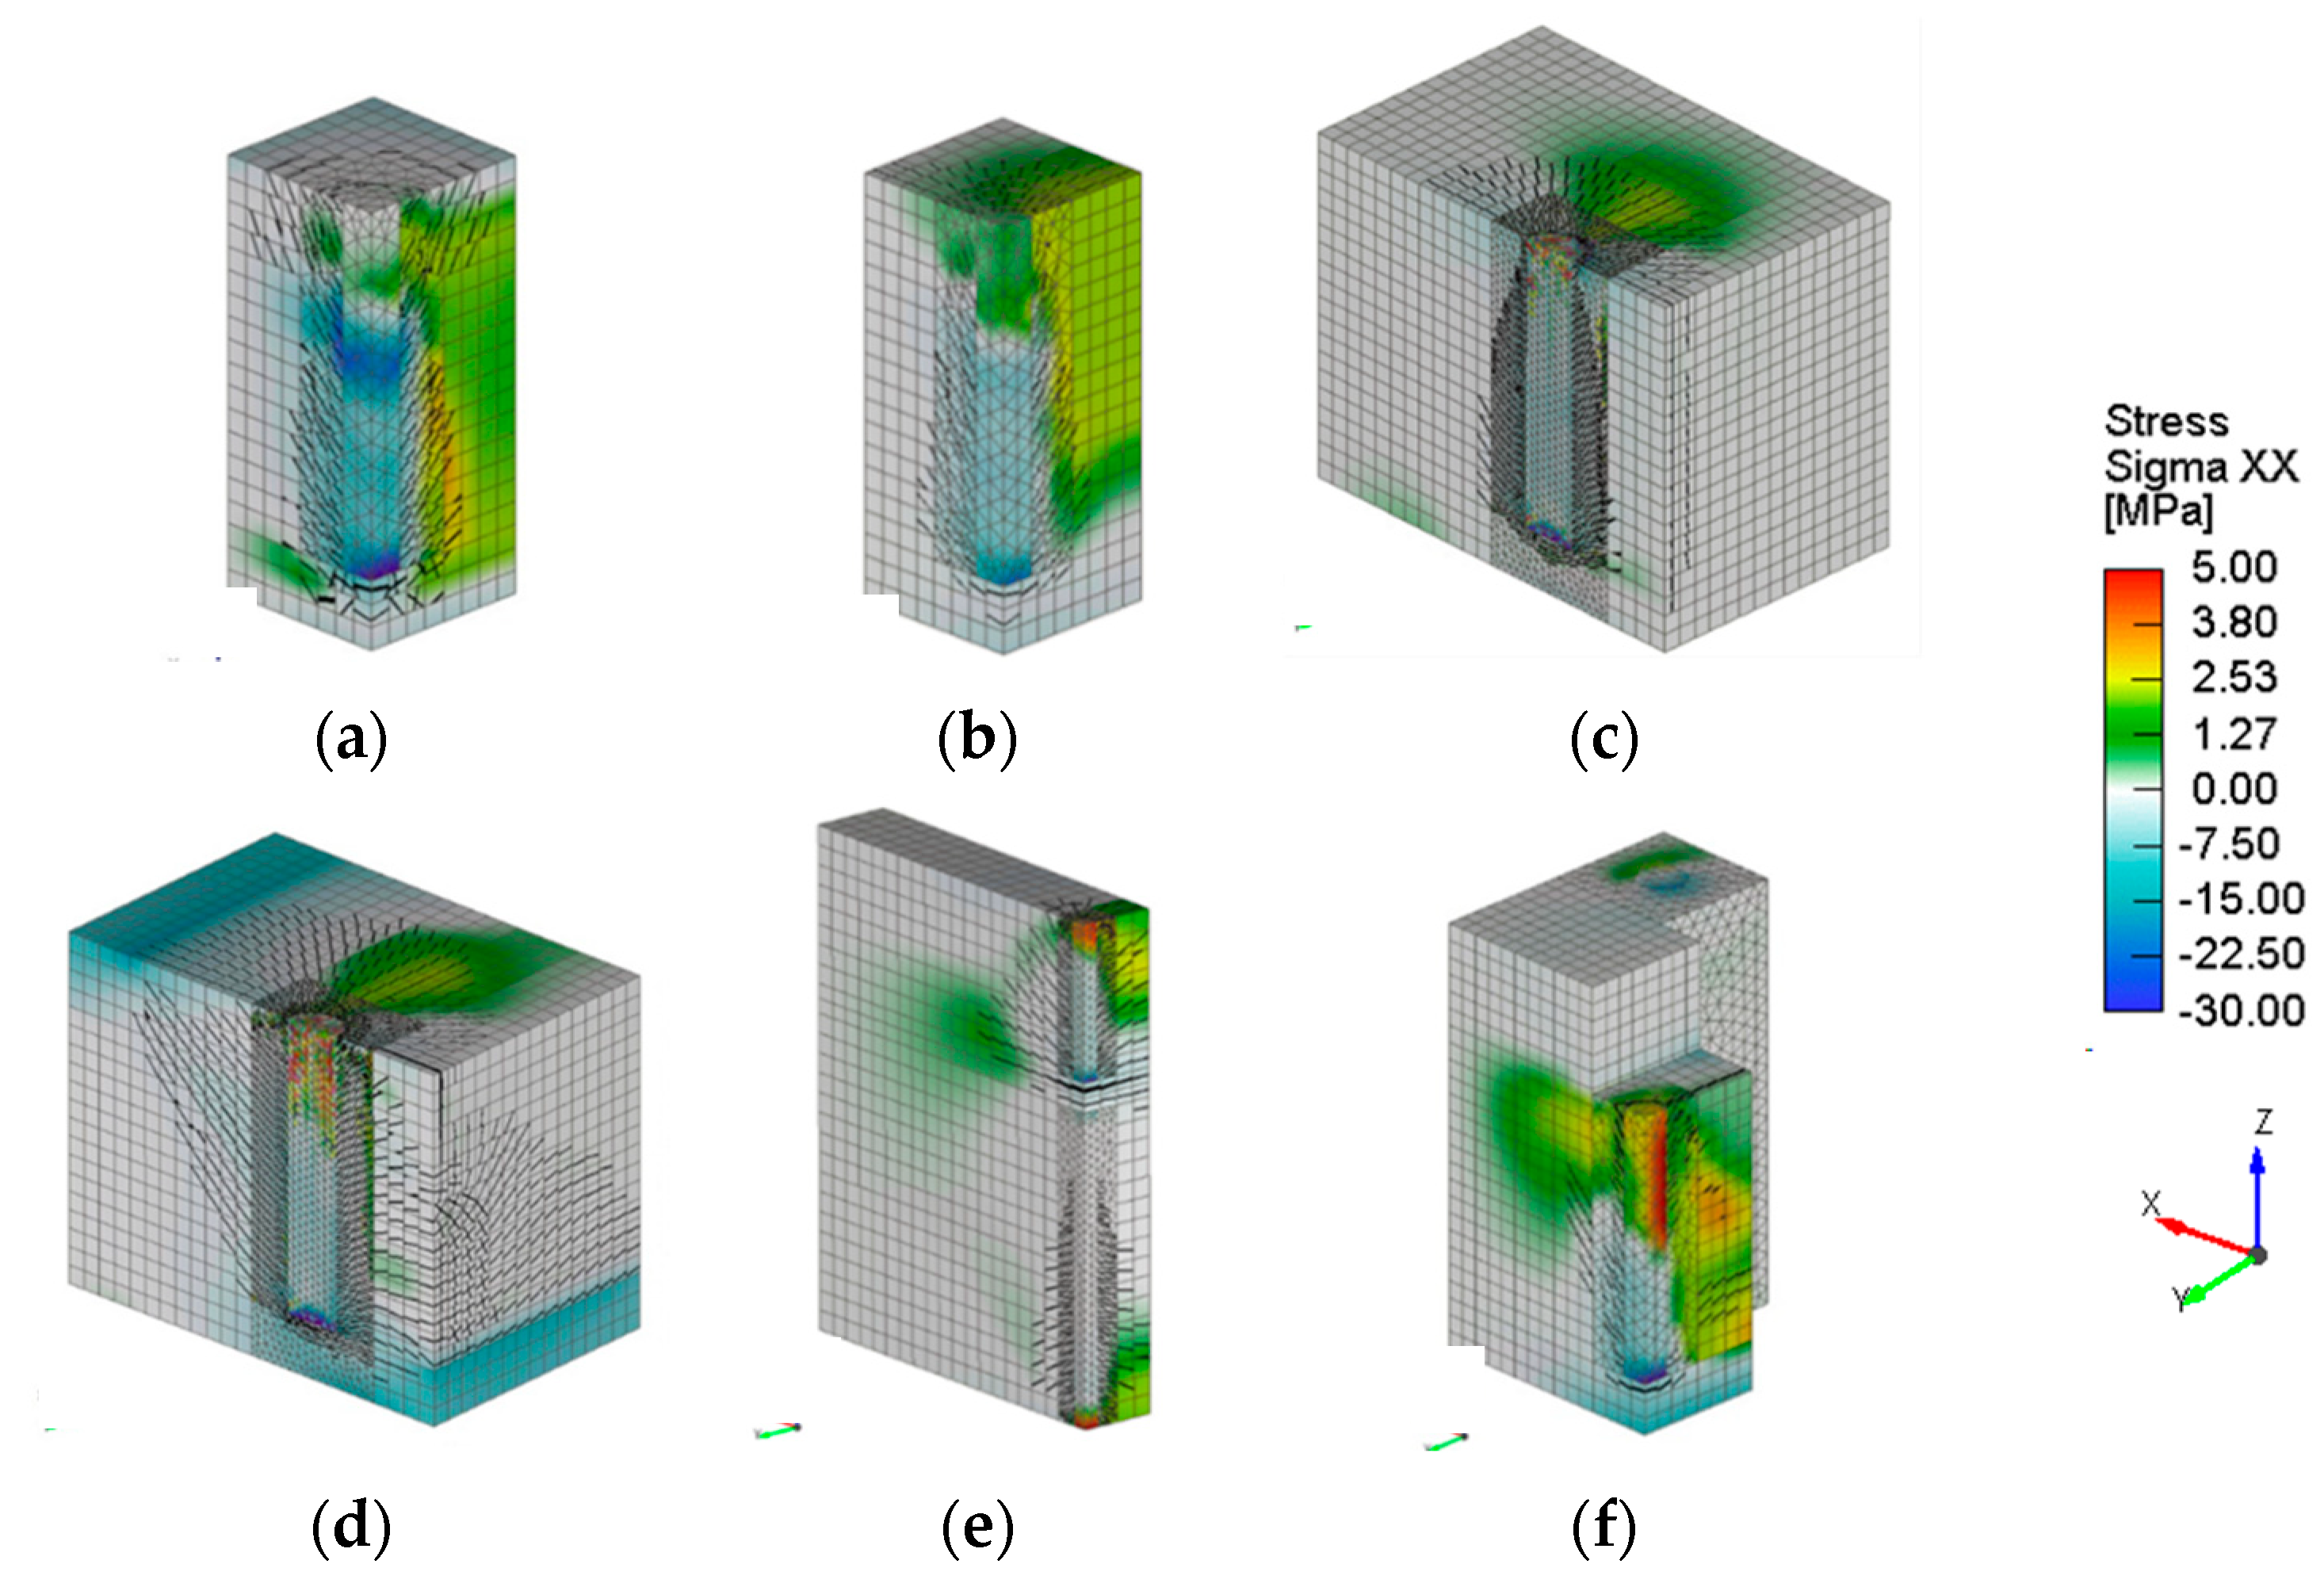
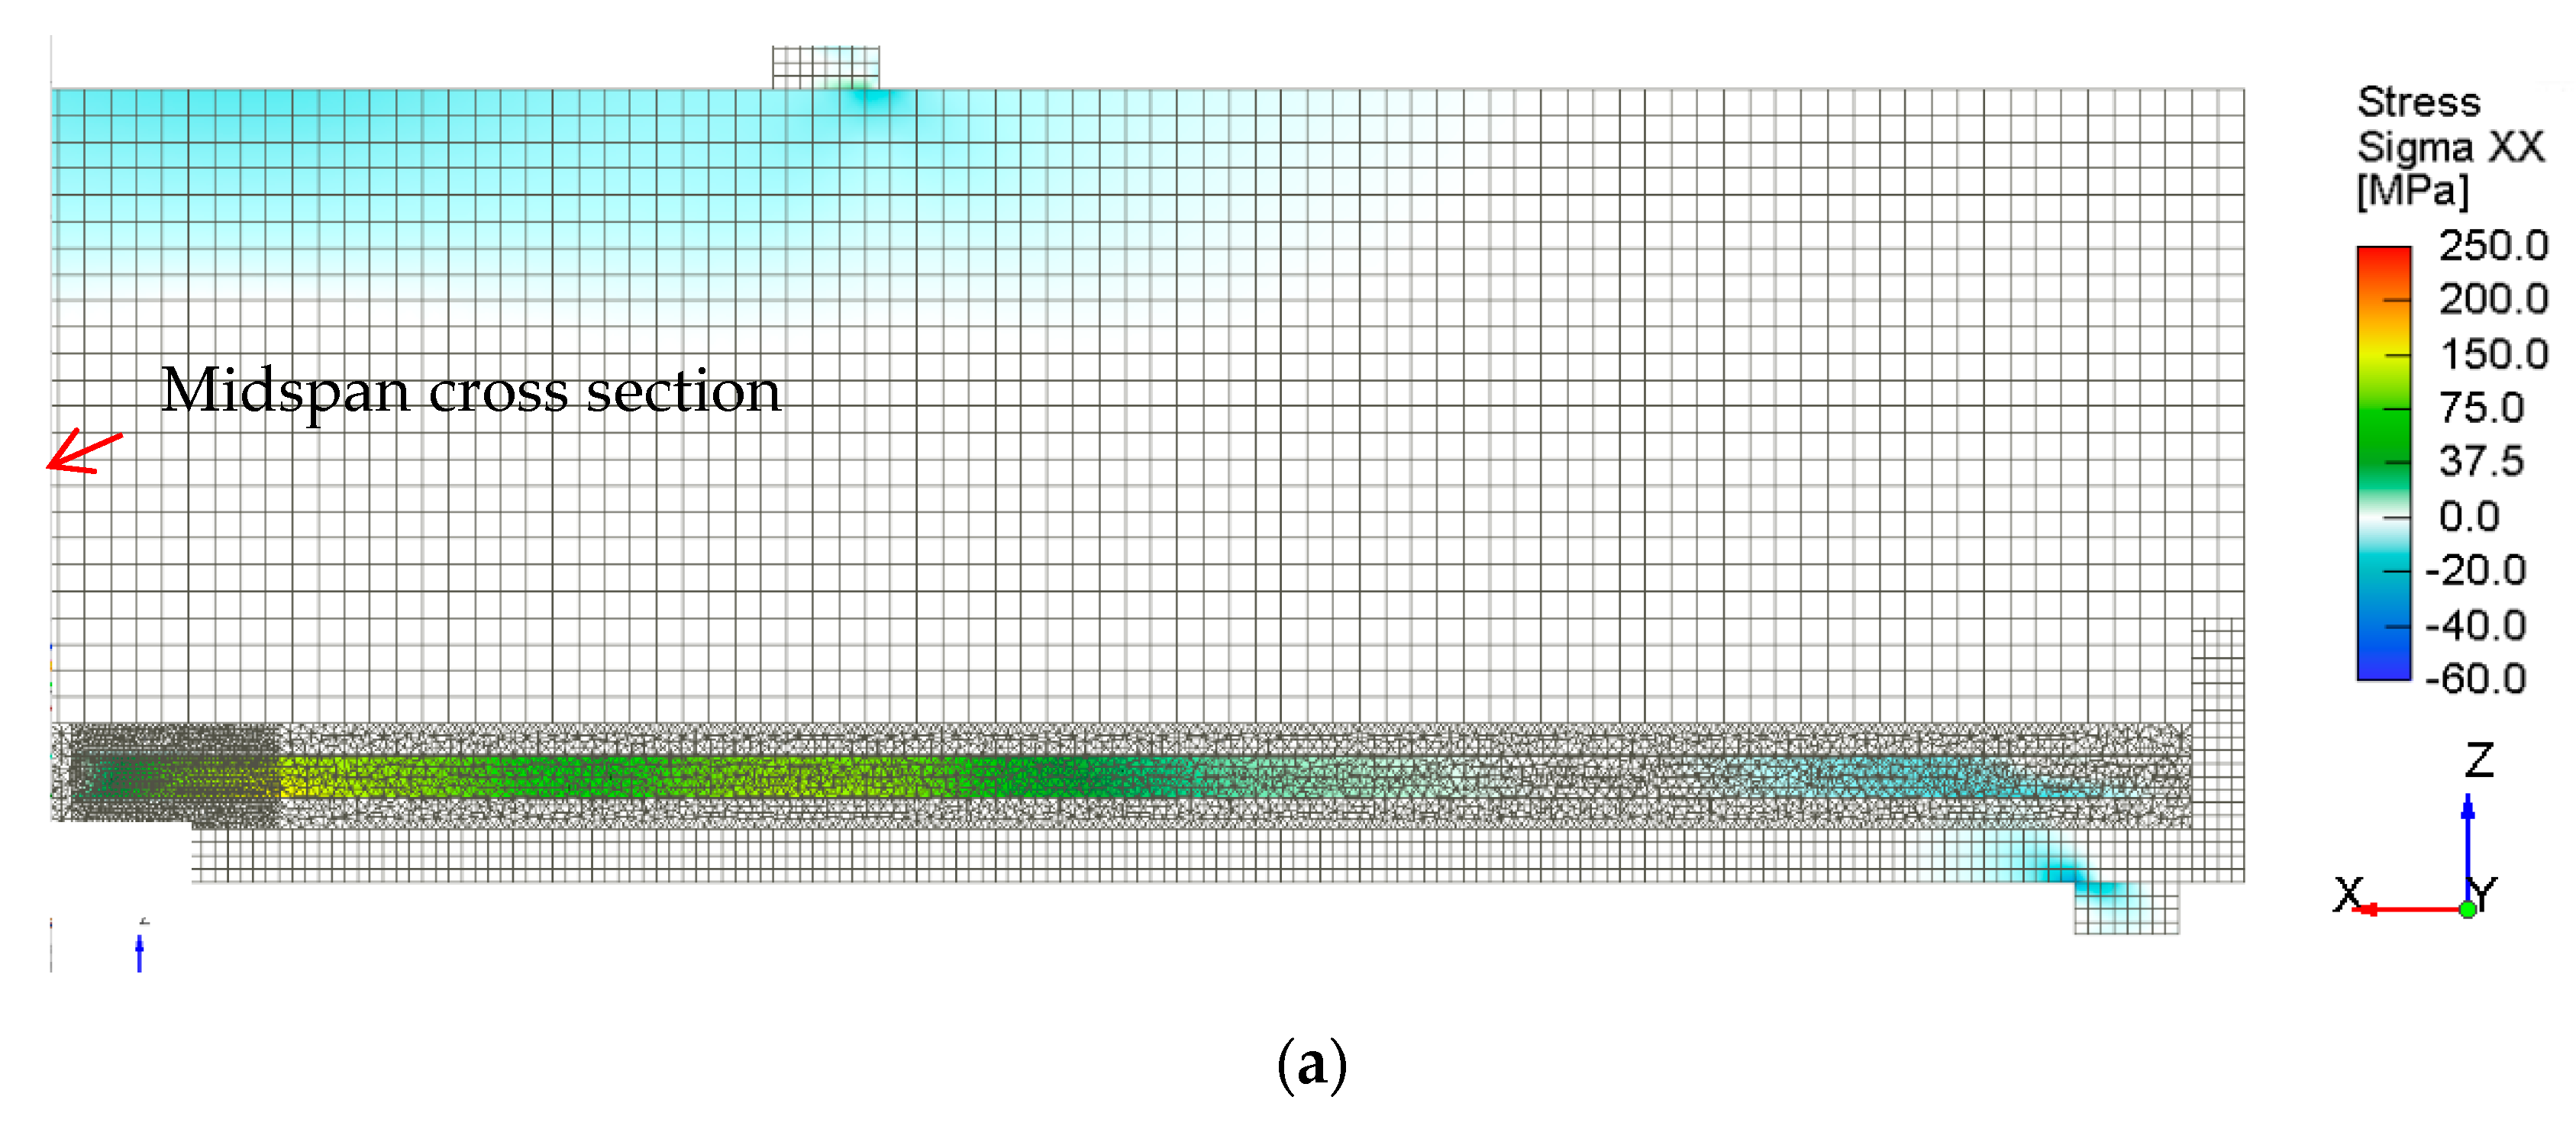
5.1. Comparison of Longitudinal Stresses in Concrete and Developed Bar

Figure 8 illustrates that the presence of the supporting plate as encountered in the conventional one-bar pullout setups provides substantial increase in the development capacity of the specimen due to the passive confinement that arises in concrete due to the bearing stresses imparted by the steel plate. Frictional resistance on the plate surface further imposes enhancement of the concrete strength (in a manner that resembles a hardening mechanism), with intensified compressive stresses surrounding the bar and leading to a well-defined ascending branch in the plastic stage (Figure 9). In both cases, the confining lateral stresses generated by the support plate envelop the concrete surrounding the bar in a compressive stress zone along the longitudinal direction. These lateral confining stresses increase the capacity of the bar-to-concrete interface and correspondingly the development capacity of the setup.
A similar compressive stress field is also denoted in the EPT (Figure 9c) with a compressive stress field extending asymmetrically throughout the available concrete cover. In the BET (Figure 9d), the effect of compressive longitudinal stresses is reduced and concentrated on the outer edge of the specimen, at the location of the supported surfaces, while the concrete around the bar is under tension in the longitudinal direction. Inclined crack patterns following the orientation of the compressive stresses generated from the outer edge support and reaching toward the free end of the bar were observed, indicating a degree of interference of the stresses with the longitudinal development of the bar.
The above patterns were not observed in the various examples of DTP (Figure 9e,f) models. In the case of the DTPT (Figure 9e), tensile stresses are observed in the proximity of both the test and support bars with transverse crack patterns developing in the unreinforced concrete segment between the concentric bars. In the “H-Shaped” TPT (Figure 9f) case, tensile stresses develop around the test bar with inclined stresses being transferred from the critical section to the outer flanges. In both setups, the increased embedment length of the support bars enables the prominent failure at the development length of the test bars. More defined transverse cracking is observed for the former case.
Among the spliced pullout setups (Figure 10), more pronounced longitudinal stresses are developed by the test bar of the continuous non-contact lap splice PT setup (Figure 10b,e), which is attributed to the lateral restraint (confinement) provided by the continuity of the concrete specimen. In all cases of Lap Splice models, a compressive stress field is observed in the proximity of the test bar, as a result of the stress transfer mechanism between the overlapping bars through shear (i.e., diagonal tension and orthogonal compression). This effect is less pronounced for the Contact Lap Splice PT case (Figure 10a,d). In this model, slightly more pronounced tensile stresses developed on the bar are located toward the outer edge of the specimen section (i.e., there is some eccentricity effect occurring that generates moments between the bars).

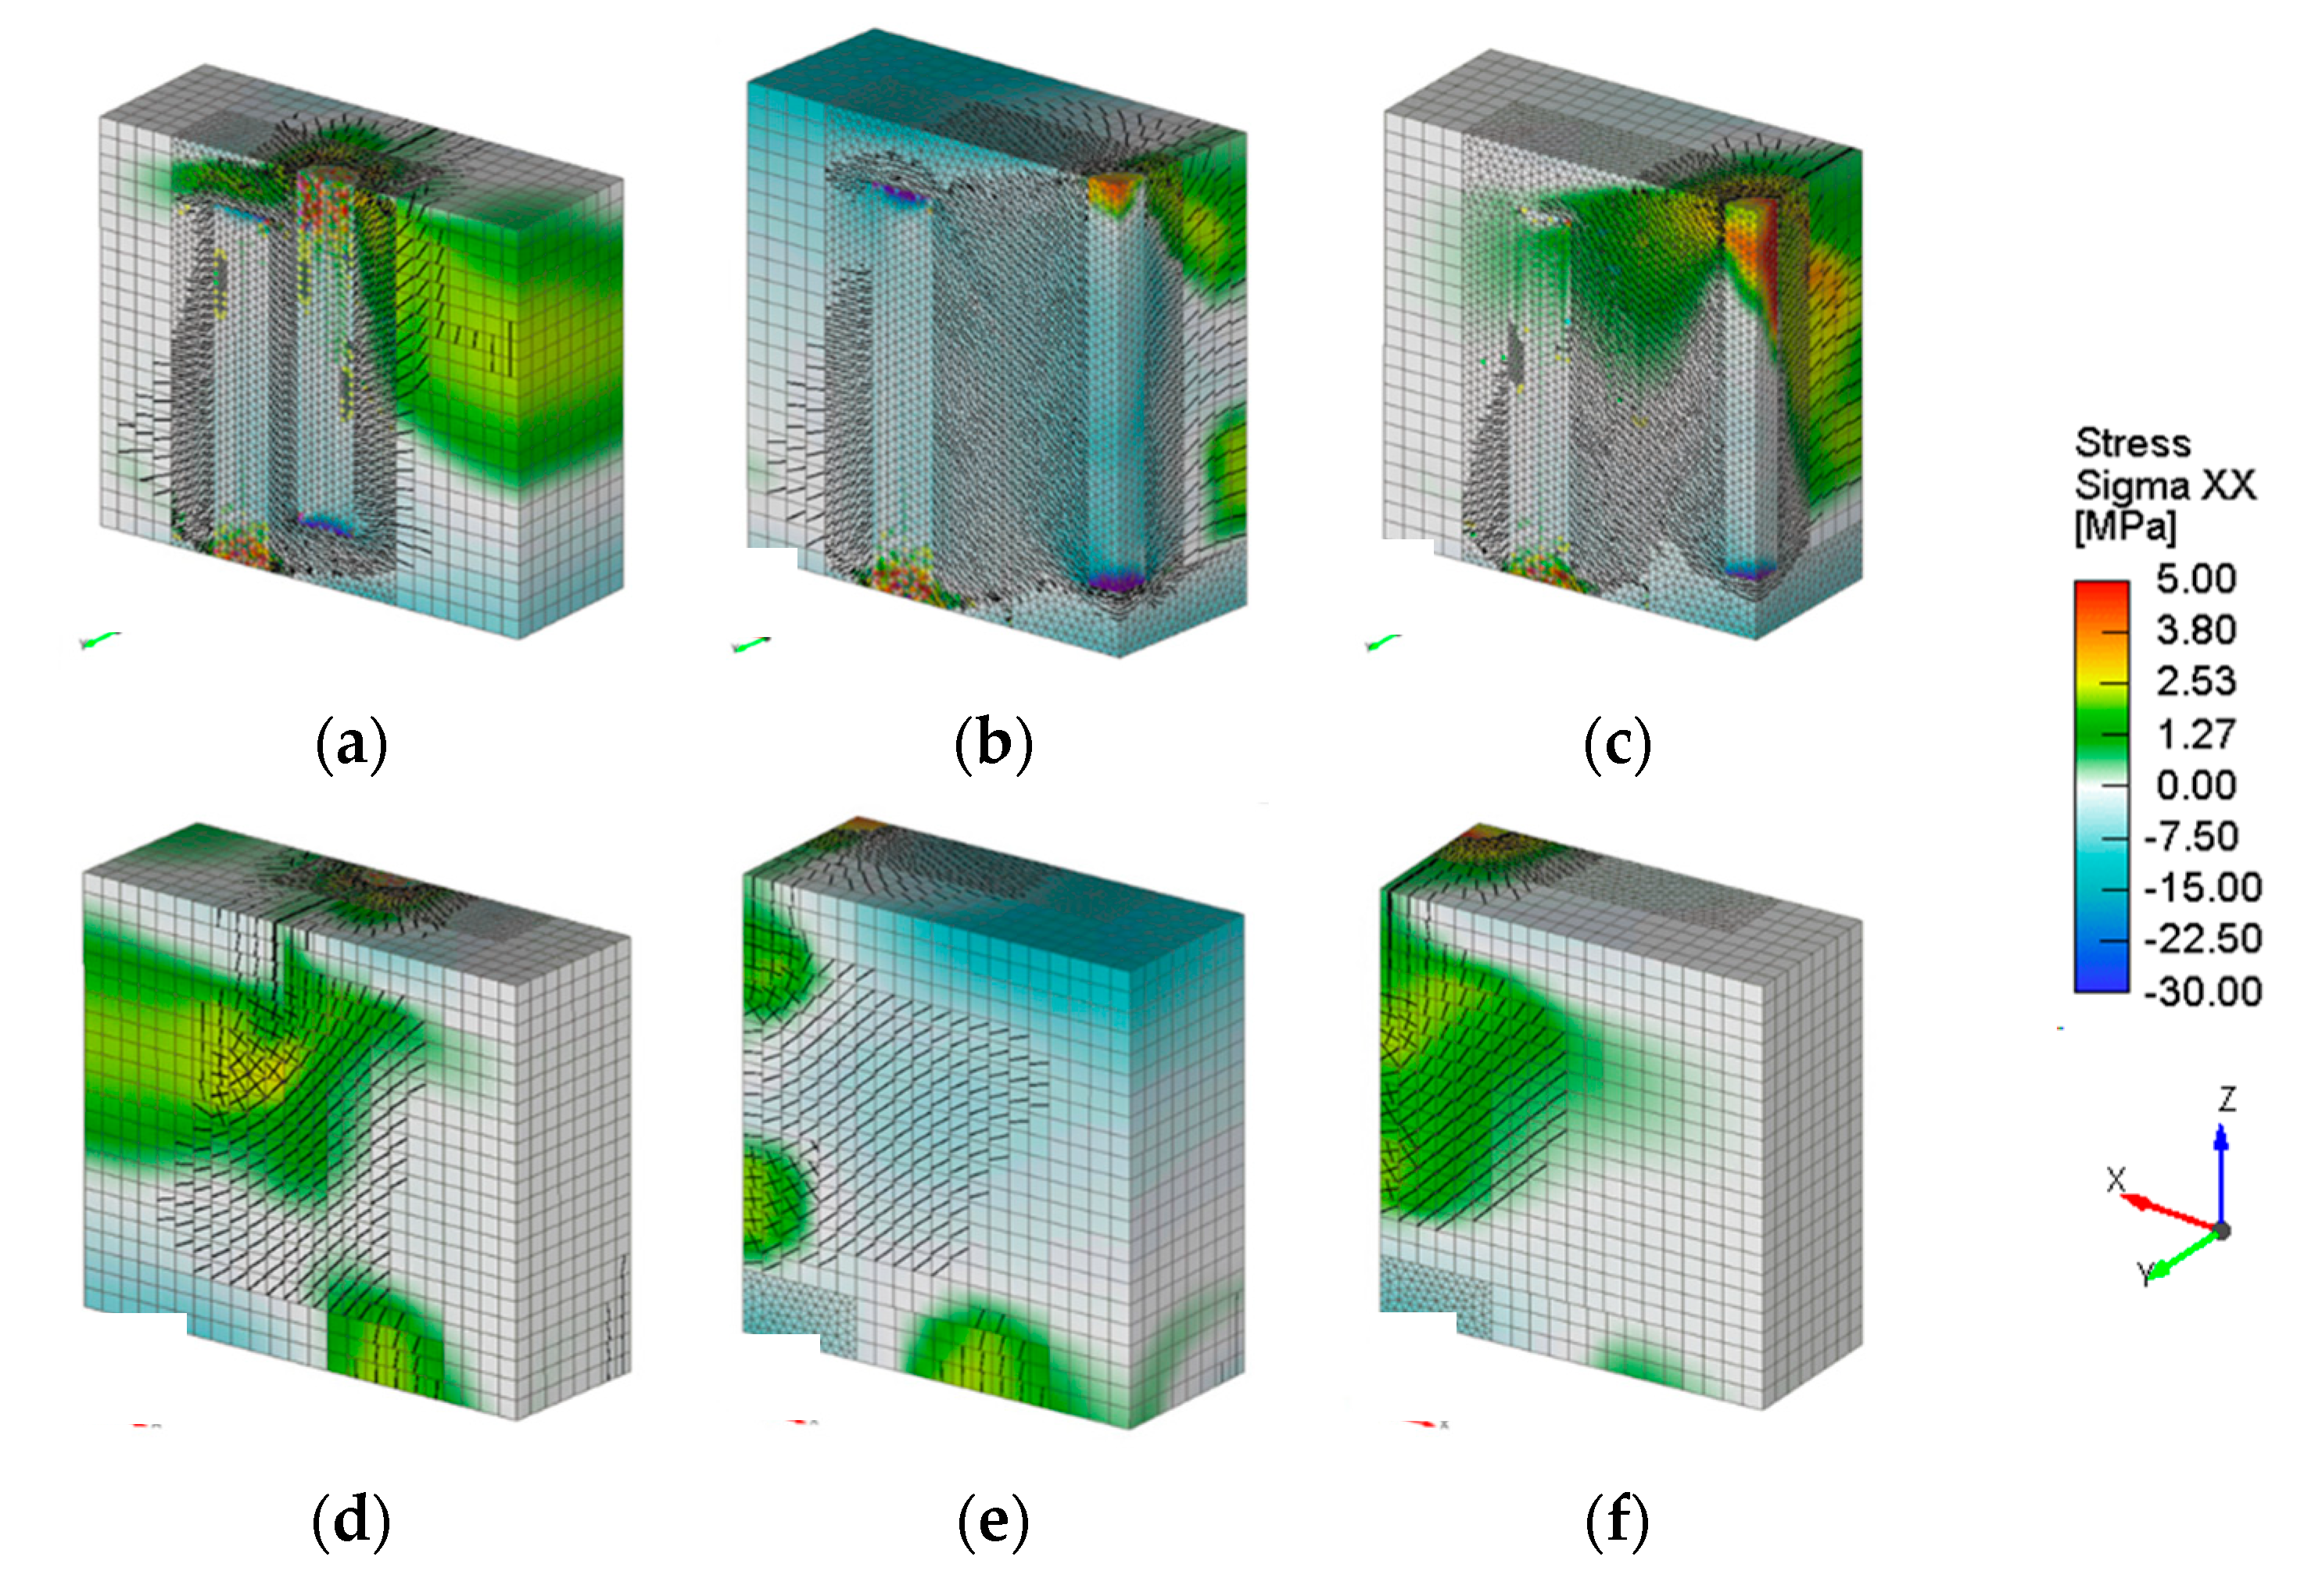
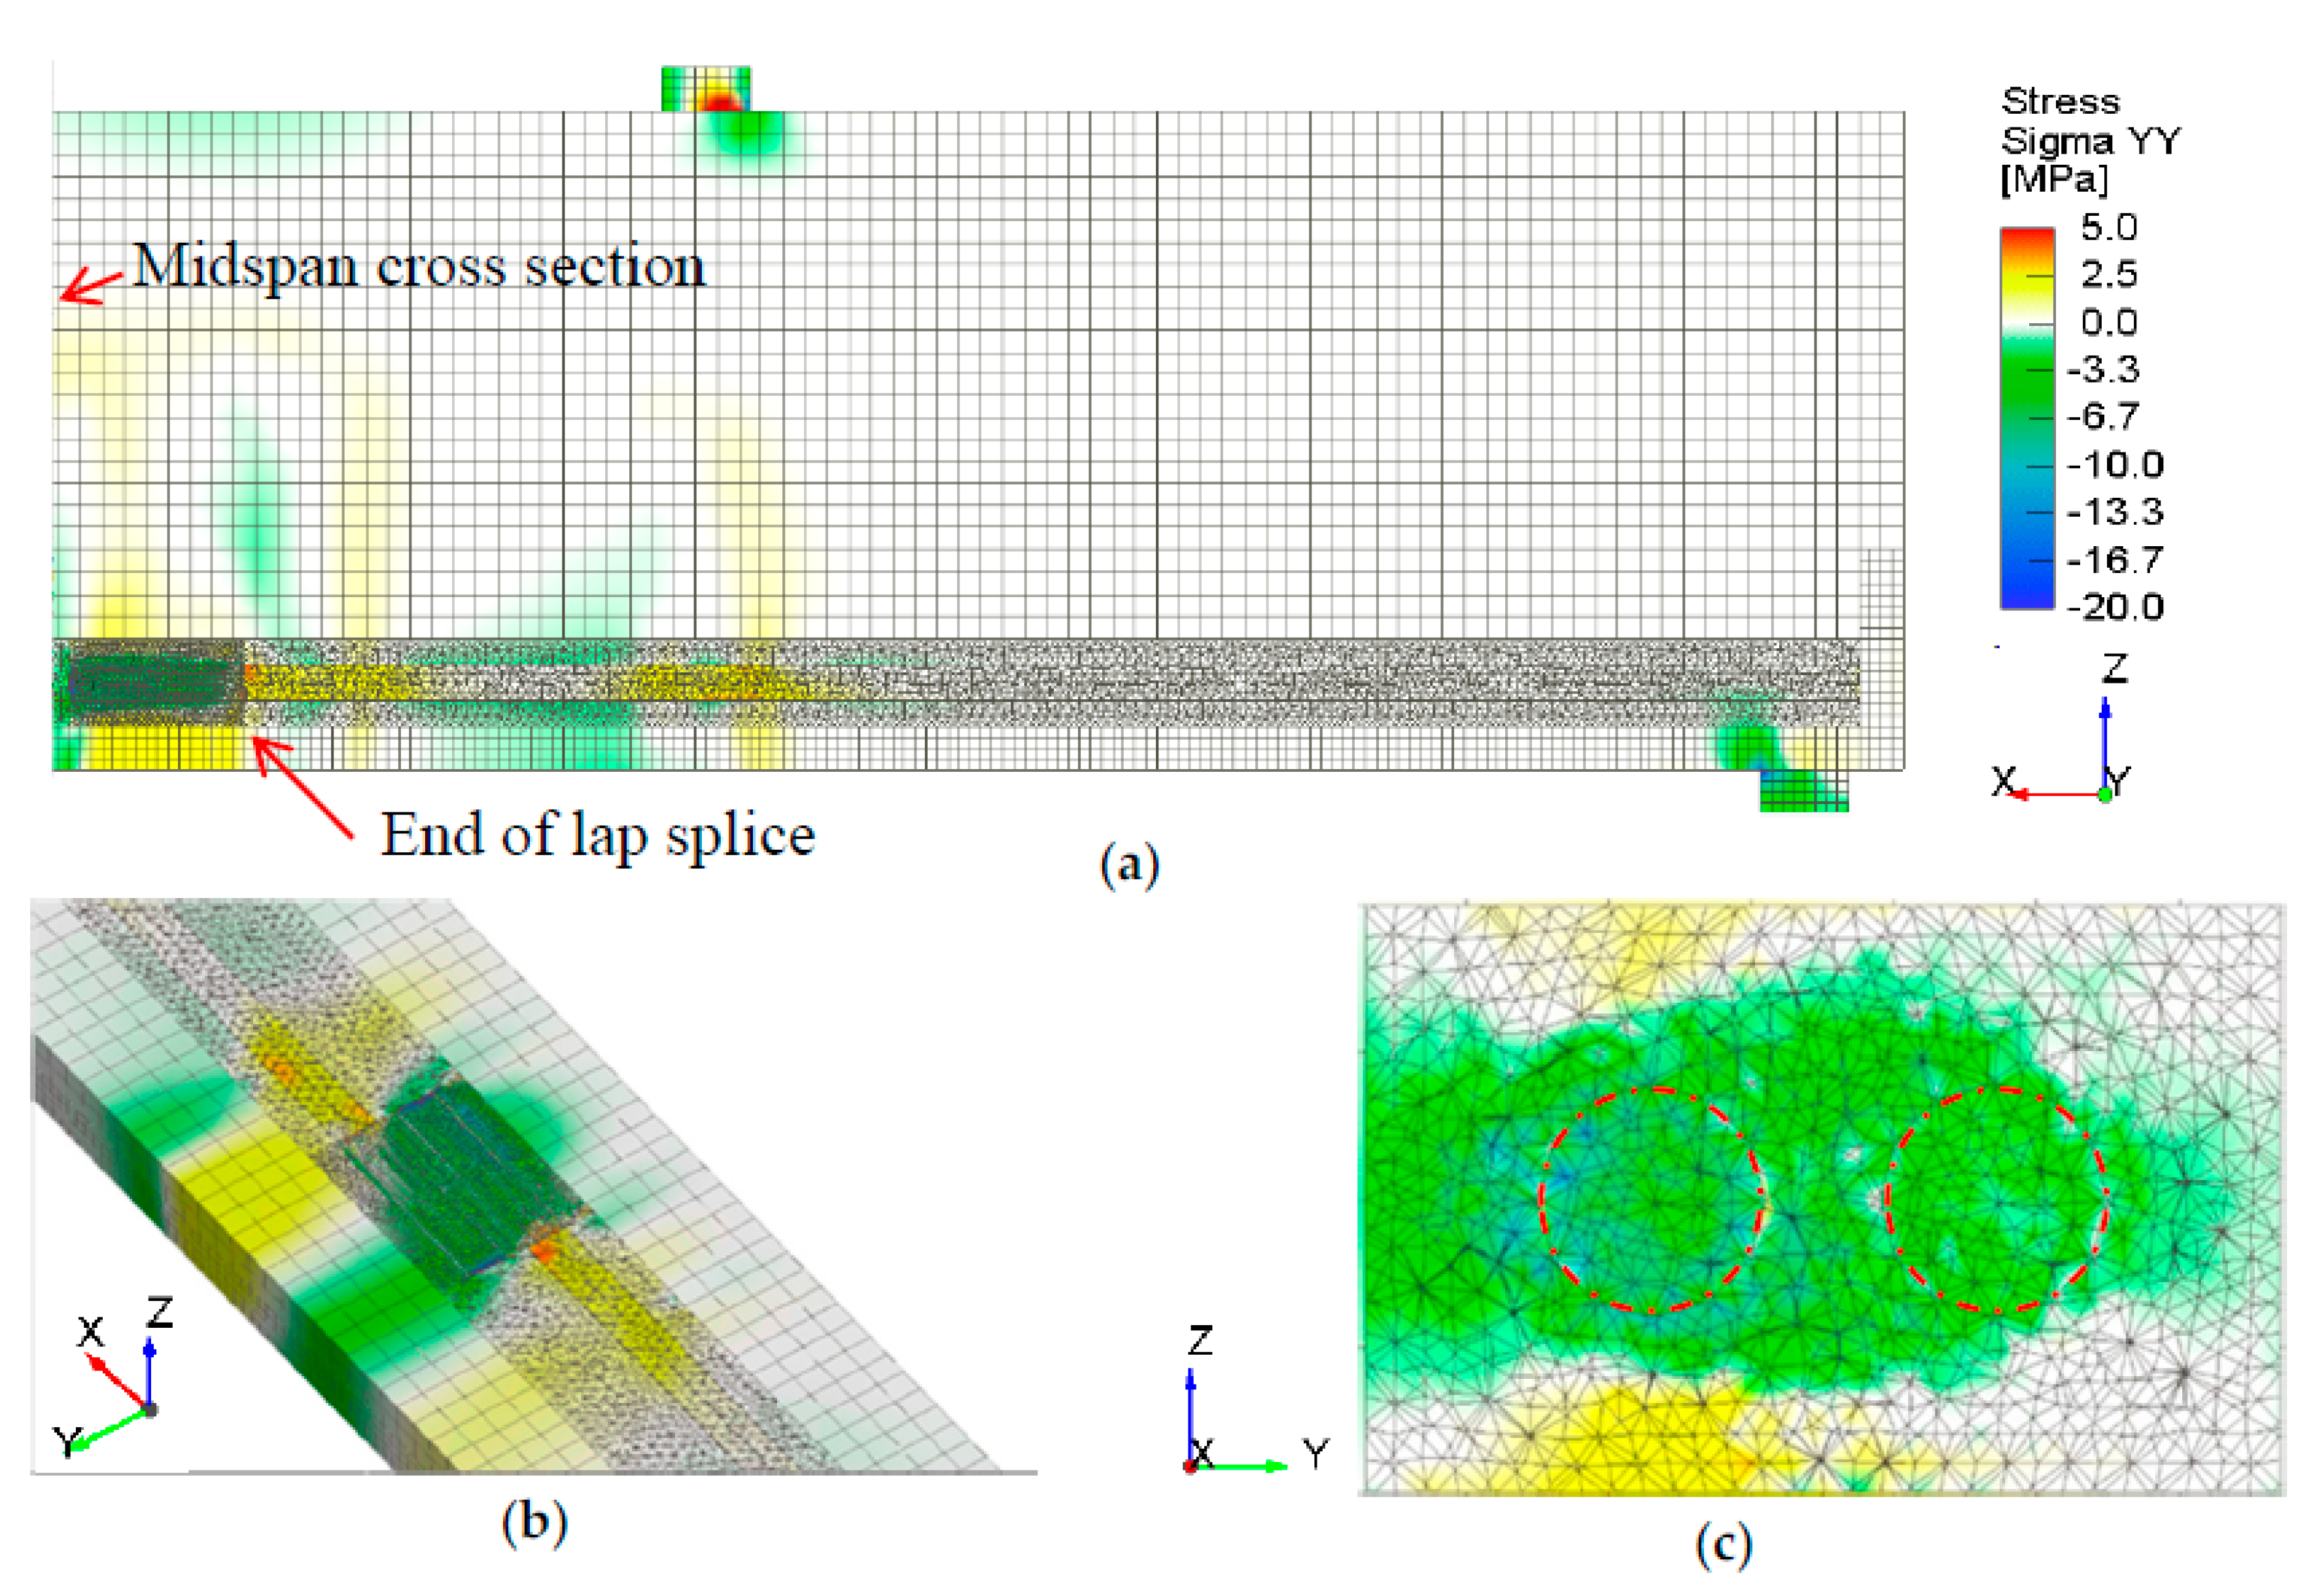
5.2. Comparison of Transverse Stresses

In the transverse direction, tensile stresses among the one-bar pullout setups develop in the concrete along the x-axis, as depicted in Figure 11, extending to the outer surface of the specimen.
With the exception of the DTPT arrangements (Figure 11e,f), in the remaining pullout setups, compressive stresses are denoted in the proximity of the bar along the x-axis and extend toward the edge of the specimen, particularly in the specimen with eccentric placement of the bar. Whereas in the immediate proximity of the bar, compressive stresses are expected as a result of the bursting pressures that the bar ribs exert on the concrete, this effect is exacerbated in specimens where confining stresses act in opposition to the tendency for outward translation of the cover concrete. In the case of the DTPTs, tensile stresses appear beyond the engaged bar-to-concrete interface.
It should be noted that in the SPT (Figure 11a) pullout model, no tensile stresses develop on the upper segment of the concrete body, as a result of the frictional resistance. Compressive stresses were observed in the concrete zone below the free end of the “H-Shaped” TPT (Figure 11f) which is attributed to the flexural response generated in the specimen resembling a deep beam between the supporting elements. This effect is not seen in the DTPT (Figure 11e).
In the contact lap splice PT setup (Figure 12a,d), an extensive tensile stress field in the transverse direction is shown to develop toward the plane of symmetry, which is owing to the same effect—i.e., flexural action developing in the specimen due to stress transfer between the opposite couple of lapped bars. In the continuous non-contact lap splice PT model (Figure 12b,e), the effect of transverse compressive stresses is shown to envelop the outer edge of the concrete section. Transfer of diagonal compressive stresses is also observed in the concrete between the lapped bars. On the contrary, in the discontinuous non-contact lap splice PT model (Figure 12c,f), only tensile transverse stresses develop between most of the bar development length except in the tail end.

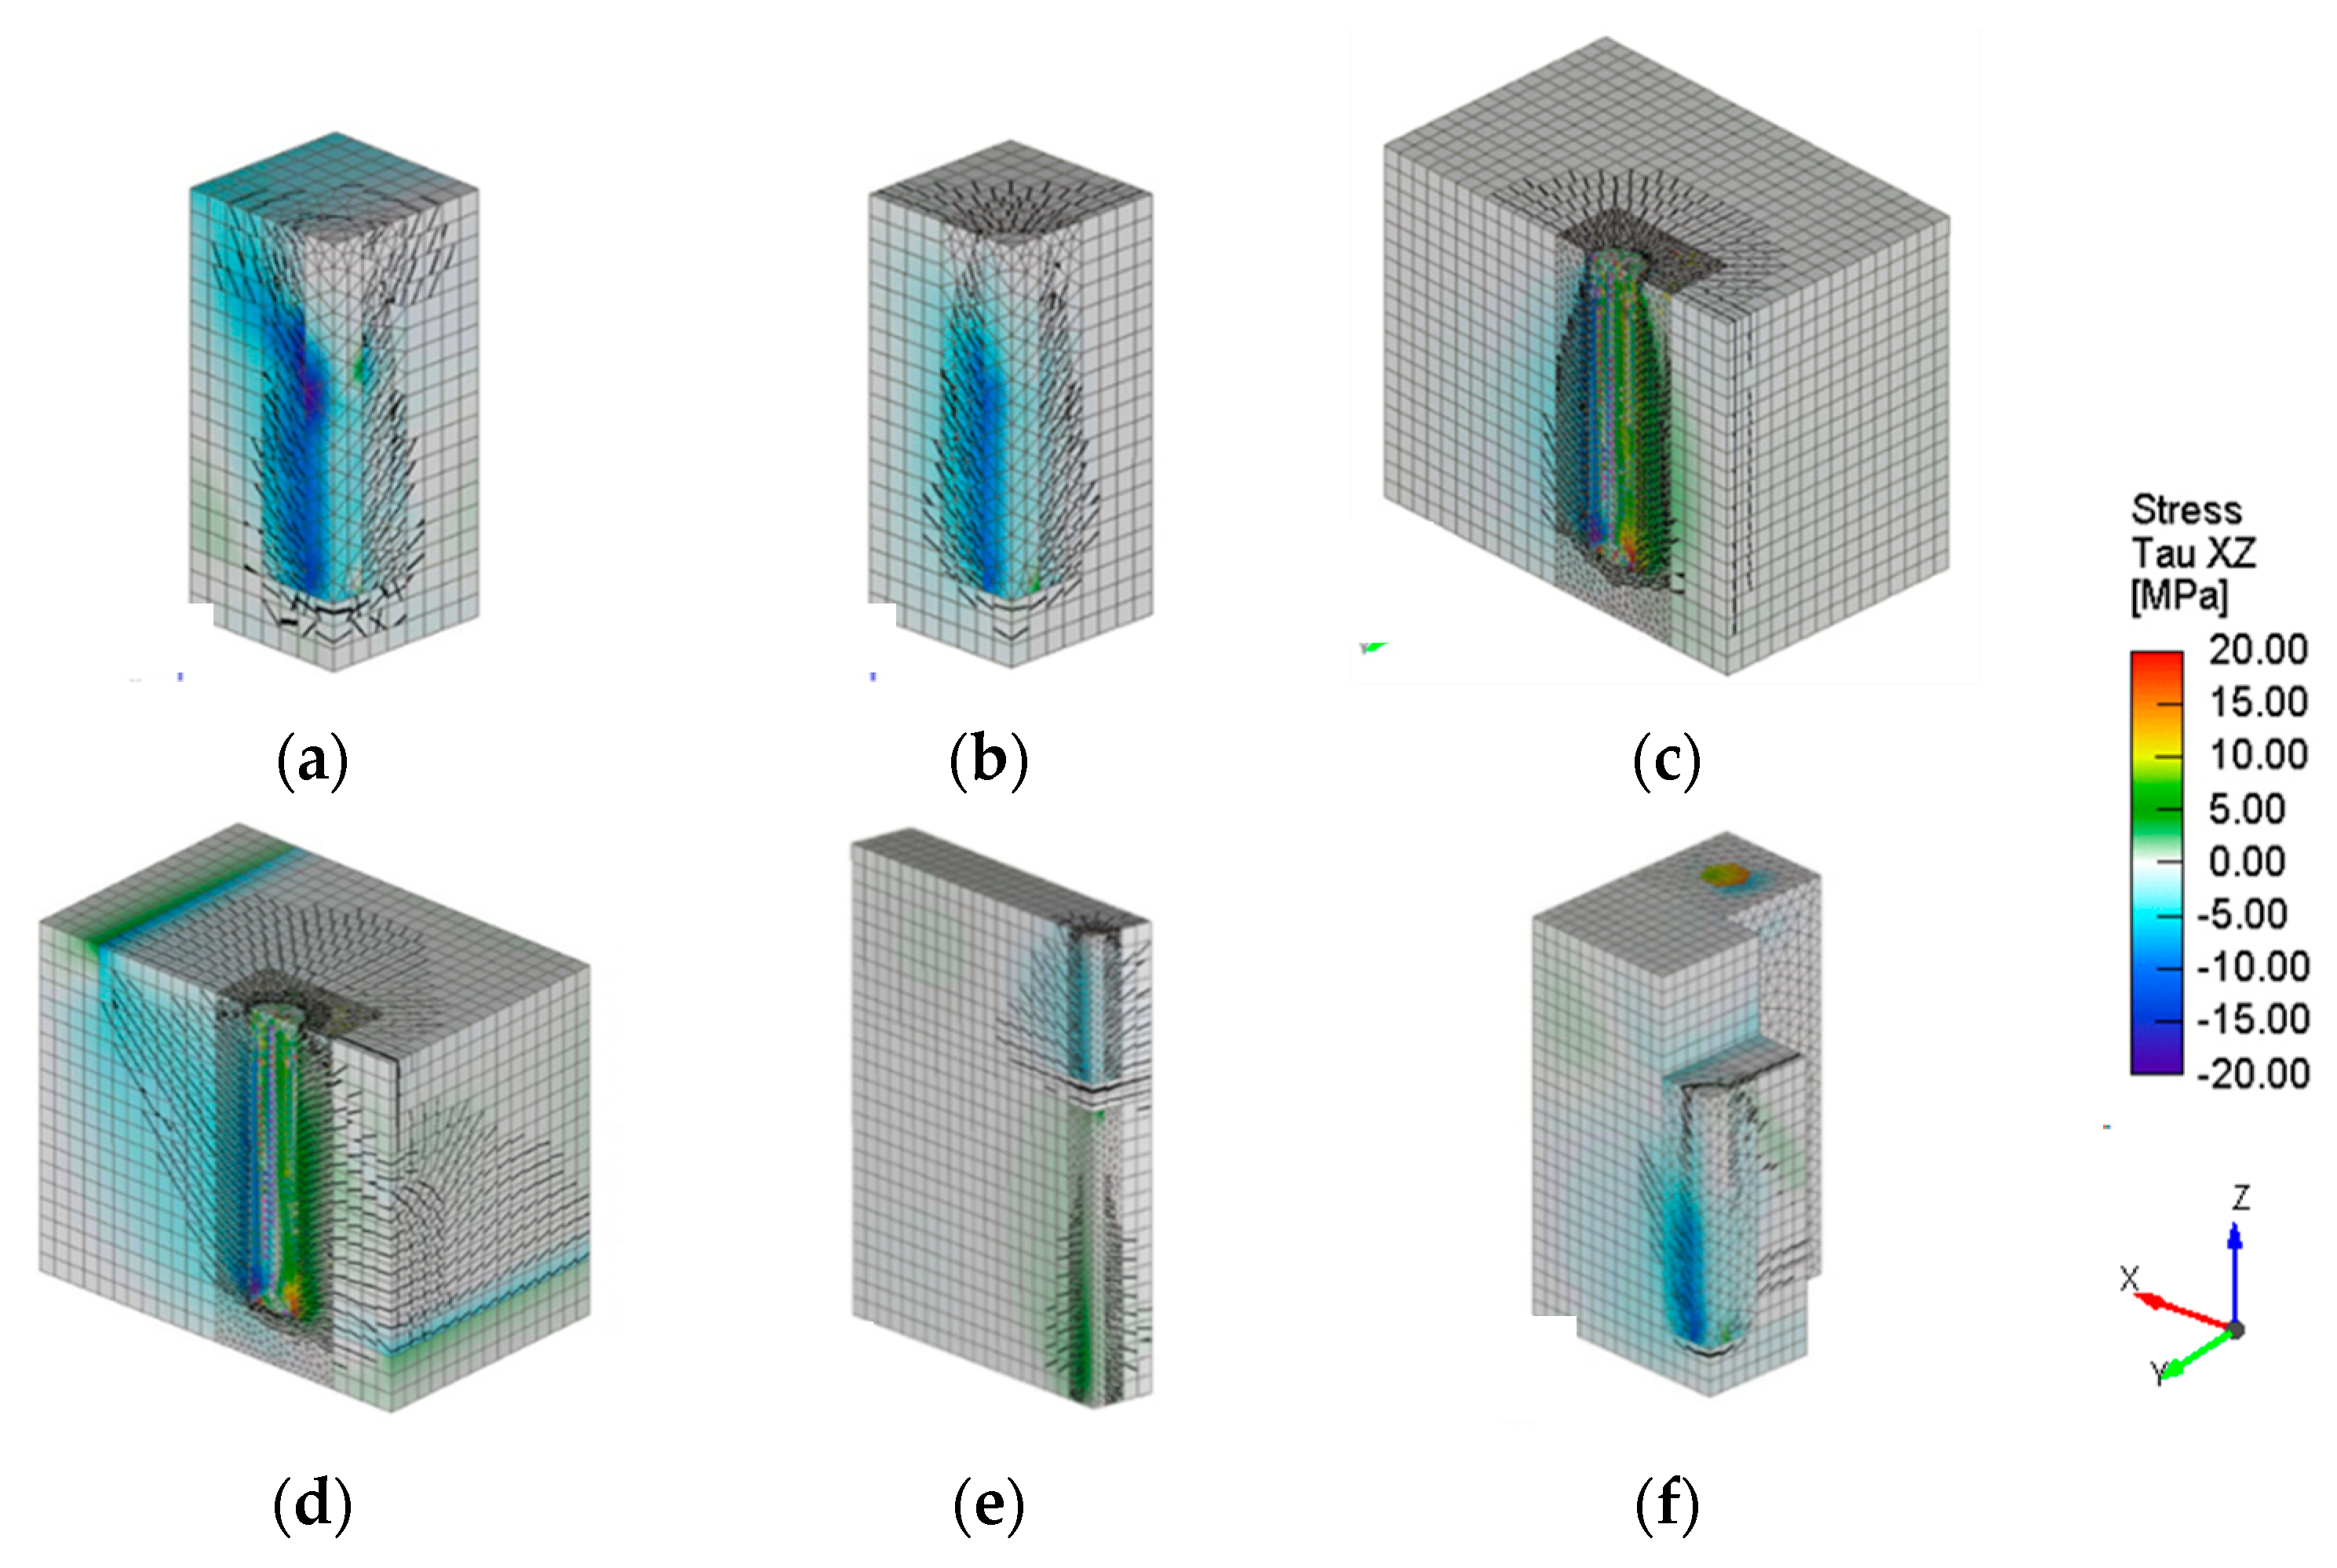
5.3. Comparison of Shear Stresses on Bonded Interface

Bond stress distributions were represented by the shear stress component τxz (Figure 13). Higher bond resistance was observed in the SPT (Figure 13a) pullout models, in which the majority of the bar interface reached bond stress values of approximately 15 MPa (3 times as large as the expected bond strength of the bar-to-concrete interface (see for example Eurocode 2 [13]) with the upper segment of the bar being dislocated relative to the concrete at the point of peak strength. In the cases of the EPT (Figure 13c) and BET (Figure 13d), opposing vectors of shear stresses τxz appear on each side of the test bar. On the outer side of the bar, shear stresses are directed toward the z+ axis, whereas on the inner side toward the z− axis. Thus, by obtaining bond strength through the use of Equation (1) in specimens where curvature is also present leads to average values that may bear no realistic relevance to the local bond stresses that develop on the bar perimeter. Shear stresses reach approximately 10 MPa for the EPT and 7.5 MPa for the BET. The lowest bound of shear stresses, and equivalently bond strength, was obtained by the DTPT (Figure 13e), where interface stresses do not exceed 5.0 MPa between all cases, with stress vectors on all sides of the bar facing toward the z− axis (the negative sign pertaining to opposing direction of the bond stresses).
Between the spliced models (Figure 14), shear stresses opposite to the pulling direction of the bar are noted between the lapped bars, while positive shear stresses (e.g., in the direction of bar pullout) are located on the outer edges of the bars. Stress transfer between the bars is also depicted in this case. As anticipated, more pronounced shear stress values developed in the continuous non-contact lap splice PT model (Figure 14b,e) whereas the lowest value of shear stresses occurred in the discontinuous non-contact lap splice PT model (Figure 14c,f).
LSBT: The results for the LSBT specimen are summarized in Figure 15, Figure 16, Figure 17 and Figure 18. Similar to the Contact Lap Splice PT model, increased longitudinal stresses can be observed on the bar located closer to the side cover of the concrete section with the highest concentration of longitudinal stresses being located near the end of the spliced zone. Transverse stresses, here in the y-y’ direction, envelop the outer bar in compression while tensile stress fields develop in the proximity of the bar above and below the bar (Figure 16c). The distribution of shear stresses also shows a similar pattern to the transverse stresses with the higher intensity accumulating toward the periphery of the outer bar (this explains the tendency of side-splitting of cover which is often observed in lap-spliced beam experiments). While this analysis did not reach the peak state (computation required exceeded 3 weeks dedicated time in a CPU containing more than 3.4 GHz of processing power) it is observed that the lateral and interface stresses that develop on the lapped section of the test bars are clearly affected by the presence of the flexural curvature of the member.

6. Conclusions

Ten different test setup arrangements that are routinely used by experimentalists for the study of reinforcement bar development capacity and bond-slip laws were modeled and simulated using an advanced nonlinear finite element platform [16] with the purpose of highlighting the significant influence of specimen form in the experimental interpretation of bond. Models were developed using three-dimensional elements for the concrete and the bar, while the bonded interface was modeled with isoparametric gap elements equipped with a pressure sensitive Mohr–Coulomb frictional interface. This formulation was deemed capable of reproducing the effects imparted on the bar response due to the testing arrangement. The spurious rise of unaccounted for confining stresses and the occurrence of non-uniform shear stress distribution on the bar periphery owing to flexural curvature, as well as the influence of these parameters on bond strength and bar slip were illustrated through the simulation. The following conclusions were drawn from this study:
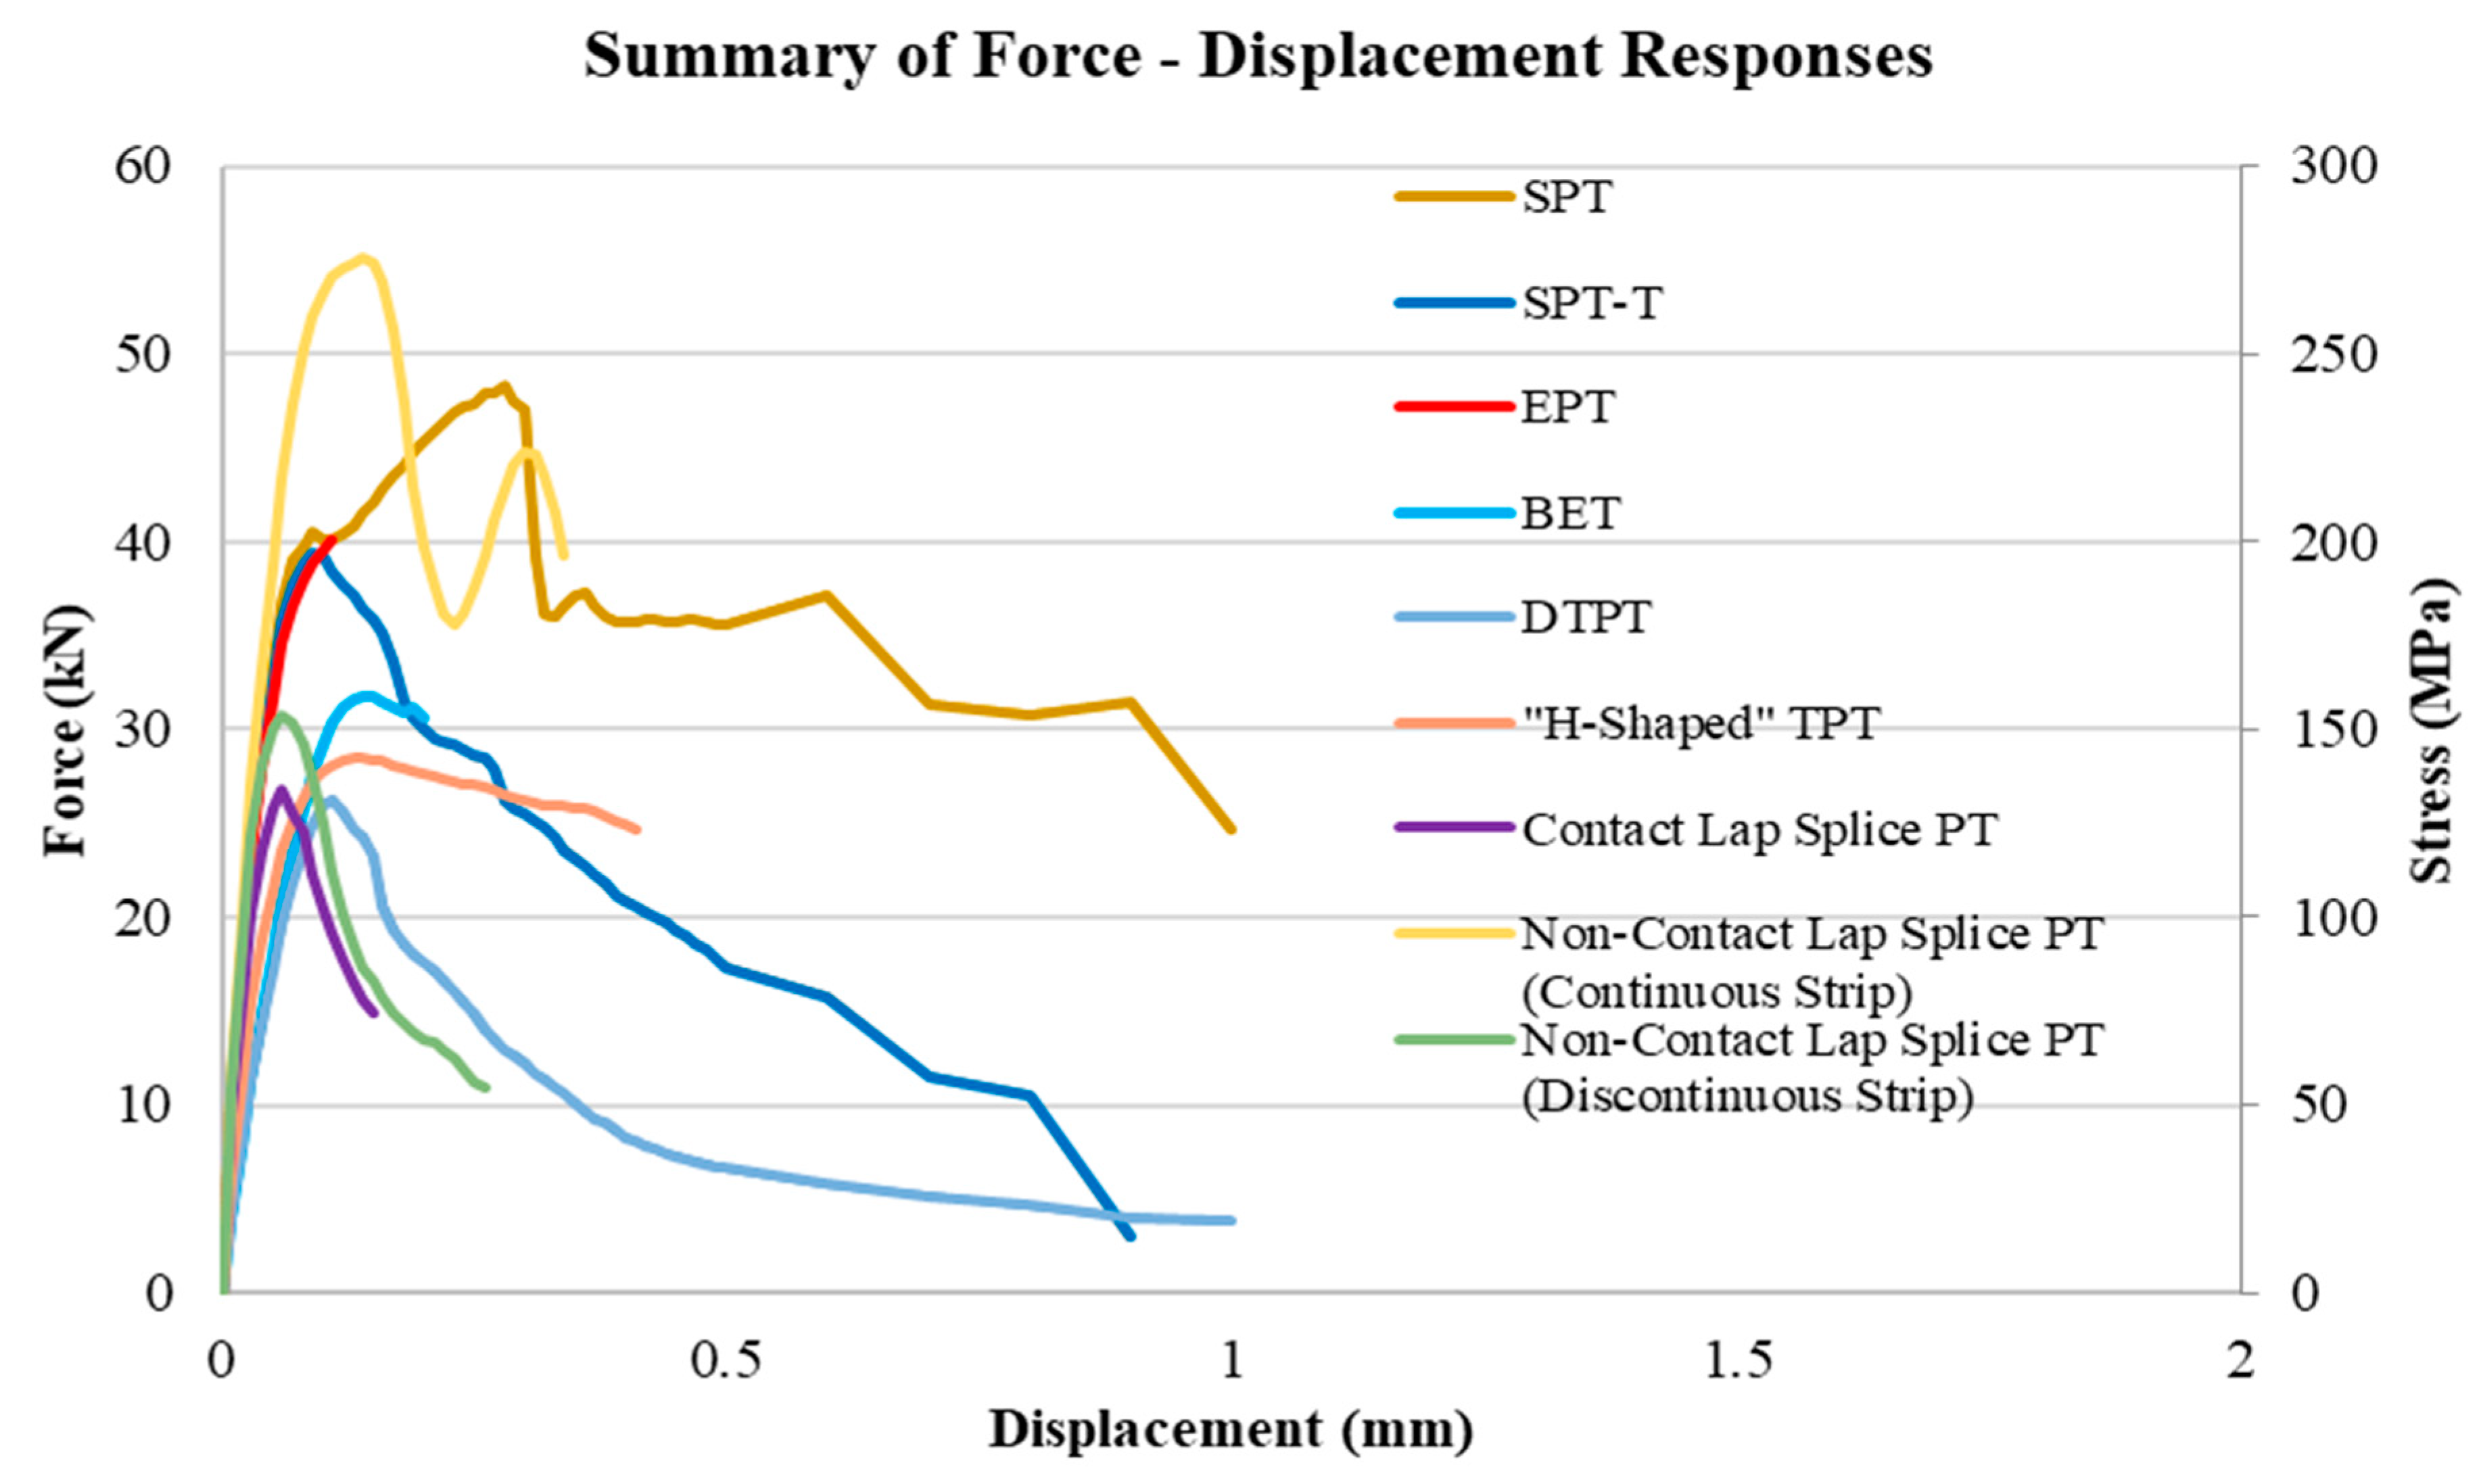
  • Conventional pullout setups such as the SPT, SPT-T, and EPT lead to unconservative estimates of bond, reaching values more than double the characteristic bond strength of the interface in relevance to the DTPT, for both the spliced and non-spliced cases.
  • Eccentric placement of the test bar, either in the EPT or the BET, creates opposing vectors of the shear stress component τxz, generated by the flexural curvature of the specimen in the test zone. The nominal bond strength values in this case, obtained by averaging the stresses on the bar periphery, have no relevance to the true stress distribution of local bond along the embedded length.
  • The DTPTs arguably provides the most conservative estimate of bond strength by engaging solely the bar-to-concrete interface and excluding extraneous confining stresses and by eliminating the flexural response of the specimen. Such a requirement is essential for the study of the characteristic bond properties of reinforced concrete, particularly in yet under-investigated and novel cementitious materials such as UHPFRC and ECC [14,15,47].
  • The displacement capacity of the test bars was comparable between the one-bar and spliced models (note than in case of the spliced models the displacement considered is the relative displacement between the bars of the pair, which is twice the magnitude of absolute displacement of one bar). Restriction of the concrete body in the transverse direction, either in the SPT or the continuous non-contact lap splice PT cases produced displacement at peak more than double the corresponding displacement of the laterally unrestrained counterparts.
  • Surprisingly, the lateral support provided in spliced pullout setups in the case of continuous concrete strip specimen effected an increase in the bar development capacity on account of passive confinement developing around the test bar. In the absence of such conditions, the peak bond stress and displacement capacity are dependent on the tensile capacity of the surrounding concrete.
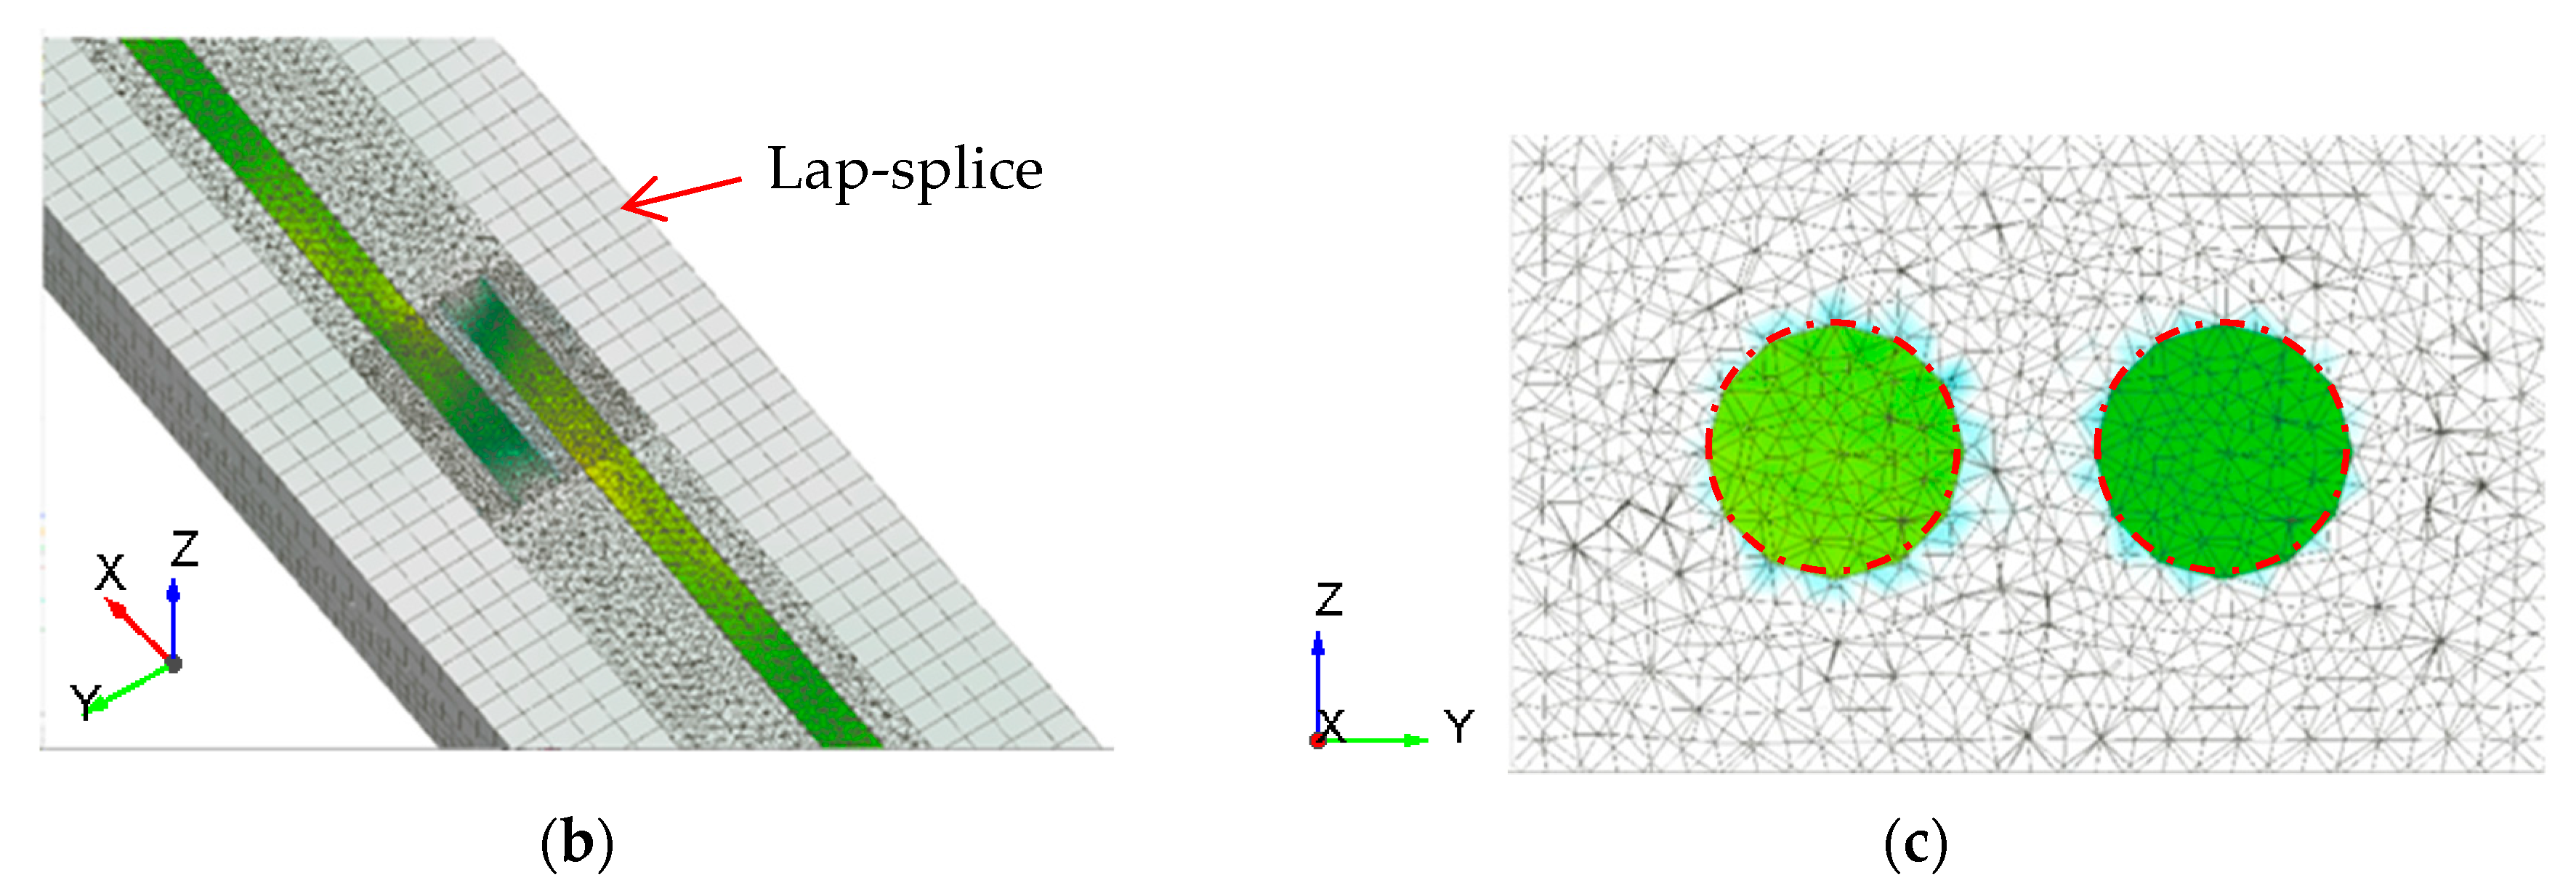
  • Similar stress field to the Lap Spliced PT setups were observed in the LSBT model. The presence of flexural effects leads to greater variability in the stress fields surrounding the test bars than the pullout setups, with particularly greater intensity in the proximity of the bar located on the side cover of the concrete section thereby promoting side splitting.
  • In practical design the development capacity of a bar anchorage may benefit from unaccounted for confinement owing to the arrangement of the structural component, or as a result of the flexural curvature—however these influences, because they usually arise passively as a result of boundary constraints, cannot be accurately quantified in practical applications. It is noted here that the motivating interest of the present work lies in the ability to determine the most conservative, dependable value of bond strength, fbo. In this approach, the extraneous contributions, if they exist, could be considered separately, by rewarding good detailing practice through the reduction of the required anchorage length, in order to account for bond enhancement resulting from confinement and curvature effects. This practice has already been incorporated in existing code provisions, for the contribution of stirrups, larger cover and overbearing axial load [6,13,32,48].

Author Contributions

Both authors have participated in all aspects of the work, the first Author (K.T.) as graduate researcher and the second Author (S.J.P.) in the capacity of supervisor. Both authors have read and agreed to the published version of the manuscript.

Funding

This research was funded by the Natural Sciences and Engineering Research Council of Canada (NSERC). Grant number: RGPIN 2016-05324.

Institutional Review Board Statement

Not applicable.

Informed Consent Statement

Not applicable.

Data Availability Statement

The data presented in this study are available on request from the corresponding author. The data are not publicly available due to privacy restrictions.

Conflicts of Interest

The authors declare no conflict of interest.

References

  1. RILEM/CEB/FIP. Bond of Reinforcement in Concrete—State of the Art. Bulletin No. 10; FIB International: Lausanne, Switzerland, 1970. [Google Scholar]
  2. ASTM C234-91a. Standard Test Method for Comparing Concrete on the Basis of the Bond Developed with Reinforcing Steel; ASTM International: West Conshohocken, PA, USA, 1991. [Google Scholar]
  3. RILEM/CEB/FIP. Bond Test for Reinforcing Steel. 2: Pullout Test; Recommendation RC6: Bagneux, France, 1978. [Google Scholar]
  4. Eligehausen, R.; Popov, E.P.; Bertero, V.V. Local bond stress-slip relationships of deformed bars under generalized excitations. In Proceedings of the 7th European Conference on Earthquake Engineering, Athens, Greece, 20–25 September 1982; pp. 69–80. [Google Scholar]
  5. Tepfers, R. Theory of Bond Applied to Overlapped Tensile Reinforcement Splices for Deformed Bars. Publ. No. 73:2, Chalmers; University of Technology: Gothenburg, Sweden, 1973. [Google Scholar]
  6. Orangun, C.O.; Jirsa, J.O.; Breen, J.E. The Strength of Anchor Bars: A Reevaluation of Test Data on Development Length and Splices, Research Report No. 154-3F, Center for Transportation Research; The University of Texas at Austin: Austin, TX, USA, 1975; p. 194. [Google Scholar]
  7. Orangun, C.O.; Jirsa, J.O.; Breen, J.E. A reevaluation of test data on development length and splices. J. Am. Concr. Inst. 1977, 74, 114–122. [Google Scholar]
  8. Tastani, S.P.; Pantazopoulou, S.J. Reinforcement and concrete bond: State determination along the development length. J. Struct. Eng. (U. S.) 2013, 139, 1567–1581. [Google Scholar] [CrossRef]
  9. Metelli, G.; Plizzari, G.A. Influence of the relative rib area on bond behaviour. Mag. Concr. Res. 2014, 66, 277–294. [Google Scholar] [CrossRef] [Green Version]
  10. Chao, S.H. Bond Characterization of Reinforcing Bars and Prestressing Strands in High Performance Fiber Reinforced Cementitious Composites Under Monotonic and Cyclic Loading. Ph.D. Thesis, University of Michigan, Ann Arbor, MI, USA, 1–9 April 2005. [Google Scholar]
  11. Tastani, S.P.; Pantazopoulou, S.J. Experimental Evaluation of the Direct Tension-Pullout Bond Test. In Proceedings of the 3rd International Conference on Bond in Concrete, Budapest, Hungary, 20–22 November 2002. [Google Scholar]
  12. ACI Committee 408. Bond and Development of Straight Reinforcing Bars in Tension, ACI 408R-03; American Concrete Institute: Farmington Hills, MI, USA, 2003; pp. 1–49. [Google Scholar]
  13. Eurocode 2. Design of Concrete Structures—Part 1-1: General Rules and Rules for Buildings; prEN 1992-1-1:2003E; European Committee for Standardization (CEN): Brussels, Belgium, 2003. [Google Scholar]
  14. Tóth, M.; Bokor, B.; Sharma, A. Anchorage in steel fiber reinforced concrete–concept, experimental evidence and design recommendations for concrete cone and concrete edge breakout failure modes. Eng. Struct. 2019, 181, 60–75. [Google Scholar]
  15. Georgiou, A.; Tastani, S.; Pantazopoulou, S.J. Testing Procedure for Determining the Bond-Slip Law of Steel Bars in Strain Hardening Cementitious Composites. Strain Hardening Cem. Based Compos. 2017, 448–456. [Google Scholar] [CrossRef]
  16. Červenka, V.; Jendele, L.; Červenka, J. ATENA Program Documentation; Cervenka Consulting: Praha, Czech Republic, 2005; pp. 1–282. [Google Scholar]
  17. Perry, E.S.; Thompson, J.N. Bond Stress Distribution on Reinforcing Steel in Beams and Pullout Specimens. ACI J. Proc. 1966, 63. [Google Scholar] [CrossRef]
  18. Ferguson, P.M.; Turpin, R.D.; Thompson, J.N. Minimum bar spacing as a function of bond and shear strength. ACI J. Proc. 1954, 50, 869–887. [Google Scholar]
  19. Lutz, L.A.; Gergely, P. Mechanics of Bond and Slip of Deformed Reinforcement. ACI J. 1967, 64, 711–721. [Google Scholar]
  20. Kemp, E.L.; Brezny, F.S.; Unterspan, J.A. Effect of rust and scale on the bond characteristics of deformed reinforcing bars. ACI J. Proc. 1968, 65, 743–756. [Google Scholar]
  21. Cairns, J.; Plizzari, G.A. Towards a Harmonised European bond test. Mater. Struct. Mater. Constr. 2003, 36, 498–506. [Google Scholar] [CrossRef]
  22. Rex, J.; Sharma, A.; Hofmann, J. A new test specimen to investigate the bond behavior of post-installed reinforcing bars. Struct. Concr. 2019, 20, 583–596. [Google Scholar] [CrossRef]
  23. ASTM A944-99. Standard Test Method For Comparing Bond Strength of Steel Reinforcing Bars to Concrete Using Beam-End Specimens; ASTM: West Conshohocken, PA, USA, 1999; pp. 501–504. [Google Scholar]
  24. ASTM A944-10. Standard Test Method for Comparing Bond Strength of Steel Reinforcing Bars to Concrete Using Beam-End Specimens; ASTM International: West Conshohocken, PA, USA, 2015. [Google Scholar]
  25. RILEM. Bond Test for Reinforcement Steel. 1. Beam Test. RILEM Recommendations for the Testing and Use of Constructions Materials; RILEM: Paris, France, 1982; pp. 213–217. [Google Scholar]
  26. Malvar, L.J. Bond of reinforcement under controlled confinement. Mater. J. 1992, 89, 593–601. [Google Scholar]
  27. Tastani, S.P.; Pantazopoulou, S.J. Direct Tension Pullout Bond Test: Experimental Results. J. Struct. Eng. 2010, 136, 731–743. [Google Scholar] [CrossRef]
  28. De Lorenzis, L.; Rizzo, A.; Tegola, A. A modified pull-out test for bond of near-surface mounted FRP rods in concrete. Compos. Eng. 2002, 33, 589–603. [Google Scholar] [CrossRef]
  29. Cairns, J.; Jones, K. The splitting forces generated by bond. Mag. Concr. Res. 1995, 47, 153–165. [Google Scholar] [CrossRef]
  30. Yuan, J.; Graybeal, B.A. Bond Behavior of Reinforcing Steel in Ultra-High Performance Concrete. Eng. Struct. 2015, 1, 228–235. [Google Scholar]
  31. Tepfers, R. Cracking of concrete cover along anchored deformed reinforcing bars. Mag. Concr. Res. 1979, 31, 3–12. [Google Scholar] [CrossRef]
  32. fib Task Group 4.5. Bond of Reinforcement in Concrete. Technical Report, fib Bulletin 10; The International Federation for Structural Concrete: Lausanne, Switzerland, 2000. [Google Scholar]
  33. fib Bulletin No. 72. Bond and Anchorage of Embedded Reinforcement: Technical report, Background to the fib Model Code for Concrete Structures; The International Federation for Structural Concrete: Lausanne, Switzerland, 2010; ISBN 978-2-88394-112-0. [Google Scholar]
  34. Tastani, S.P.; Brokalaki, E.; Pantazopoulou, S.J. State of Bond along Lap-Splices. ASCE J. Struct. Eng. 2014, 141, 1–14. [Google Scholar] [CrossRef]
  35. Ngo, D.; Scordelis, A.C. Finite Element Analysis of Reinforced Concrete Beams. ACI J. Proc. 1967, 64, 152–163. [Google Scholar]
  36. Salari, M.R.; Spacone, E. Finite element formulations of one-dimensional elements with bond-slip. Eng. Struct 2001, 23, 815–826. [Google Scholar] [CrossRef]
  37. Lowes, L.N.; Moehle, J.P.; Govindjee, S. Concrete-Steel Bond Model for Use in Finite Element Modeling of Reinforced Concrete Structures. ACI Struct. J. 2015, 101, 501–511. [Google Scholar]
  38. Mazzarolo, E.; Scotta, R.; Berto, L.; Saetta, A. Long anchorage bond–slip formulation for modeling of R.C. elements and joints. Eng. Struct. 2012, 34, 330–341. [Google Scholar] [CrossRef]
  39. Keuser, M.; Mehlhorn, G. Finite element models for bond problems. ASCE J. Struct. Eng. 1987, 113, 10. [Google Scholar] [CrossRef]
  40. Lundgren, K.; Gylltoft, K. A model for the bond between concrete and reinforcement. Mag. Concrete Res. 2000, 52, 53–63. [Google Scholar] [CrossRef] [Green Version]
  41. Brisotto, D.D.S.; Bittencourt, E.; Bessa, V.M.R.D.A. Simulating bond failure in reinforced concrete by a plasticity model. Comput. Struct. 2012, 106–107, 81–90. [Google Scholar] [CrossRef]
  42. Murcia-Delso, J.; Benson-Shing, P. Bond-slip model for detailed finite-element analysis of reinforced concrete structures. J. Struct. Eng. (U. S.) 2015, 141, 1–10. [Google Scholar] [CrossRef]
  43. Reinhardt, H.W.; Blaauwendraad, J.; Vos, E. Prediction of bond between steel and concrete by numerical analysis. Mater. Constr. 1984, 2, 1–8. [Google Scholar] [CrossRef]
  44. Jendele, L.; Cervenka, J. Finite element modelling of reinforcement with bond. Comput. Struct. 2006, 84, 1780–1791. [Google Scholar] [CrossRef]
  45. Biscaia, H.C.; Chastre, C.; Silva, M.A.G. Double shear tests to evaluate the bond strength between GFRP/concrete elements. Compos. Struct. 2012, 94, 681–694. [Google Scholar] [CrossRef]
  46. Cox, J.V.; Herrmann, L.R. Development of a plasticity bond model for steel reinforcement. Mech. Cohesive Frict. Mater. 1998, 3, 155–180. [Google Scholar] [CrossRef]
  47. Zhou, Z.; Qiao, P. Bond behavior of epoxy-coated rebar in ultra-high performance concrete. Construct. Build. Mater. 2018, 182, 406–417. [Google Scholar] [CrossRef]
  48. Sharma, A.; Eligehausen, R.; Asmus, J. Experimental investigation of concrete edge failure of multiple-row anchorages with supplementary reinforcement. Struct. Concr. 2017, 18, 153–163. [Google Scholar] [CrossRef]
Figure 1. Overview of commonly used setups for the study of bond: (a) SPT; (b) SPT-T; (c) EPT; (d) BET; (e) DTPT; (f) “H-shaped” TPT ((f.1): elevation; (f.2): plan); (g) contact lap splice PT; (h) non-contact lap splice PT ((h.1): continuous; (h.2): discontinuous); (i) lap splice beam test—LSBT.
Civileng 02 00002 g001
Figure 2. Interface CCIsoGap element [16].
Civileng 02 00002 g002
Figure 3. Failure surface criterion: Mohr—Coulomb with tension cut-off [16].
Civileng 02 00002 g003
Figure 4. Softening functions for the interface: (a) Tension; (b) Cohesion.
Civileng 02 00002 g004
Figure 5. (a) Axisymmetric boundary conditions for rectangular specimen; (b) solid element mesh distribution for DTPT model.
Civileng 02 00002 g005
Figure 6. Specimen model sections (test bar highlighted in red outline): (a) SPT/SPT-T section; (b) EPT/BET section; (c) BET support scheme; (d) DTPT section; (e) “H-Shaped” TPT section; (f) contact lap-splice PT section; (g) non-contact lap splice PT section.
Civileng 02 00002 g006
Figure 7. Layout of LSBT specimen: (a) plan view; (b) section view.
Civileng 02 00002 g007
Figure 8. Summary of force–displacement responses of the various pullout setups.
Civileng 02 00002 g008
Figure 9. Distribution of σzz stresses at peak strength for one-bar pullout setups: (a) SPT; (b) SPT-T; (c) EPT; (d) BET, (e) DTPT, (f) “H-shaped” TPT.
Civileng 02 00002 g009
Figure 10. Distribution of σzz stresses at peak strength for spliced pullout setups: (a,d) contact lap splice PT, (b,e) non-contact lap splice PT (continuous); (c,f) non-contact lap splice PT (discontinuous).
Civileng 02 00002 g010
Figure 11. Distribution of σxx stresses at peak strength for one-bar pullout setups: (a) SPT; (b) SPT-T; (c) EPT; (d) BET, (e) DTPT, (f) “H-shaped” TPT.
Civileng 02 00002 g011
Figure 12. Distribution of σxx stresses at peak strength for spliced pullout setups: (a,d) contact lap splice PT, (b,e) non-contact lap splice PT (continuous); (c,f) non-contact lap splice PT (discontinuous).
Civileng 02 00002 g012
Figure 13. Distribution of τxz stresses at peak strength for one-bar pullout setups: (a) SPT; (b) SPT-T; (c) EPT; (d) BET, (e) DTPT, (f) “H-Shaped” TPT.
Civileng 02 00002 g013
Figure 14. Distribution of τxz stresses at peak strength for spliced pullout setups: (a,d) contact lap splice PT, (b,e) non-contact lap splice PT (Continuous); (c,f) non-contact lap splice PT (discontinuous).
Civileng 02 00002 g014
Figure 15. Distribution of σxx stresses at for the lap splice beam model: (a) side view of outer bar, (b) perspective view of bar centerlines, (c) section view at beam midspan.
Civileng 02 00002 g015aCivileng 02 00002 g015b
Figure 16. Distribution of σyy stresses at for the lap splice beam model: (a) side view of outer bar, (b) perspective view of bar centerlines, (c) section view at beam midspan.
Civileng 02 00002 g016
Figure 17. Distribution of σzz stresses at for the lap splice beam model: (a) side view of outer bar, (b) perspective view of bar centerlines, (c) section view at beam midspan.
Civileng 02 00002 g017
Figure 18. Distribution of τxz stresses at for the lap splice beam model: (a) side view of outer bar—note the opposite disposition of bond stresses at top and bottom of each bar in the pair (insert: zoom in the lapped zone), (b) perspective view of bar centerlines, (c) section view at beam midspan.
Civileng 02 00002 g018
Table 1. Interface element and material properties.
Interface PropertiesValue
Normal stiffness Knn (MN/m3)5.00 × 107
Tangential stiffness Ktt (MN/m3)2.00 × 107
Tensile strength ft (MPa)2.30
Cohesion c (MPa)10.0
Friction Coefficient tanφ1.00
Min. Normal stiffness Knn,min (MN/m3)5.00 × 103
Min. Tangential stiffness Ktt,min (MN/m3)2.00 × 103
Table 2. Summary of peak values between the various pullout setups studied.
Test SetupMax Developed Bar Stress (kN/MPa)Displacement of Loaded End of the Bar at Peak Load (mm)
SPT48.32/241.60.28
SPT-T39.36/196.80.09
EPT40.04/200.20.11
BET31.76/158.80.14
DTPT26.28/131.40.11
“H-Shaped” TPT28.54/142.70.14
Contact Lap Splice PT26.7/133.70.06
Non-contact Lap Splice PT (Continuous)55.06/275.30.14
Non-contact Lap Splice PT (Discontinuous)30.76/153.80.06
Publisher’s Note: MDPI stays neutral with regard to jurisdictional claims in published maps and institutional affiliations.

