Microstructure and Mechanical Behavior of Concrete Based on Crushed Sand Combined with Alluvial Sand


Abstract
1. Introduction
2. Materials and Methods
2.1. Material Characterization
2.1.1. Cement
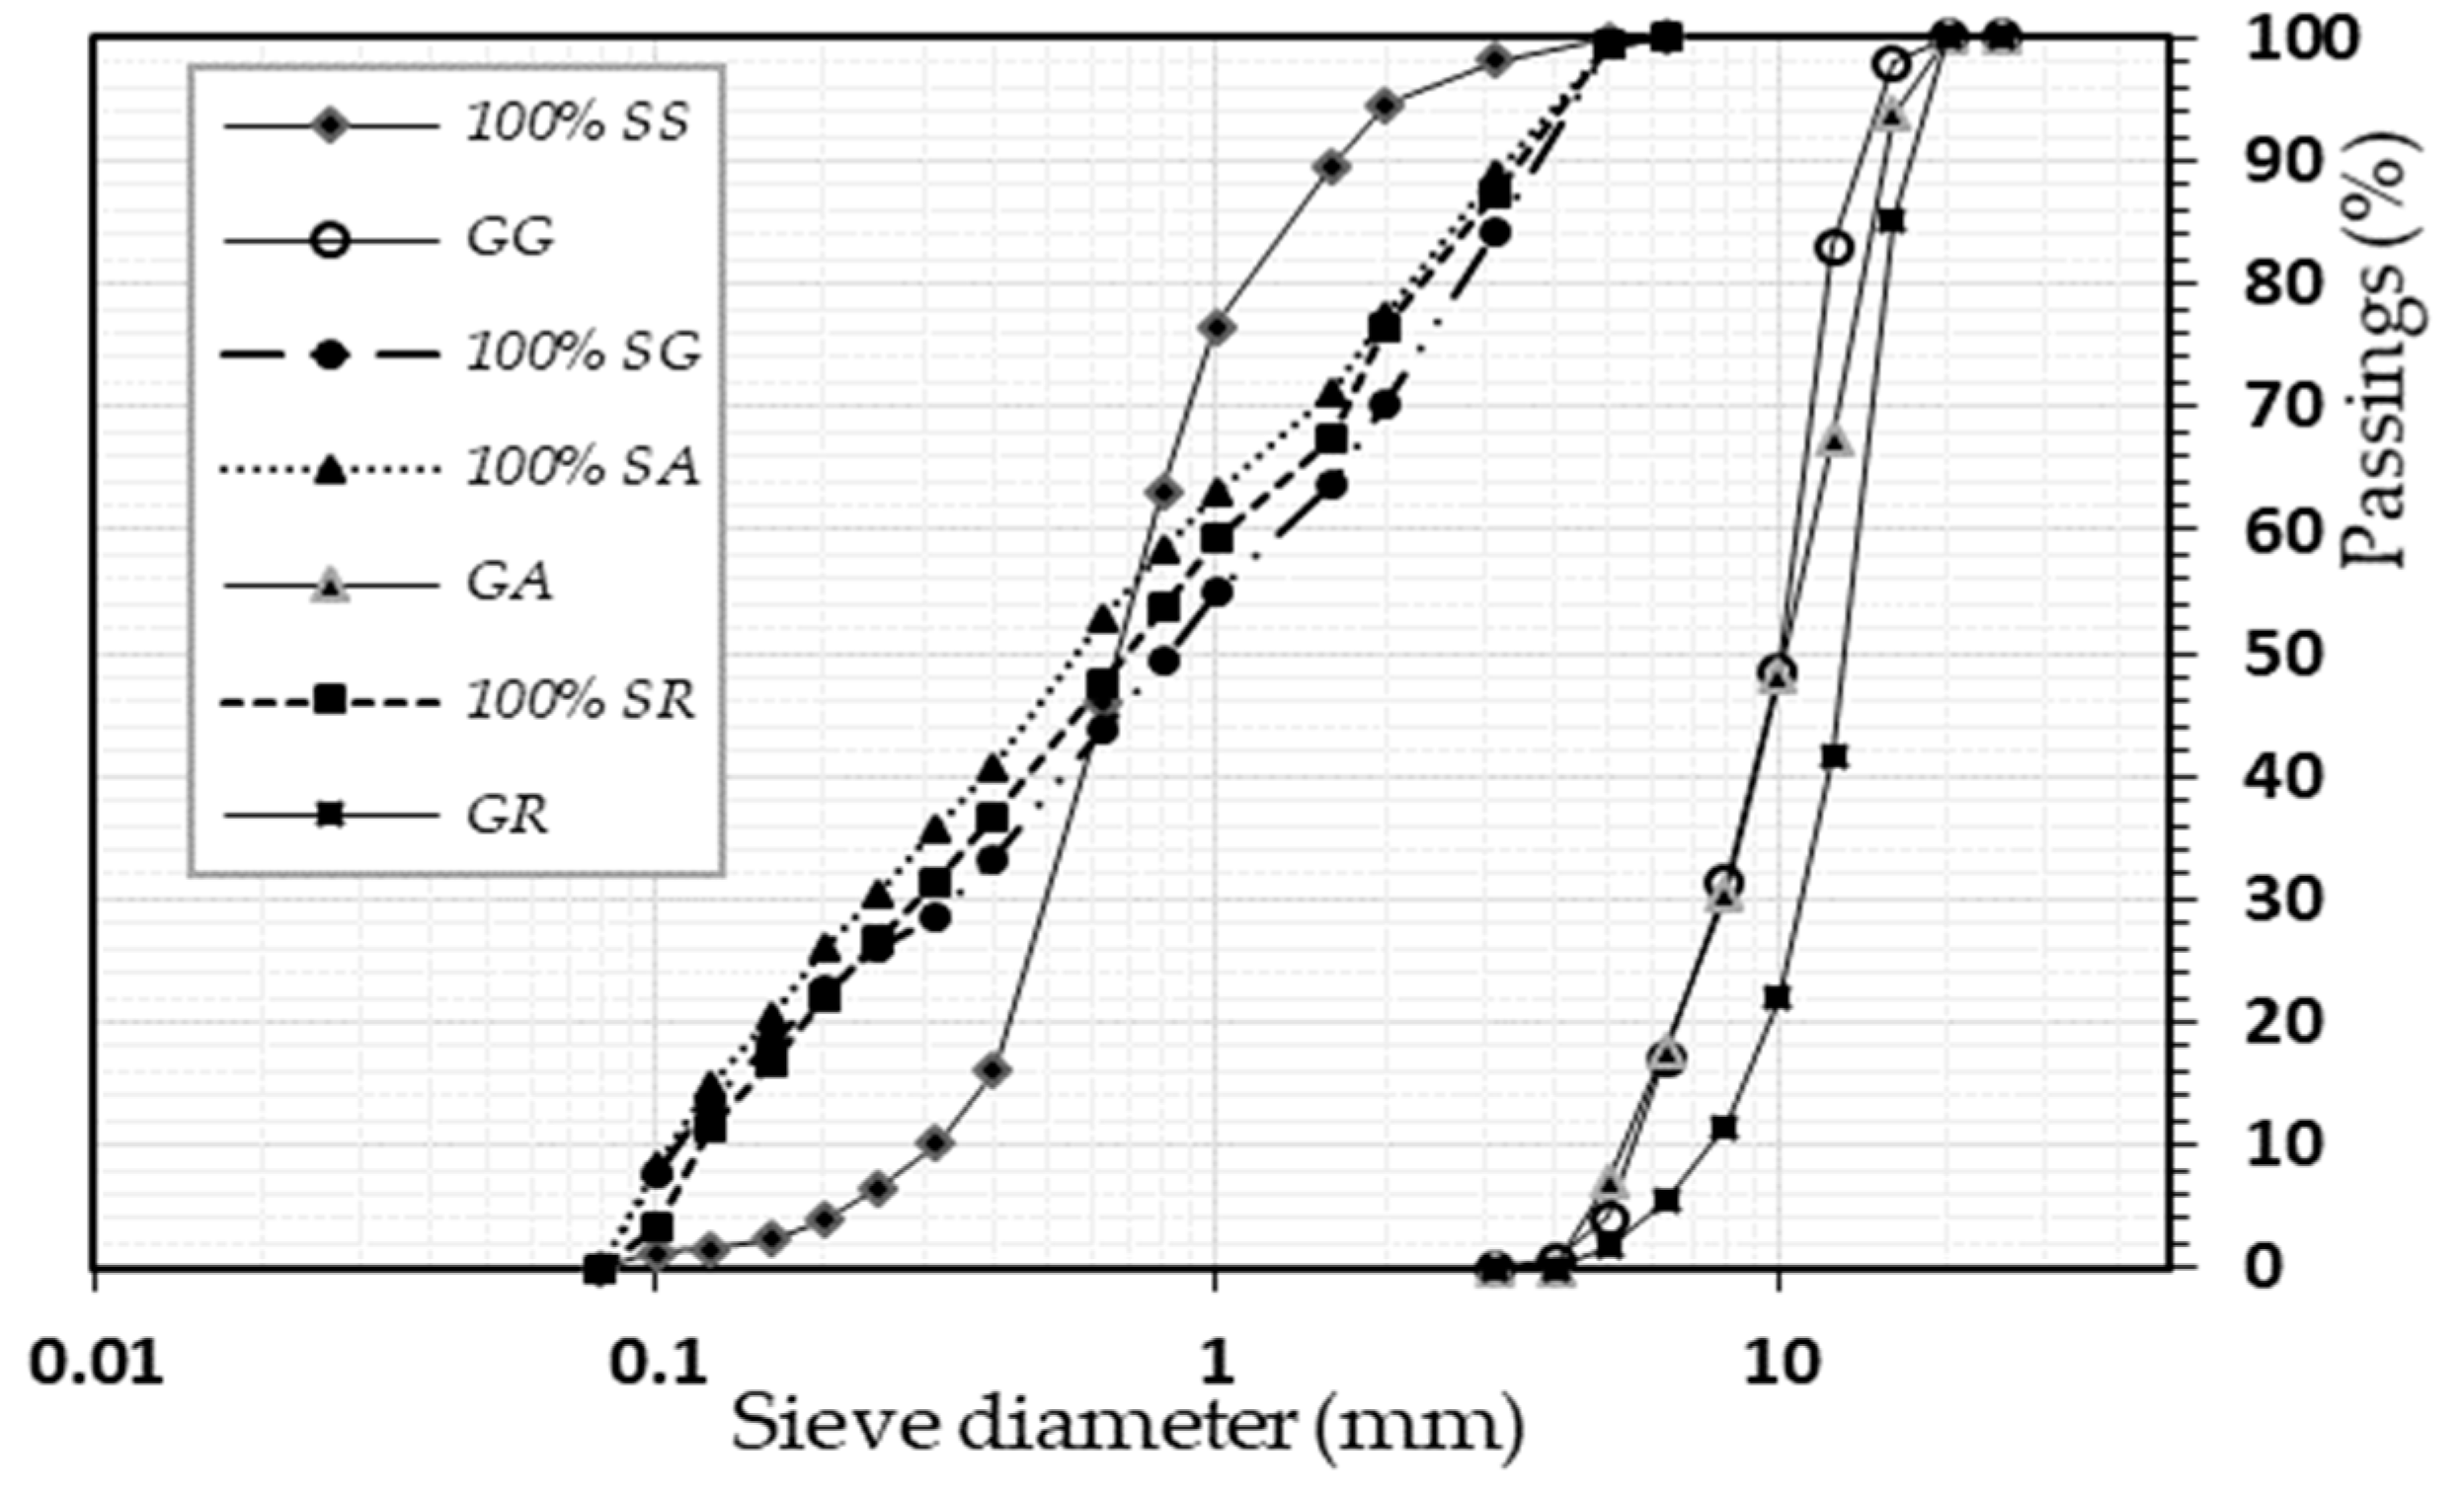
2.1.2. Sand
2.1.3. Gravel
2.2. Methods
2.2.1. Concrete Mix Design
2.2.2. Experimental Schedule
- Physical properties
- Density of concrete: The density measurement was carried out after 28 days of curing conservation using tap water at 20 ± 2 °C. A series (3 cylindrical samples of 50 × 150 mm) of concrete samples was then removed from the storage water. Next, the samples were dried in a ventilated oven at a temperature of 80 °C until the mass stabilized (a difference of less than 0.05% between the two weighing operations spaced 24 h apart, to an accuracy of 0.01 g). Density tests were performed according to ASTM C 642-13 [18], and the density value was evaluated as follows (Equation (1)):where A is the mass (g) of the oven-dried sample in air, C is the mass (g) of the saturated surface-dried sample in the air, and D is the mass (g) of the sample in water after immersion.
- Water porosity: The water porosity test was carried out after 28 days of curing on 5 samples in accordance with the standard NF P 18-459. The porosity was then computed as follows (Equation (2)):where Msat is the mass (g) of the saturated specimen in the air, Mdry at T is the mass (g) of the dried specimen at the desired temperature, and Mwater is the mass (g) of the saturated specimen under water.
- Gas permeability: The gas permeability of the different concretes was measured using the Cembureau method [19]. For each concrete, measurements were carried out on three 50 mm thick and 150 mm diameter discs. After 28 days of curing in water, the samples were dried in a ventilated oven at a temperature of 80 °C until the mass stabilized (a difference of less than 0.05% between the two weighing operations spaced 24 h apart, to an accuracy of 0.01 g) [20]. The underlying principle used for this test was the Hagen–Poiseuille relation for the laminar flow of a compressible fluid through a porous body under steady-state conditions. Hagen–Poiseuille (Equation (3)) allows one to determine the specific permeability coefficient:where Q is the volume flow rate of fluid (m3/s); L is the thickness of the specimen (m) = 0.05 m; A is the cross-sectional area of the specimen (m2) = 7.854 × 10⁻³; is the dynamic viscosity of the fluid (Nitrogen) at 20 °C (Pa.s) = 1.76 × 10⁻⁵; Patm is the atmospheric pressure (Pa) = 101,325 Pa; and P is the inlet pressure (Pa).Using Kgas for different inlet pressures, the intrinsic permeability of the concrete can be calculated using the method of Klinkenberg (Equations (4) and (5)) [21]:where P0 is the atmospheric pressure (Pa), is the Klinkenberg constant, and Kint is the slope of line of Klinkenberg.
- Drying shrinkage: The measurement of drying shrinkage was carried out on prismatic concrete specimens 70 × 70 × 280 mm 24 h after confection under climatic conditions at T = 20 ± 2 °C and 50 ± 5% RH, according to the conditions described in standard NF P 18-427.
- Mechanical properties
- Compressive strength: The compressive strength was determined on 3 cylinder specimens that were 160 mm in diameter and 320 mm in height at 7, 21, and 28, days of curing in a water tank at a temperature of 20 °C, in accordance with the standard NF P 18-406. For tests at 90 days of curing, cylinder specimens 110 mm in diameter and 220 mm in height were used. The average laboratory target strength was 25 MPa at 28 days.
- Static modulus of elasticity: For the static modulus analysis, cylinder specimens 110 mm in diameter and 220 mm in height were used. The test was carried out after 90 days of curing, simultaneously with the compressive strength, and on the same samples. Static modulus values were determined only for concretes made with 50% and with 100% of river sand. An hydraulic press with a capacity of 3000 kN and a travel speed of 0.5 MPa/s was used for the compression test, according to the standard NF EN 12390-3. The concrete specimens were carefully surfaced with sulfur and were instrumented by a set of four strain gauges placed on the lateral surface and at the mid-height of the specimen, two of which were placed longitudinally, two of which were placed horizontally, and two of which were diametrically opposite, as shown in Figure 5. The data acquisition unit recorded the deformation every 0.001 s, while the hydraulic press recorded the stress evolution and the compression displacement every 0.1 s. The plot of the stress–displacement curve was made directly from the data recorded by the hydraulic press. For the plot of the stress–strain curve, the data recorded in the data acquisition unit were filtered to retain only the deformations corresponding to 0.1 s to match the stresses of the press.
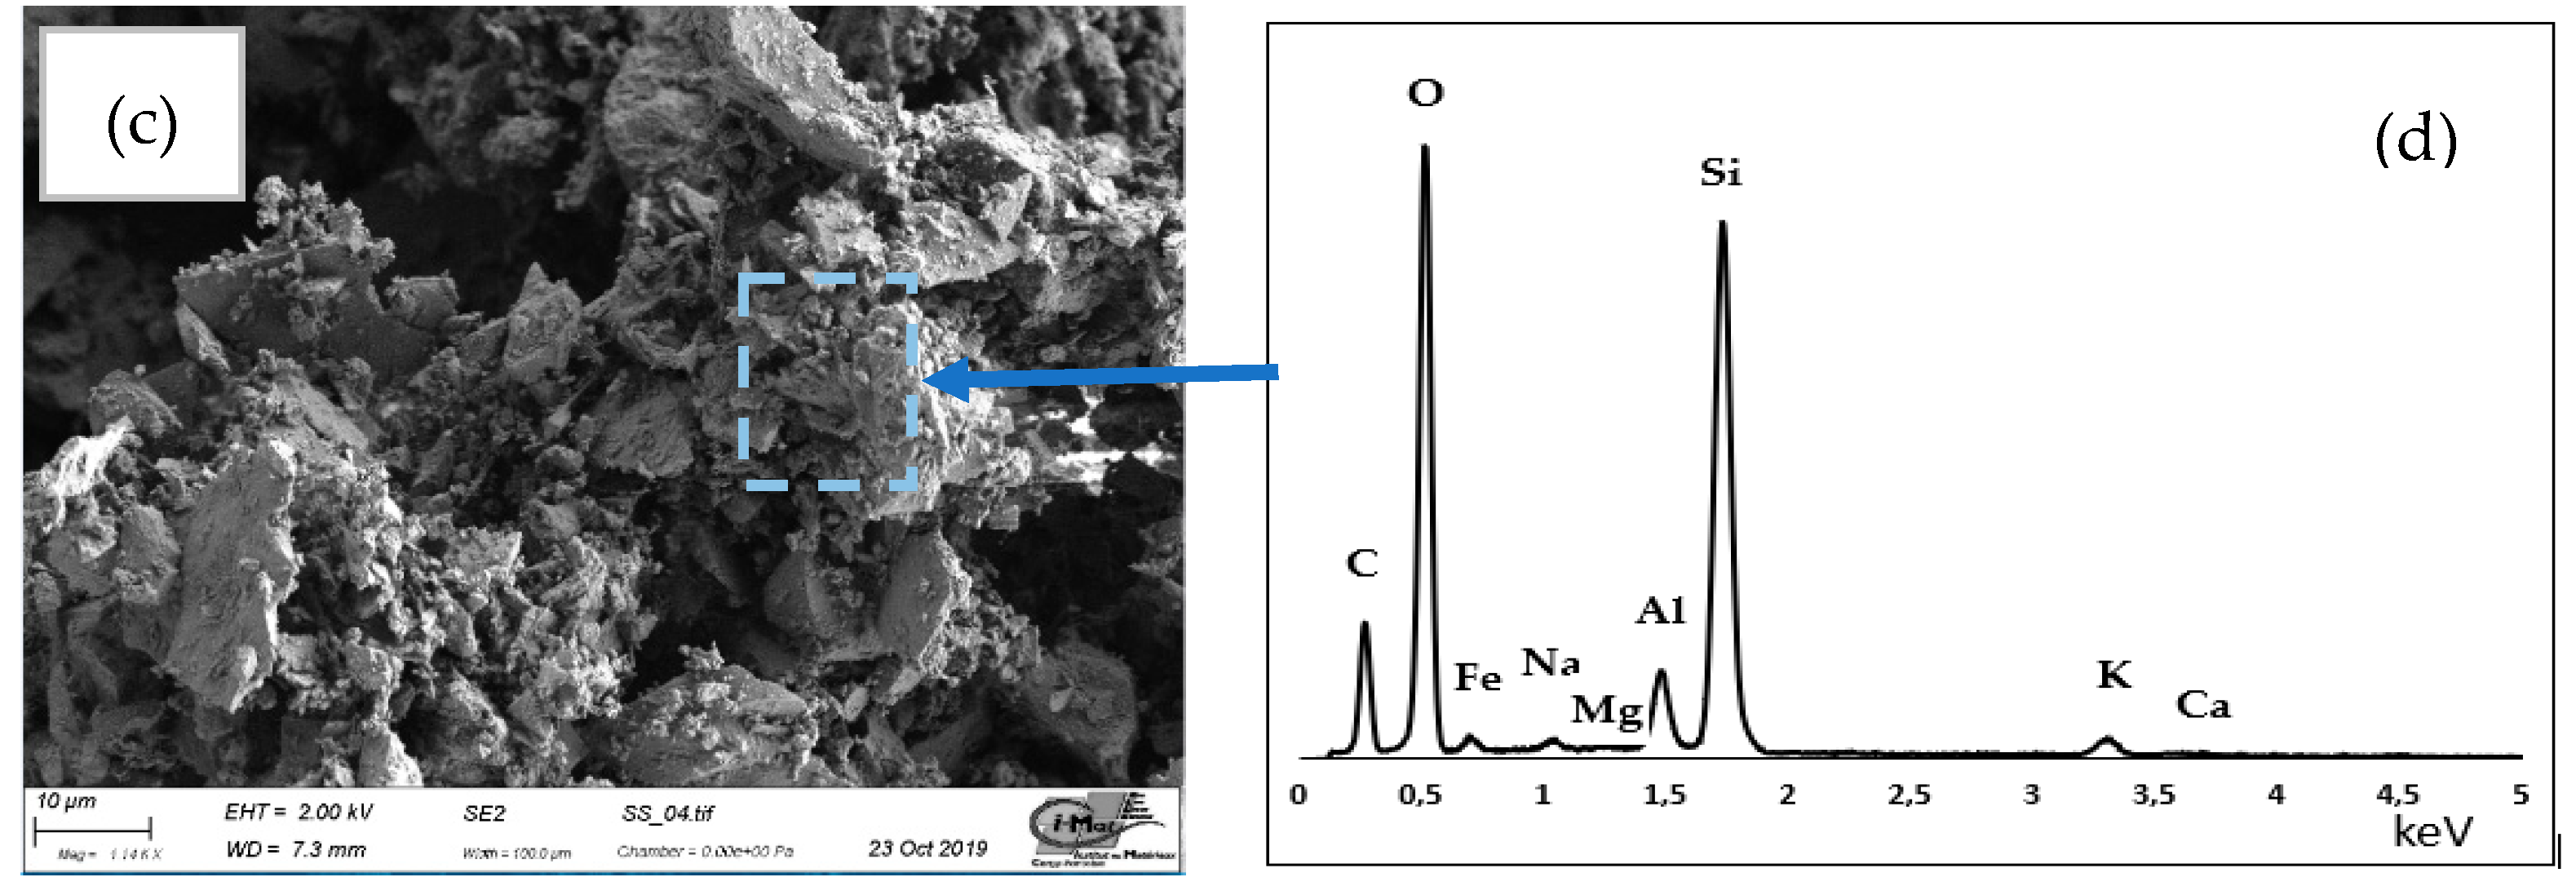
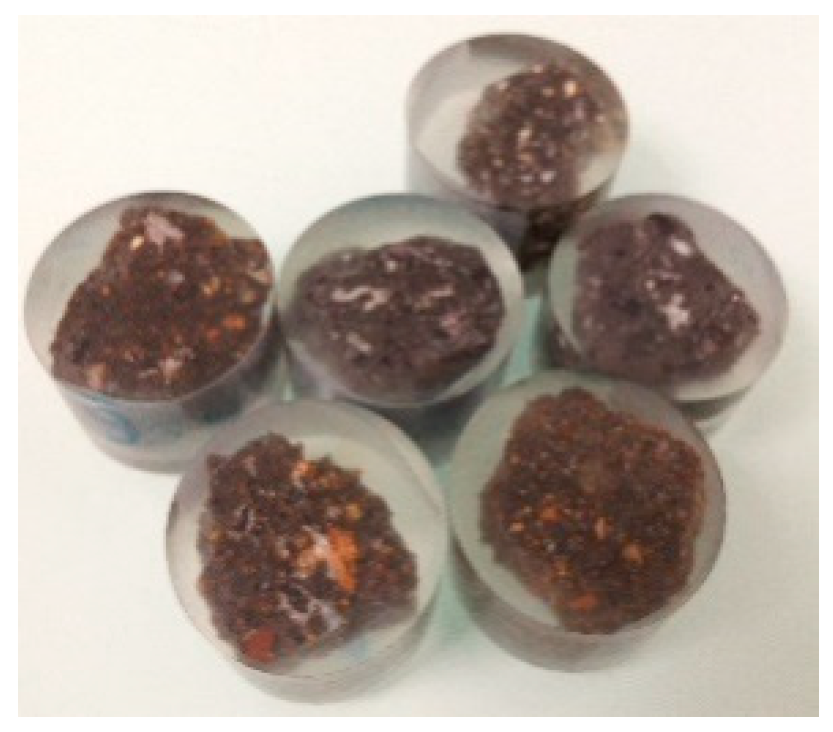
- Scanning electron microscopy
3. Results and Discussion
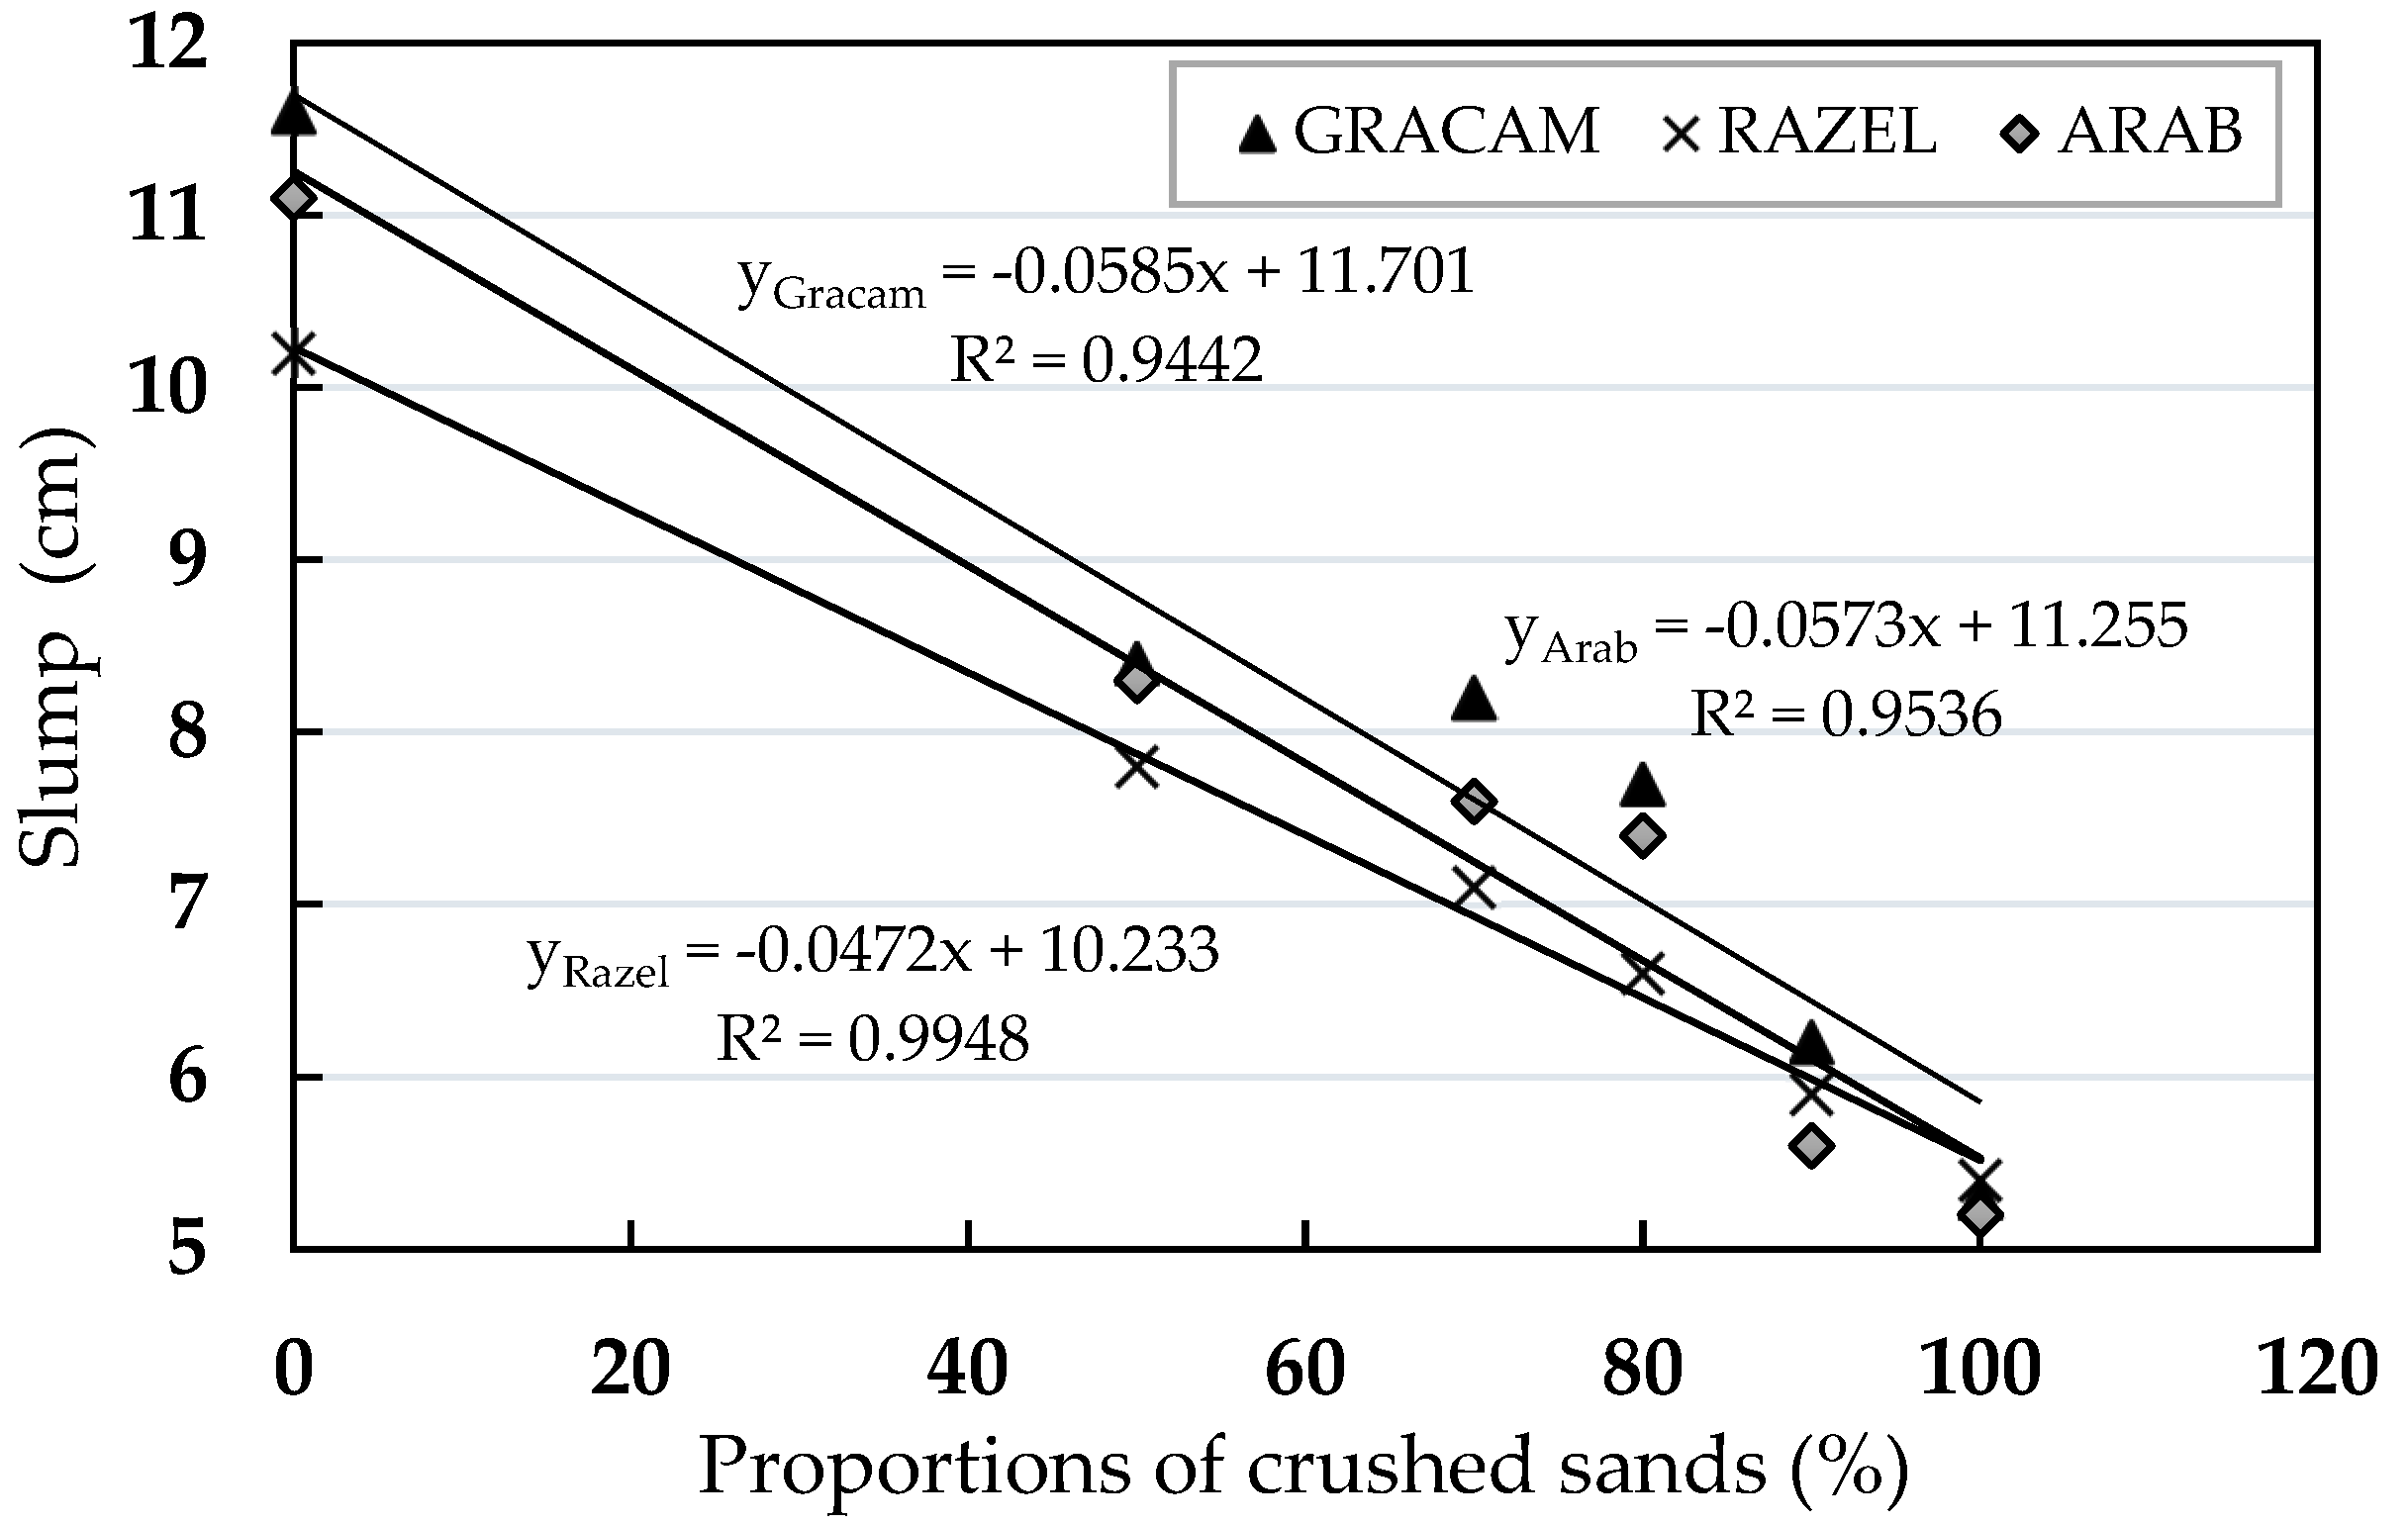
3.1. Concrete Workability
3.2. Drying Shrinkage of Concrete
3.3. Water Porosity and Density of Concretes
3.4. Gas Permeability
3.5. Compressive Strength at 7, 21, and 28 Days
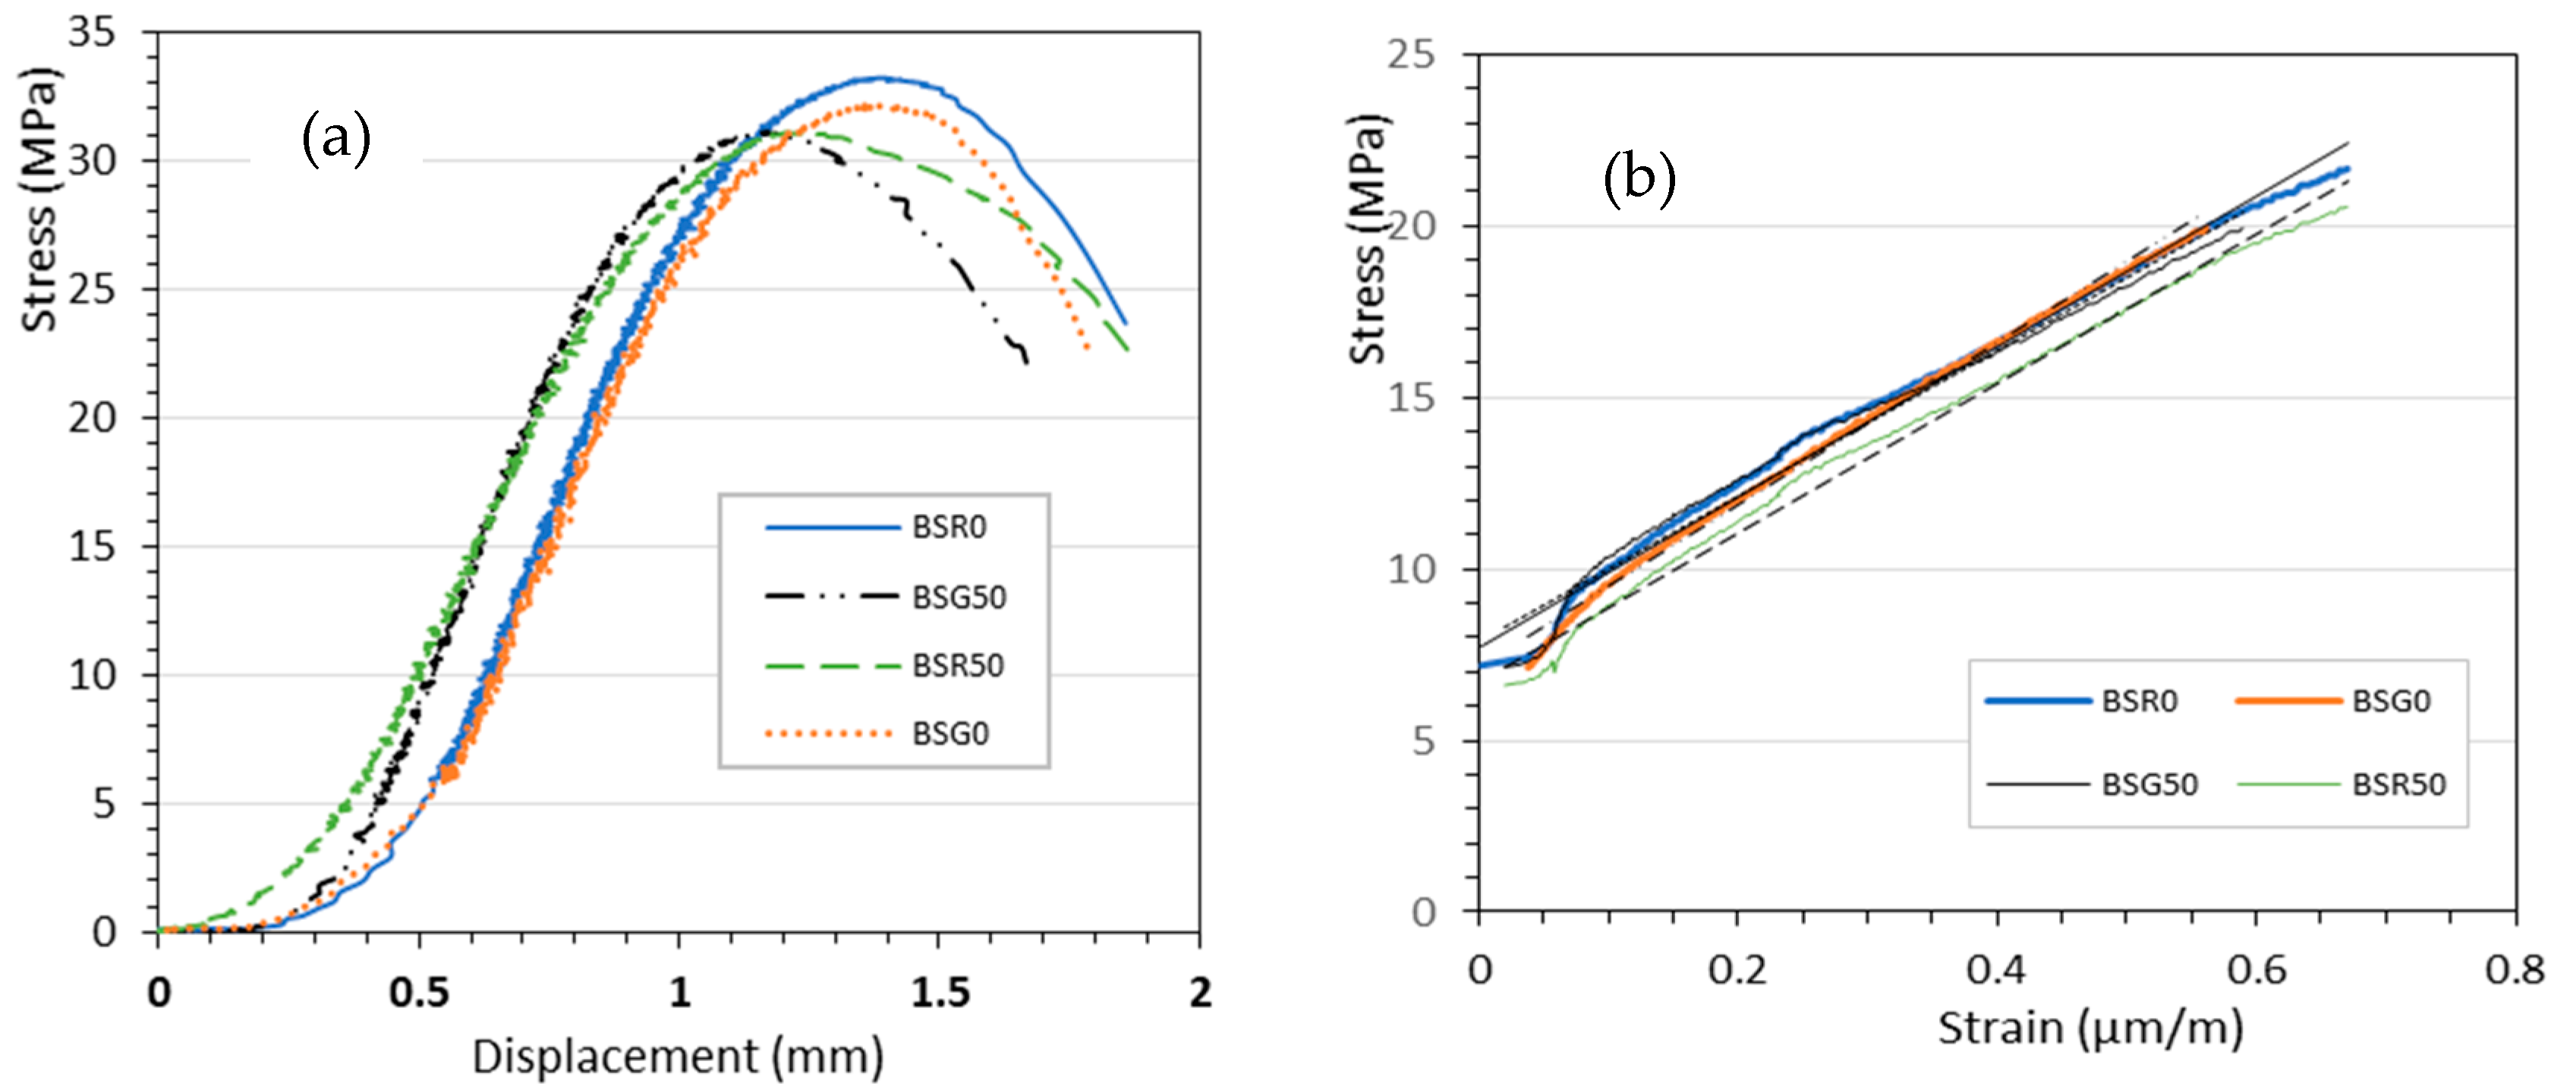
3.6. Static Modulus of Elasticity and Compressive Strength at 90 Days
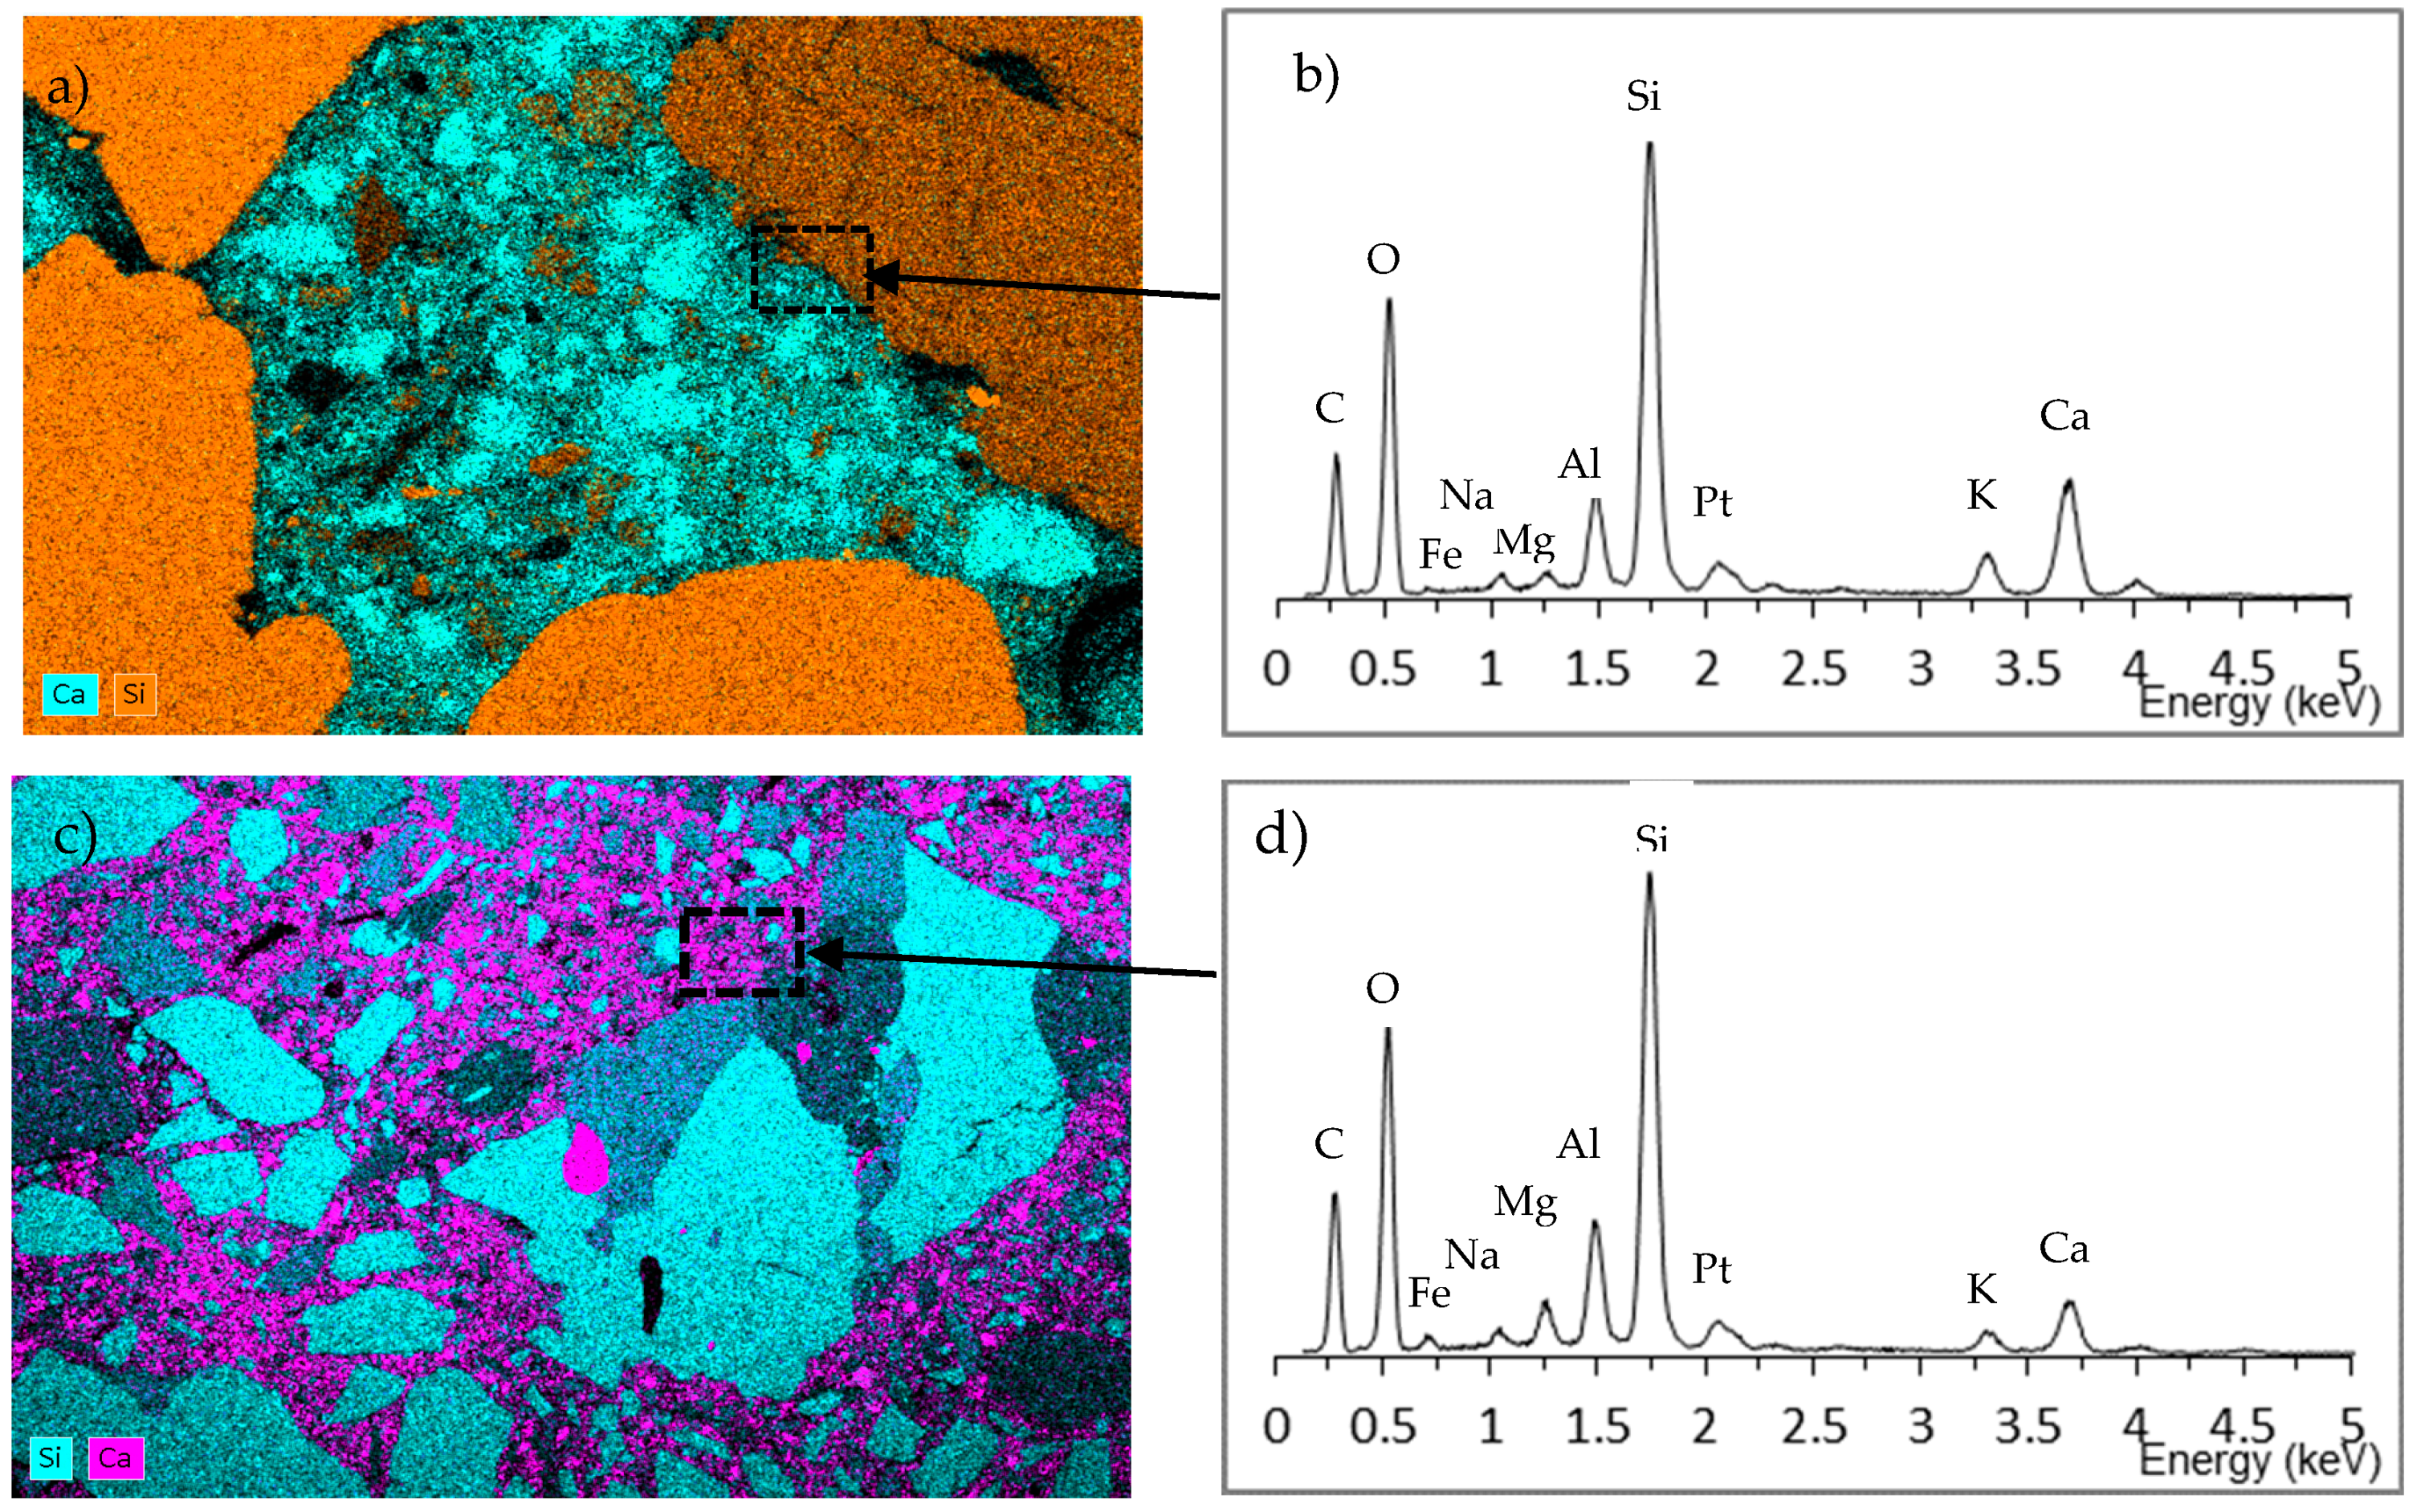
3.7. SEM and-EDS Analysis
3.7.1. Pore Structure and Microcracking
3.7.2. Chemical Mapping of Silicon and Calcium Analysis
4. Conclusions
- In this investigation, a combination of crushed sand and river sand to develop an optimal mix design for concrete is proposed. Crushing sands (three quarry sites were identified) were analyzed and used in different proportions for the formulation of concrete combined with river sand. Physical, mechanical, and microstructural tests were carried out on the studied concretes. From the results of this study, following conclusions can be drawn. The results confirmed that the use of crushed sands (from gneiss rock) for the concretes mixes is possible;
- The results showed that increasing the amount of crushed sand decrease the slump. It is due to the high proportions of fine particles. This high proportion of fine particles in quarry sands has shown to have an impact on the drying shrinkage of different formulated concretes, as well as on porosity and gas permeability;
- Drying shrinkage increased very swiftly in the first few days, with high values recorded for the concrete with 100% crushed sand compared to the concrete with 100% river sand;
- The use of crushed sand in the design of concrete mixes in proportions of 50% reduced the porosity accessible to water and the gas permeability of the concrete;
- The mixture of 50% crushed sand and river sand in the concrete mix design did not have a significant influence on the compressive strength of the concrete at 28 days, with a slight reduction of about 2 to 3%;
- A reduction in the static modulus of elasticity of the conventional concrete of about 5.8% was observed compared to the concrete with 50% crushed sand;
- The compressive strength of the concretes increased as the curing age increased from 28 to 90 days by 14.41% and 20.62%, respectively, for both concretes with and without crushed sand;
- SEM observations provided a good understanding of the porosity results. It was also found that the microcracking structure pattern is higher for concrete made with 100% of river sand, compared to the concrete made with 50% of river sand.
Supplementary Materials
Author Contributions
Funding
Acknowledgments
Conflicts of Interest
References
- Zeghichi, L.; Benghazi, Z.; Baali, L. The effect of the kind of sands and additions on the mechanical Behaviour of S.C.C. Phys. Procedia 2014, 55, 485–492. [Google Scholar] [CrossRef]
- Koffi, K.; Aubertin, M.; Hernandez, M.A.; Ouangrawa, M.; Chapuis, R.; Bussiere, B. Etude de la conductivité hydraulique des mélanges à granulométrie étalée. Can. Geo Conf. 2008, 7, 1478–1483. [Google Scholar]
- Benabed, B.; Kadri, E.; Azzouz, L.; Kenai, S. Properties of self-compacting mortar made with various types of sand. Cem. Concr. Compos. 2012, 34, 1167–1173. [Google Scholar] [CrossRef]
- Cabrera, O.A.; Traversa, L.P.; Ortega, N.F. Fluidez de morteros cementíceos con arenas machacadas. Mater. Constr. 2010, 60, 115–130. [Google Scholar] [CrossRef]
- Abdullahi, M. Effect of aggregate type on compressive strength of concrete. Int. J. Civ. Struct. Eng. 2012, 2. [Google Scholar] [CrossRef]
- Kou, S.-C.; Poon, C.-S. Properties of concrete prepared with crushed fine stone, furnace bottom ash and fine recycled aggregate as fine aggregates. Constr. Build. Mater. 2009, 23, 2877–2886. [Google Scholar] [CrossRef]
- Imamoto, K.; Arai, M. Specific surface area of aggregate and its relation to concrete drying shrinkage. Mater. Struct. 2007, 41, 323–333. [Google Scholar] [CrossRef]
- Leroy, M.N.L.; Molay, T.G.G.; Joseph, N.; Bienvenu, N.J.M. Analysis of Strength Hydraulic Concrete Produced with a Mixture of crushed Gneiss and Alluvial Sand. J. Appl. Mech. Eng. 2017, 6. [Google Scholar] [CrossRef]
- Khouadjia, M.L.K.; Mezghiche, B.; Drissi, M. Experimental evaluation of workability and compressive strength of concrete with several local sand and mineral additions. Constr. Build. Mater. 2015, 98, 194–203. [Google Scholar] [CrossRef]
- Rmili, A.; Ben Ouezdou, M.; Added, M.; Ghorbel, E. Incorporation of Crushed Sands and Tunisian Desert Sands in the Composition of Self Compacting Concretes Part II: SCC Fresh and Hardened States Characteristics. Int. J. Concr. Struct. Mater. 2009, 3, 11–14. [Google Scholar] [CrossRef]
- Menadi, B.; Kenai, S.; Khatib, J.; Aït-Mokhtar, A. Strength and durability of concrete incorporating crushed limestone sand. Constr. Build. Mater. 2009, 23, 625–633. [Google Scholar] [CrossRef]
- L-Ameeri, A.A. Using different types of fine aggregate to produce high strength concrete, Department of Civil Engineering. Int. J. Arts Sci. 2012, 5, 187. [Google Scholar]
- Piasta, W.; Góra, J.; Budzyński, W. Stress–strain relationships and modulus of elasticity of rocks and of ordinary and high-performance concretes. Constr. Build. Mater. 2017, 153, 728–739. [Google Scholar] [CrossRef]
- Touzé, P.; Godart, B. Evaluation de la Teneur en Alcalins Equivalents Actifs dans les Ciments. Techniques et Methodes des Laboratoires de Ponts et Chaussees. 1997. Available online: https://trid.trb.org/view/989402. (accessed on 31 May 2020).
- «Sand Equivalent», Pavement Interactive. Available online: https://pavementinteractive.org/reference-desk/testing/aggregate-tests/sand-equivalent/ (accessed on 4 April 2020).
- Aubry, M.P. Recherches sur la Nannopetrographie des Roches Siliceuses. rech. sur Nannopetrographie Roches Siliceuses, 975, VOL. 62, NUM. 0002, P. 7 A 34. Available online: https://pascal-francis.inist.fr/vibad/index.php?action=getRecordDetail&idt=PASCALGEODEBRGM7620096607 (accessed on 24 September 2020).
- Dreux, G.; Festa, J. Nouveau Guide du Béton; Eyrolles: Paris, France, 1995. [Google Scholar]
- C09 Committee. Test Method for Density, Absorption, and Voids in Hardened Concrete; ASTM International: Conshohocken, PA, USA, 2013. [Google Scholar] [CrossRef]
- Abbas, A.; Carcasses, M.; Ollivier, J.-P. Gas permeability of concrete in relation to its degree of saturation. Mater. Struct. 1999, 32, 3–8. [Google Scholar] [CrossRef]
- Kollek, J.J. The determination of the permeability of concrete to oxygen by the Cembureau method-a recommendation. Mater. Struct. 1989, 22, 225–230. [Google Scholar] [CrossRef]
- Zhang, D.; Li, K. Concrete gas permeability from different methods: Correlation analysis. Cem. Concr. Compos. 2019, 104, 103379. [Google Scholar] [CrossRef]
- Yang, S.; Lee, H. Mechanical properties of recycled aggregate concrete proportioned with modified equivalent mortar volume method for paving applications. Constr. Build. Mater. 2017, 136, 9–17. [Google Scholar] [CrossRef]
- Scrivener, K.L. Backscattered electron imaging of cementitious microstructures: Understanding and quantification. Cem. Concr. Compos. 2004, 26, 935–945. [Google Scholar] [CrossRef]
- Donza, H.; Cabrera, O.; Irassar, E.F. High-strength concrete with different fine aggregate. Cem. Concr. Res. 2002, 32, 1755–1761. [Google Scholar] [CrossRef]
- Bouhamou, N.; Belas, N.; Mesbah, H.; Jauberthie, R.; Ouali, A.; Mebrouki, A. Influence des rapports eau/ciment et fines/ciment sur le comportement à l’état durci du béton autoplaçant à base de matériaux locaux algériens. Can. J. Civ. Eng. 2009, 36, 1195–1206. [Google Scholar] [CrossRef]
- Berredjem, L.; Arabi, N.; Molez, L. Mechanical and durability properties of concrete based on recycled coarse and fine aggregates produced from demolished concrete. Constr. Build. Mater. 2020, 246, 118421. [Google Scholar] [CrossRef]
- Dang, J.; Zhao, J. Influence of waste clay bricks as fine aggregate on the mechanical and microstructural properties of concrete. Constr. Build. Mater. 2019, 228, 116757. [Google Scholar] [CrossRef]


| Elements | SiO2 | Al2O3 | Fe2O3 | MnO | MgO | CaO | Na2O | K2O | TiO2 | P2O5 | LOI |
|---|---|---|---|---|---|---|---|---|---|---|---|
| Proportions (%) | 25.99 | 7.23 | 6.35 | 0.13 | 2.56 | 48.91 | 1.02 | 0.91 | 0.97 | 0.26 | 2.67 |
| Constituents | C3S | C2S | C3A | C4AF |
|---|---|---|---|---|
| Proportions (%) | 50–65 | 15–20 | ≤7 | ≤5 |
| Sand | Fines Content (%) | Fineness Modulus | Sand Equivalent (%) | Apparent Density (kg/m3) | Specific Density (kg/m3) |
|---|---|---|---|---|---|
| SA | 6.3 | 2.4 | 87.3 | 1674 | 2746 |
| SG | 8.3 | 2.7 | 89.9 | 1872 | 2865 |
| SR | 7.6 | 2.6 | 82.5 | 1825 | 2790 |
| SS | 1.4 | 2.5 | 95.9 | 1397 | 2623 |
| Sand | SiO2 | Al2O3 | Fe2O3 | MnO | MgO | CaO | Na2O | K2O | TiO2 | P2O5 | LOI |
|---|---|---|---|---|---|---|---|---|---|---|---|
| SA | 65.50 | 15.69 | 7.76 | 0.16 | 2.74 | 1.37 | 1.76 | 2.68 | 0.95 | 0.14 | 0.57 |
| SG | 62.55 | 16.61 | 8.81 | 0.19 | 3.18 | 1.68 | 1.84 | 2.68 | 1.00 | 0.17 | 0.41 |
| SR | 67.53 | 13.73 | 7.66 | 0.14 | 2.43 | 2.22 | 1.82 | 2.13 | 1.03 | 0.19 | 0.48 |
| SS | 90.16 | 3.96 | 1.54 | 0.03 | 0.08 | 0.23 | 0.43 | 2.01 | 0.23 | -- | 0.79 |
| Gravel | Apparent Density (kg/m3) | Specific Density (kg/m3) |
|---|---|---|
| GA | 1598 | 2816 |
| GG | 1615 | 2846 |
| GR | 1654 | 2822 |
| Gravel | SiO2 | Al2O3 | Fe2O3 | MnO | MgO | CaO | Na2O | K2O | TiO2 | P2O5 | LOI |
|---|---|---|---|---|---|---|---|---|---|---|---|
| GA | 68.54 | 14.45 | 5.91 | 0.11 | 2.23 | 1.33 | 2.11 | 3.86 | 0.76 | 0.11 | 0.51 |
| GG | 67.08 | 14.24 | 6.84 | 0.12 | 2.76 | 2.05 | 2.01 | 2.52 | 0.88 | 0.16 | 0.70 |
| GR | 68.36 | 13.22 | 7.20 | 0.12 | 2.29 | 2.22 | 2.00 | 1.95 | 0.95 | 0.23 | 0.42 |
| Minerals | Quartz | Feldspar | Biotite | Garnet | Disthene | Muscovite |
|---|---|---|---|---|---|---|
| A | 35–40% | 15–25% | 25–30% | 5–15% | 2–4% | <1% |
| G | 65–70% | 10–15% | 5–7% | 2–5% | 3–5% | <1% |
| R | 50–55% | 20–22% | 30–35% | 2–3% | 7–10% | <1% |
| Sources of Aggregates | Concrete Formulation | Cement (kg) | Water (kg) | River Sand (kg) | Crushed Sand (kg) | Gravel (kg) |
|---|---|---|---|---|---|---|
| Arab Contractor’s aggregate concretes | BSA100: 100%SA: GA | 350 | 205.9 | 0 | 620.08 | 1126.46 |
| BSA90: 90% SA+10%SS: GA | 350 | 205.9 | 63.79 | 574.12 | 1116.52 | |
| BSA80: 80% SA+20%SS: GA | 350 | 205.9 | 127.86 | 511.46 | 1110.49 | |
| BSA70: 70% SA+30%SS: GA | 350 | 205.9 | 194.05 | 452.78 | 1096.55 | |
| BSA50: 50% SA+50%SS: GA | 350 | 205.9 | 333.06 | 333.06 | 1080.55 | |
| BSA0: 100% SS: GA | 350 | 205.9 | 613.33 | 0 | 1136.37 | |
| Gracam’s aggregate concretes | BSG100: 100%SG: GG | 350 | 205.9 | 0 | 634.66 | 1132.11 |
| BSG90: 90% SG+10%SS: GG | 350 | 205.9 | 64.35 | 579.23 | 1126.64 | |
| BSG80: 80% SG+20%SS: GG | 350 | 205.9 | 130.93 | 523.73 | 1116.61 | |
| BSG70: 70% SG+30%SS: GG | 350 | 205.9 | 200.35 | 467.48 | 1106.55 | |
| BSG50: 50% SG+50%SS: GG | 350 | 205.9 | 328.95 | 328.95 | 1146.52 | |
| BSG0: 100% SS: GG | 350 | 205.9 | 622.21 | 0 | 1142.37 | |
| Razel’s aggregate concretes | BSR100: 100%SA: GR | 350 | 205.9 | 0 | 643.58 | 1106.64 |
| BSR90: 90% SA+10%SS: GR | 350 | 205.9 | 65.47 | 589.19 | 1096.61 | |
| BSR80: 80% SA+20%SS: GR | 350 | 205.9 | 132.93 | 531.73 | 1089.61 | |
| BSR70: 70% SA+30%SS: GR | 350 | 205.9 | 202.75 | 473.03 | 1076.58 | |
| BSR50: 50% SA+50%SS: GR | 350 | 205.9 | 333.46 | 333.42 | 1136.55 | |
| BSR0: 100% SS: GR | 350 | 205.9 | 621.16 | 0 | 1126.43 |
| Tests | BSR0 | BSG0 | BSR50 | BSG50 |
|---|---|---|---|---|
| Static Modulus (GPa) | 23.7 ± 0.9 | 22.0 ± 0.7 | 21.8 ± 0.2 | 21.2 ± 0.3 |
| Compressive strength (MPa) | 33.2 ± 1.3 | 32.1 ± 1.0 | 31.1 ± 0.6 | 31.1 ± 0.5 |
© 2020 by the authors. Licensee MDPI, Basel, Switzerland. This article is an open access article distributed under the terms and conditions of the Creative Commons Attribution (CC BY) license (http://creativecommons.org/licenses/by/4.0/).
Share and Cite
Elat, E.; Pliya, P.; Pierre, A.; Mbessa, M.; Noumowé, A. Microstructure and Mechanical Behavior of Concrete Based on Crushed Sand Combined with Alluvial Sand. CivilEng 2020, 1, 181-197. https://doi.org/10.3390/civileng1030011
Elat E, Pliya P, Pierre A, Mbessa M, Noumowé A. Microstructure and Mechanical Behavior of Concrete Based on Crushed Sand Combined with Alluvial Sand. CivilEng. 2020; 1(3):181-197. https://doi.org/10.3390/civileng1030011
Chicago/Turabian StyleElat, Emmanuel, Prosper Pliya, Alexandre Pierre, Michel Mbessa, and Albert Noumowé. 2020. "Microstructure and Mechanical Behavior of Concrete Based on Crushed Sand Combined with Alluvial Sand" CivilEng 1, no. 3: 181-197. https://doi.org/10.3390/civileng1030011
APA StyleElat, E., Pliya, P., Pierre, A., Mbessa, M., & Noumowé, A. (2020). Microstructure and Mechanical Behavior of Concrete Based on Crushed Sand Combined with Alluvial Sand. CivilEng, 1(3), 181-197. https://doi.org/10.3390/civileng1030011