Article

Microstructure and Mechanical Behavior of Concrete Based on Crushed Sand Combined with Alluvial Sand

1
Laboratory of Mechanics and Materials of Civil Engineering (L2MGC), CY Cergy Paris University, 5 Mail Gay Lussac, Neuville sur Oise, F-95031 Cergy-Pontoise Cedex, France
2
Laboratory of Mechanics, Materials, Structures and Production (LMMPS), National Advanced School of Engineering, University of Yaoundé I, Yaoundé P.O. Box 8390, Cameroon
*
Author to whom correspondence should be addressed.
CivilEng 2020, 1(3), 181-197; https://doi.org/10.3390/civileng1030011
Submission received: 2 July 2020 / Revised: 14 August 2020 / Accepted: 14 September 2020 / Published: 24 September 2020

Abstract

:
The aim of this work is to reduce the overexploitation of river sand by proposing a combination of crushed sand and river sand to develop an optimal mix design for concrete. The approach used consisted of a physical, chemical, and mineralogical characterization of aggregates from three quarries located in Yaoundé (Cameroon), followed by the formulation of concrete by substituting 100%, 90%, 80%, 70%, 50%, and 0% of the river sand with crushed sand. A physical and mechanical characterization of the concrete was carried out, as well as a microstructural characterization using SEM/EDS. The results showed that the concrete made of crushed sand only had a higher drying shrinkage at a young age compared to the river sand concrete. Compared to conventional concrete (made using 100% of river sand), the concrete with 50% crushed sand reduces its slump value, has a lower porosity, and has a compressive strength value of 26.3 MPa at 28 days, which is very similar to that of conventional concrete (26.7 MPa). Moreover, it was found that the strength of the concrete increased by 14.4% and 20.6%, respectively, for concrete without crushed sand (BSR0) and concrete with 50% crushed sand (BSR50) by increasing the curing age from 28 to 90 days. The static modulus of elasticity for conventional concrete BSR0 and BSR50 concrete with 50% crushed sand at 90 days was 23.7 and 21.8 GPa, respectively. Thus, combining crushed sand with alluvial sand is a good method to reduce the depletion of alluvial sands in Cameroon.

1. Introduction

Concrete is a mixture, in well-defined proportions, of aggregates (gravel and sand), binders (cement), water, and additives. Two types of sand can be used: (1) alluvial, from a river, (2) or crushed, from a quarry. Some alluvial sands are generally low in fine particles, making it necessary to reduce the porous structure of the concrete to ensure granular continuity between the cement and gravel for better cohesion of the concrete [1]. It is, therefore, recommended to use sand with a spread grain size and well-distributed continuity [2]. However, the scarcity of this type of sand, the overexploitation of alluvial sands, and the development of aggregate quarry sites have led technicians and engineers to use crushed sand for the production of concrete. On the other hand, very few scientific recommendations are available for the use of crushed sand in Cameroon. Mixed design methods are usually based on the experiences of field engineers on construction sites. This raises the issue of the influence of crushed sand on the concrete’s physical and mechanical behavior, as well as its durability in the concrete’s structure.
The experimental results from a study conducted by Benchaa et al. [3] indicate that rheological properties and mechanical strength are improved with combinations of crushed sand and river sand. All mixtures were prepared using an ordinary Portland cement, CEM I 42.5. The study also showed that crushed sand with limestone fines (10–15%) can be successfully used in the production of self-compacting mortar (SCM) with good rheological and strength properties. The influence of sand on the fluidity of the mortar showed that the workability of mortars differs according to the physical characteristics of the particles, including particle shape and texture (angularity), fineness, and the fines content of the crushed sand. Two series of mortars were prepared with the filler cement, IRAM CPF-40. Moreover, sand lime-based mortars spread more easily than dolomite or granite mortars [4]. The research conducted by Abdullahi et al. [5] showed that concrete made from river gravel has the highest workability, followed by crushed quartzite and crushed granite aggregates, producing concrete with relatively lower workability where the paste is not necessarily sufficient to surround the aggregate and provide the necessary lubrication. However, a reduction in compressive strength was observed with an increase in dune sand content (up to 50%) in mortars based on binary and ternary sands. The same researcher showed that the use of crushed sand is a practical solution to the overexploitation of river sand.
Research on the drying shrinkage phenomenon using ASTM Type I Portland cement showed that the drying shrinkage values of concrete with crushed sand were lower than those of concrete with river sand. This was explained by the fact that the crushing fine sand (CFS) used had a larger particle size distribution and hence, lower specific surface areas (SSAs) than the river sand [6]. It has been suggested that the SSAs of aggregates are one of the properties that affects concrete shrinkage [7]; in general, a sample of an aggregate with a lower SSA (i.e., a larger particle size) will result in a lower shrinkage of the concrete produced.
In the experimental work carried out by Luc Leroy et al. [8], at 28 and 90 days of curing, maximum compressive strength values were obtained for normal concrete CN (37 MPa), followed by concrete made with 25% river sand and 75% crushed gneiss (35 MPa). The analysis suggests that 75% partial substitution of river sand by crushed sand can be used effectively in concrete production without affecting the compressive strength of the concrete. Khouadjia et al. [9] indicated that in a fresh and hardened state, the behavior of concrete is different depending on the mix design and the sand characteristics. The authors showed that the best compressive strength at 28 days was obtained using concrete with few fine particles (2.8%). The same study showed that the highest compressive strength at all ages is provided by concrete made from quartzite aggregates, followed by river gravel and then, granite aggregates. The study conducted by Rmili et al. [10] on the performance of concrete with crushed sand and alluvial sand using CEM I 42.5 Portland cement showed that the optimal strength is reached with 70% substitution of alluvial sand by crushed sand. A reduction in the voids and improvement of compactness due to the fineness of the crushed sand explains these results. The study on the strength and durability of concrete incorporating crushed limestone sand conducted by Menadi et al. [11], using the same water/cement (W/C) ratio and Portland cement content at 350 kg/m3, showed that up to 15% of the fines (<80 µm) contained in the crushed sand could be used without affecting the compressive strength of the concrete. Other authors studied the influence of the mineralogical sources of three different crushed sands (Granite GS, Limestone LS, and Steel Slag SS) on the behavior of concrete (the same w/c ratio of 0.30). The authors showed that crushed sand from granite is the most advantageous due to its high values of compressive strength and workability [12].
The testing of rocks from which aggregates were derived (basalt, granite, dolomite, quartzite, and gravel) in [13], as well as high-strength and ordinary concretes, revealed the factors that affect the stress–strain properties and modulus of elasticity of concrete. All mixtures were prepared using ordinary Portland cement, CEM I 42.5. The modulus of elasticity increased for the concretes produced with aggregates composed primarily of quartz (quartzite and granite). Much higher increases in the modulus of elasticity values were observed for concretes made with dolomite and basalt aggregates. This is likely due to the stiffness of the aggregates and related to the good adhesion of the paste. Moreover, the authors concluded that this aggregate can provide a significant increase in the modulus of elasticity in both ordinary concrete and high strength concrete.
The literature review shows that most studies on the use of crushed sand in concrete design have focused on sand’s influence on the mechanical and rheological behaviors of concrete. However, very few studies have been oriented toward the study of concrete’s microstructure. Moreover, few practical recommendations are available on the proportions of quarry sand to be used in the formulation of concrete, and very few studies have been carried out on this issue. Thus, the aim of this research is to propose the optimal proportions of crushed sand and alluvial sand in the mix-design of concrete, with the aim of providing satisfactory workability, microstructures, and mechanical properties.
The approach adopted in this work involved selecting and characterizing aggregates from three quarry sites in Yaoundé (Cameroon) and alluvial sand from Sanaga river (Cameroon). Then, the mix-design of the concretes with crushed sand and river sand (using gravel from the quarry from which the crushed sand was extracted) was carried out to assess the influence of crushed sand on the workability, shrinkage, porosity, compressive strength, and static modulus of elasticity of concrete. The aim of this study is to propose an optimal mix-design combining these two sands.

2. Materials and Methods

2.1. Material Characterization

2.1.1. Cement

The cement used in this study was Portland cement NC CEM, class 42.5 R, with a fineness of 3425 cm2/g and a density of 3.14 g/m3 [8] from Dangoté company (Cameroon). The chemical composition of the cement (Table 1) was determined by X-ray fluorescence on an ICP-AES spectrometer, according to DIN EN ISO 12677. The mineralogical composition of the cement is presented in Table 2 (as per the composition given by the supplier). The percentage of the alkali equivalents of the cement (% Na2O + 0.658% K2O) [14] was 1.62%.

2.1.2. Sand

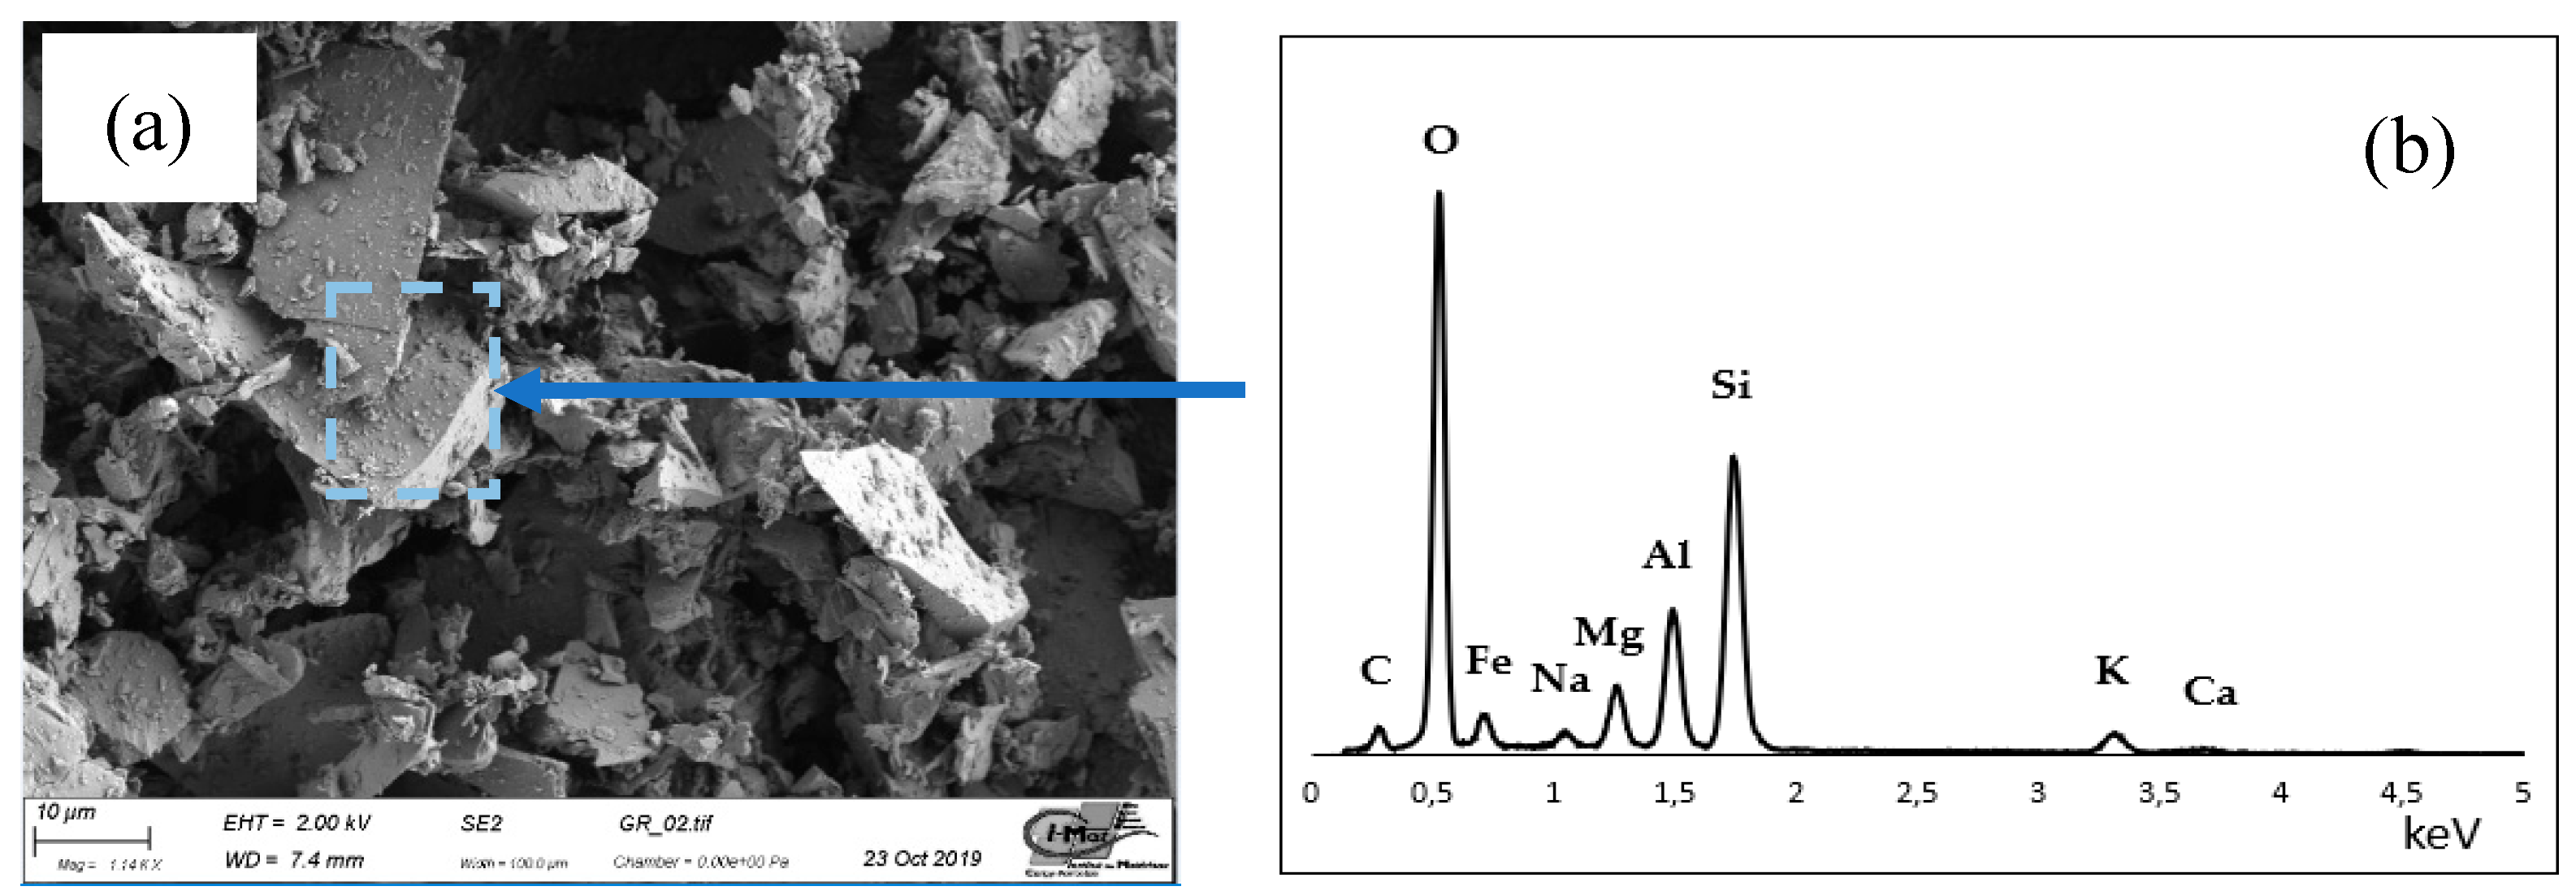
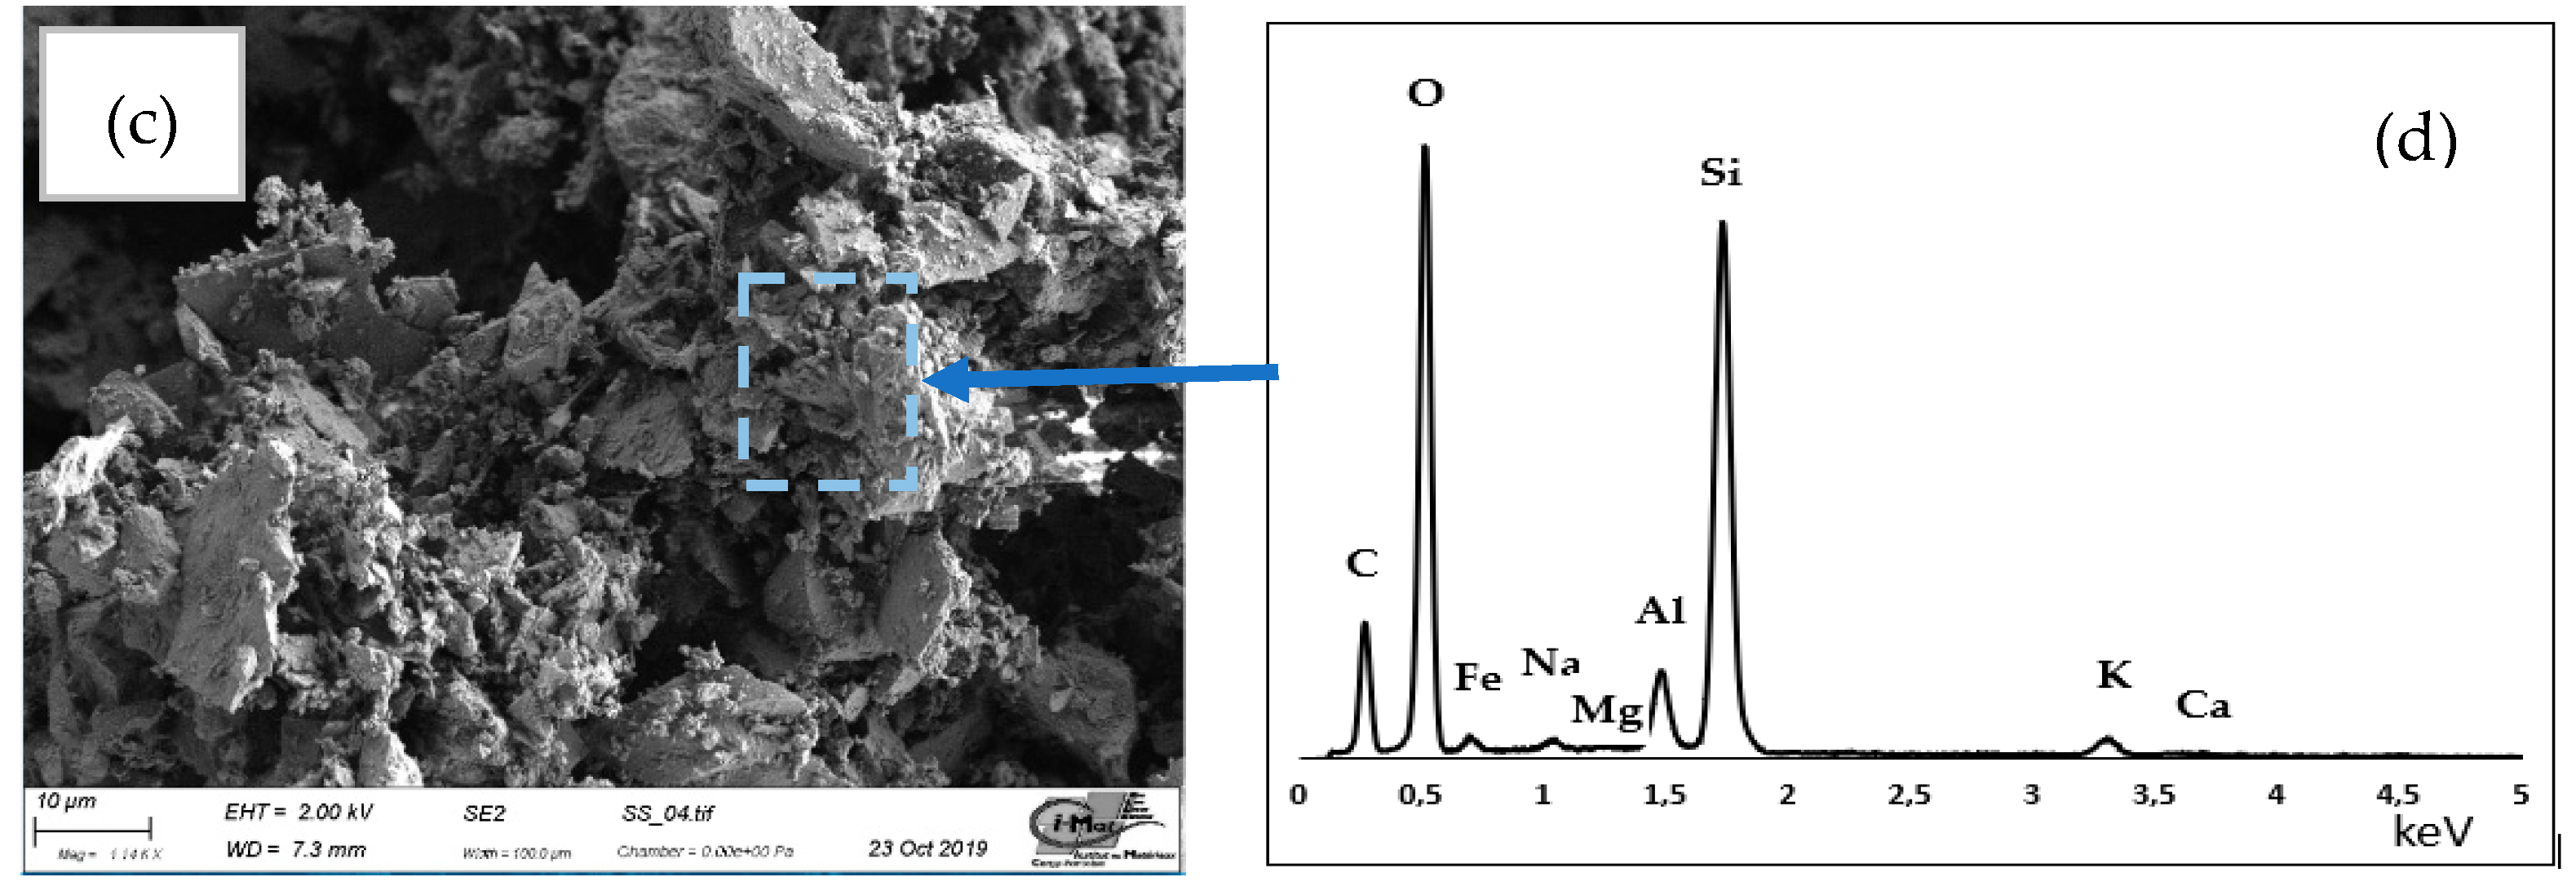
The crushed sands used in this study came from three quarry aggregate mining sites in Yaoundé (Cameroon). The quarry sites operated by the Arab Contractor (A), Gracam (G), and Razel (R) are denoted SA, SG, and SR, respectively. The river sand came from the Sanaga (S) River (running from north to south in Cameroon) and was denoted as SS. Samples of all these sands are shown in Figure 1. The granular classes were, respectively, 0/6 and 0/5 for the crushed sand and river sand. Table 3 presents the physical characteristics of the sands, measured by the following standards: NF P18-101, NF P 18-540, NF P 18-598, fines content, the fineness modulus and the sand equivalent, and apparent and specific density. These results show that the fine fraction varied from 1.4% to 8.3% (the lower fine content was found for the river sand), while the fineness modulus remained somewhat stable (around 2.6). The sand equivalent test provided a percentage between 82.5% and 95.5%, reflecting the great cleanness of the sands, but with the risk of causing a defect in the plasticity of the concrete, as reported in [15]. The chemical compositions of the sands were determined by X-ray fluorescence on an ICP-AES spectrometer. Table 4 shows similar compositions of all crushed sands. The proportions of aluminum and iron (Fe2O3 + Al2O3) were 23.45%, 25.42%, and 21.39%, respectively, for SA, SG, and SR, but this proportion reached only 5.5% for the river sand, SS. These high values of aluminum and iron are likely due to the amorphous phase in crushed sands. The crushed sand had a calcium content (CaO) around 7 times higher than that of river sand. These sands are siliceous, with a negligible trace of calcium. Crushed sands have similar mineralogical characteristics. The morphology and the differences in composition between the crushed sand and river sand were studied by using an SEM equipped with an electron probe microanalyzer, coupled with Energy Dispersive Spectroscopy (EDS) examinations (JEOL JXA—8500F and a Hitachi S-3400N). Figure 2 shows the microscopic observations of sands SR (Figure 2a) and SS (Figure 2c), and EDS spectra of sands SR (Figure 2b) and SS (Figure 2d). The differences in the heights of the peaks show the differences in the chemical composition of the river sand compared to the crushed sand.

2.1.3. Gravel

In this study, all the gravel used was of class 5/15. Gravel from three quarries (the Arab contractor, Gracam, and Razel) was used, denoted as GA, GG, and GR, respectively. Table 5 presents the apparent density and specific density of the gravels used. These properties were evaluated according to the following standards: NF P18-560 and NF P18-554. Table 6 presents the chemical composition of the gravel. These results are globally similar to those obtained for the sands. Pictures of a petrographic analysis of thin slices of the different rocks in the analyzed polarized light (LPA), using a petrographic optical microscope according to the method described in [16], are presented in Figure 3. Table 7 provides an estimate of the major minerals present in the different rocks. The analysis shows that the rock from the Arab Contractor (A) quarry (Figure 3a) corresponds to gneiss with biotite and garnet with minor micaceous content and a heterogranular and oriented granolepidoblastic texture. The rock from the Gracam (G) quarry (Figure 3b) corresponds to biotite garnet quartzite gneiss, with a heterogranular and oriented granoblastic texture. The rock from the Razel (R) quarry (Figure 3c) corresponds to gneiss with biotite and kyanite, with a granoblastic texture and a heterogranular and oriented granolepidoblastic trend.

2.2. Methods

2.2.1. Concrete Mix Design

In this investigation, 18 concretes mixes were produced by substituting river sand with crushed sand in the following volume proportions: 100%, 90%, 80%, 70%, 50%, and 0%. The Dreux–Gorisse [17] method, based on a particle size analysis of the aggregates whose grading curves are shown in Figure 4, was used for the mix-design. These curves show a uniform (tight) grading of the river sand, while the grading of the crushed sand was spread out. For all concrete mixtures, the cement and water/cement (w/c) ratio were kept constant at 350 kg/m3 and 0.6, respectively. The concrete mixing and sample preparation were carried out in accordance with the standard NF 12390-1. The workability of all concretes was determined by a slump test on fresh concrete, following the procedure described in the standard NF P 18-451. The compositions per 1 m3 of concrete in all formulations are given in Table 8. The nomenclature of the concrete is presented as follows: B (concrete) and S (sand), while the following letter (A, G, or R) designates the quarry, the number (100, 90, 80, 70, 50, or 0) designates the corresponding proportion of crushed sand, and the next two letters designate the gravel, as indicated above.

2.2.2. Experimental Schedule

  • Physical properties
    • Density of concrete: The density measurement was carried out after 28 days of curing conservation using tap water at 20 ± 2 °C. A series (3 cylindrical samples of 50 × 150 mm) of concrete samples was then removed from the storage water. Next, the samples were dried in a ventilated oven at a temperature of 80 °C until the mass stabilized (a difference of less than 0.05% between the two weighing operations spaced 24 h apart, to an accuracy of 0.01 g). Density tests were performed according to ASTM C 642-13 [18], and the density value was evaluated as follows (Equation (1)):
      ρ C = 100 × A C D
      where A is the mass (g) of the oven-dried sample in air, C is the mass (g) of the saturated surface-dried sample in the air, and D is the mass (g) of the sample in water after immersion.
    • Water porosity: The water porosity test was carried out after 28 days of curing on 5 samples in accordance with the standard NF P 18-459. The porosity was then computed as follows (Equation (2)):
      P = 100 × M s a t M d r y a t T M s a t M w a t e r
      where Msat is the mass (g) of the saturated specimen in the air, Mdry at T is the mass (g) of the dried specimen at the desired temperature, and Mwater is the mass (g) of the saturated specimen under water.
    • Gas permeability: The gas permeability of the different concretes was measured using the Cembureau method [19]. For each concrete, measurements were carried out on three 50 mm thick and 150 mm diameter discs. After 28 days of curing in water, the samples were dried in a ventilated oven at a temperature of 80 °C until the mass stabilized (a difference of less than 0.05% between the two weighing operations spaced 24 h apart, to an accuracy of 0.01 g) [20]. The underlying principle used for this test was the Hagen–Poiseuille relation for the laminar flow of a compressible fluid through a porous body under steady-state conditions. Hagen–Poiseuille (Equation (3)) allows one to determine the specific permeability coefficient:
      K g a s = 2 P a t m Q L μ A ( P 2 P a t m 2 )
      where Q is the volume flow rate of fluid (m3/s); L is the thickness of the specimen (m) = 0.05 m; A is the cross-sectional area of the specimen (m2) = 7.854 × 10⁻³; μ is the dynamic viscosity of the fluid (Nitrogen) at 20 °C (Pa.s) = 1.76 × 10⁻⁵; Patm is the atmospheric pressure (Pa) = 101,325 Pa; and P is the inlet pressure (Pa).
      Using Kgas for different inlet pressures, the intrinsic permeability of the concrete can be calculated using the method of Klinkenberg (Equations (4) and (5)) [21]:
      K = K int ( 1 + β P m )
      P m = P 0 + P a t m 2
      where P0 is the atmospheric pressure (Pa), β is the Klinkenberg constant, and Kint is the slope of line of Klinkenberg.
    • Drying shrinkage: The measurement of drying shrinkage was carried out on prismatic concrete specimens 70 × 70 × 280 mm 24 h after confection under climatic conditions at T = 20 ± 2 °C and 50 ± 5% RH, according to the conditions described in standard NF P 18-427.
  • Mechanical properties
    • Compressive strength: The compressive strength was determined on 3 cylinder specimens that were 160 mm in diameter and 320 mm in height at 7, 21, and 28, days of curing in a water tank at a temperature of 20 °C, in accordance with the standard NF P 18-406. For tests at 90 days of curing, cylinder specimens 110 mm in diameter and 220 mm in height were used. The average laboratory target strength was 25 MPa at 28 days.
    • Static modulus of elasticity: For the static modulus analysis, cylinder specimens 110 mm in diameter and 220 mm in height were used. The test was carried out after 90 days of curing, simultaneously with the compressive strength, and on the same samples. Static modulus values were determined only for concretes made with 50% and with 100% of river sand. An hydraulic press with a capacity of 3000 kN and a travel speed of 0.5 MPa/s was used for the compression test, according to the standard NF EN 12390-3. The concrete specimens were carefully surfaced with sulfur and were instrumented by a set of four strain gauges placed on the lateral surface and at the mid-height of the specimen, two of which were placed longitudinally, two of which were placed horizontally, and two of which were diametrically opposite, as shown in Figure 5. The data acquisition unit recorded the deformation every 0.001 s, while the hydraulic press recorded the stress evolution and the compression displacement every 0.1 s. The plot of the stress–displacement curve was made directly from the data recorded by the hydraulic press. For the plot of the stress–strain curve, the data recorded in the data acquisition unit were filtered to retain only the deformations corresponding to 0.1 s to match the stresses of the press.
  • Scanning electron microscopy
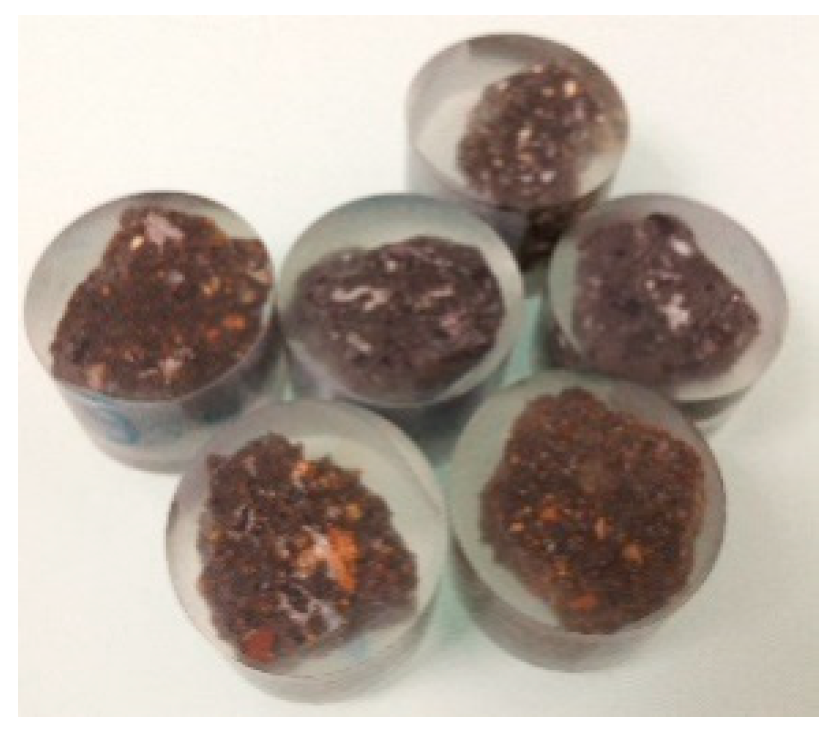
Microstructural analysis was carried out on samples of Equivalent Concrete Mortar (ECM). This process consisted of replacing the granular skeleton with sand while keeping the same volume of cementitious paste and the same amount of cement [22]. We focused on mixtures corresponding to mortars with 100%, 50%, and 0% SS and SR sands. The corresponding mortars are rated MSR0 and MSR50. The dimension of the 1.5–2.0 cm sample was taken out from the core of concrete specimen. Dried samples were impregnated into an epoxy resin (as shown in Figure 6) [23], and were polished using a semi-automatic polishing machine. An SEM equipped with an electron probe microanalyzer, JEOL JXA—8500F, and an Hitachi S-3400N with a backscattered electron detector (BSE) and energy dispersive spectroscopy (EDS) were used to obtain details on the porous structures and microcracks, produce silicon chemical mapping, and develop a calcium analysis of the mortars.
Images of the equipment used in this study as well as images of the curing of concrete samples are presented in Supplementary Materials.

3. Results and Discussion

3.1. Concrete Workability

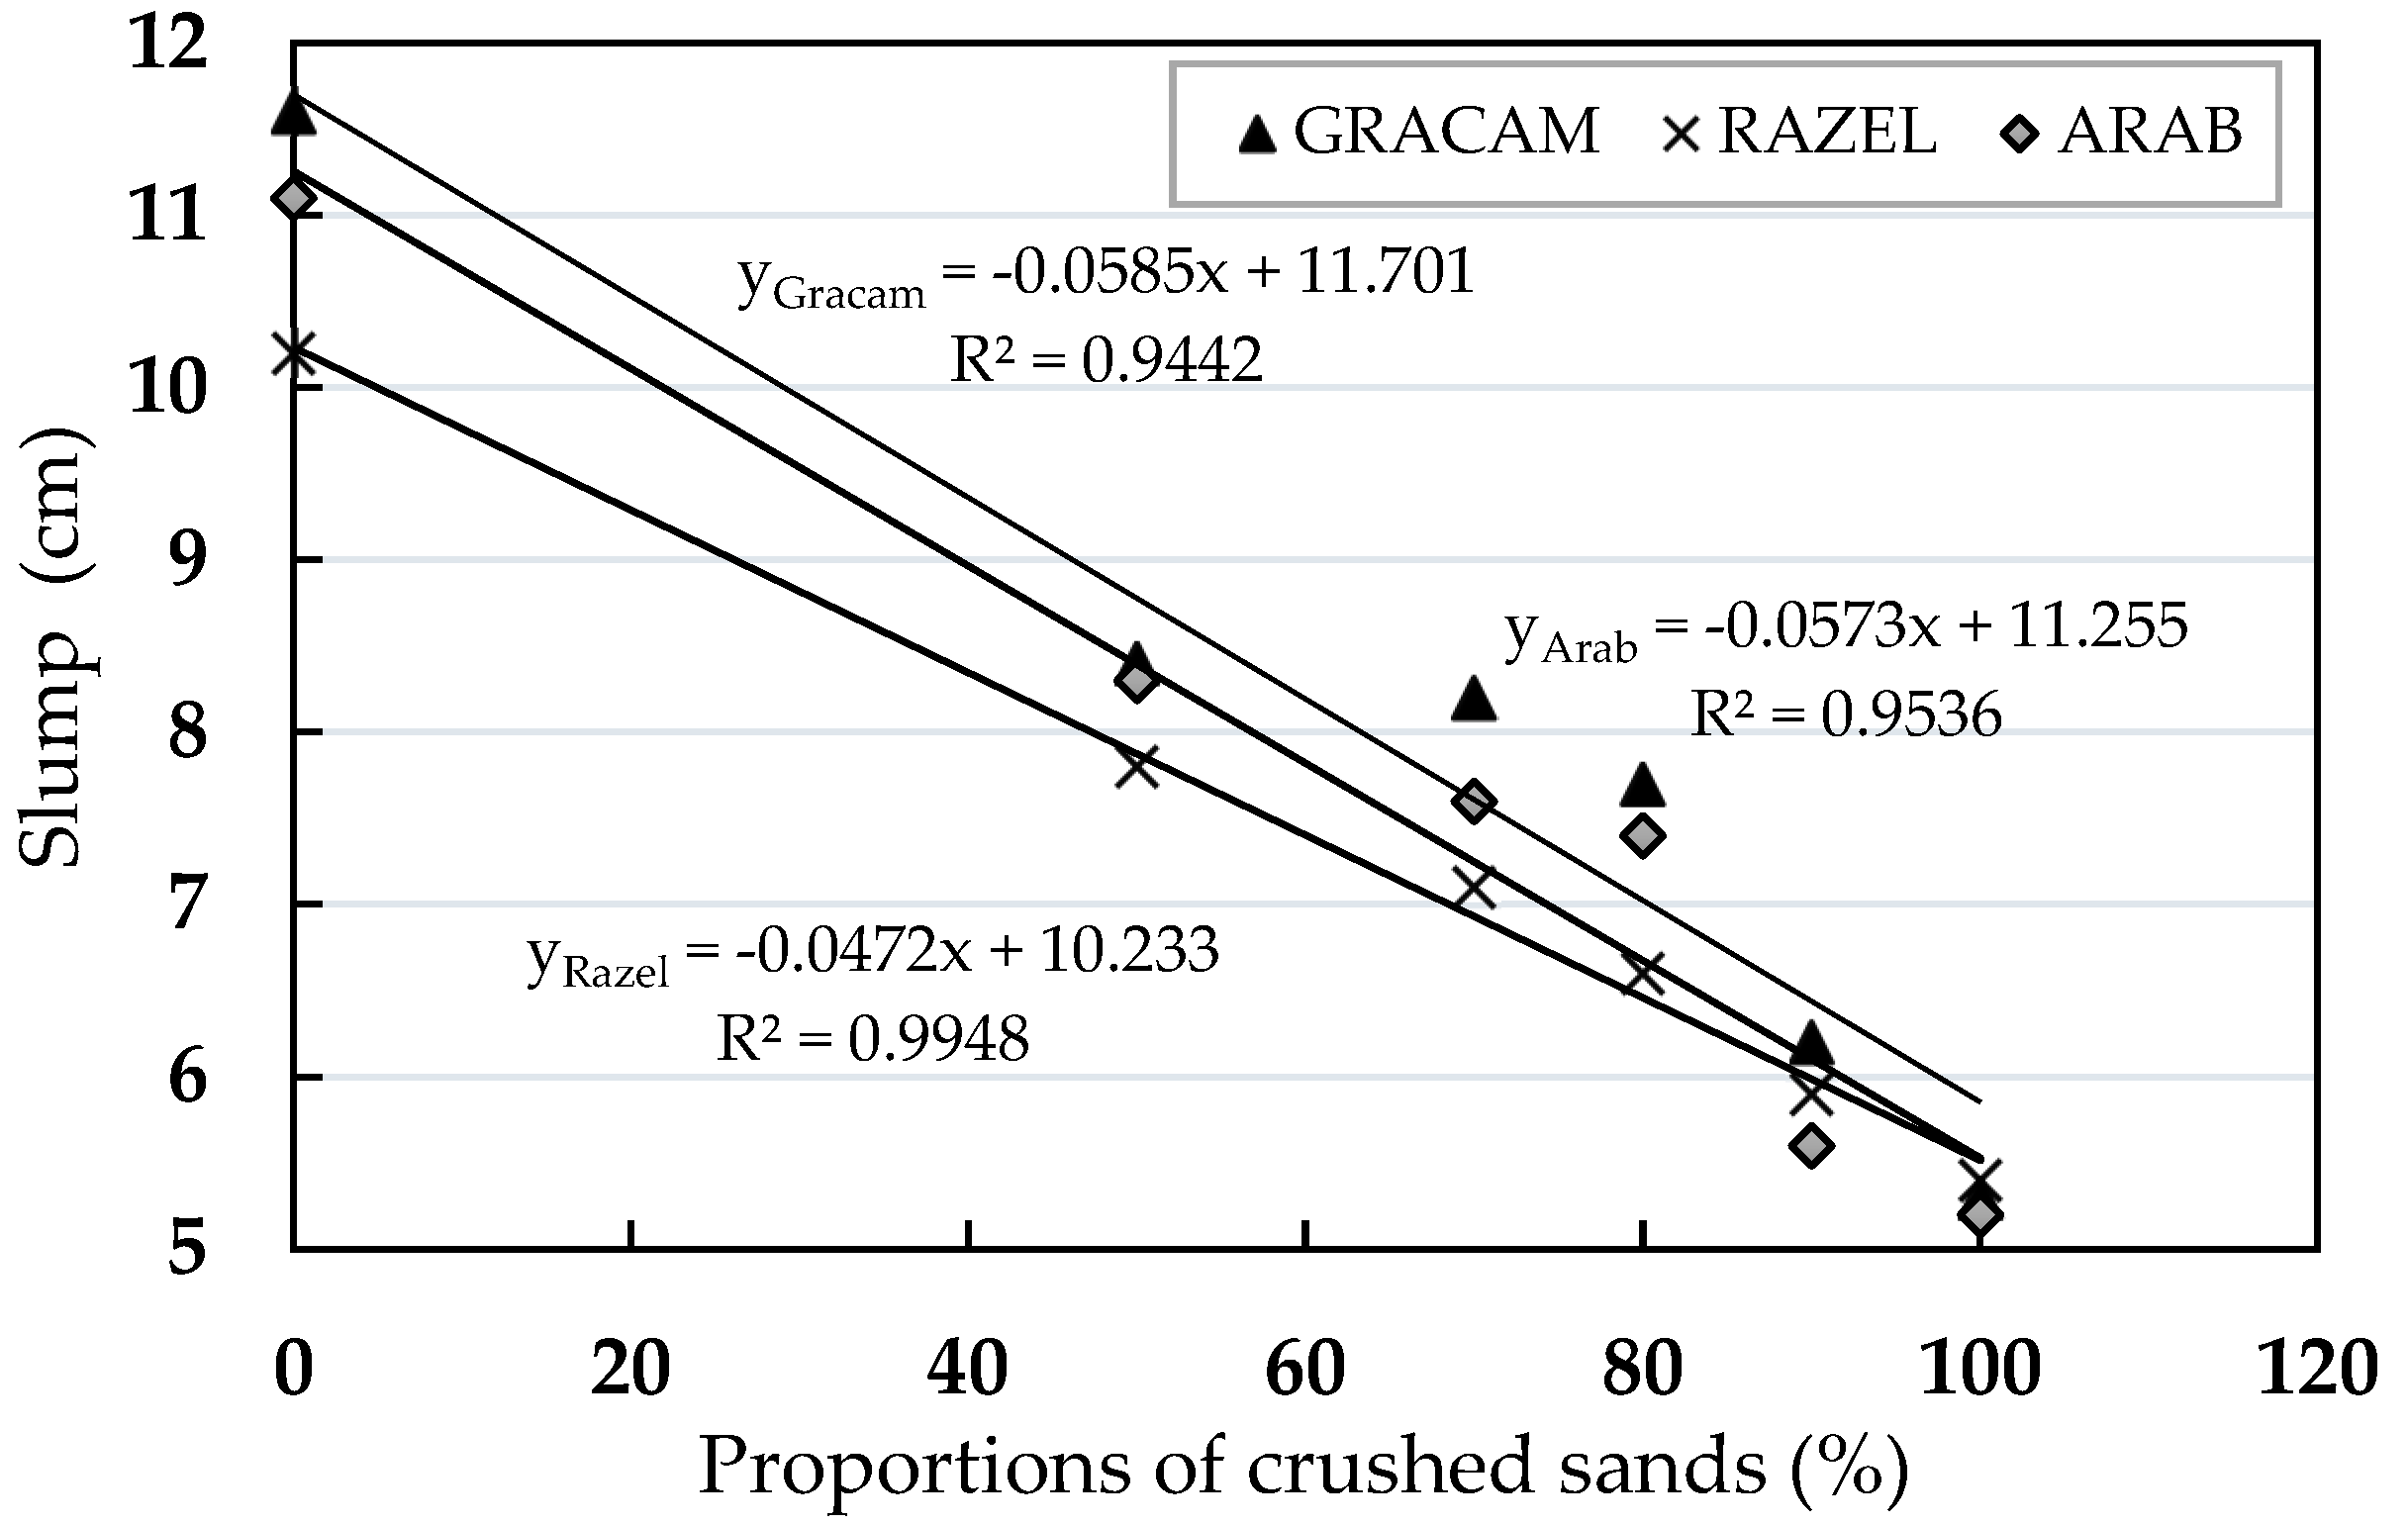
Figure 7 shows the slump test results as a function of the proportion of crushed sands. A strong linear regression of the concrete slump with aggregates from the three quarries (with square regression coefficients of at least R2 = 0.95, 0.94, and 0.99, respectively, for concrete with aggregates from the Arab Contractor, Gracam, and Razel quarries).
The crushed sands, BSA0, BSG0, and BSR0, featured a semi-dry mix (class S2; 5–9 cm), while the river sand concretes BSA100, BSG100, and BSR100 used a wet mix (class S3; 10–15 cm), according to the NF P 18-451 standard. This is consistent with the conclusions of other researchers that the use of crushed sand in concrete can increase the water and cement content to help maintain adequate workability [24]. The for all concretes. This variation in workability can be attributed to the same volume of cementitious paste being used in the formulation of all concretes, as well as to the high surface tension on the surface of the fines contained in the crushed sand [3]. The proportions of fine particles contained in river sand are low compared to those in crushed sand. However, for the BSA50, BSG50, and BSR50 concretes, we observed a slump globally close to 8 cm, the targeted slump value outlined in the hypothesis. This paste is not necessarily sufficient, however, to surround the aggregates and provide them with the necessary lubrication, as reported by Abdullahi et al. [5].

3.2. Drying Shrinkage of Concrete

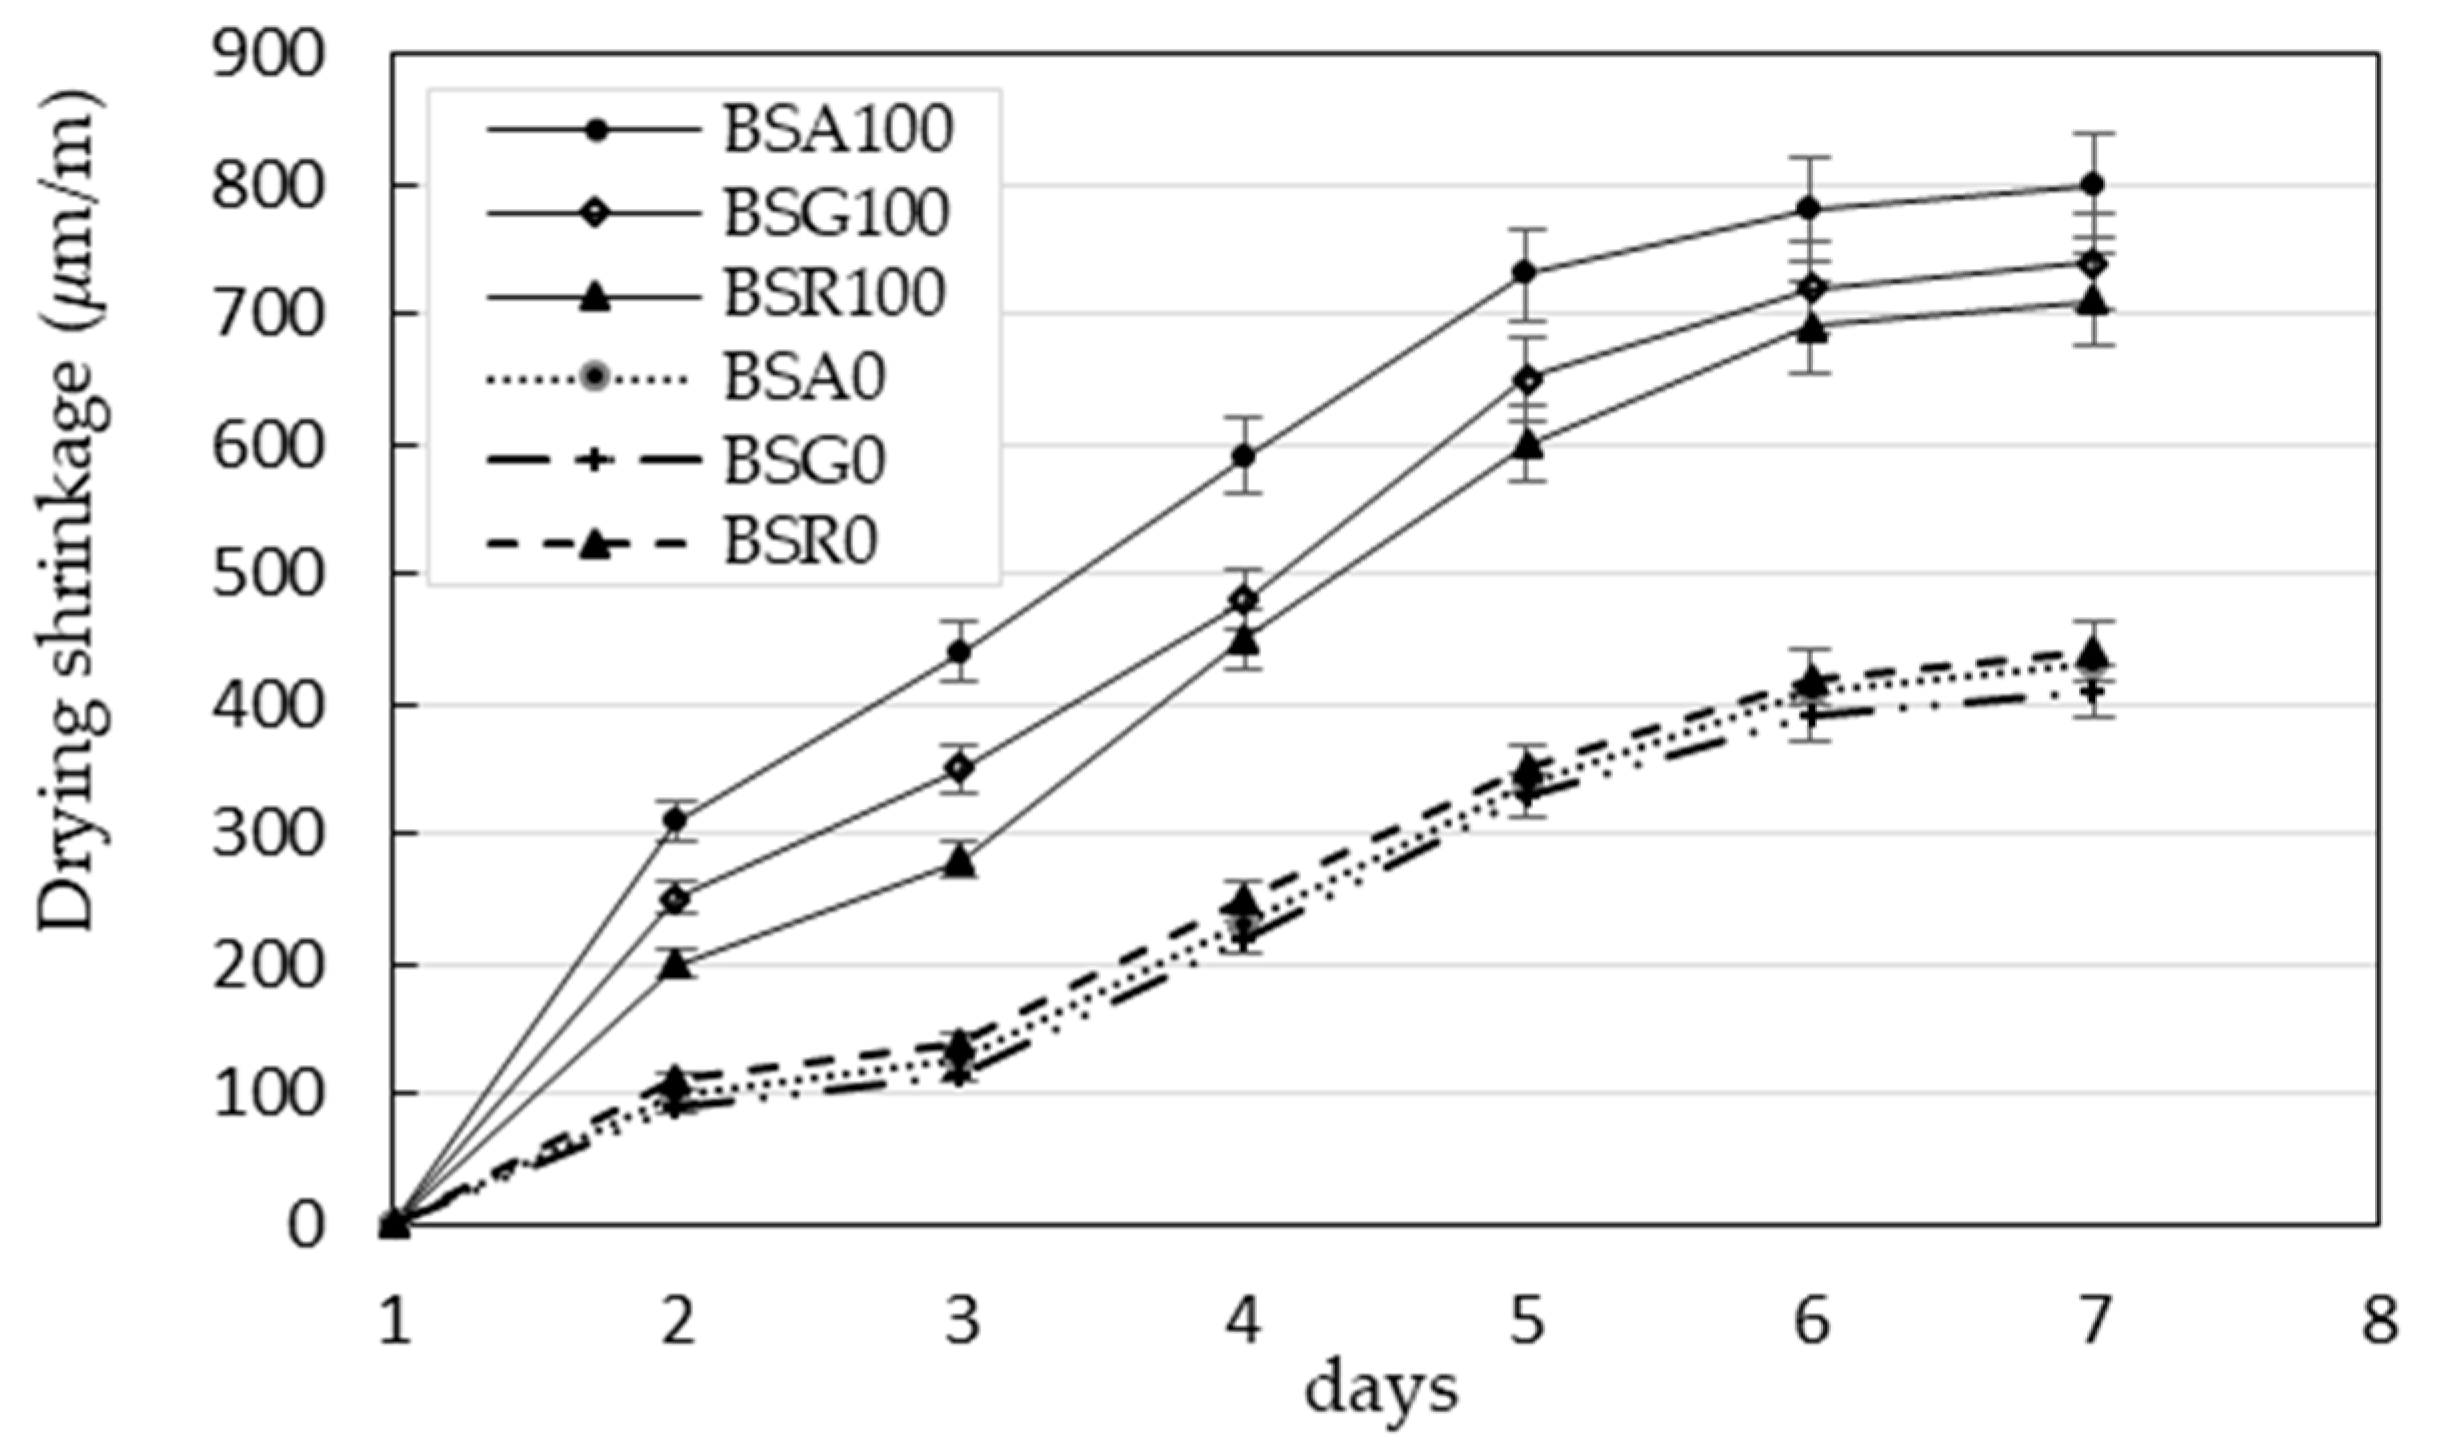
The evolution of deformation due to the drying shrinkage of young concretes made from 100% crushed sand and 100% river sand is shown in Figure 8.
The results show that shrinkage increases very swiftly during the first days of curing for all concretes, indicating that the water balance has not yet been reached. This can be explained by the accelerated evaporation in the initial phase of the concrete, the high w/c ratio (0.6), and the slow speed at which the water can reach the surface of the specimen of all concretes [25]. The shrinkage in dimensions can be explained by the drying of the free water in the concrete interstices, leaving a fine network of pores of different sizes. Capillary tension is created on the faces of the pores with fine diameters; as a result, the volume of the concrete contracts. The figure shows two distinct groups of shrinkage evolution curves, with high values for the concrete containing 100% crushed sand compared to the concrete made from 100% river sand. This difference can be explained by the high level of fines in the crushed sand (around 7.4% for crushed sand versus 1.4% for river sand), which is different from the results of Kou et al. [6]. This difference can also be explained by the fact that the particle size of river sand is generally larger than that of gneiss crushed sand, in contrast to the granite crushed sand used by Kou et al. In general, a sample of an aggregate with a lower SSA (i.e., a larger particle size) would result in a lower shrinkage of the concrete produced [7].

3.3. Water Porosity and Density of Concretes

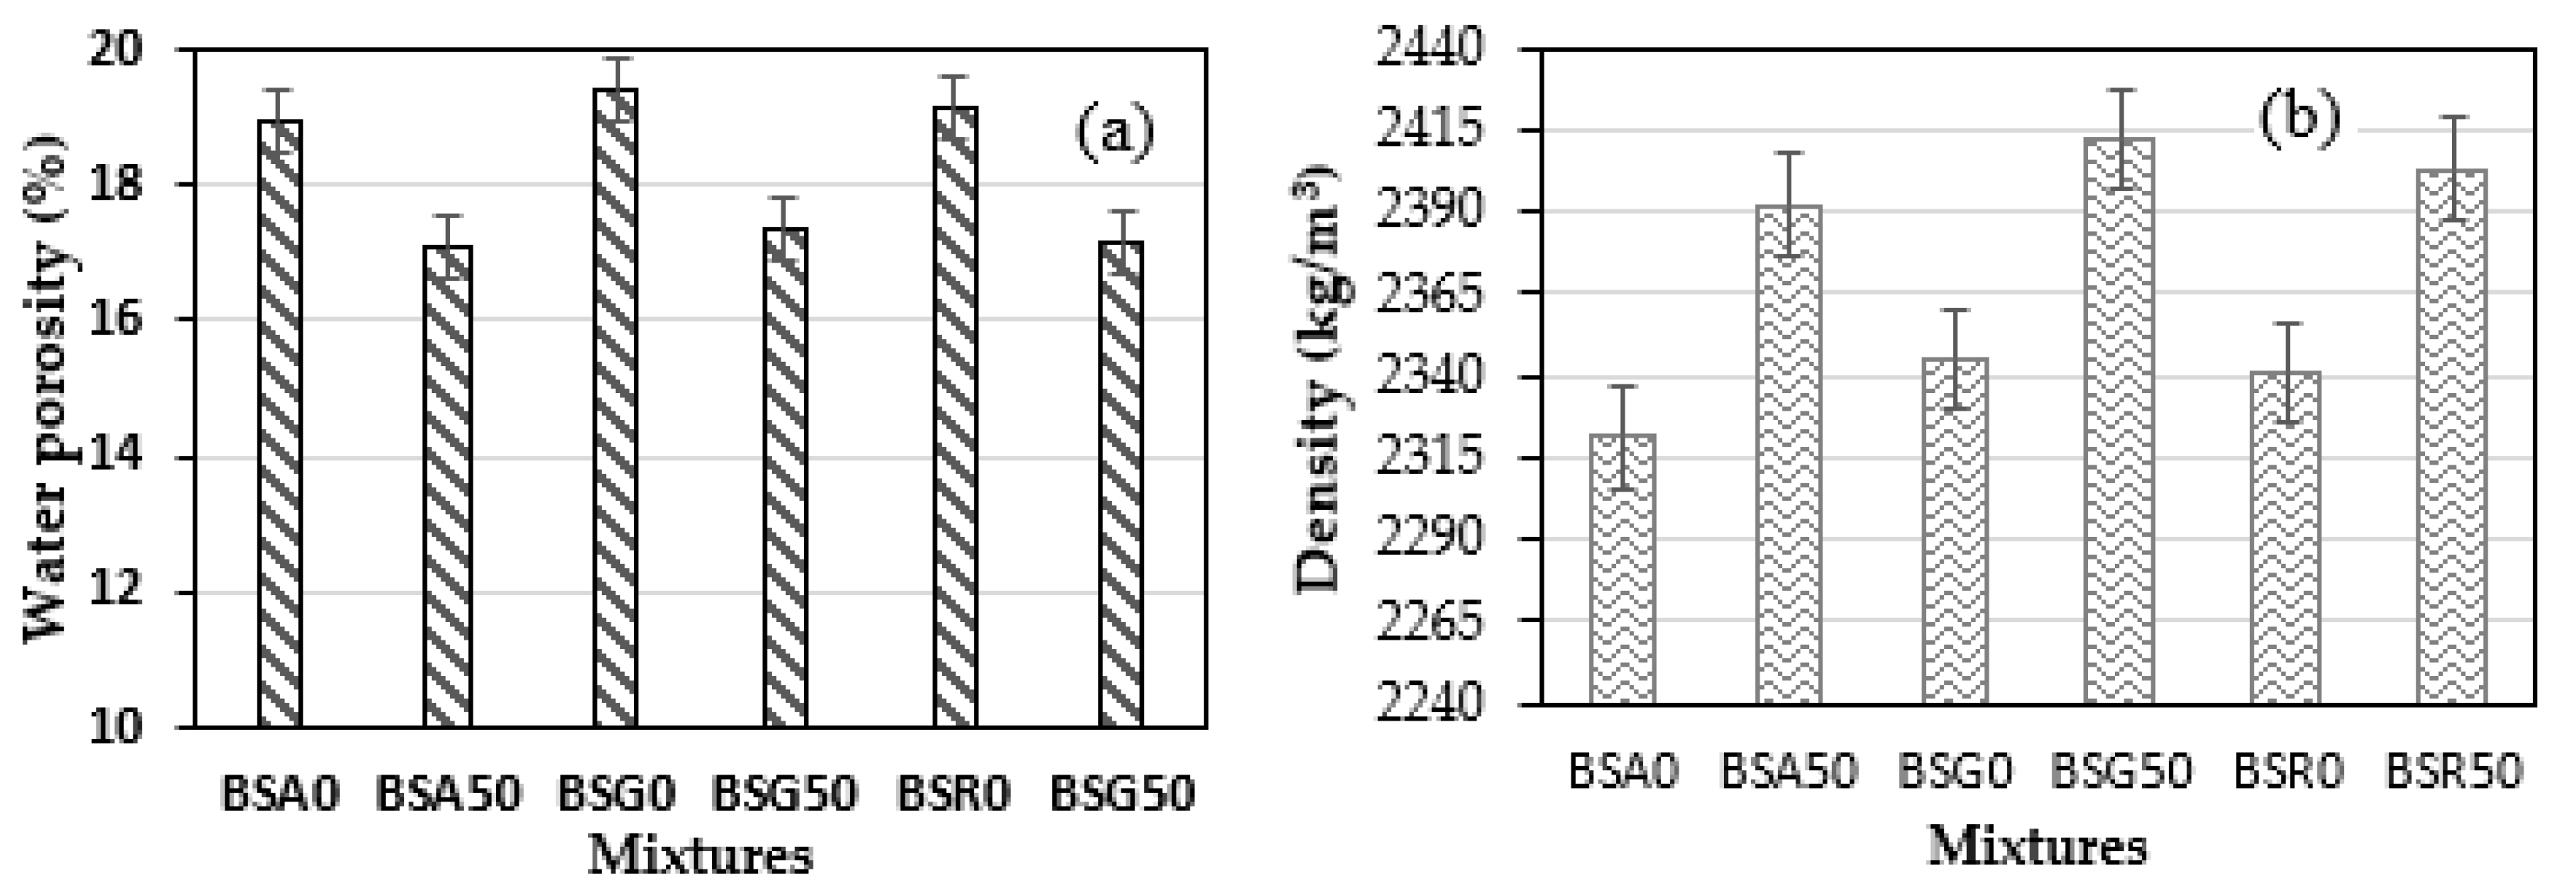
The results of the water accessible porosity and density of concretes with 50% and 0% crushed sand are shown in Figure 9.
The water porosity values range from 17.1 to 19.4% (Figure 9a). The water porosity of concrete decreased with the use of crushed sand by 50% compared to the concrete containing 100% river sand. The decrease in water porosity between BSA0 and BSA50, BSG0 and BSG50, and BSR0 and BSR50 is about 9.7%, 10.5%, 10.4%, respectively. Thus, concretes composed of river sand are more porous than those made with crushed sand. This is due to the reduction of the porous structure by the fine particles of the crushed sands.
From these results, it can be seen that the concrete density ranged from 2.32 to 2.41 (Figure 9b), with the lowest value obtained for BSA0 concrete and the highest for BSG50 concrete. The relative variations of the values of density between the BSA50 and BSA0, BSG50 and BGA0, and BSR50 and BSR0 concretes were, respectively, 2.9%, 2.7%, and 2.6%, indicating that the 50% sand mixture did not have a significant influence on the density of the concrete. Concretes made with 50% sand mixes were the densest and least porous. This is due to the higher density of crushed sand compared to river sand.

3.4. Gas Permeability

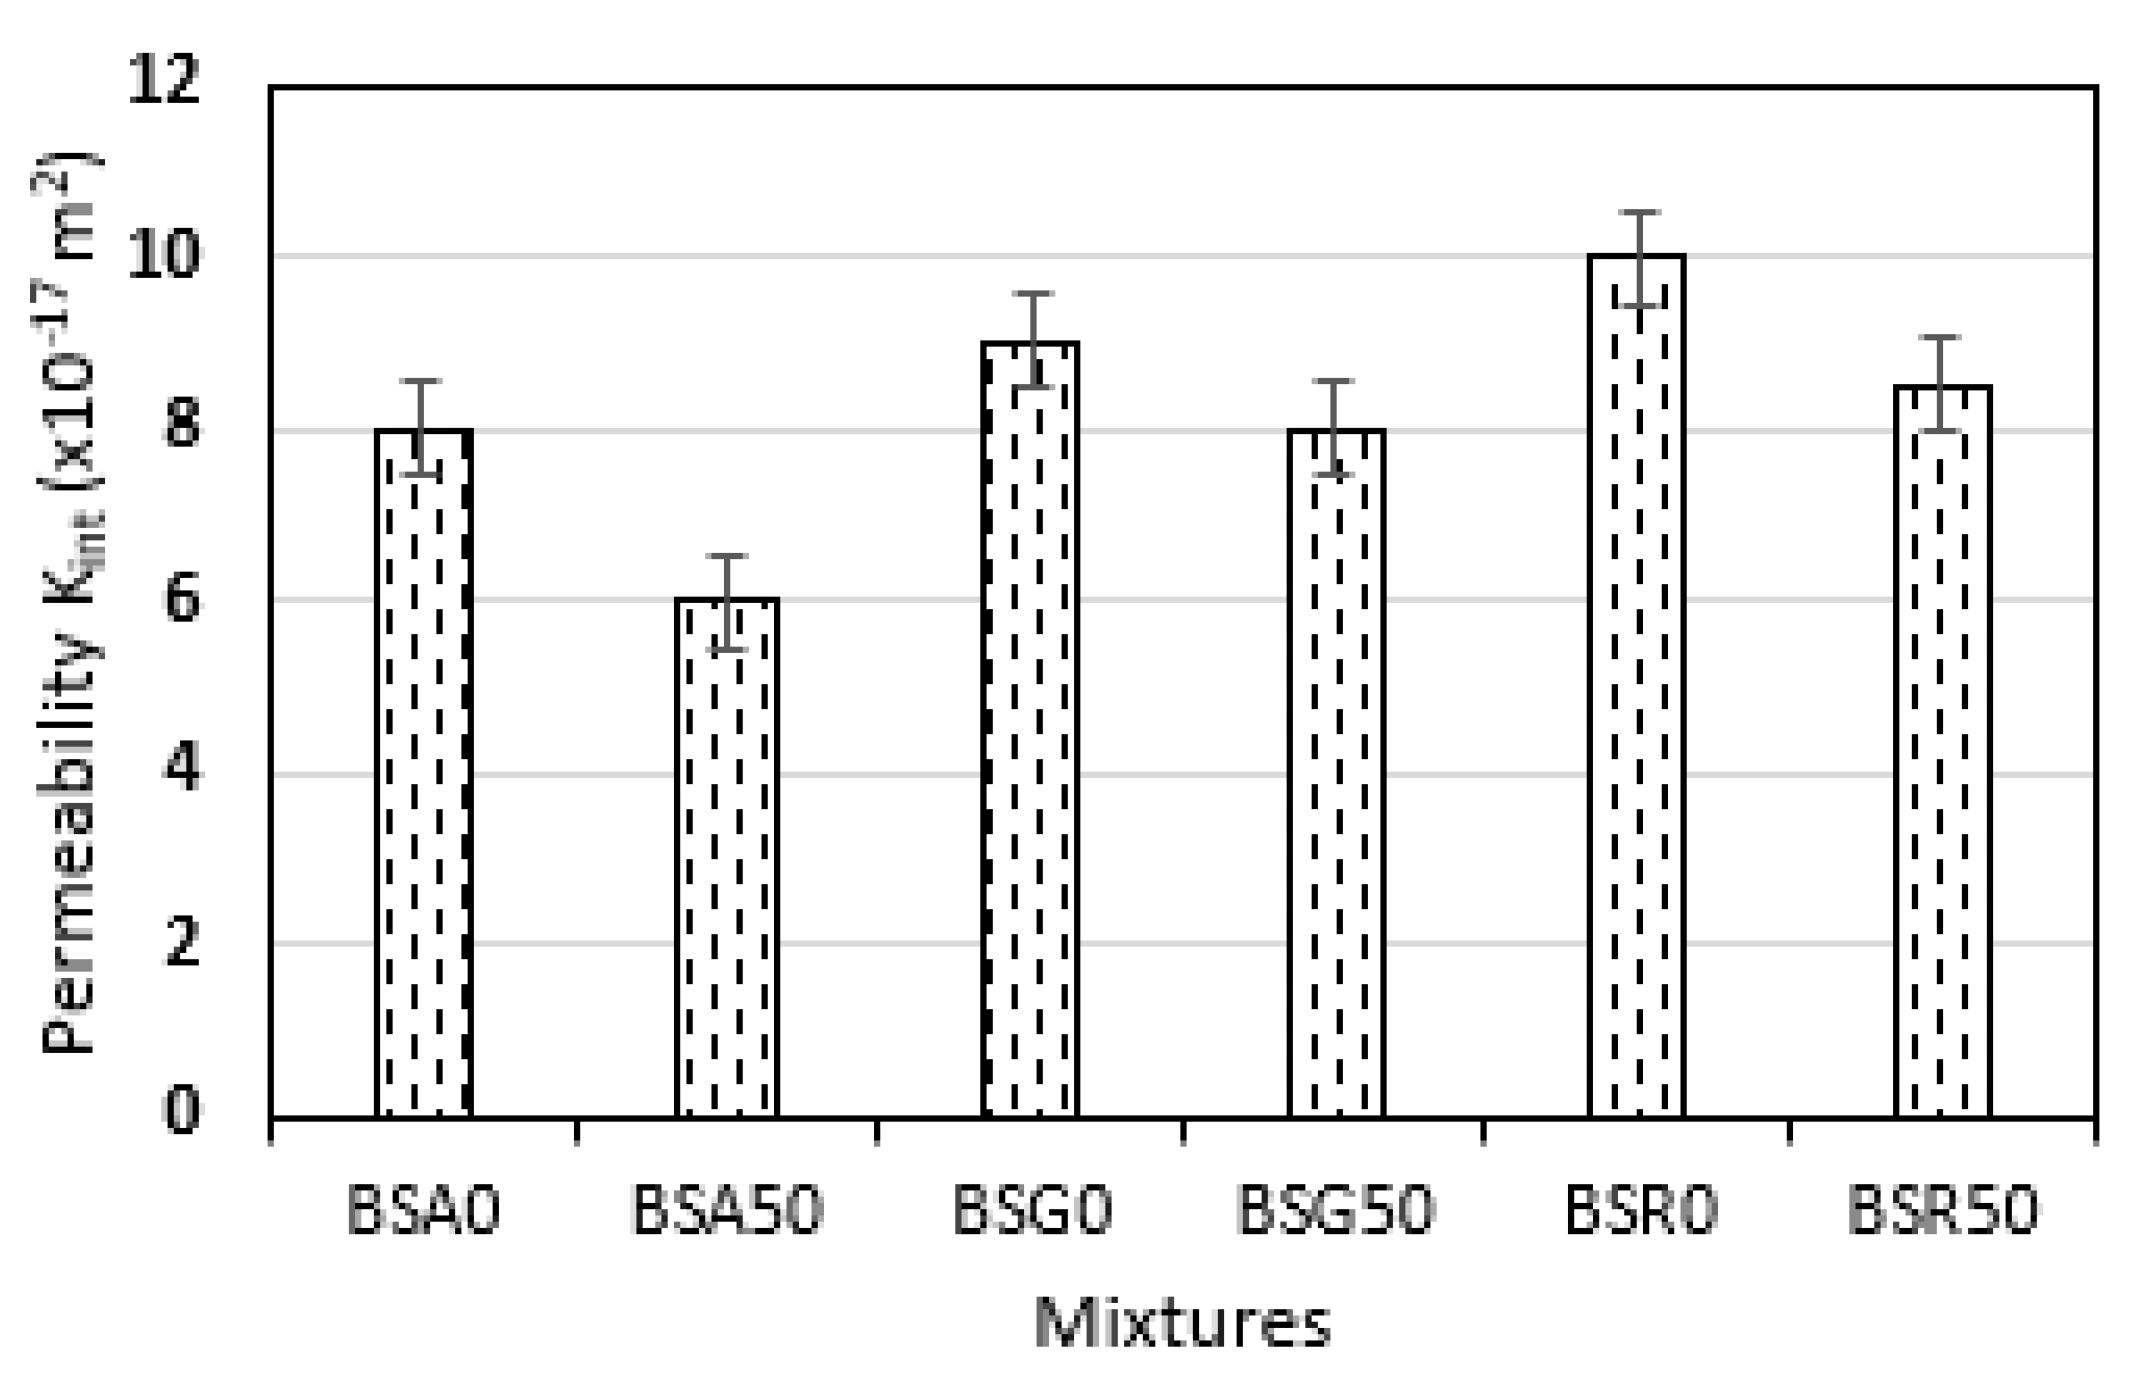
The results of the intrinsic gas permeability measurements of concretes with 50% and 0% crushed sand are shown in Figure 10.
Figure 10 (permeability) shows a similar variation with Figure 9 (the water accessible porosity of concrete). Concretes BSA50, BSG50, and BSR50 provide the lowest intrinsic permeability values, estimated at 6 × 10⁻¹⁷ m2, 8 × 10⁻¹⁷ m2, and 8.5 × 10⁻¹⁷ m2, respectively. The highest value is 10 × 10−17 m2, corresponding to the BSR0 concrete. Therefore, the water accessible porosity is consistent with the gas permeability. These results are related to the fines of the crushed sand, which helped reduce the porosity of the concrete. This result is in agreement with the work of Layachi et al. [26].

3.5. Compressive Strength at 7, 21, and 28 Days

The values of the compressive strength of the concrete mixtures at 7, 21, and 28 days of curing in water are shown in Figure 11.
The compressive strength values are the averages obtained from three cylindrical specimens with dimensions of 160 × 320 mm. For all curing ages, overall test results showed that the compressive strength values obtained using aggregates from the tree quarries (for mixes with the same proportion) are similar. The compressive strengths of all the concrete mixes varied between 17.5 MPa (BSG100) and 28.4 MPa (BSA0). At 7 days, the compressive strength values ranged from 17 to 20 MPa and were practically similar for almost all concretes. At 21 days of curing, a relatively slight and disparate evolution was observed for all formulations, with the highest value obtained for BSA0. At 28 days, for each of the three quarries, the highest values of compressive strength were obtained for concretes composed only of river sand BSA0, BSG0, and BSR0, followed by BSA50, BSG50, and BSR50. We observed a non-significant decrease in the compressive strength between BSA0 and BSA50, BSG0 and BSG50, and BSR0 and BSR50 of 5.1%, 1.1%, 1.7%, respectively, where the use of crushed sand improved water porosity. However, the values of compressive strength were reliable for C25/30 class concrete. Moreover, the replacement of 70%, 80%, 90%, and 100% of the crushed sand decreased the compressive strength of the concrete compared to the conventional concrete with river sand. These results can be explained by the high proportions of fine particles in the crusher sands, compared to the river sand. The results obtained here differ slightly from those of Luc Leroy [8], showing that the substitution of river sand with 75% crushed sand provides high strength values at 28 days. However, these differences can be explained by the conditions under which the cement content was carried out in the two experiments

3.6. Static Modulus of Elasticity and Compressive Strength at 90 Days

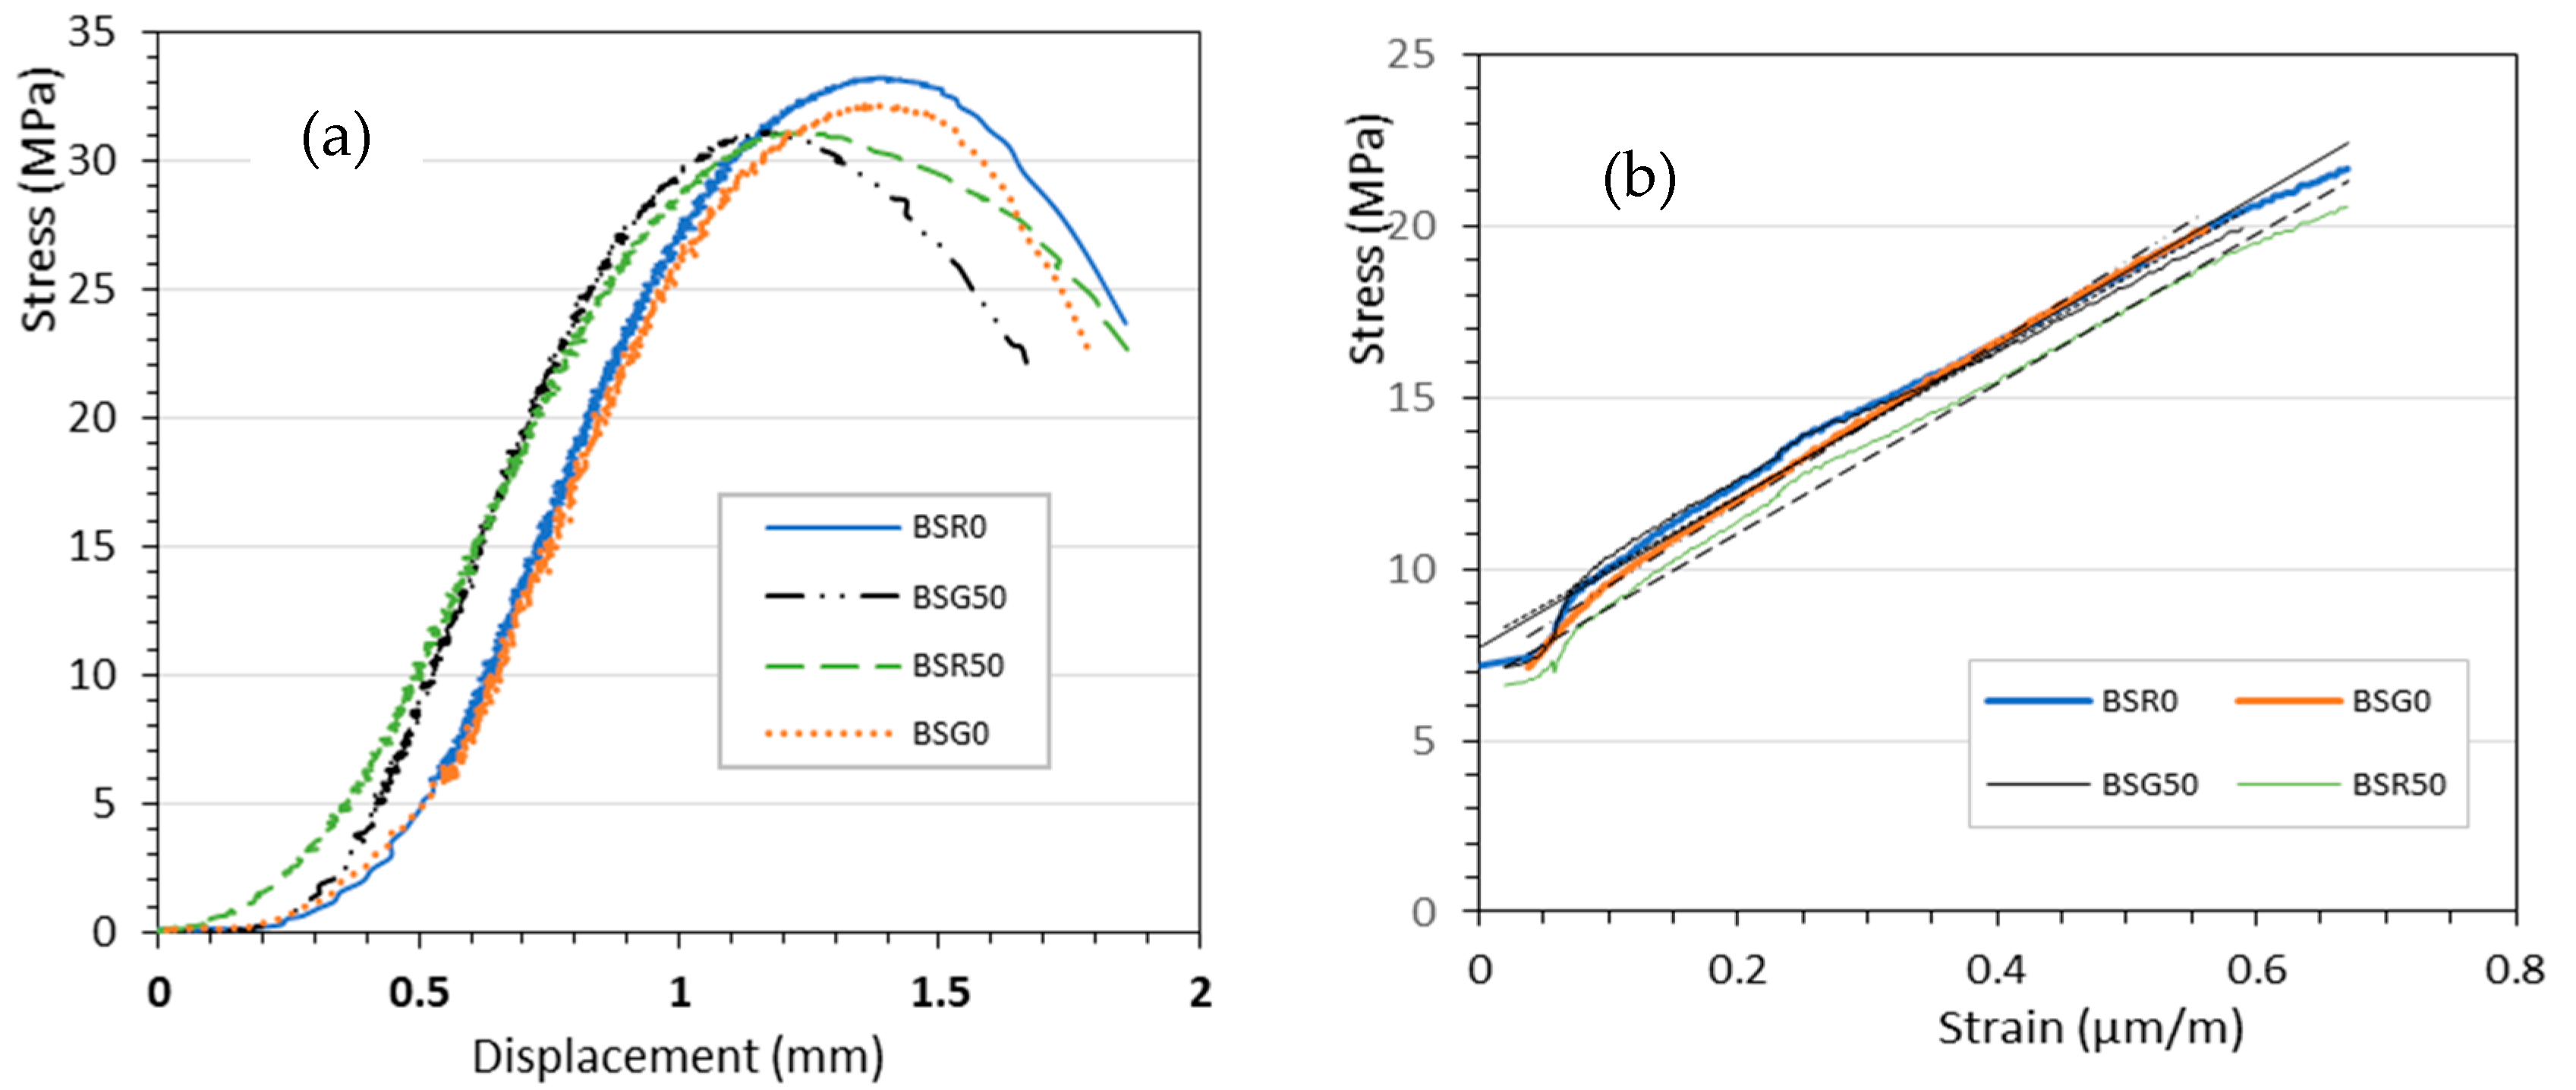
Figure 12 shows the variation of stress as a function of compressive displacement (Figure 12a) and the elastic parts of the stress–strain curves (Figure 12b) of concretes with 50% and 0% crushed sand at 90 days of age. Table 9 shows the values of the modulus of elasticity and the evolution of the compressive strength of concretes BSR0, BSG0, BR50, and BSG50.
The average values of the static modulus of elasticity of concretes BSG0 and BSR0 were 22.0 GPa and 23.7 GPa, corresponding to a relative decrease of 5.8% in the value of the modulus of elasticity of conventional concrete (with river sand) compared to the concrete with 50% crushed sand. Thus, the variation of the mean value of the elastic modulus as a function of the proportions of crushed sand in the concrete (0% and 50%) was not more than 6%.
The average compressive strength at 90 days ranged from 31.06 MPa (BSR50) to 33.21 MPa (BSR0). They are in the same resistance class (C25/30), and the difference (2.15 MPa) is non-significant. However, the difference may be due to the difference in hydration between concretes (the w/c ratio being constant for all mixtures). These compressive strength values increased by 14.41% and 20.61%, respectively, for the BSR0 and BSR50 concrete from 28 days to 90 days of age. This difference in variation reflects the fact that before 28 days of curing, free water was retained in the pores of the concrete containing 50% crushed sand. At 90 days of curing, the free water was almost totally released, allowing the concretes with 50% crushed sand to reach their optimal performance.

3.7. SEM and-EDS Analysis

In accordance with the similarities observed in the chemical composition of the crushed sands, and considering the above mechanical results, we focus in this section on the microstructure of the mortar corresponding to the concrete with river sand (BSR0) and that corresponding to the concrete with 50% crushed sand from the Razel quarry (BSR50).

3.7.1. Pore Structure and Microcracking

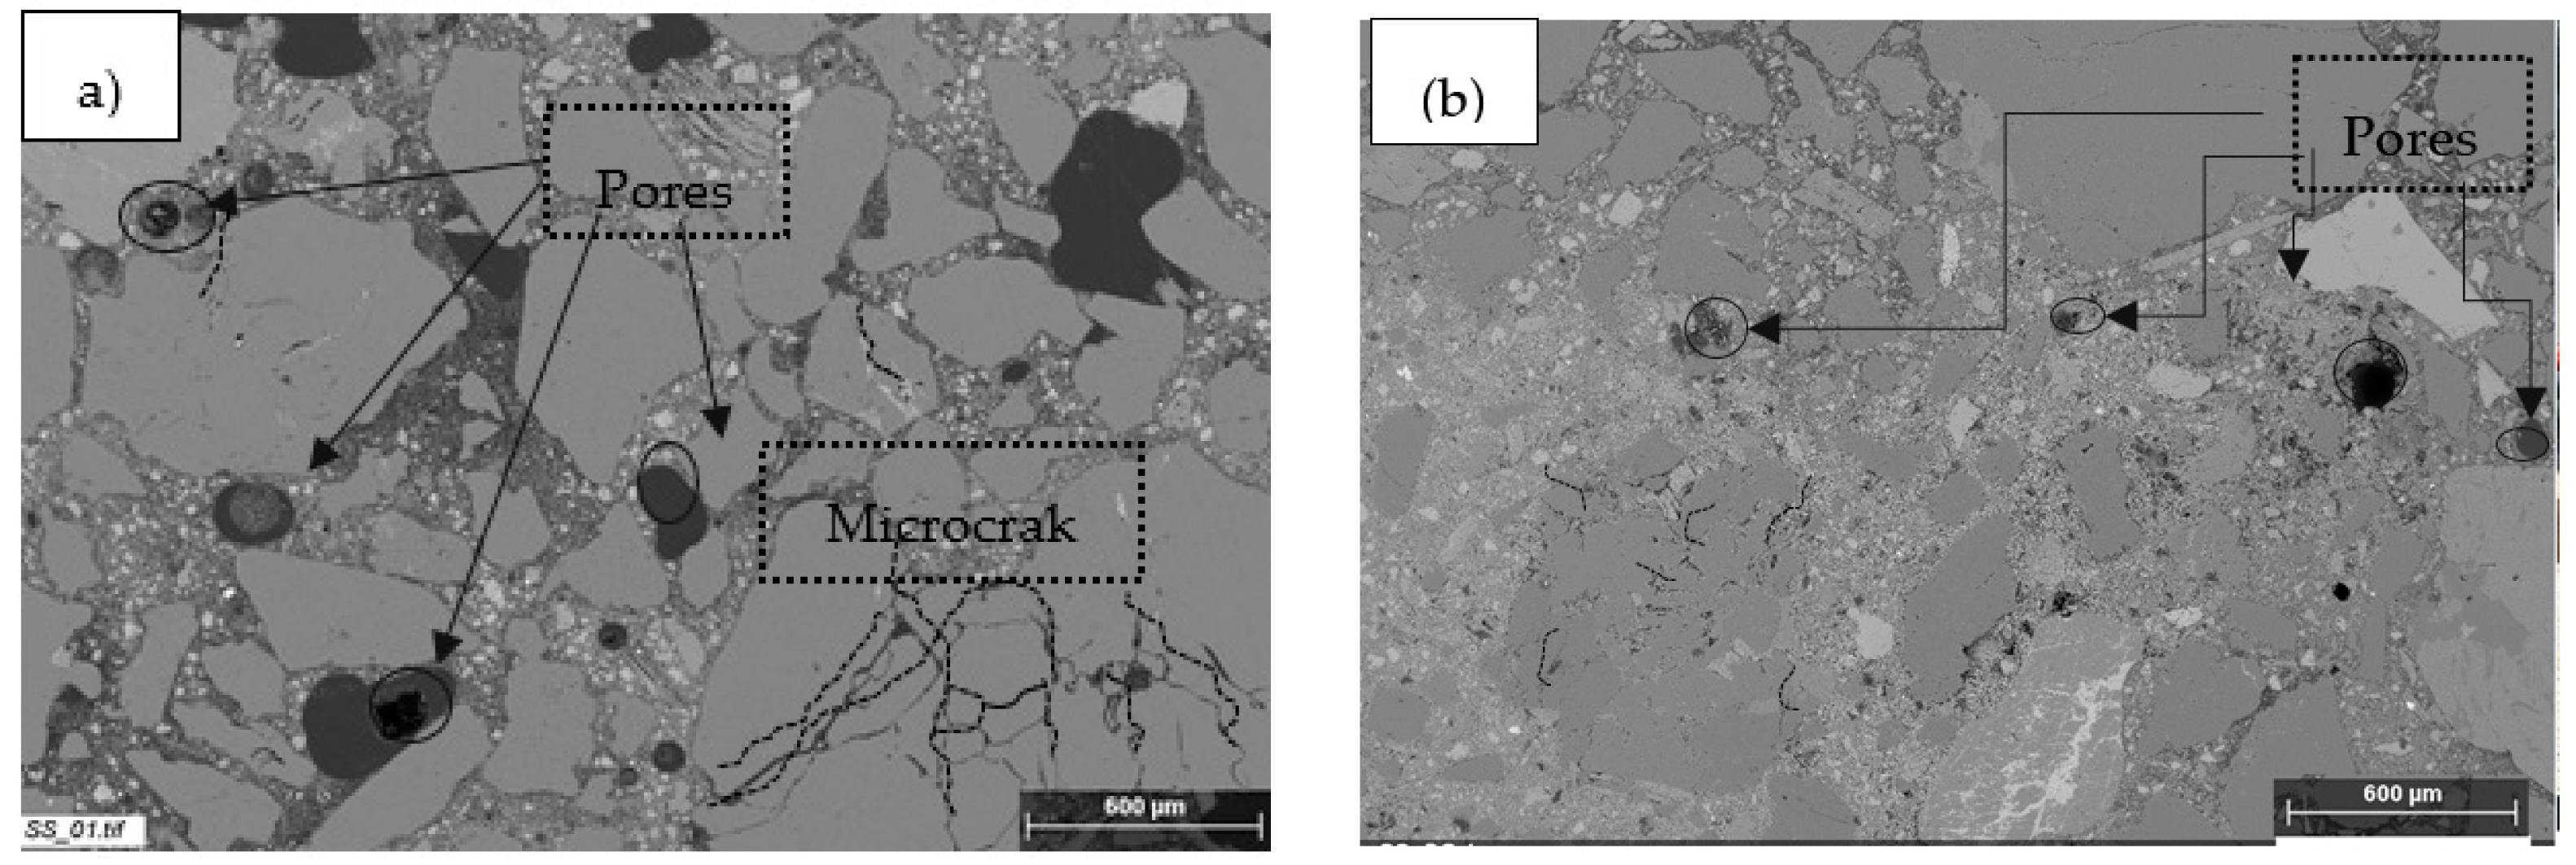
The effect of granular dispersion on the paste microstructure of BSR0 and BSR50 is shown in Figure 13.
Globally, the backscattered electron mode images showed parts of the non-hydrated cement appearing in white (much more intense on BSR0 than on BSR50), hydrates in medium grey, aggregates in dark grey, and voids in black. Slightly less open micropores (about 10 µm) were observed on the BSR50 concrete (Figure 13b). These micropores were more open (about 25 µm) on the BSR50 than on the BSR0 concrete (Figure 13a). This situation is explained by the very low rate of fines in the river sand and the results obtained in the water porosity section. There were also small channels of about 1–2 µm at the aggregate/cement matrix interface for the BSR50 concrete, which were less commonly observed on the BSR0 concrete. This difference may be due to the removal of paste during the preliminary processing of the sample or due to slightly dislodged sand grains during the polishing step [27]. This is an area with progressive change in the microstructure [23]. SEM observations provided a good understanding of the porosity results. The development of microcracks was also observed within the reactive particles of the aggregates and in the cement paste on the concrete samples. These microcracks were more open for SSB0 than for SSB50.

3.7.2. Chemical Mapping of Silicon and Calcium Analysis

Figure 14 shows the EDS chemical mapping of silicon (Si) and calcium (Ca) on the BSR0 (a) and BSR50 (c) concretes after their inclusion into the resin and polishing along with the corresponding spectra at the paste–aggregate interface: BSR0 (b) and BSR50 (d).
Analysis of the maps shows that concrete composed solely of river sand (Figure 14a) presented several silica agglomerates with irregular shapes and sizes ranging from 20 µm to several hundred micrometers, unlike the concrete made with 50% of crushed sand (Figure 14c). This observation can be explained by the high level of silica (SiO2) in the river sand, as shown in Table 5. The presence of silica was verified by the existence of silicon (Si) and oxygen (O2) and by the (almost total) absence of calcium Ca, as illustrated by the spectrum (Figure 14c). The cement paste rich in calcium (which appears as pink in Figure 14a and as blue in Figure 14c) filled the spaces between the aggregates. The paste incorporated fine particles containing 100% crushed sand mortar, while the paste with 100% sand river mortar appeared more porous with a non-homogeneous blue color (the porosity appeared black or dark blue in the cement paste). In comparison, the cementitious matrix of the mixed sand mortars (Figure 14c) seemed more homogeneous with a better granular dispersion. The crushed sand also included some angular particles (a consequence of crushing), resulting in a difference in the peak heights between the two concretes, which can be observed on the EDS spectrum at the paste/aggregate interface, as shown in Figure 14b,d.

4. Conclusions

  • In this investigation, a combination of crushed sand and river sand to develop an optimal mix design for concrete is proposed. Crushing sands (three quarry sites were identified) were analyzed and used in different proportions for the formulation of concrete combined with river sand. Physical, mechanical, and microstructural tests were carried out on the studied concretes. From the results of this study, following conclusions can be drawn. The results confirmed that the use of crushed sands (from gneiss rock) for the concretes mixes is possible;
  • The results showed that increasing the amount of crushed sand decrease the slump. It is due to the high proportions of fine particles. This high proportion of fine particles in quarry sands has shown to have an impact on the drying shrinkage of different formulated concretes, as well as on porosity and gas permeability;
  • Drying shrinkage increased very swiftly in the first few days, with high values recorded for the concrete with 100% crushed sand compared to the concrete with 100% river sand;
  • The use of crushed sand in the design of concrete mixes in proportions of 50% reduced the porosity accessible to water and the gas permeability of the concrete;
  • The mixture of 50% crushed sand and river sand in the concrete mix design did not have a significant influence on the compressive strength of the concrete at 28 days, with a slight reduction of about 2 to 3%;
  • A reduction in the static modulus of elasticity of the conventional concrete of about 5.8% was observed compared to the concrete with 50% crushed sand;
  • The compressive strength of the concretes increased as the curing age increased from 28 to 90 days by 14.41% and 20.62%, respectively, for both concretes with and without crushed sand;
  • SEM observations provided a good understanding of the porosity results. It was also found that the microcracking structure pattern is higher for concrete made with 100% of river sand, compared to the concrete made with 50% of river sand.

Supplementary Materials

The following are available online at https://www.mdpi.com/2673-4109/1/3/11/s1, Figure: presentation of the equipment used in this study as well as images of curing of concrete samples.

Author Contributions

Conceptualization, E.E. and M.M.; Data curation, E.E., A.P. and P.P.; Formal analysis, E.E. and P.P.; Methodology, A.P.; Validation, M.M. and A.N. (Albert NOUMOWE); Writing—original draft preparation, E.E.; Writing—review and editing, A.P., P.P., M.M., and A.N. All authors have read and agreed to the published version of the manuscript.

Funding

This research received no external funding.

Acknowledgments

This research work is part of a co-tutorship agreement between CY Cergy Paris University and the University of Yaoundé I. The authors gratefully acknowledge the financial support provided primarily by the C3A program (Ambition Africa Asia chair) of CY Cergy Paris University and Campus France.

Conflicts of Interest

The authors declare no conflict of interest.

References

  1. Zeghichi, L.; Benghazi, Z.; Baali, L. The effect of the kind of sands and additions on the mechanical Behaviour of S.C.C. Phys. Procedia 2014, 55, 485–492. [Google Scholar] [CrossRef] [Green Version]
  2. Koffi, K.; Aubertin, M.; Hernandez, M.A.; Ouangrawa, M.; Chapuis, R.; Bussiere, B. Etude de la conductivité hydraulique des mélanges à granulométrie étalée. Can. Geo Conf. 2008, 7, 1478–1483. [Google Scholar]
  3. Benabed, B.; Kadri, E.; Azzouz, L.; Kenai, S. Properties of self-compacting mortar made with various types of sand. Cem. Concr. Compos. 2012, 34, 1167–1173. [Google Scholar] [CrossRef]
  4. Cabrera, O.A.; Traversa, L.P.; Ortega, N.F. Fluidez de morteros cementíceos con arenas machacadas. Mater. Constr. 2010, 60, 115–130. [Google Scholar] [CrossRef]
  5. Abdullahi, M. Effect of aggregate type on compressive strength of concrete. Int. J. Civ. Struct. Eng. 2012, 2. [Google Scholar] [CrossRef] [Green Version]
  6. Kou, S.-C.; Poon, C.-S. Properties of concrete prepared with crushed fine stone, furnace bottom ash and fine recycled aggregate as fine aggregates. Constr. Build. Mater. 2009, 23, 2877–2886. [Google Scholar] [CrossRef]
  7. Imamoto, K.; Arai, M. Specific surface area of aggregate and its relation to concrete drying shrinkage. Mater. Struct. 2007, 41, 323–333. [Google Scholar] [CrossRef]
  8. Leroy, M.N.L.; Molay, T.G.G.; Joseph, N.; Bienvenu, N.J.M. Analysis of Strength Hydraulic Concrete Produced with a Mixture of crushed Gneiss and Alluvial Sand. J. Appl. Mech. Eng. 2017, 6. [Google Scholar] [CrossRef]
  9. Khouadjia, M.L.K.; Mezghiche, B.; Drissi, M. Experimental evaluation of workability and compressive strength of concrete with several local sand and mineral additions. Constr. Build. Mater. 2015, 98, 194–203. [Google Scholar] [CrossRef]
  10. Rmili, A.; Ben Ouezdou, M.; Added, M.; Ghorbel, E. Incorporation of Crushed Sands and Tunisian Desert Sands in the Composition of Self Compacting Concretes Part II: SCC Fresh and Hardened States Characteristics. Int. J. Concr. Struct. Mater. 2009, 3, 11–14. [Google Scholar] [CrossRef] [Green Version]
  11. Menadi, B.; Kenai, S.; Khatib, J.; Aït-Mokhtar, A. Strength and durability of concrete incorporating crushed limestone sand. Constr. Build. Mater. 2009, 23, 625–633. [Google Scholar] [CrossRef]
  12. L-Ameeri, A.A. Using different types of fine aggregate to produce high strength concrete, Department of Civil Engineering. Int. J. Arts Sci. 2012, 5, 187. [Google Scholar]
  13. Piasta, W.; Góra, J.; Budzyński, W. Stress–strain relationships and modulus of elasticity of rocks and of ordinary and high-performance concretes. Constr. Build. Mater. 2017, 153, 728–739. [Google Scholar] [CrossRef]
  14. Touzé, P.; Godart, B. Evaluation de la Teneur en Alcalins Equivalents Actifs dans les Ciments. Techniques et Methodes des Laboratoires de Ponts et Chaussees. 1997. Available online: https://trid.trb.org/view/989402. (accessed on 31 May 2020).
  15. «Sand Equivalent», Pavement Interactive. Available online: https://pavementinteractive.org/reference-desk/testing/aggregate-tests/sand-equivalent/ (accessed on 4 April 2020).
  16. Aubry, M.P. Recherches sur la Nannopetrographie des Roches Siliceuses. rech. sur Nannopetrographie Roches Siliceuses, 975, VOL. 62, NUM. 0002, P. 7 A 34. Available online: https://pascal-francis.inist.fr/vibad/index.php?action=getRecordDetail&idt=PASCALGEODEBRGM7620096607 (accessed on 24 September 2020).
  17. Dreux, G.; Festa, J. Nouveau Guide du Béton; Eyrolles: Paris, France, 1995. [Google Scholar]
  18. C09 Committee. Test Method for Density, Absorption, and Voids in Hardened Concrete; ASTM International: Conshohocken, PA, USA, 2013. [Google Scholar] [CrossRef]
  19. Abbas, A.; Carcasses, M.; Ollivier, J.-P. Gas permeability of concrete in relation to its degree of saturation. Mater. Struct. 1999, 32, 3–8. [Google Scholar] [CrossRef]
  20. Kollek, J.J. The determination of the permeability of concrete to oxygen by the Cembureau method-a recommendation. Mater. Struct. 1989, 22, 225–230. [Google Scholar] [CrossRef]
  21. Zhang, D.; Li, K. Concrete gas permeability from different methods: Correlation analysis. Cem. Concr. Compos. 2019, 104, 103379. [Google Scholar] [CrossRef]
  22. Yang, S.; Lee, H. Mechanical properties of recycled aggregate concrete proportioned with modified equivalent mortar volume method for paving applications. Constr. Build. Mater. 2017, 136, 9–17. [Google Scholar] [CrossRef]
  23. Scrivener, K.L. Backscattered electron imaging of cementitious microstructures: Understanding and quantification. Cem. Concr. Compos. 2004, 26, 935–945. [Google Scholar] [CrossRef]
  24. Donza, H.; Cabrera, O.; Irassar, E.F. High-strength concrete with different fine aggregate. Cem. Concr. Res. 2002, 32, 1755–1761. [Google Scholar] [CrossRef]
  25. Bouhamou, N.; Belas, N.; Mesbah, H.; Jauberthie, R.; Ouali, A.; Mebrouki, A. Influence des rapports eau/ciment et fines/ciment sur le comportement à l’état durci du béton autoplaçant à base de matériaux locaux algériens. Can. J. Civ. Eng. 2009, 36, 1195–1206. [Google Scholar] [CrossRef]
  26. Berredjem, L.; Arabi, N.; Molez, L. Mechanical and durability properties of concrete based on recycled coarse and fine aggregates produced from demolished concrete. Constr. Build. Mater. 2020, 246, 118421. [Google Scholar] [CrossRef]
  27. Dang, J.; Zhao, J. Influence of waste clay bricks as fine aggregate on the mechanical and microstructural properties of concrete. Constr. Build. Mater. 2019, 228, 116757. [Google Scholar] [CrossRef]
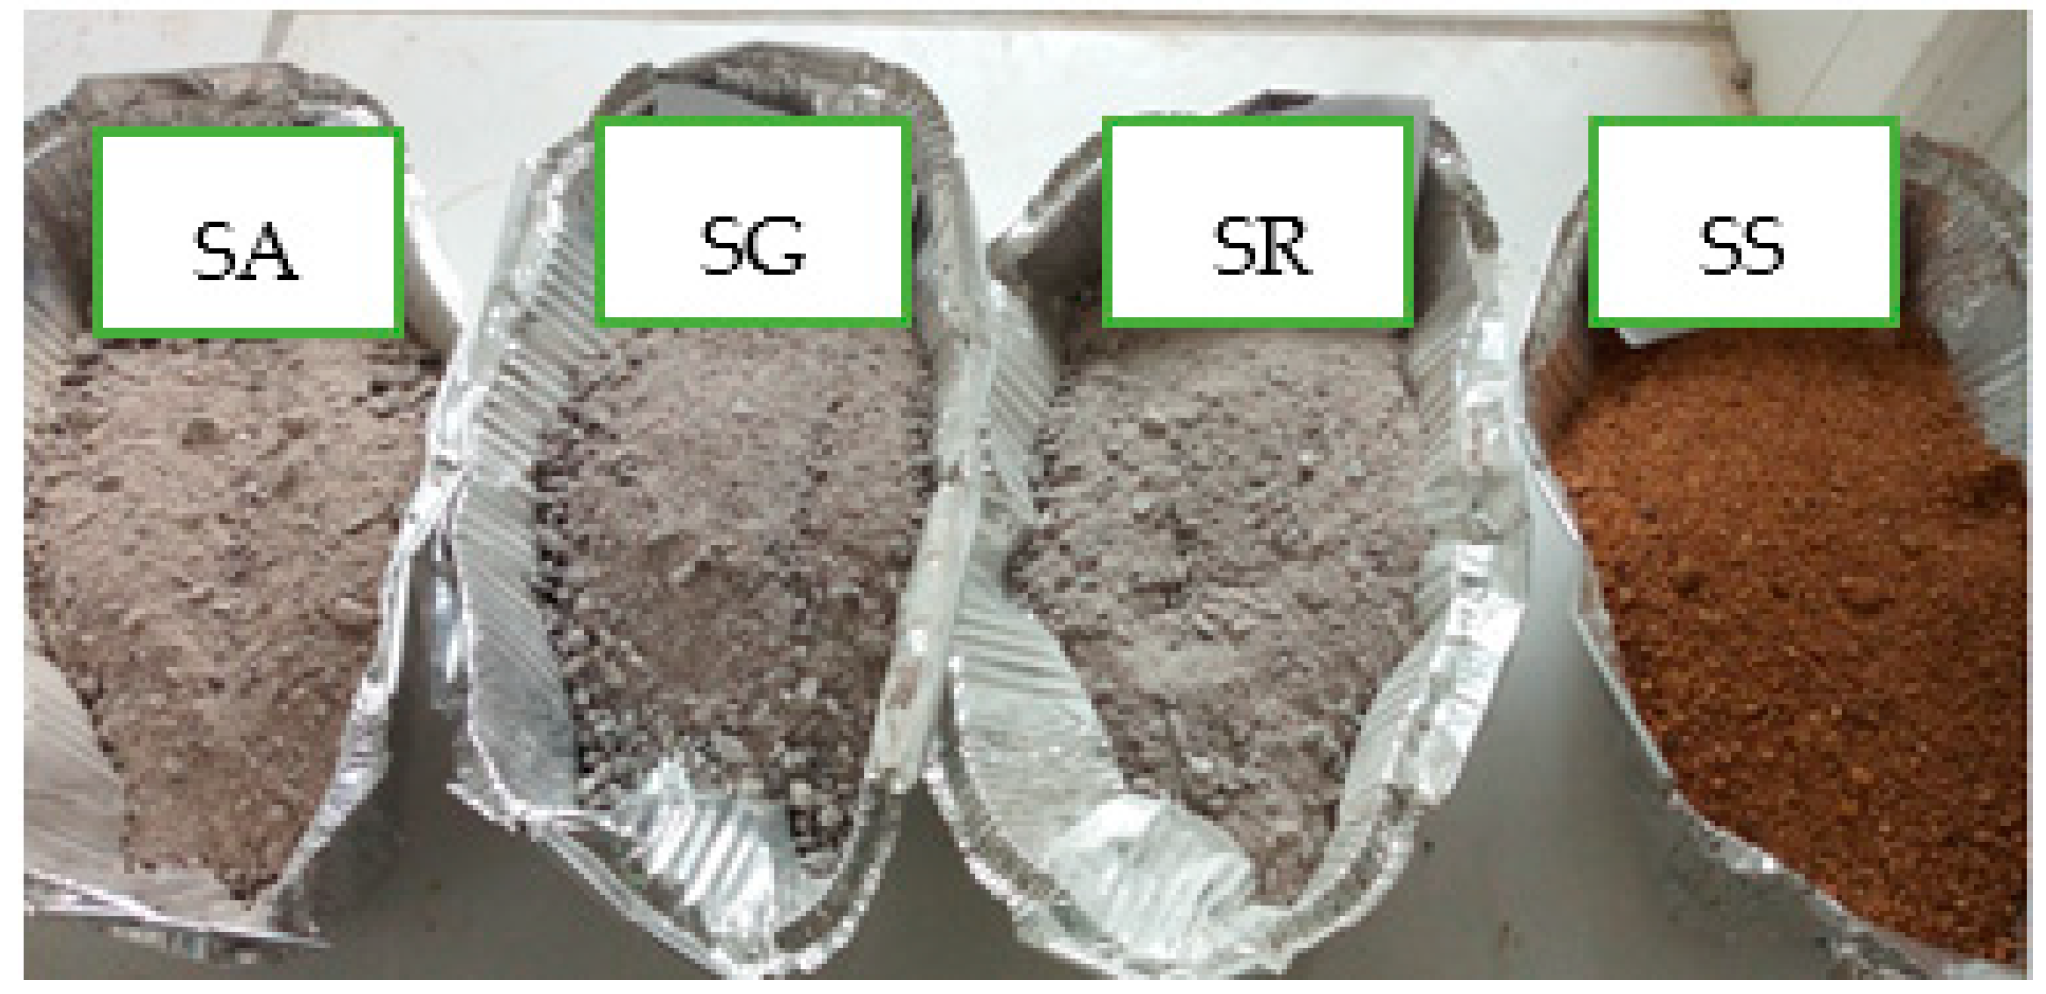
Figure 1. Pictures of the sands: SA (Sand from Arab contractor); SG (Sand from Gracam); SR (Sand from Razel); SS (Sand from Sanaga).
Civileng 01 00011 g001
Figure 2. SEM images of the sands: SR (a) and SS (c); EDS spectra of sands: SR (b) and SS (d).
Civileng 01 00011 g002aCivileng 01 00011 g002b
Figure 3. Polarized light image analysis (LPA) of mine blades: Arab Contractor (a); Gracam (b); Razel (c).
Civileng 01 00011 g003
Figure 4. Grading curves of the different sands (100%) and gravels.
Civileng 01 00011 g004
Figure 5. Concrete specimen with strain gauges under the compression test.
Civileng 01 00011 g005
Figure 6. Resin-conditioned and polished samples.
Civileng 01 00011 g006
Figure 7. Evolution of the slump as a function of the proportion of river sand.
Civileng 01 00011 g007
Figure 8. Drying shrinkage of the concrete mixes at a young age.
Civileng 01 00011 g008
Figure 9. Water porosity (a) and density (b) of mixtures.
Civileng 01 00011 g009
Figure 10. Gas permeability of the concrete mixtures.
Civileng 01 00011 g010
Figure 11. Compressive strengths for different mixtures.
Civileng 01 00011 g011
Figure 12. Stress–displacement graph of concretes (a); stress–strain graph of concrete BSR0 (b).
Civileng 01 00011 g012
Figure 13. SEM topography of the polished surfaces of the pastes of concrete BSR0 (a) and BSR50 (b).
Civileng 01 00011 g013
Figure 14. Silicon (Si) and calcium (Ca) mapping of the BSR0 (a) and MSR50 (c) EDS spectra concretes, as well as BSR0 (b) and MSR50 (d).
Civileng 01 00011 g014
Table 1. Chemical composition of the cement (%). (LOI–loss on ignition)
ElementsSiO2Al2O3Fe2O3MnOMgOCaONa2OK2OTiO2P2O5LOI
Proportions (%) 25.997.236.350.132.5648.911.020.910.970.262.67
Table 2. Mineralogical composition of the cement (from the technical sheet).
ConstituentsC3SC2SC3AC4AF
Proportions (%)50–6515–20≤7≤5
Table 3. Physical characteristics of the sands.
Sand Fines Content (%)Fineness ModulusSand Equivalent (%)Apparent Density
(kg/m3)
Specific Density
(kg/m3)
SA6.32.487.316742746
SG8.32.789.918722865
SR7.62.682.518252790
SS1.42.595.913972623
Table 4. Chemical composition of the crushed sand (%) from ICP-AES (DIN EN ISO 12677).
SandSiO2Al2O3Fe2O3MnOMgOCaONa2OK2OTiO2P2O5LOI
SA65.5015.697.760.162.741.371.762.680.950.140.57
SG62.5516.618.810.193.181.681.842.681.000.170.41
SR67.5313.737.660.142.432.221.822.131.030.190.48
SS90.163.961.540.030.080.230.432.010.23--0.79
Table 5. Apparent density and specific density of the gravel.
GravelApparent Density (kg/m3)Specific Density (kg/m3)
GA15982816
GG16152846
GR16542822
Table 6. Chemical composition of the crushed gravel (%). LOI—loss on ignition.
GravelSiO2Al2O3Fe2O3MnOMgOCaONa2OK2OTiO2P2O5LOI
GA68.5414.455.910.112.231.332.113.860.760.110.51
GG67.0814.246.840.122.762.052.012.520.880.160.70
GR68.3613.227.200.122.292.222.001.950.950.230.42
Table 7. Mineralogical composition of the different rocks (%).
MineralsQuartzFeldsparBiotiteGarnetDistheneMuscovite
A35–40%15–25%25–30%5–15%2–4%<1%
G65–70%10–15%5–7%2–5%3–5%<1%
R50–55%20–22%30–35%2–3%7–10%<1%
Table 8. Mix-design of the concretes.
Sources of AggregatesConcrete FormulationCement (kg)Water (kg)River Sand (kg)Crushed Sand (kg)Gravel (kg)
Arab Contractor’s aggregate concretesBSA100: 100%SA: GA350205.90620.081126.46
BSA90: 90% SA+10%SS: GA350205.963.79574.121116.52
BSA80: 80% SA+20%SS: GA350205.9127.86511.461110.49
BSA70: 70% SA+30%SS: GA350205.9194.05452.781096.55
BSA50: 50% SA+50%SS: GA350205.9333.06333.061080.55
BSA0: 100% SS: GA350205.9613.3301136.37
Gracam’s aggregate concretesBSG100: 100%SG: GG350205.90634.661132.11
BSG90: 90% SG+10%SS: GG350205.964.35579.231126.64
BSG80: 80% SG+20%SS: GG350205.9130.93523.731116.61
BSG70: 70% SG+30%SS: GG350205.9200.35467.481106.55
BSG50: 50% SG+50%SS: GG350205.9328.95328.951146.52
BSG0: 100% SS: GG350205.9622.2101142.37
Razel’s aggregate concretesBSR100: 100%SA: GR350205.90643.581106.64
BSR90: 90% SA+10%SS: GR350205.965.47589.191096.61
BSR80: 80% SA+20%SS: GR350205.9132.93531.731089.61
BSR70: 70% SA+30%SS: GR350205.9202.75473.031076.58
BSR50: 50% SA+50%SS: GR350205.9333.46333.421136.55
BSR0: 100% SS: GR350205.9621.1601126.43
Table 9. Static Modulus and Compressive Strength.
TestsBSR0BSG0BSR50BSG50
Static Modulus (GPa)23.7 ± 0.922.0 ± 0.721.8 ± 0.221.2 ± 0.3
Compressive strength (MPa)33.2 ± 1.332.1 ± 1.031.1 ± 0.631.1 ± 0.5