Article

Low Temperature Synthesis of 3d Metal (Fe, Co, Ni, Cu)-Doped TiO2 Photocatalyst via Liquid Phase Deposition Technique

1
Nagoya Institute of Technology, Graduate School of Engineering, Nagoya 466-8555, Japan
2
KMEW Co., Ltd., Osaka 540-6005, Japan
*
Author to whom correspondence should be addressed.
Sustain. Chem. 2025, 6(1), 1; https://doi.org/10.3390/suschem6010001
Submission received: 21 November 2024 / Revised: 16 December 2024 / Accepted: 19 December 2024 / Published: 24 December 2024

Abstract

The titanium dioxide (TiO2) photocatalyst is an important semiconducting material that exhibits environmental purification functions when exposed to light. Elemental doping of TiO2 is considered an important strategy to improve its photocatalytic activity. Herein, we have achieved the low-temperature, atmospheric-pressure synthesis of anatase TiO2 particles with doping of 3d metals (Fe, Co, Ni and Cu) based on the liquid phase deposition technique. All products prepared by adding 3d metals were found to consist of TiO2 crystals in the anatase phase with a fine protruding structure of about 40 nm on the surface, as was the case without the addition of metal ions. Iron and copper were observed to be incorporated at higher concentrations than cobalt and nickel, with an elemental addition of up to 4 at% and 1 at%, respectively, when 10 mM iron and copper nitrate were applied. Such doping efficiency could be explained by the difference in ionic radius and chemical stability. A narrowing of the optical band gap with doping elements was also observed, and it was found that optical sensitivity could be imparted down to the visible-light region of 2.4 eV (Fe: 4 at% addition). Furthermore, the 3d metal-doped TiO2 demonstrated in this study was shown to exhibit photocatalytic methane degradation activity. The amount of methane degradation per unit area of the microparticles was twice as great when iron and copper were added, compared to the undoped counterpart. It has been demonstrated that the strategy of doping TiO2 with 3d metal ions by low-temperature synthesis methods is effective in enhancing carrier dynamics and introducing surface active sites, thus increasing methane degradation activity.

1. Introduction

Photocatalysis is an efficient method to chemically harness the energy of sunlight [1,2]. A photocatalyst absorbs photons to generate electron-hole pairs and subsequently induces chemical reactions at the surface [3]. Titanium dioxide (TiO2), in the anatase phase, is the most representative photocatalyst because of its strong oxidizing power as well as its physical and chemical stability [4,5,6]. TiO2 has been used in a variety of environmental applications, such as self-cleaning surfaces, water splitting, disinfection, and air purification [7,8,9,10]. The wide bandgap of TiO2 (approximately 3.2 eV) limits its sensitivity to UV light, which only accounts for approximately 5% of sunlight [11]. This is considered to be one of the critical limitations for efficient photocatalysis. Furthermore, TiO2 often suffers from rapid recombination of photogenerated electron-hole pairs, which reduces the number of charge carriers available for photocatalytic reactions [12]. Therefore, to date, extending the wavelength range of photoactivation and enhancing the charge carrier dynamics of TiO2 are crucial tasks in enhancing the efficiency of solar energy use.
Elemental doping of TiO2 is a powerful strategy to enhance its photocatalytic performance [13,14]. One of the most notable impacts of elemental doping is the modification of the electronic structure of TiO2 [15,16,17,18,19]. Introducing 3d metal ions (such as Fe, Co, Ni, and Cu) into the TiO2 lattice creates new energy levels within the bandgap [20,21,22,23,24]. These new levels can effectively narrow the bandgap, extending its light absorption capabilities to the visible spectrum. This reduction typically ranges from 2.0 eV to 3.0 eV, depending on the dopant. This bandgap engineering is crucial to improving the efficiency of TiO2-based photocatalysts in applications that rely on visible light, such as environmental remediation and energy conversion. Three-dimensional metal dopants can also act as charge carrier traps or mediators, enhancing the separation and transfer of electrons and holes [15,25]. For instance, metals such as Fe and Cu can create mid-gap states that facilitate the separation of photogenerated electrons and holes, thus allowing more carriers to successfully diffuse to the surface and improving the photocatalytic efficiency [23,26]. Three-dimensional metal ions can introduce new active sites or modify the surface properties of TiO2. Three-dimensional metal doping not only enhances light absorption and charge carrier dynamics, but also modifies the surface properties of TiO2 [27]. This modification is expected to introduce new catalytic sites or enhance existing ones, improving the photocatalytic activity for specific reactions. For example, Cu-doped TiO2 includes sites that promote the adsorption and activation of methane molecules, facilitating their conversion into valuable products such as methanol or hydrogen [28].
The synthesis of 3d metal-doped anatase TiO2 has been demonstrated via various methods, such as sol–gel, hydrothermal, and aerosol-assisted chemical vapor deposition (AACVD), each with specific conditions tailored to achieve effective doping and maintain the anatase phase [25,28,29,30,31]. Although these methods successfully demonstrated elemental doping in anatase TiO2 nanostructures, most of them require a high synthetic temperature or further calcination at a high temperature, e.g., ~500 °C for photocatalytic applications, even if the synthetic temperature is low (~200 °C). Studies on synthesis or coating techniques operating at low temperatures and under normal pressure are scarce.
In this context, our objective was to demonstrate 3d metal (Fe, Co, Ni, Cu) doping of TiO2 at low temperature (~80 °C) and under normal pressure, and to further investigate the impact of doping these metals on photocatalytic performance. For this, we employ the liquid phase deposition (LPD) technique as a method to produce TiO2 nanostructures. LPD is a simple and economical approach to generate TiO2 with an anatase phase at room temperature, which was first reported by Deki in 1996 [32]. LPD synthesis is based on the hydrolysis of ammonium hexafluorotitanate, with boric acid used as the fluorine ion scavenger, forming TiO2 through a ligand exchange reaction [32,33]. As this reaction proceeds even at room temperature and atmospheric pressure, LPD is applicable for non-heat resistant materials such as polystyrene, glass, etc. [34,35,36]. Based on LPD, our group has successfully introduced Cu into the TiO2 matrix, resulting in improved photocatalytic activity under visible light due to improved light absorption and reduced bandgap [37]. In this study, by varying dopant parameters, the effect of dopants and doping levels on the produced structures and photocatalytic activity against reducing methane were studied. The product was characterized by means of several microscopic and spectroscopic techniques, after which we tested the photocatalytic activity of the products against the reduction of methane gas. It is shown that TiO2 anatase with 3d metal doping can be prepared at low temperature and atmospheric pressure, enabling sensitivity to visible light and enhanced activity for the photocatalytic reduction of methane.

2. Materials and Methods

2.1. Sample Preparation

Following the typical LPD procedure described in a previous study [37], we produced TiO2 samples through a temperature-assisted liquid phase deposition process. For precursors, we used (NH4)2TiF6 (AHFT) (FUJIFILM Wako, 1st Grade, Osaka, Japan) and H3BO3 (FUJIFILM Wako, 1st Grade). We separately dissolved both materials in distilled water at 0.1 M and 0.3 M for AHFT and boric acid, respectively. This ratio allowed the production of the anatase phase of TiO2. For doping iron (Fe), cobalt (Co), nickel (Ni) and copper (Cu), we then mixed the solutions with several types of metal salts such as Fe(NO3)3·9H2O (FUJIFILM Wako, Wako Special Grade), Co(NO3)2·6H2O (FUJIFILM Wako, Wako Special Grade), Ni(NO3)2·6H2O (FUJIFILM Wako, Wako Special Grade), and Cu(NO3)2·3H2O (FUJIFILM Wako, Wako Special Grade). Next, we placed beakers containing the mixed solution in an oven at 70 °C for 3 h. In a previous study, the use of nitrate salts, a temperature of 70 °C and a reaction time of 3 h were favorable for improved crystallinity and photocatalysis [36]. We changed the concentration of metal nitrates up to 10 mM for producing different doping levels. Here, we did not apply doping levels higher than 10 mM to avoid excess doping, which weakens photocatalytic activity. After the reaction proceeded for 3 h, we obtained the powders after separation by centrifugation (3500 rpm) for 15 min, which we washed by dispersion in distilled water, centrifuged three times and then dried at room temperature.

2.2. Characterization

We characterized the substrate samples with a Raman spectroscope (NRS-3300, JASCO, Hachioji, Tokyo, Japan), UV–vis spectrometry (UV mini 1240, Shimadzu, Nakagyo-ku, Kyoto, Japan), a scanning electron microscope (SEM) (JSM-7800F, JEOL, Akishima, Tokyo, Japan), an electron probe micro-analyzer (EPMA) (JXA-8530F, JEOL, Akishima, Tokyo, Japan), and X-ray photoelectron spectroscopy (XPS) (PHI5000 VersaProbe, ULVAC-PHI Inc., Chigasaki, Kanagawa, Japan). We determined the optical band gap of the nanoparticles using diffuse reflection spectroscopy (DRS) with a fiber optic reflectance sphere (#58-583, Edmund OPTICS, Barrington, NJ, USA). We calculated the optical band gaps using the Kubelka−Munk (K-M) method based on diffuse reflectance spectra, where F(R) = (1 − R)2/2R [38].

2.3. Photocatalysis Test for Reducing Methane

The photocatalytic decomposition of methane gas was tested with 3d metal-doped TiO2. The schematic illustration and picture of the setup are represented in Figure 1 and inset. The obtained products were preliminarily UV-treated with a lamp (HUV-300, ORC MANUFACTURING Co., Ltd., Chiyoda-ku, Tokyo, Japan) for 48 h to remove contaminants on the surface of the product. The applied power was (100 ± 10) mW/cm2. A quantity of 24 mg of powder was spread in a glass container, and then methane and air were introduced and shielded by closing the valve. The gas concentration was fixed as (3600 ± 100) ppm. While photocatalytic reaction was initiated by illuminating the powder entirely from the outside of the glass container with black light (wavelength: 360 nm, power: (1.60 ± 0.05) mW/cm2), the gas was picked out with a syringe to measure the concentration of methane gas by gas chromatography (GC-2030, SHIMADZU CORPORATION, Nakagyo-ku, Kyoto, Japan). As control experiments, we also tested bare TiO2 nanoparticles with an anatase phase, which are commercially available as “photocatalytic ceramic coating” from KMEW Co., Ltd. (Osaka, Japan).

3. Results and Discussion

3.1. Influence of Doping on Morphology and Crystal Structures

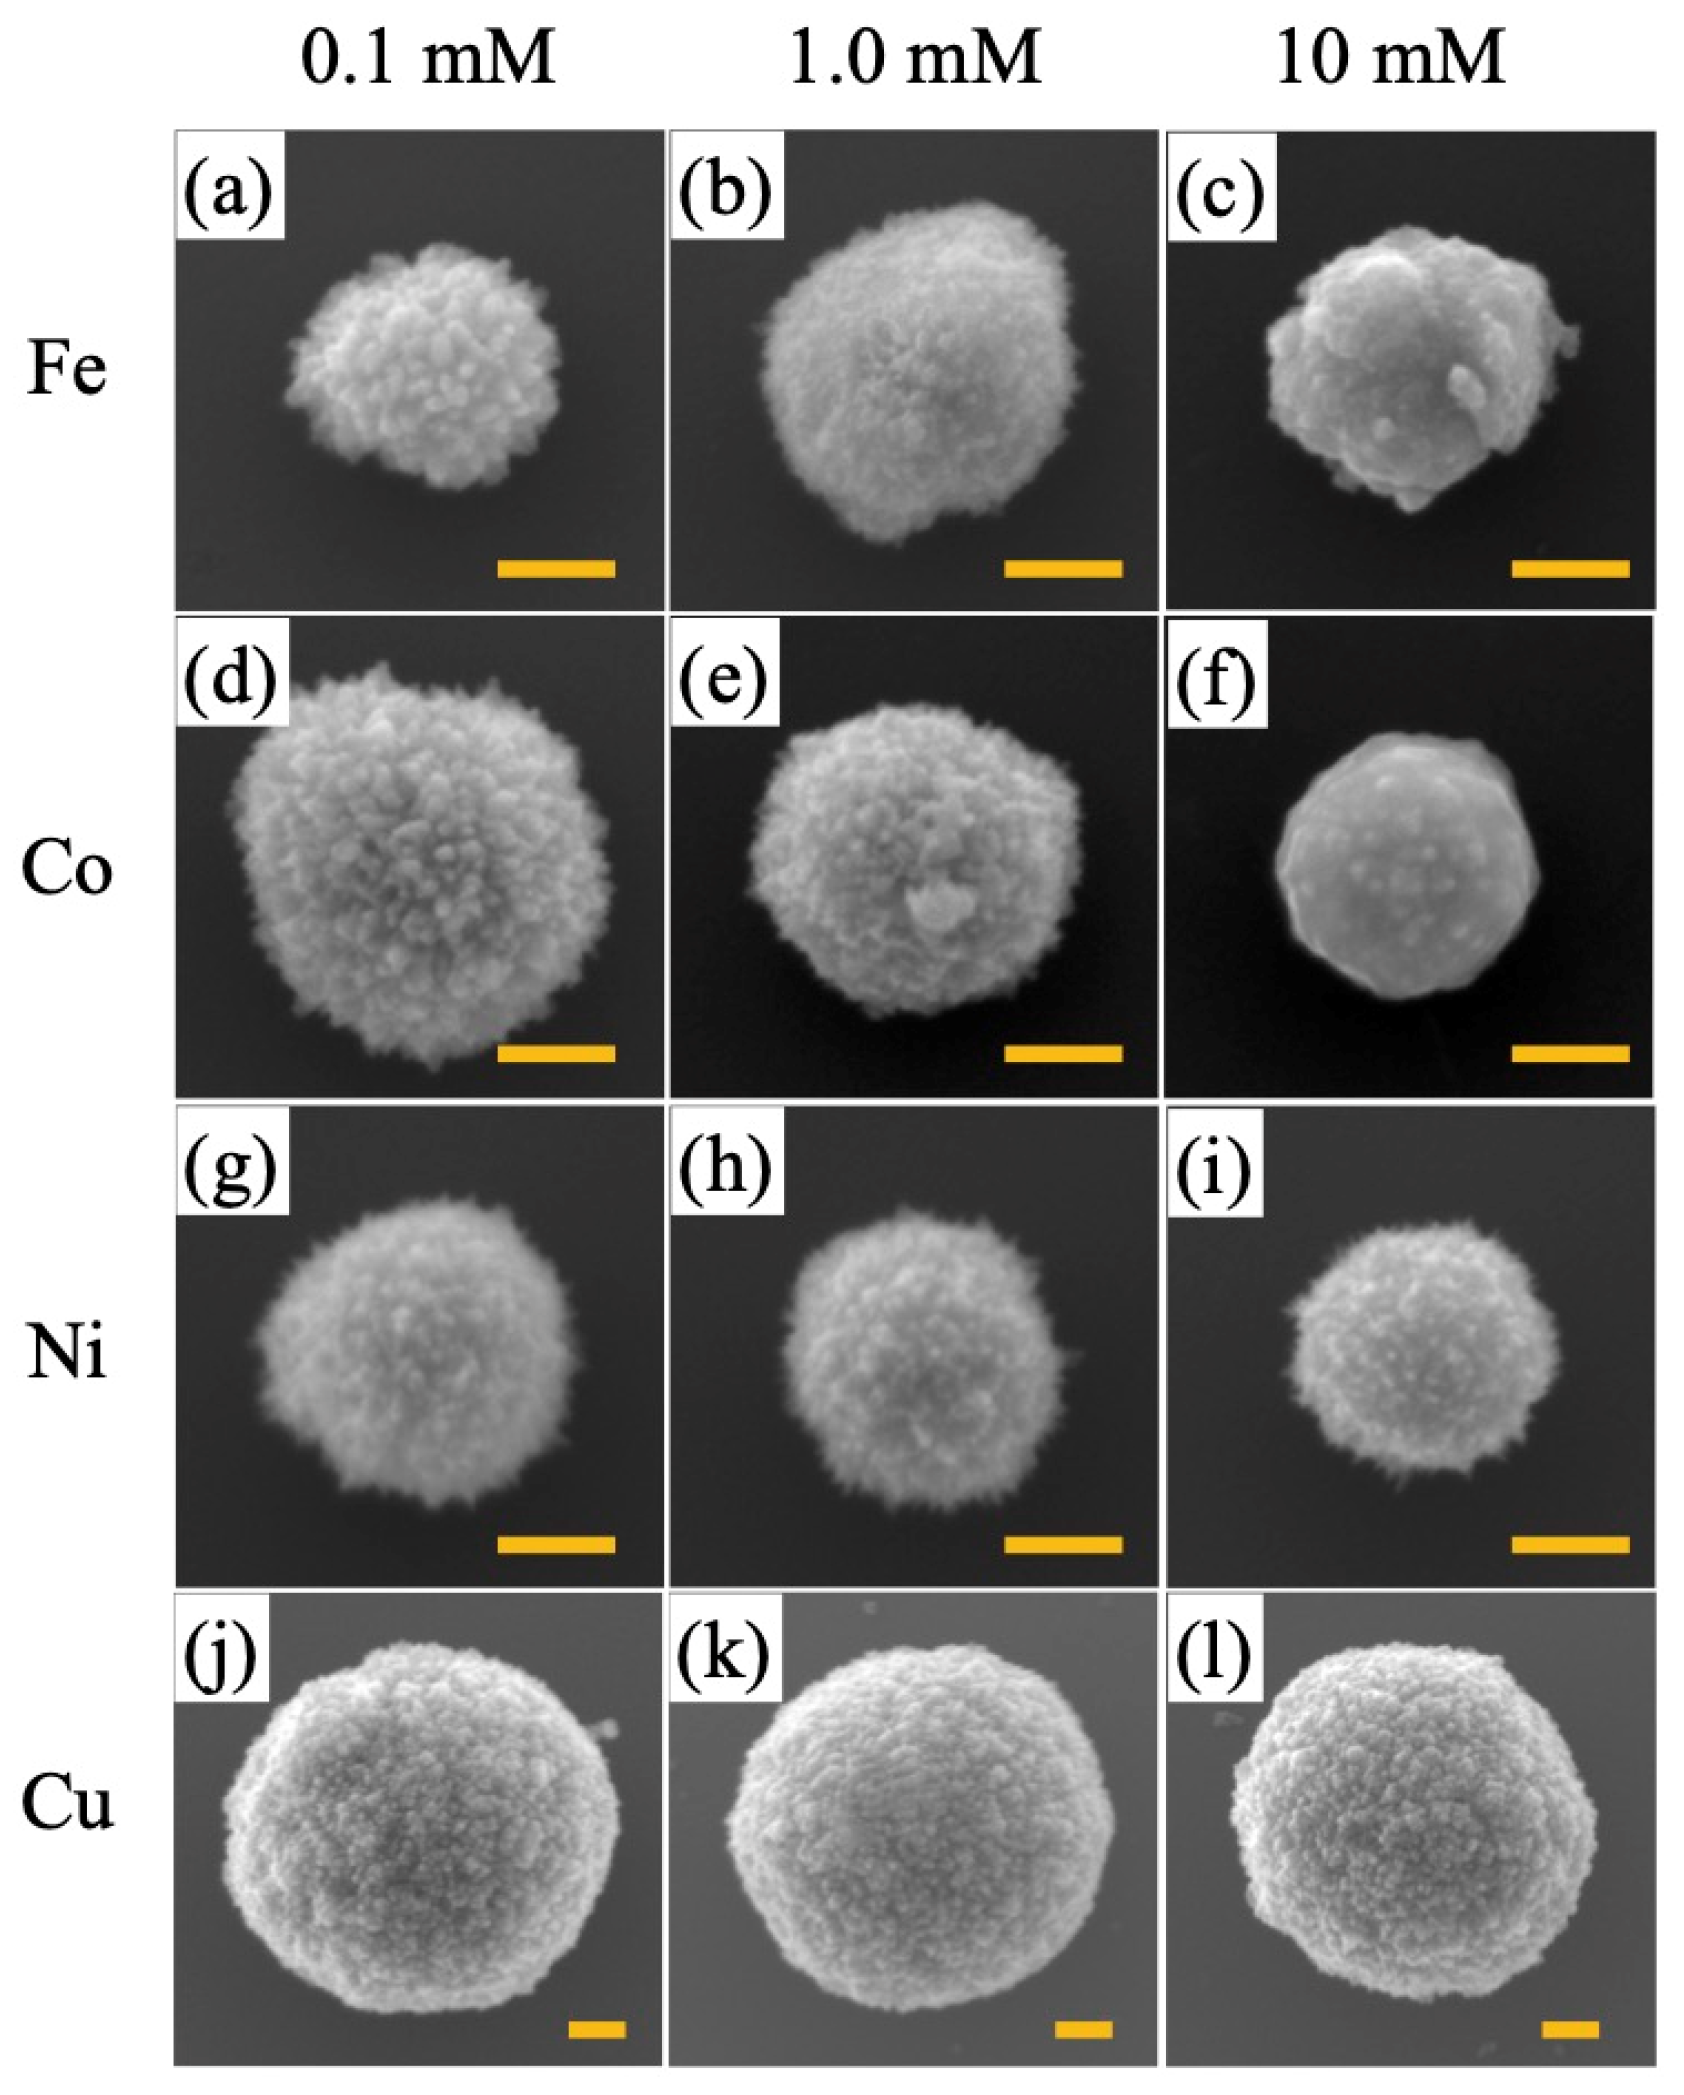
Figure 2 shows the SEM images of the products prepared with 3d metal nitrates (Fe, Co, Ni, and Cu) with different dopant concentrations of 0.1, 1.0 and 10.0 mM. All of the products were waxberry-shaped particles with a protrusion structure on the surface, which is a typical structure formed by this method [36]. The size of the particles was seen to depend on the metal species and concentration. Table 1 displays the particle size observed by means of SEM. When Cu is applied, the particles are obviously larger than with the other metals. This could be due to the diffusion of ions on the TiO2 surface. Among the dopant ions used in this study, Cu2+ tends to exhibit better diffusion on the TiO₂ surface [39]. Accordingly, faster diffusion allows ions to migrate more efficiently to preferred sites, such as steps or edges, where crystal growth typically occurs, leading to production of larger particles. By increasing the concentration of dopants, the particle size appears to decrease in the case of Fe and Cu while slightly larger particles were observed in the case of Co and Ni. It was also observed that the protrusion structure on the product surface was blunted as the dopant concentration of Fe, Ni and Co increased.
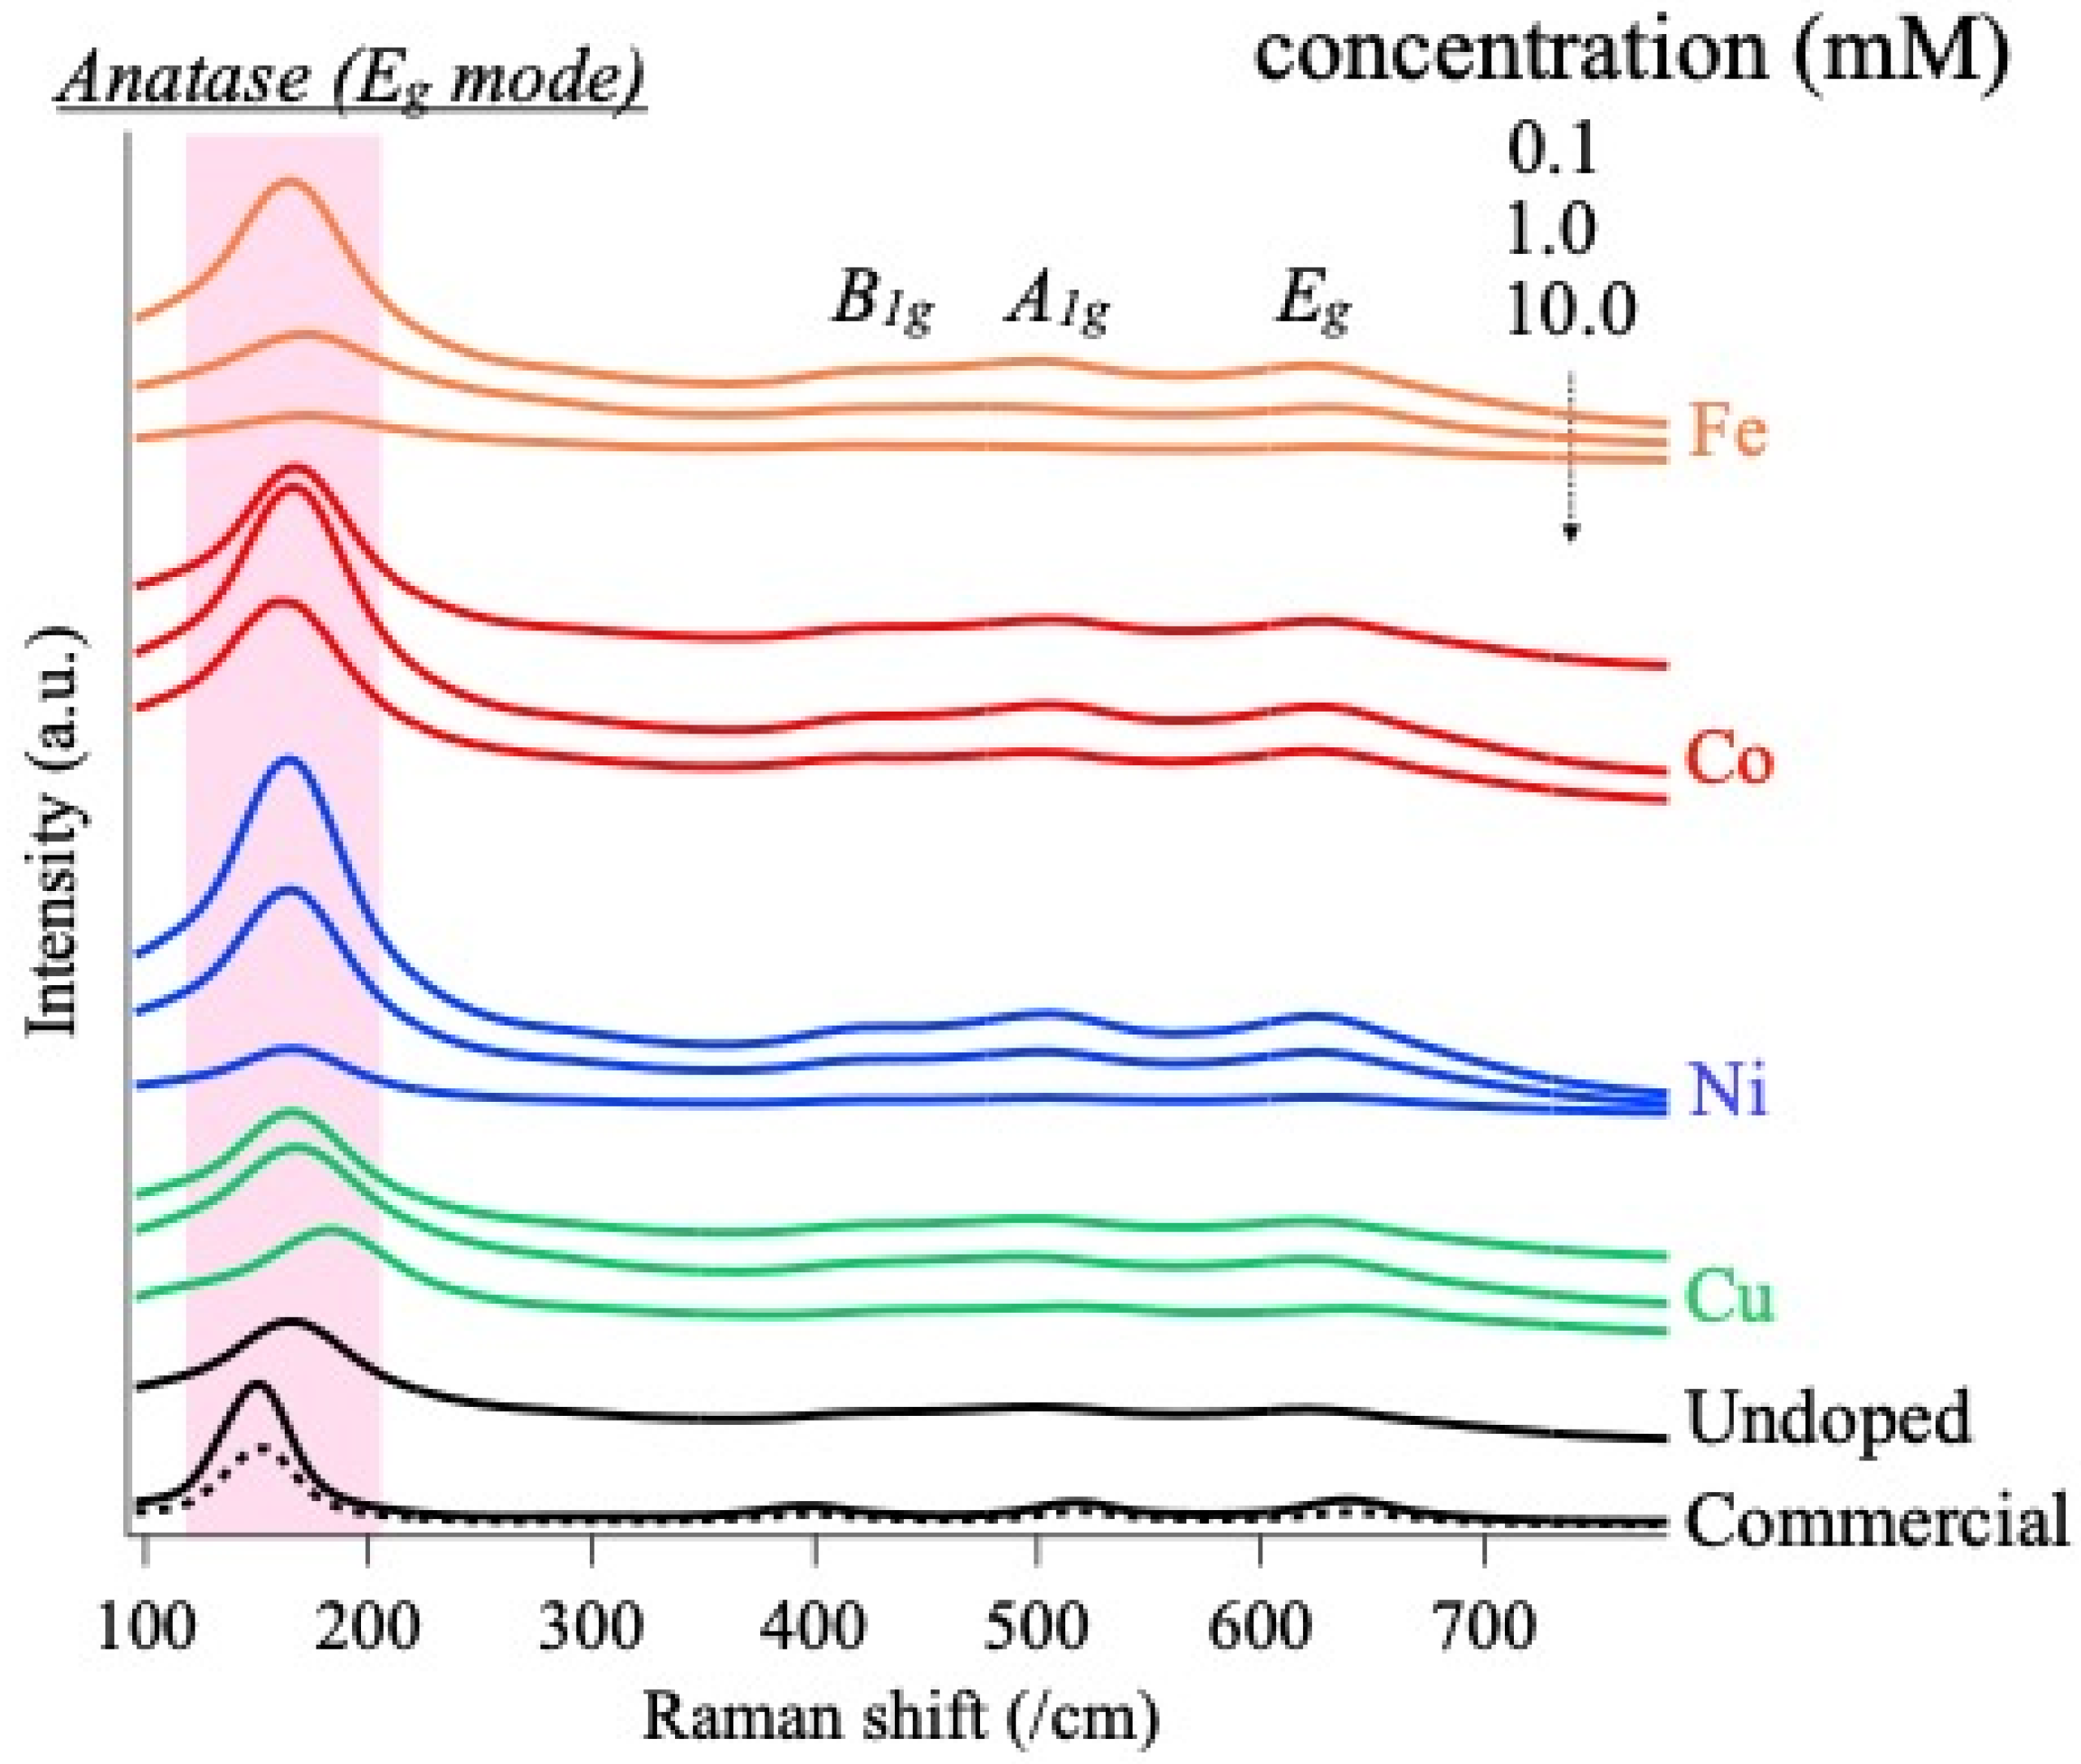
To further understand the molecular vibrational state, we applied Raman spectroscopy. Figure 3 shows the Raman spectroscopy result for undoped and doped samples. While the black spectra indicate undoped TiO2 samples, the colors of blue, orange, red and green indicate the dopant species, Ni, Fe, Co and Cu, respectively. The spectrum of each color is arranged in order of increasing concentration, from the top to the bottom. In all Raman spectra, Eg, B1g and A1g modes are seen in Figure 3, which confirms the formation of anatase TiO2 via LPD synthesis even with doping metal ions [36,40]. XRD patterns also confirmed the crystallographic nature of anatase TiO2, while doped samples exhibited poor crystallinity compared to undoped samples (see Figure S1). Based on the Scherrer equation, the crystallite size of undoped TiO2 is calculated to be ~50 nm, while a smaller size is expected in the doped samples according to the wide peaks. Since analyzing the XRD patterns of doped samples is difficult due to spectral noise issues, we have performed curve-fittings to Eg Raman mode for better understanding of the influence of doping on the local structure of TiO2.
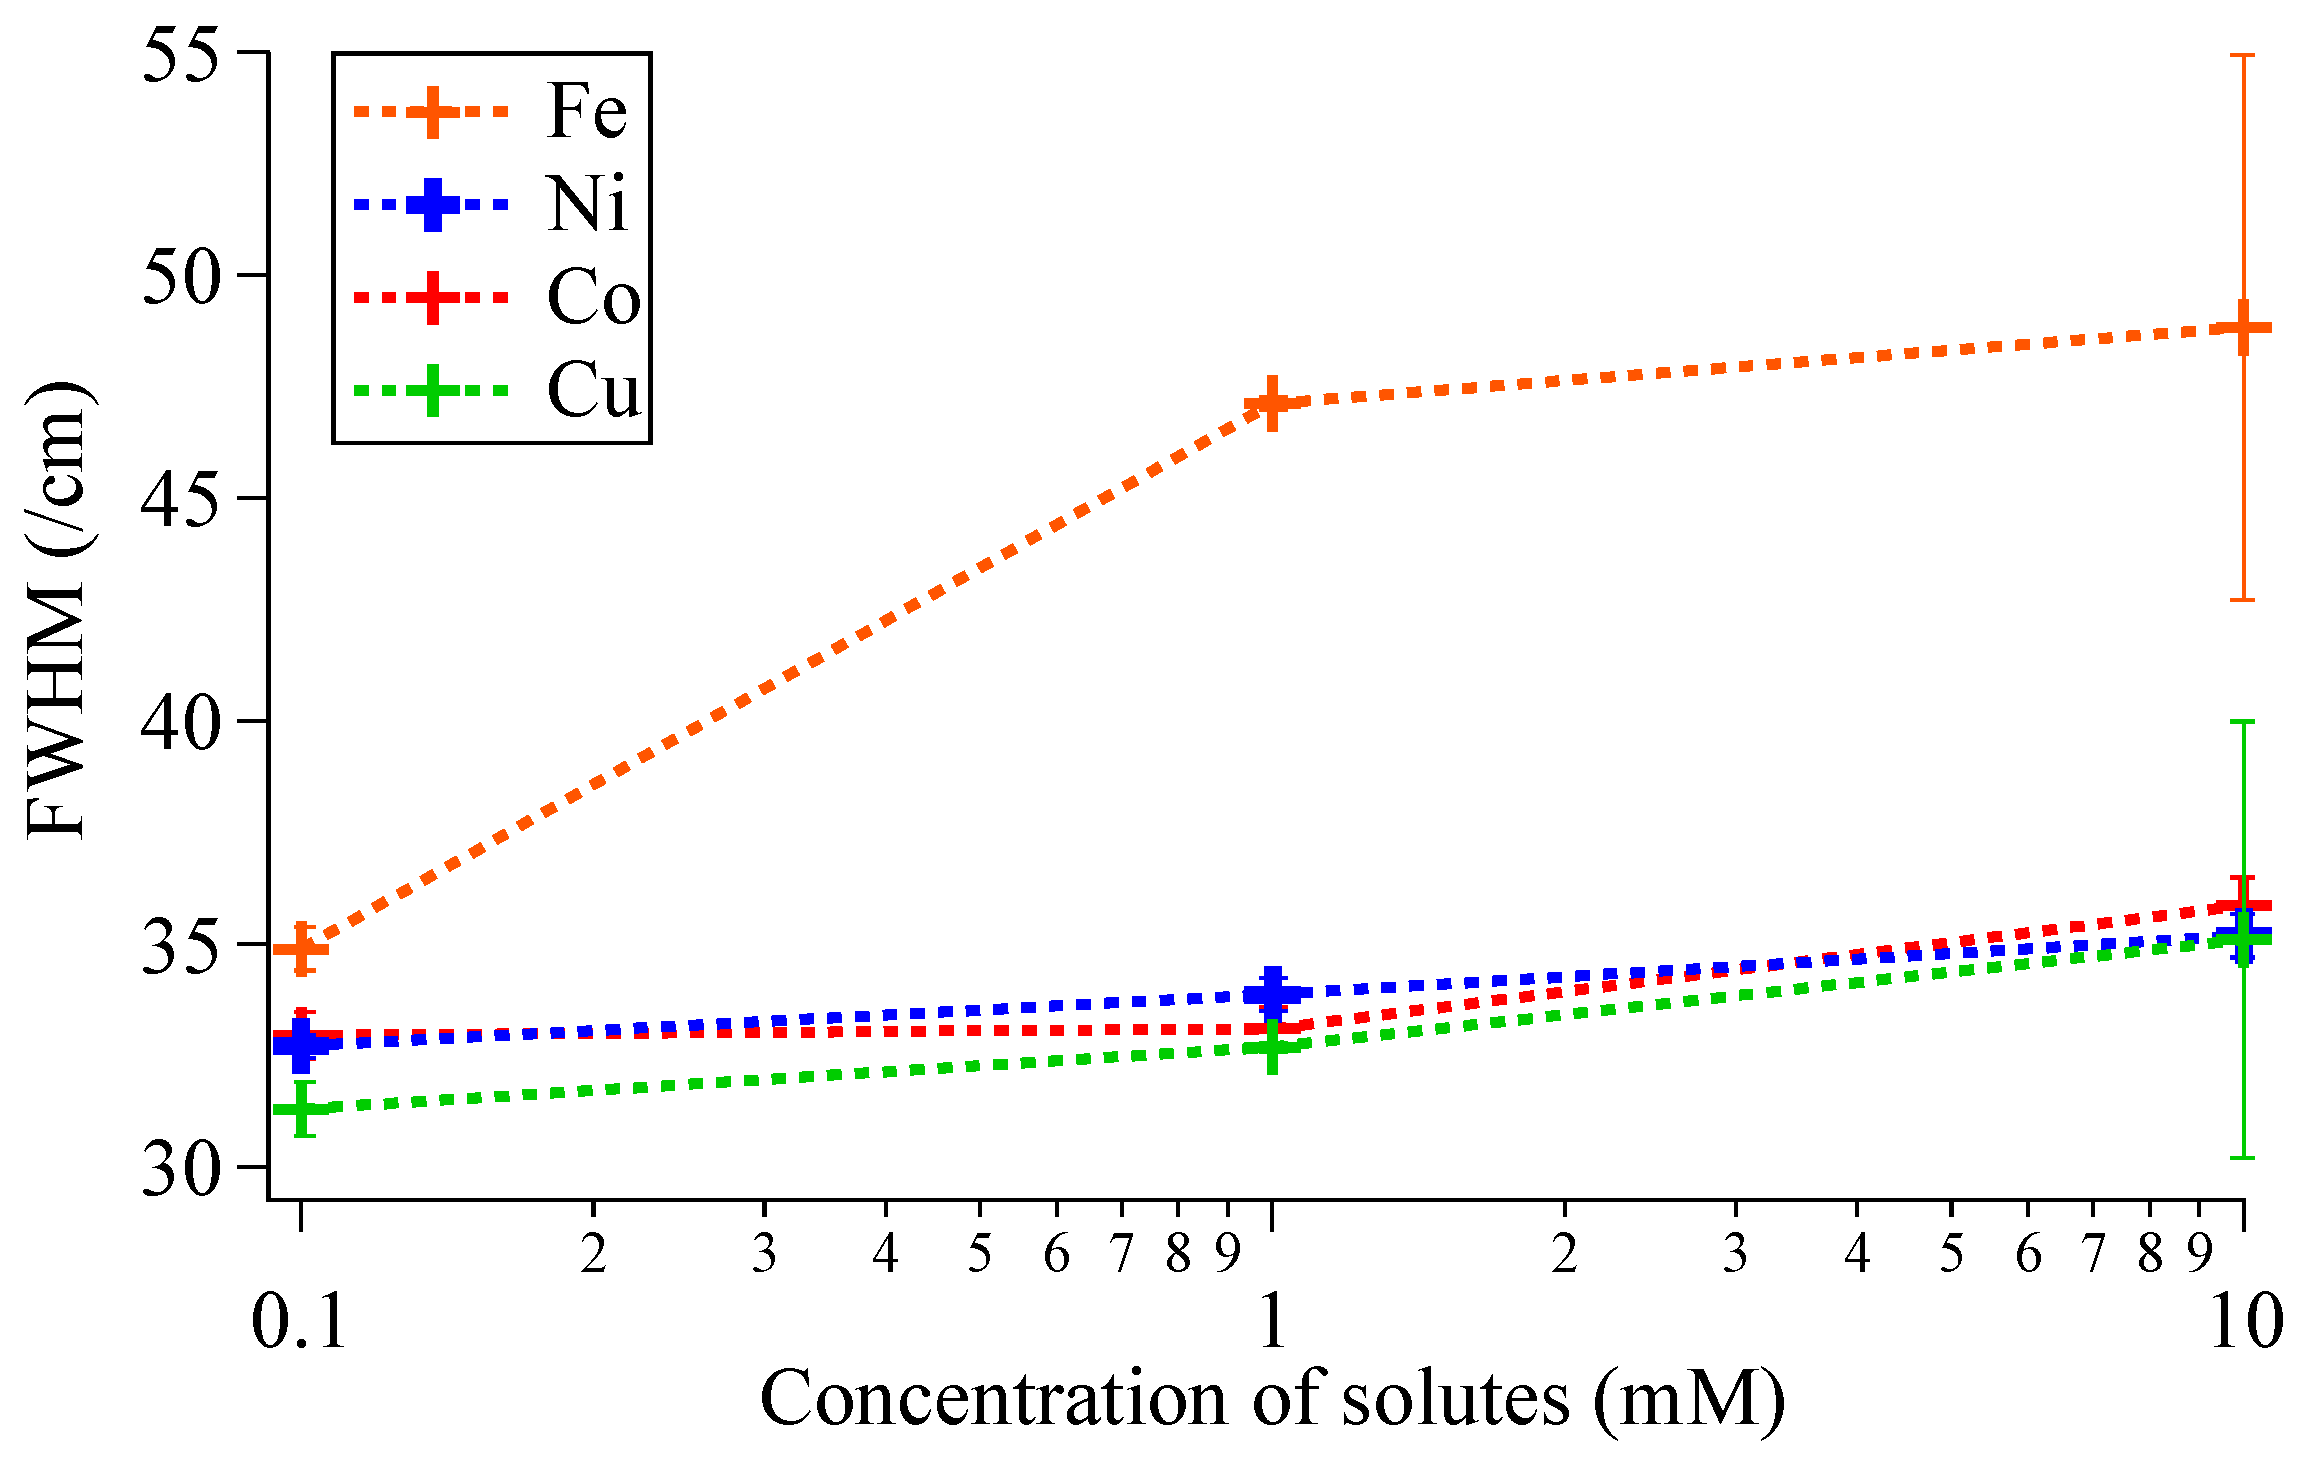
Figure 4 shows the molar concentration dependence of the full width at half maximum (FWHM) of the Eg Raman mode as the molar concentration of metal ions increased up to 10 mM. In all cases, the increase in FWHM values is observed when a higher concentration is applied. This behavior of the FWHM values could be explained by the local structure of the TiO2 crystals. In general, the spectral line shape of crystal lattice vibrations (or phonons) is known to be inversely proportional to the lifetime of the phonons [41]. The broadening of the spectral width is attributed to the decay of phonon scattering, as a result of the presence of impurity or defect sites and crystallite edges in the crystallites. Therefore, in our experiments, doping Fe, Cu, Co, and Ni in higher concentrations is expected to induce lattice disorders or size reduction to form more impurity/defect sites and crystallite edges.
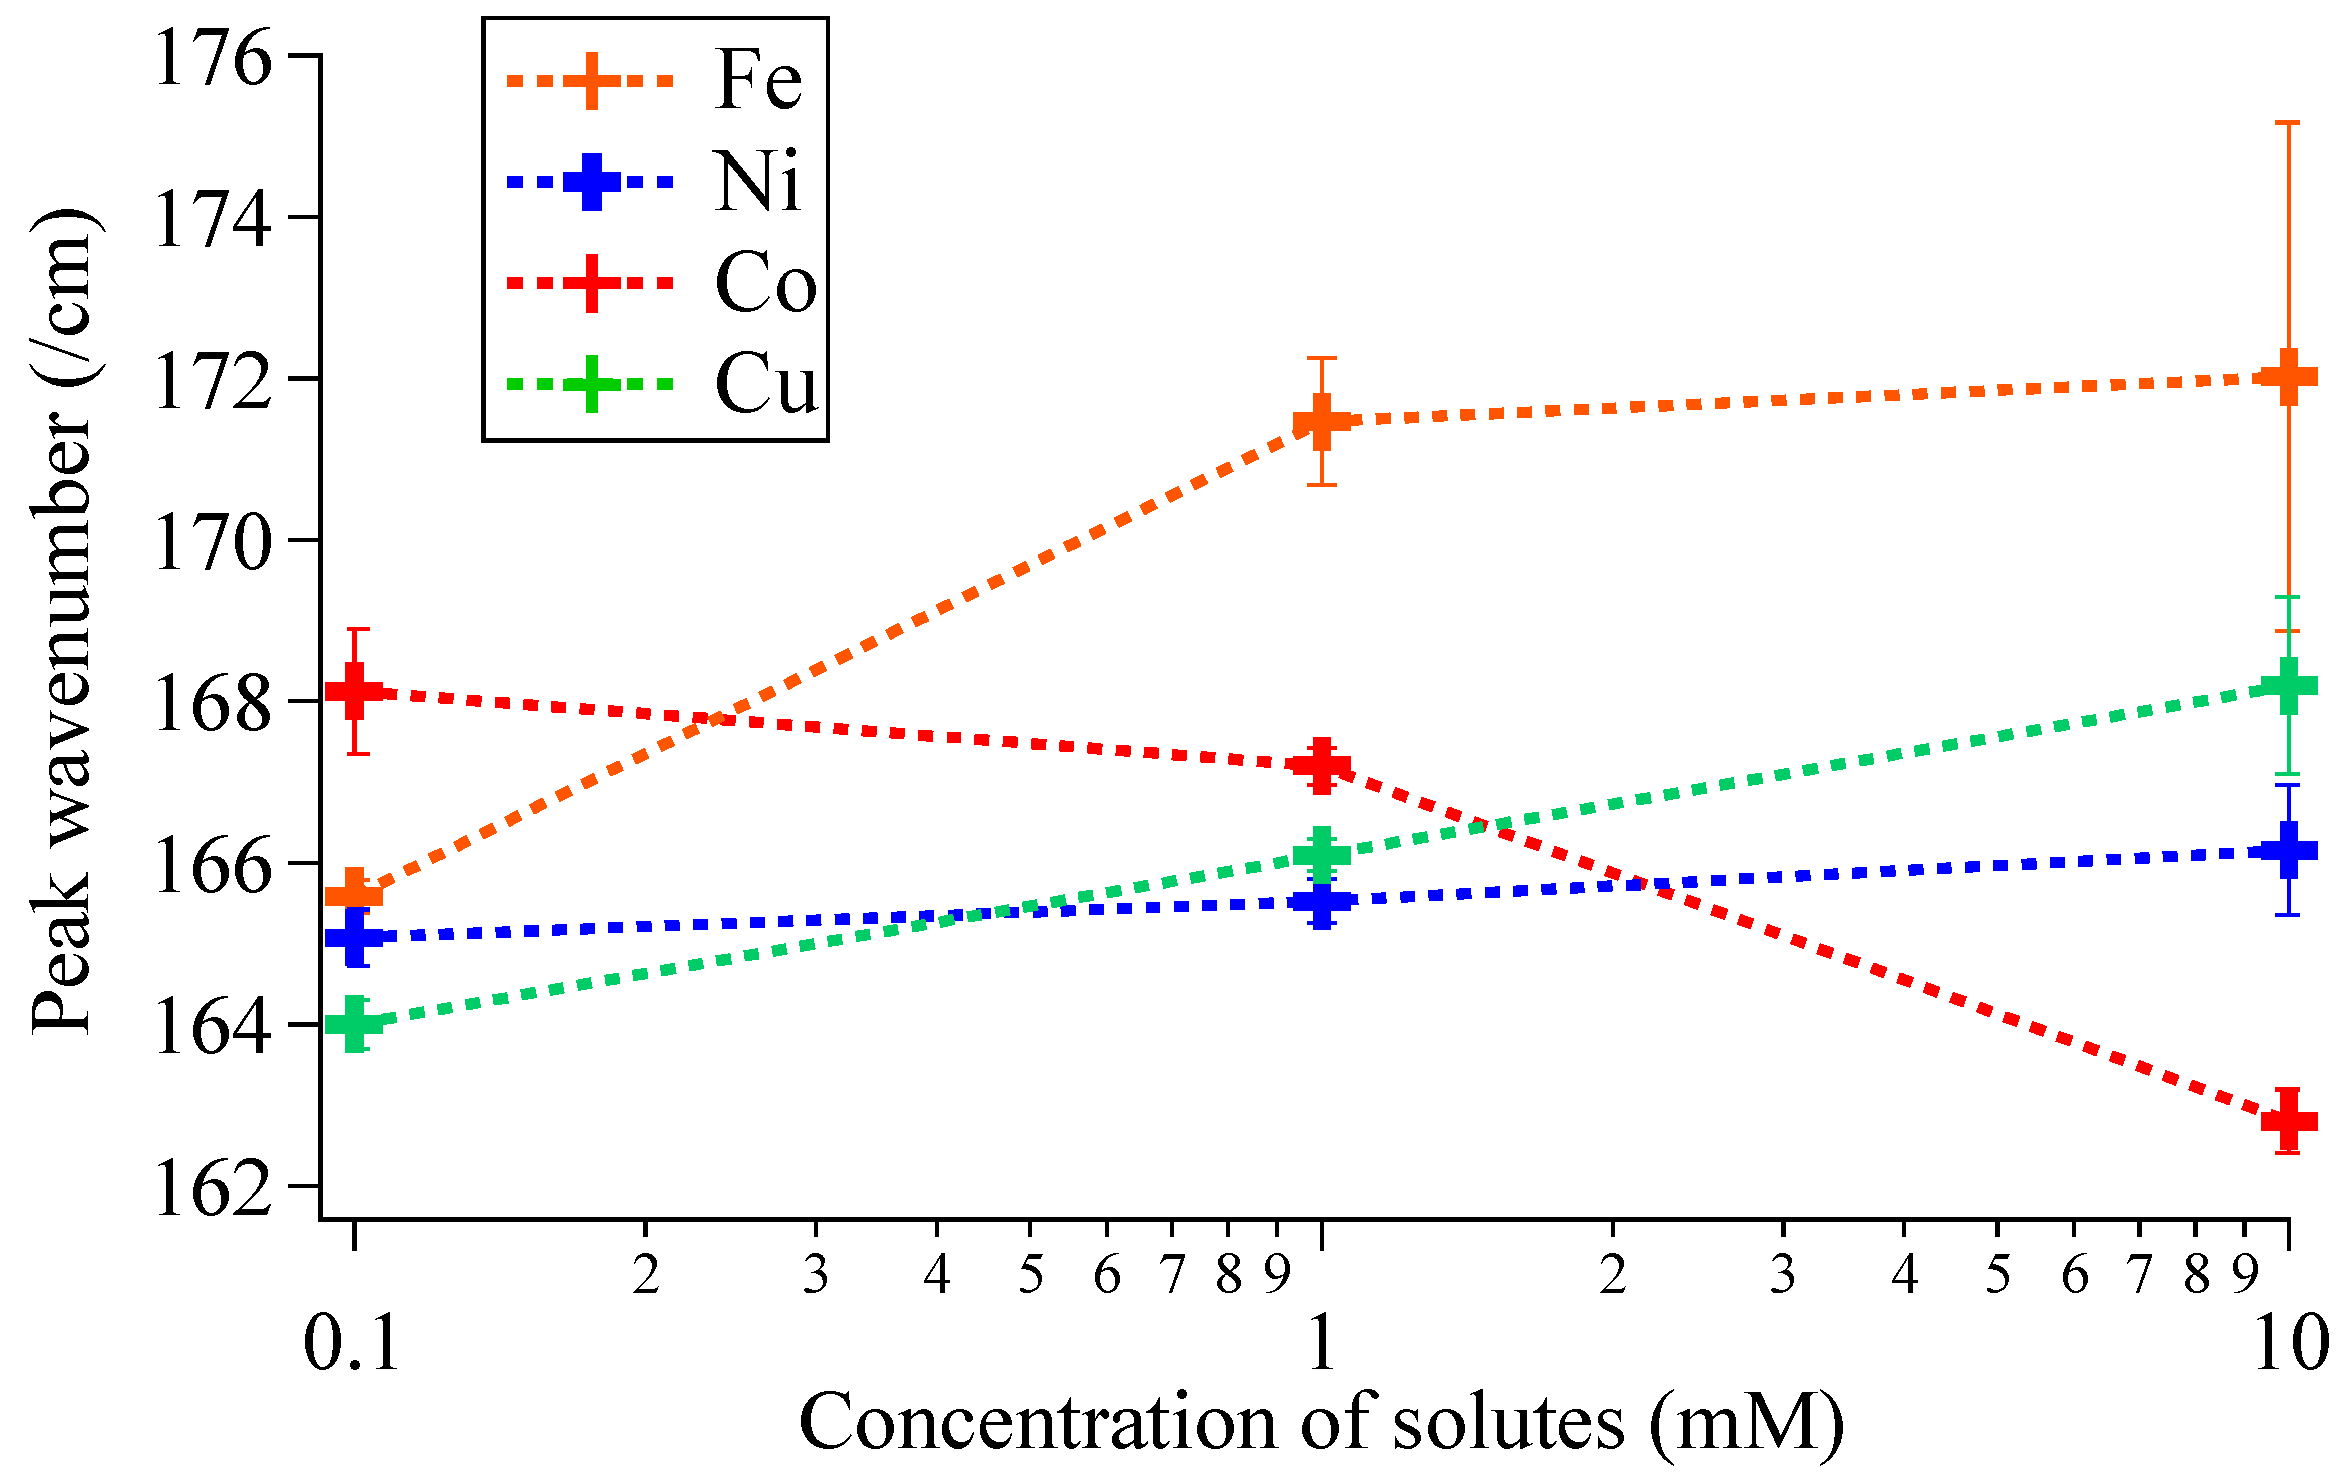
Figure 5 shows the molar concentration dependence of the peak wavenumber of the Eg Raman mode as the molar concentration of metal ions increased up to 10 mM. Doping Fe and Cu is seen in Figure 5 to cause a blue shift in the peak wavenumber, whereas a red shift is observed in Co. Ni doping showed almost no shifting. The blue shift in the Eg vibrational mode was probably caused by the substitution of smaller Ti cations (0.605 Å) by larger Fe (3+: 0.645) or Cu (0.73 Å) cations [42]. As larger cations replace smaller 4+ ones in their position, anatase TiO2 crystal is expected to be subject to compressive stress. Conversely, cobalt is expected to expand the titanium dioxide crystal lattice upon uptake, bringing it closer to the anatase TiO2 peak (144 cm−1).

3.2. Doping Levels and Optical Properties

To examine the actual concentration of the added elements, elemental analysis by EDS was carried out. Elemental mappings shown in Figure S2 confirmed that one of the dopant ions Cu was uniformly distributed in particles. Figure 6 shows the correlation between the molar concentration and the atomic concentration of the products. The concentration of doping atoms is seen to increase with a higher molar concentration. In our experiments, 4 at% and 0.5 at% could be doped for Fe and Cu, respectively, by increasing the concentration of salts up to 10 mM. On the other hand, in the case of Ni and Co, only a few atomic percents was found to be doped regardless of the increase in the molar concentration. Thus, the EDS results suggest that Fe, Cu, Ni or Co are more likely to be added in that order. Here, doping efficiency is probably governed by ionic radius and chemical compatibility. We have assumed that smaller ions cause less strain on the crystal lattice when they replace larger ions, leading to more stable doped structures [43]. Among all the ions now considered (Fe3⁺, Cu2⁺, Ni2⁺ and Co2⁺), Fe3⁺ exhibits a relatively small ionic radius (0.645 Å), which is probably the reason why iron ions are subject to incorporation into the TiO2 crystal lattice [42]. However, it was observed that Cu (0.73 Å) is by far the more easily added compared to Co (0.74 Å), despite a similar ionic radius. We expect that the ionic stability during chemical synthesis should also affect the doping efficiency. The pH of the solution was observed to range from 2 to 3.5, where copper tends to exist as Cu2⁺ in such highly acidic conditions. Cu2⁺ could be incorporated into the TiO₂ lattice more efficiently than Co2+ or Ni2+ because of its higher solubility and lesser tendency to precipitate as hydroxides in acidic environments. Co and Ni tend to form insoluble hydroxides, which reduces their availability for doping. Additionally, the larger ionic radii of Ni2⁺ (0.69 Å) and Co2⁺ (0.74 Å) compared to Fe3⁺ (0.645 Å) could cause more lattice strain, further reducing their doping efficiency.
The Kubelka–Munk (K–M) plots shown in Figure S3 clearly show that the optical bandgaps are dependent on the dopant and its concentration. The absorption edge of products shifts from the UV range to longer wavelengths after doping with metal ions. This implies that such particles will absorb visible light more efficiently, which is beneficial for the efficient use of solar light for photocatalysis. The results presented here lead us to conclude that LPD synthesis allows the preparation of TiO2 photocatalysts doped with 3d metal ions (Fe, Co, Ni, Cu) and the control of their doping concentration as well as band gaps, which can be demonstrated by a simple approach at a synthesis temperature of ~70 °C.
We determined the bandgap of the material by extrapolating the linear part of [F(R)*hν]1/2 to zero when plotted against E(eV), as shown in Figure S3. Figure 7 represents the relationship between optical bandgaps and concentration of metal salts applied in a synthetic solution. The bandgap of undoped TiO2 powders corresponded to 3.30 eV, which was slightly larger than that of bulk TiO2 with an anatase phase (3.2 eV) probably due to small crystallite size (<50 nm) [44,45,46,47]. In the case of Fe and Cu, the bandgaps are found in Figure 7 to decrease from 3.2 eV to 2.4–2.9 eV, respectively, due to the incorporation of metal ions into the crystal. As observed in the Raman spectra, TiO2 crystals are subjected to compressive stress, and the formation of inter-gap states due to oxygen defects and metallic impurities is expected. At higher levels of doping (more than 1 mM), gap states were found to form between the VBM and CBM, which was evident as the presence of an absorption tail. Thus, it is shown that our approach could realize 3d metal-doped TiO2 photocatalysts at a low temperature of 70 °C and under ambient pressure, and could provide a narrowing of the band gap and visible light responsivity (down to 520 nm at the shortest wavelength). The comparison of reaction temperatures, pressures, dopants and bandgaps with other published materials is shown in Table 2.

3.3. Photocatalytic Reduction of Methane

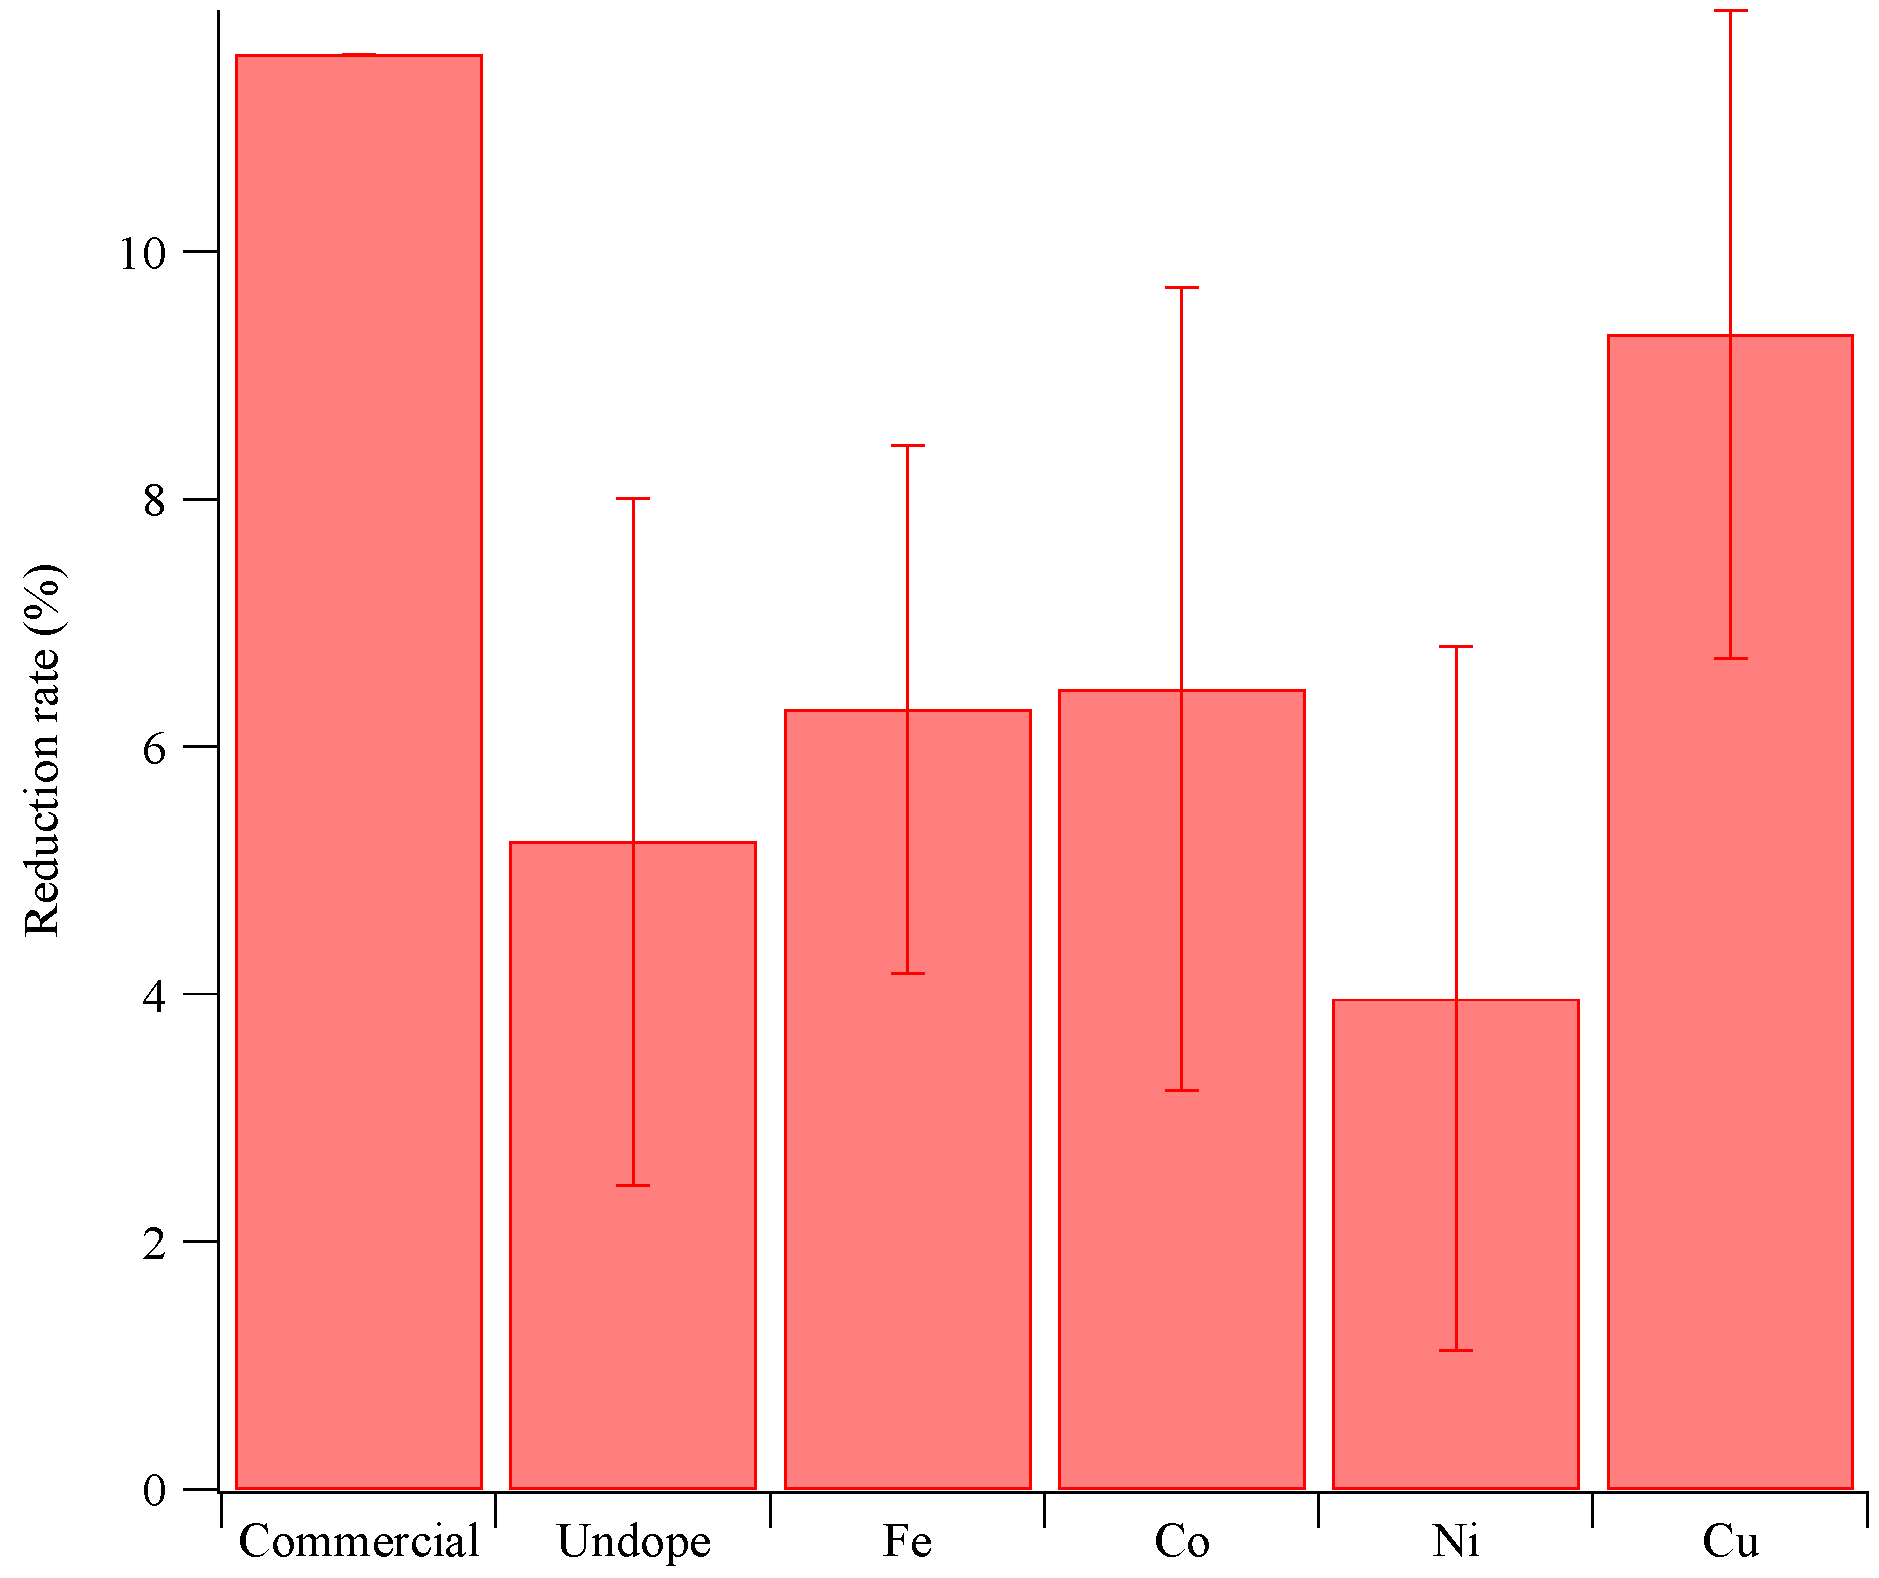
Figure 8 compares the methane-degrading photocatalytic activity of undoped and doped TiO2 samples. As control experiments, we tested two types of undoped TiO2 samples, one of which is prepared by LPD, and another is the commercially available anatase TiO2 (KMEW Co., Ltd., Chuo-ku, Osaka, Japan). The methane reduction rate of undoped and doped TiO2 was obtained by making an average of three experimental values. The error bars indicate standard errors. The data for the commercial sample correspond to the representative values. The standard error in the case of blanks with light illumination was measured at 1.2%, and such errors are present in all cases. The doping samples used in photocatalytic experiments are products prepared at 0.1 mM of metal nitrate solution, as higher activity can be expected based on the previous study. As seen in Figure 8, UV light irradiation is seen to induce photocatalytic degradation of methane molecules in all samples, while Cu-doped TiO2 demonstrated higher activity. The degradation rate with the other metals (Fe, Co, Ni) is seen to be comparable to undoped TiO2. As discussed in the SEM observation section, the shape and size of the product depended on the metal nitrate solutes added, which dictated the surface area and the further resulting photocatalytic activity. Therefore, the surface area was measured using BET measurements.
Table 3 shows the surface area of each particle. The undoped sample (LPD method, commercial product) exhibited a larger surface area compared to that of the doped samples as a result of the contribution of the smaller particle size. Among doping samples, Cu-doped TiO2 is seen to represent the largest surface area (182.61 m2/g), followed by nickel, cobalt, and iron in that order. It should be noted that Cu-doped TiO2 exhibited a high surface area despite particle sizes similar to those in the nickel- and cobalt-doped samples. This can be attributed to the highly crystalline and sharply pointed protruding structures on the surface (see Figure 2). To eliminate the influence of the surface area on the photocatalytic activity, the reaction rates per unit area were calculated.
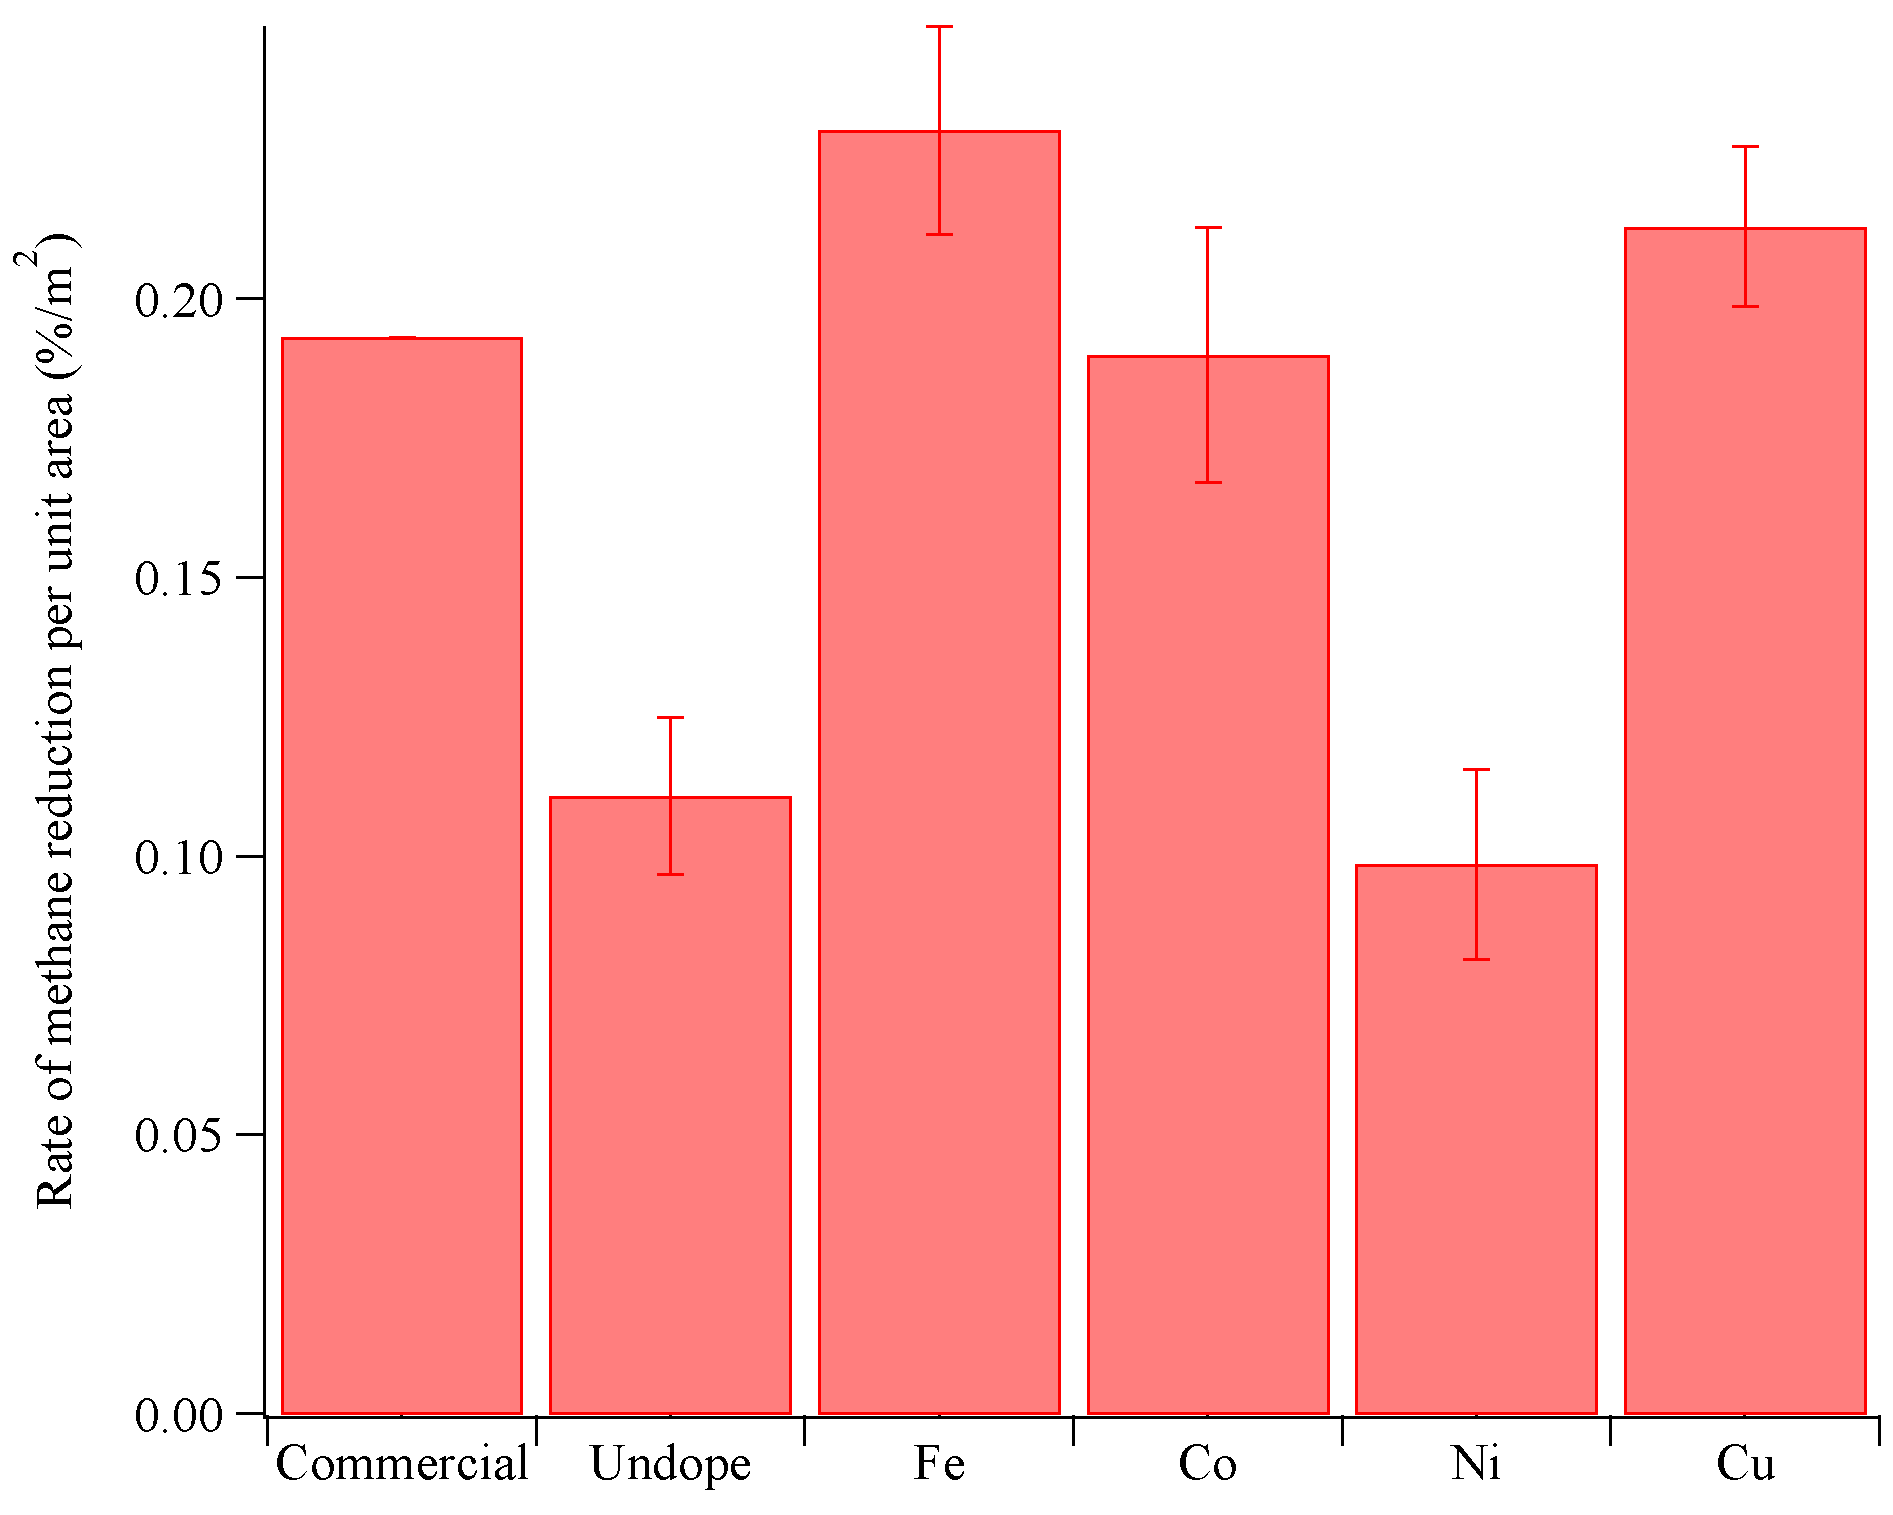
The activity of methane decomposition per unit area is shown in Figure 9. The photocatalytic activity of TiO2 was found to improve after doping iron, copper, and cobalt, while almost similar activity was obtained with nickel compared to the undoped sample. In general, there are at least four parameters to be considered as playing crucial roles in photocatalytic activity, those being (i) light absorption, (ii) surface area, (iii) crystallinity and (iv) surface chemistry [54,55]. Among them, in this case, we can ignore the influence of surface area on photocatalytic activity. The light absorption efficiency at 360 nm, the wavelength of the light source used to initiate the photocatalytic reaction, differs between the samples (See Figure S4). The efficiency was observed to be high in Cu, Fe, undoped, Co and Ni in that order. Therefore, in this study, higher absorption efficiency due to doping is considered as one of the key factors affecting photocatalytic activity. The crystallinity of the products was already mentioned in the Raman spectroscopic results. TiO2 particles with higher crystallinity are well known to exhibit higher activity due to fewer defects that cause energy loss. Photoexcited electrons efficiently migrate to the surface of TiO2, which could provide higher photocatalytic activity. Highly crystallized TiO2 was observed when Cu nitrate was applied at a concentration of 0.1 mM, which should be one of the reasons why the photocatalytic activity was observed to improve.

3.4. Influence of Surface Chemistry on Photocatalysis

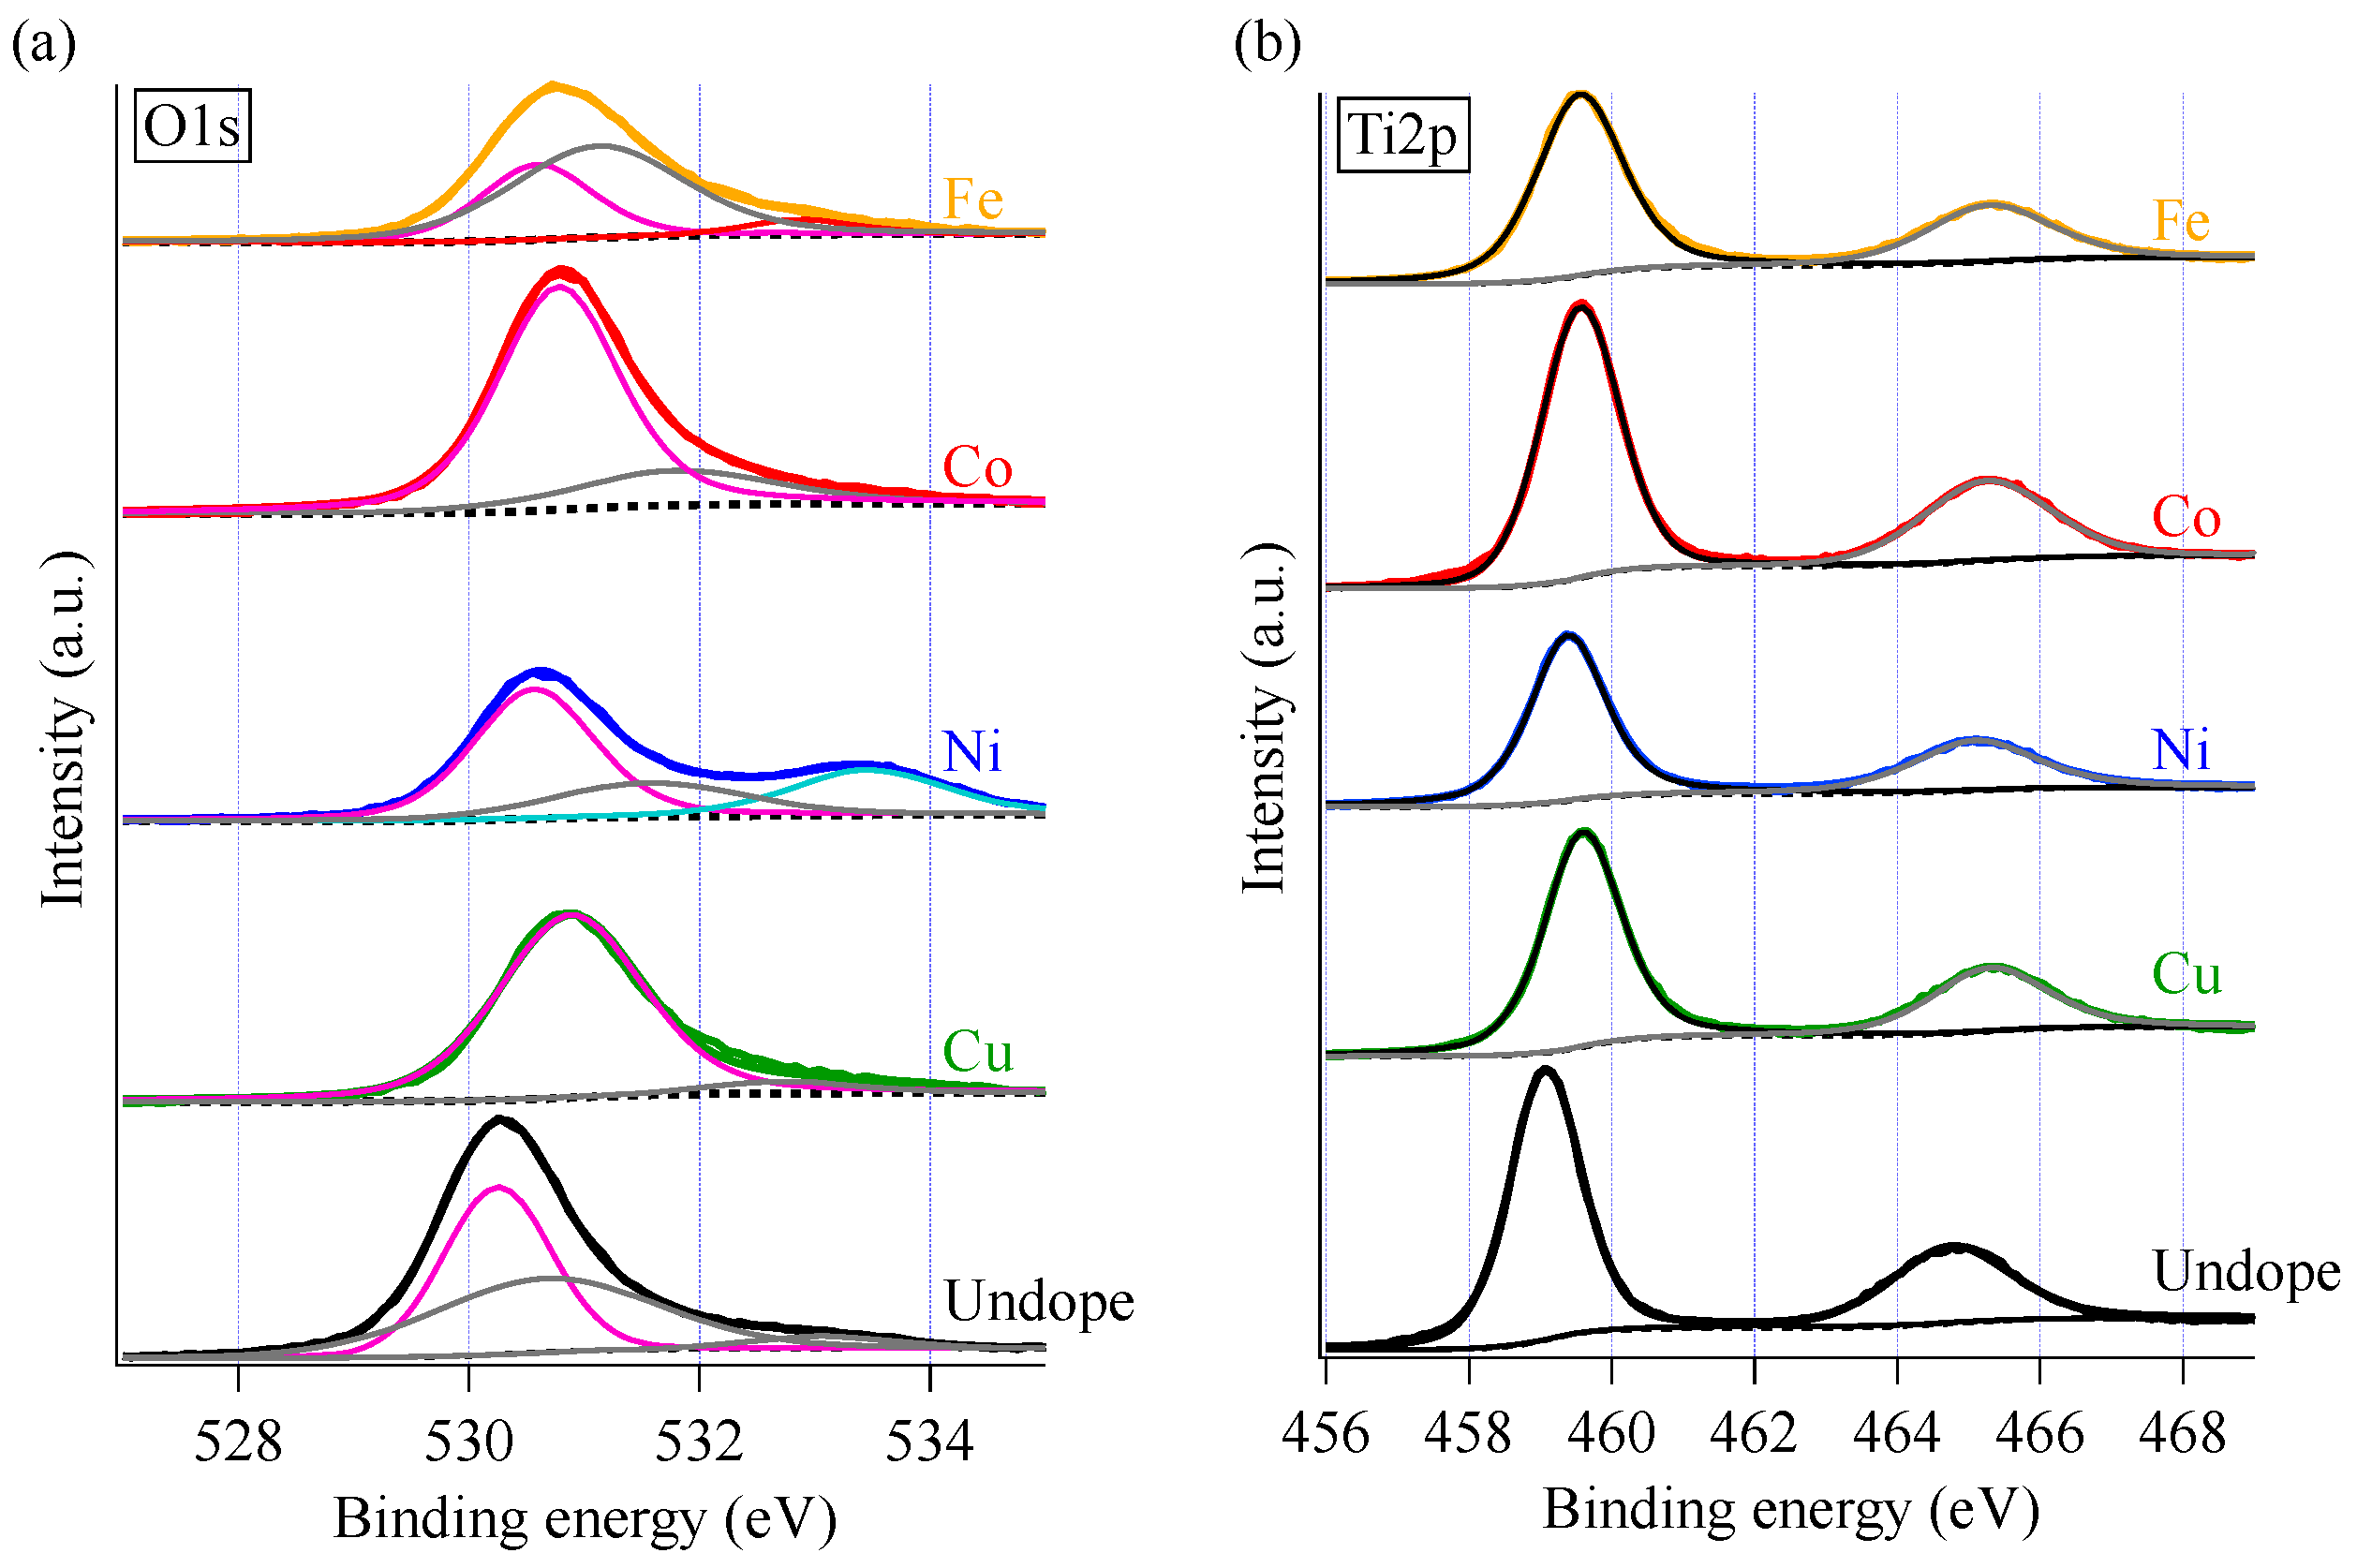
The surface chemistry of the products prepared with 0.1 mM solutes was investigated by XPS analysis, which is shown in Figure 10 and Figure 11. O 1s and Ti 2p are shown in Figure 10a,b; carbon and fluorine are shown in the Supplementary Information, Figure S5. We fitted the XPS data to highlight the atomic concentration at the surface, summarized in Table S1. The fitted curves are presented as dotted curves in Figure 10 and Figure 11. In the C1s narrow scan (see Figure S4), the strongest peak of the C-C main peak was observed and fixed at 284.6 eV for all samples. In O1s, a main peak attributed to metal oxides (MOs) was observed in the range 530 eV to 531 eV [56]. The shift in the binding energy of MO could be attributed to the fact that the oxygen atoms have also formed bonds with doping metal elements other than titanium. In the case of doping nickel, a peak is seen to be situated at 533.5 eV, which can be assigned to nitrates. In the Ti2p spectra (see Figure 10b), we attributed the two strong symmetric peaks at around 464.1 and 458.4 eV to Ti 2p1/2 and Ti 2p3/2, respectively. The peak separation of 5.7 eV shown in the Ti 2p doublet is in good agreement with the energy reported for TiO2 nanoparticles with an anatase phase [57]. These peaks were 1.1 eV lower than those of the anatase TiO2, which is generally caused by the presence of a higher anionic vacancy. The peak of the Ti 2p3/2 spectrum was located between Ti4+ (459.2 eV) and Ti3+ (457.5 eV) [58]; however, we could not obtain a good fit with two components of Ti4+ and Ti3+, potentially due to the complex defect states of metal ions and oxygen vacancies. Furthermore, the Ti 2p doublet peaks are observed to fluctuate depending on the doping elements, indicating the incorporation of 3d metal ions into the TiO2 crystal.
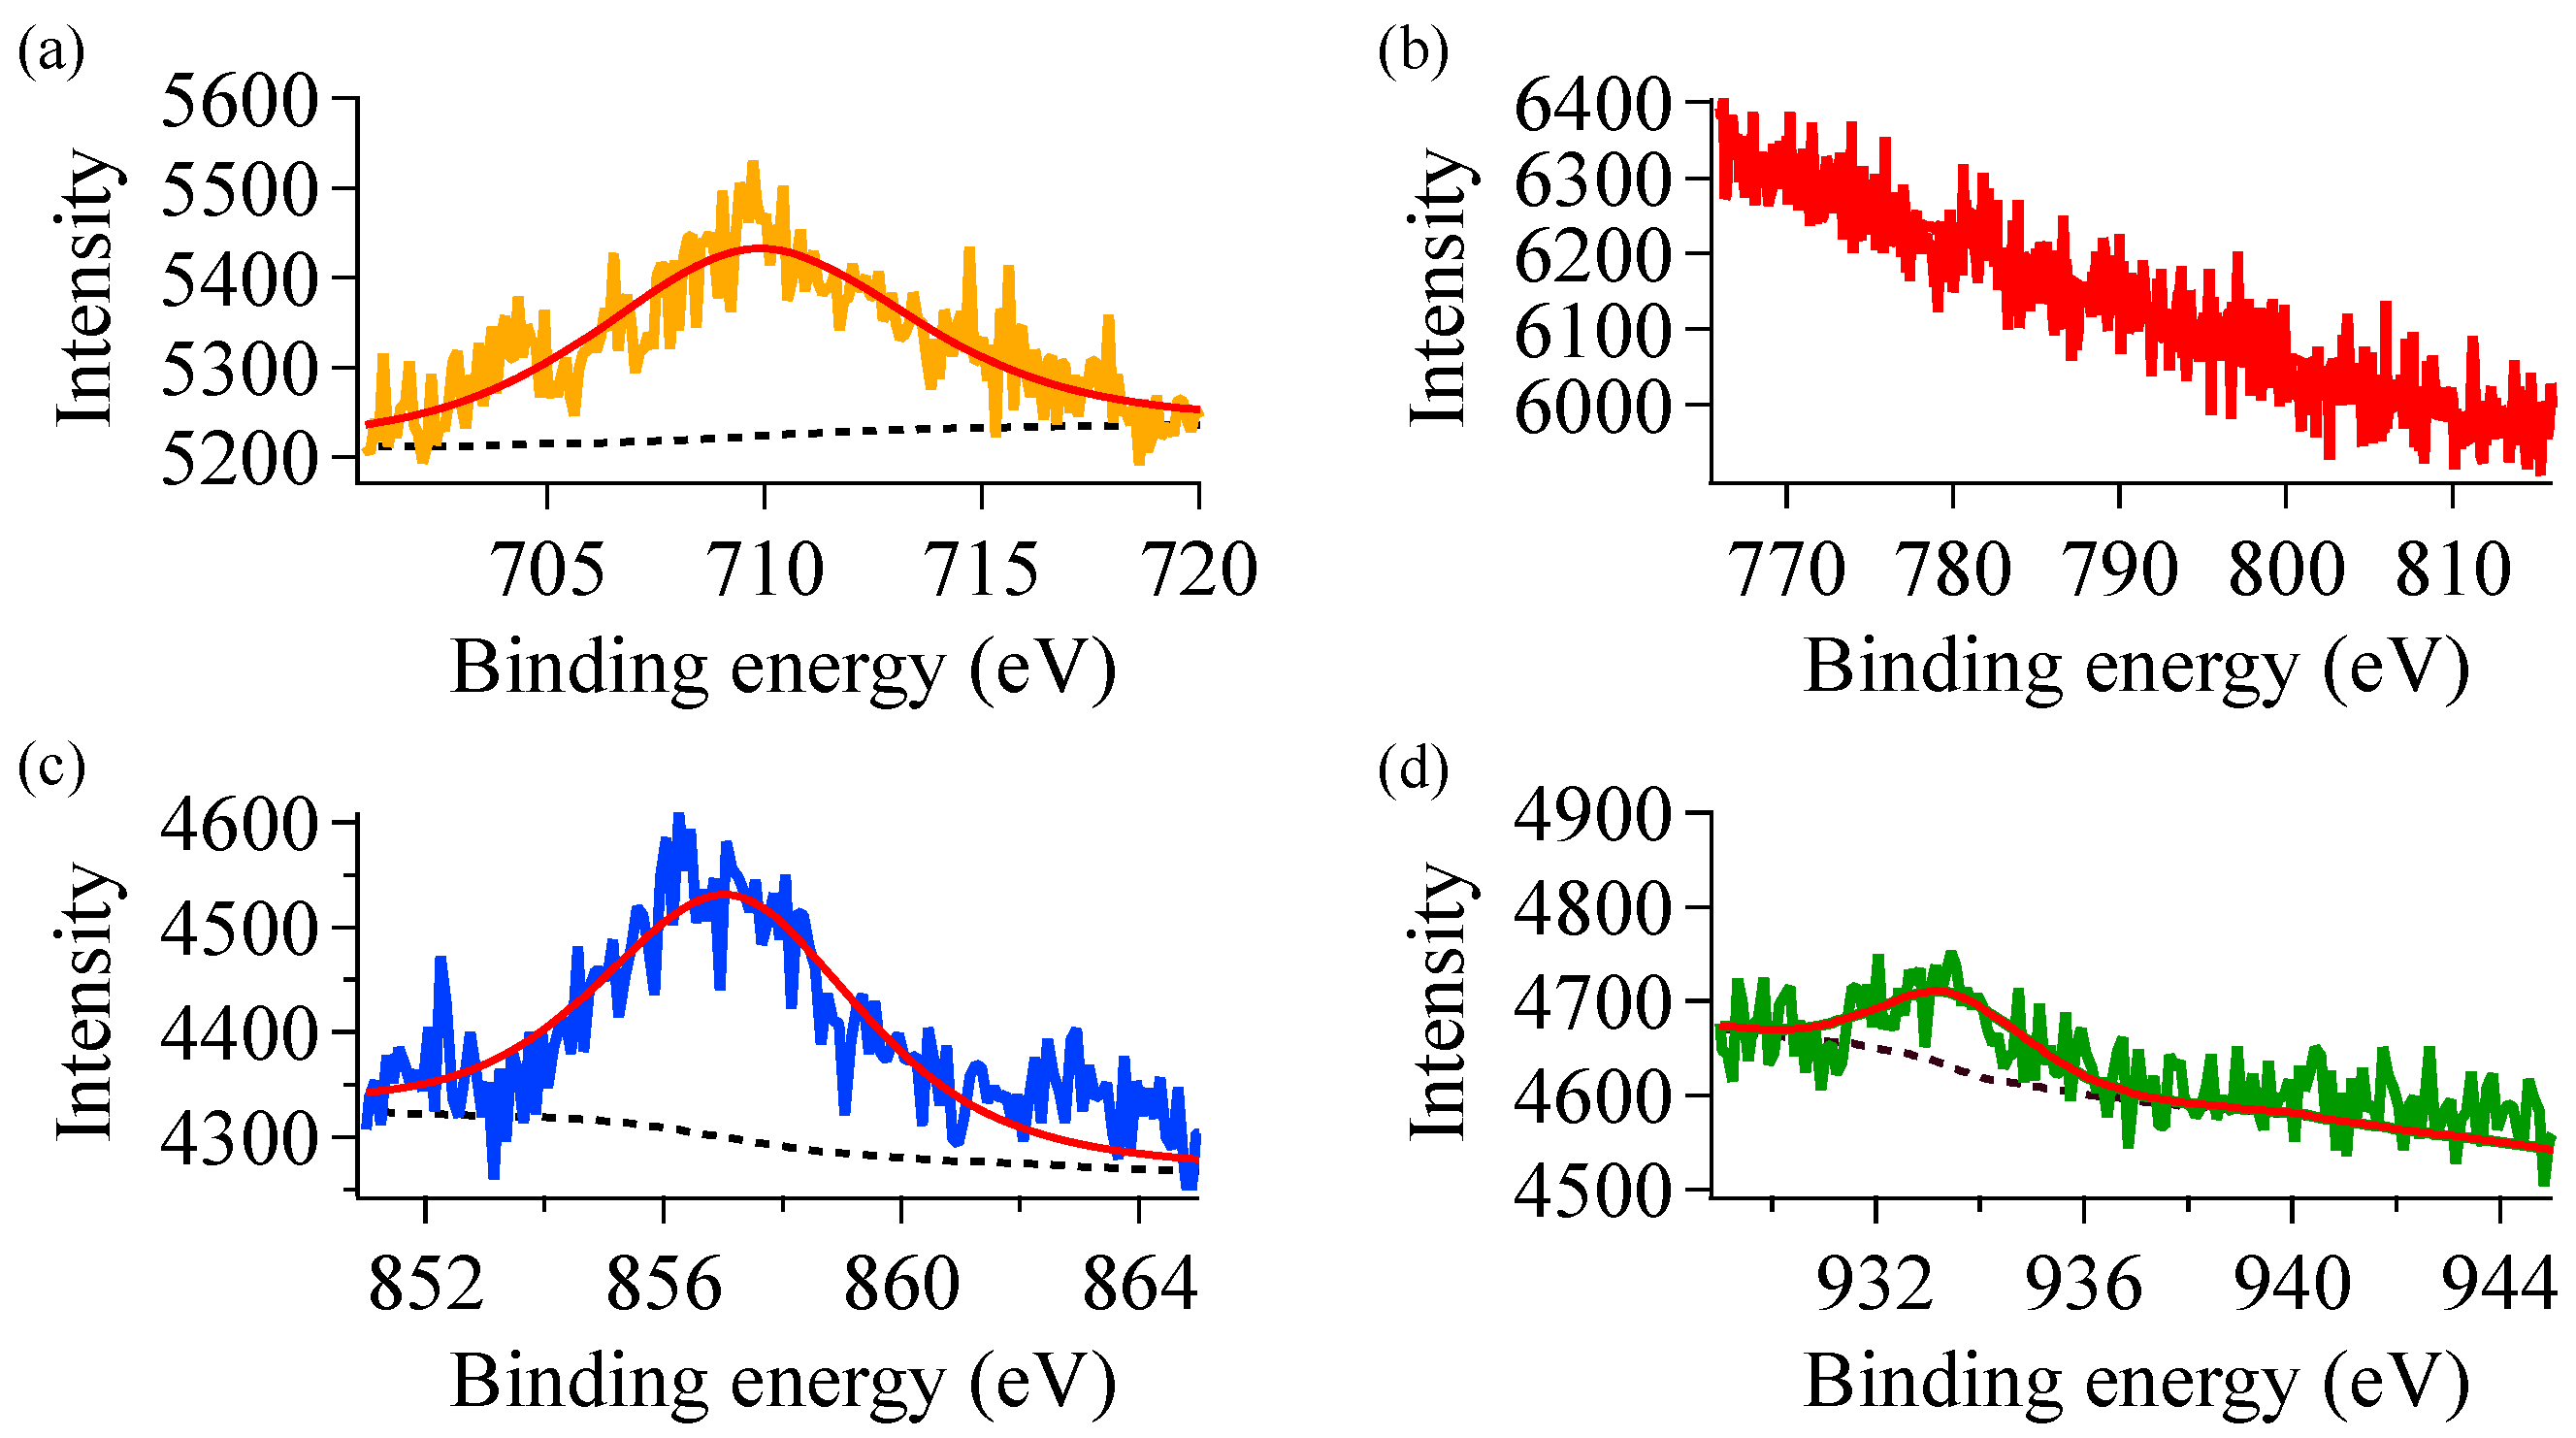
Figure 11 presents the result of XPS analysis for added metals. Panels (a–d) correspond to Fe, Co, Ni and Cu, respectively. Figure 11b confirms that Co was not detected on the product surface. In Figure 11c, the peak at 857.2 eV is assigned to Ni nitrate (Ni(NO3)2), which agrees with the presence of a peak at 533.5 eV in O1s (see Figure 10a) [59]. The adsorption remaining on the product surface could diminish the photocatalytic activity of Ni-doped TiO2 due to fewer active sites. The Fe 2p spectrum on deconvolution is seen in Figure 11a to exhibit a peak broadly at 709–711 eV, which we attributed to bivalent iron (Fe2+) and trivalent iron (Fe3+) [60]. The narrow scan of Cu 2p shows peaks located at 932.4 eV and 931.7 eV, which we attributed to the Cu2+ and Cu+ states, respectively. In the case of Fe and Cu, the absence of satellite peaks at 719.4 eV and 942.6 eV suggested that the metal cation was doped in the TiO2 anatase network and did not form a surface oxide layer [60,61]. The doped Fe and Cu that exist in the oxidation state of Fe2+ and Cu+ resulted in the formation of single oxygen vacancies. However, we did not observe the signal corresponding to Ti3+ sites in the Ti 2p region, possibly because the metal dopant present in the TiO2 lattice as either Fe2+/Fe3+ or Cu2+/Cu+ had lower valency and higher electronegativity compared to those of Ti4+. To conserve the charge in the lattice as a result of the incorporation of aliovalent metal ions into the anatase TiO2 matrix, ionic vacancies (O vacancies) in several sites may have formed at several sites. Based on the above discussion, we speculate that the surface of the Fe-doped TiO2 activated methane effectively due to electrostatic polarization of a C-H bond. Li et al. reported the photo-activation of methane C-H bond over binary active species, that is, the extra framework metal cations and the Ti-OH groups titanate wires, which interact with methane in a synergetic manner under UV irradiation [62]. The adsorbed CH4 molecules are polarized upon interacting with individual metal cations (Fe2+/Fe3+ in our case) and O atoms (Mn+···H3Cσ−-Hσ+···Oσ−) because of the relatively high local electric field constructed [63]. Accordingly, the polarized C-H bond is significantly weakened, which promotes the abstraction of the H atom from CH4 by OH radicals. Thus, LPD-based metal doping can not only narrow band gaps to increase light absorption, but also introduce active catalytic sites on TiO2 to facilitate methane activation and reduction. Enhanced activity is also considered to be driven by reduced charge carrier recombination in doped TiO2 materials. This arises as the result of photogenerated electrons facilitating the reduction of cations (e.g., Cu2+ + e → Cu+), thus extending the valence band hole lifetimes at the surface, which could react with adsorbed species to form active radicals. In our case, the results of XPS analysis confirmed the presence of positively charged cations as discussed above. On the other hand, the Raman study and XRD analysis confirmed the absence of oxide species in dopants. These results do not necessarily preclude the existence of amorphous or fine secondary oxide precipitates, which may improve exciton lifetime through electron capture in the secondary phase or enhance activity through an increased surface area. The contribution of the mechanism discussed above was dominant in doping Fe and Cu with less doping levels (<1 at%).

4. Conclusions

Low-temperature synthesis of TiO2 photocatalysts doped with 3d metals such as Fe, Co, Ni and Cu was demonstrated in a controllable manner. Metal nitrate salts with different concentrations were applied to the synthetic solution, which was maintained at 70 °C for 3 h to produce particles. It was found that both undoped and doped particles were anatase TiO2, whereas crystal lattice vibrations are modulated due to the formation of impurity/defect sites and crystallite edges after doping. As a case study, here we showed that TiO2 photocatalyst doped with Fe cations could be efficiently doped, with the doping level achieved being on the order of a few (up to 4) at%, in which the optical sensitivity could be extended down to the visible-light region (up to 2.4 eV). The photocatalytic decomposition of methane was observed on both undoped and doped TiO2, while doping Fe and Cu with lower doping levels (<1 at%) produced considerable activity in terms of methane reduction, as confirmed by photocatalytic activity quite comparable or higher compared to that of undoped TiO2. This approach is potentially applicable for synthesizing visible light photocatalysts onto a technologically important substrate with a low melting point, such as glass substrates, plastics, and polymers.

Supplementary Materials

The following supporting information can be downloaded at: https://www.mdpi.com/article/10.3390/suschem6010001/s1, Figure S1 XRD patterns of undoped (black) and doped TiO2 (colors). Orange, blue, red and green colors indicate Fe, Ni, Co and Cu doping, respectively; Figure S2 Elemental mapping of Cu-doped TiO2 produced with 10 mM; Figure S3 Kubelka-Munk plots for undoped and doped TiO2. Colors are assigned to spectra of the samples in the same manner as those in Figure S1; Figure S4 Reflectance spectra of undoped (black) and doped products (colors). Colors are assigned to spectra of the samples in the same manner as those in Figure S1; Figure S5 Narrow scans for undoped TiO2 and doped products prepared with 0.1 mM. Colors are assigned to spectra of the samples in the same manner as those in Figure S1. Table S1 Atomic concentration of elements via XPS analysis.

Author Contributions

Conceptualization, M.H.; methodology, M.H.; validation, M.H., Y.Y. and N.O.; formal analysis, M.H., Y.Y. and N.O.; investigation, M.H.; data curation, M.H.; writing—original draft preparation, M.H.; writing—review and editing, M.H. and Y.I.; visualization, M.H.; supervision, Y.I.; project administration, M.H. and N.O.; funding acquisition, M.H. All authors have read and agreed to the published version of the manuscript.

Funding

This study was funded by The Hibi Science Foundation.

Institutional Review Board Statement

Not applicable.

Informed Consent Statement

Not applicable.

Data Availability Statement

The original contributions presented in this study are included in the article/Supplementary Material. Further inquiries can be directed to the corresponding author.

Acknowledgments

The authors are grateful to The Hibi Science Foundation. SEM and EDS analysis were supported by the Equipment Sharing Division, Organization for Co-Creation Research and Social Contributions, Nagoya Institute of Technology. This work was supported by “Advanced Research Infrastructure for Materials and Nanotechnology in Japan (ARIM)” of the Ministry of Education, Culture, Sports, Science and Technology (MEXT) (Proposal Number 23NI1302).

Conflicts of Interest

Author Mr. Nobuchika Okayama was employed by KMEW Co., Ltd. The remaining authors declare that the research was conducted in the absence of any commercial or financial relationships that could be construed as a potential conflict of interest.

References

  1. Fujishima, A.; Honda, K. Electrochemical Photolysis of Water at a Semiconductor Electrode. Nature 1972, 238, 37–38. [Google Scholar] [CrossRef] [PubMed]
  2. Fujishima, A.; Zhang, X.; Tryk, D.A. TiO2 Photocatalysis and Related Surface Phenomena. Surf. Sci. Rep. 2008, 63, 515–582. [Google Scholar] [CrossRef]
  3. Takanabe, K. Photocatalytic Water Splitting: Quantitative Approaches toward Photocatalyst by Design. ACS Catal. 2017, 7, 8006–8022. [Google Scholar] [CrossRef]
  4. Carcel, R.A.; Andronic, L.; Duta, A. Photocatalytic Activity and Stability of TiO2 and WO3 Thin Films. Mater. Charact. 2012, 70, 68–73. [Google Scholar] [CrossRef]
  5. Dhakshinamoorthy, A.; Navalon, S.; Corma, A.; Garcia, H. Photocatalytic CO2 Reduction by TiO2 and Related Titanium Containing Solids. Energy Environ. Sci. 2012, 5, 9217. [Google Scholar] [CrossRef]
  6. Mino, L.; Negri, C.; Santalucia, R.; Cerrato, G.; Spoto, G.; Martra, G. Morphology, Surface Structure and Water Adsorption Properties of TiO2 Nanoparticles: A Comparison of Different Commercial Samples. Molecules 2020, 25, 4605. [Google Scholar] [CrossRef]
  7. Lonnen, J.; Kilvington, S.; Kehoe, S.C.; Al-Touati, F.; McGuigan, K.G. Solar and Photocatalytic Disinfection of Protozoan, Fungal and Bacterial Microbes in Drinking Water. Water Res. 2005, 39, 877–883. [Google Scholar] [CrossRef]
  8. Herrmann, J.-M. Heterogeneous Photocatalysis: Fundamentals and Applications to the Removal of Various Types of Aqueous Pollutants. Catal. Today 1999, 53, 115–129. [Google Scholar] [CrossRef]
  9. Hager, S.; Bauer, R. Heterogeneous Photocatalytic Oxidation of Organics for Air Purification by near UV Irradiated Titanium Dioxide. Chemosphere 1999, 38, 1549–1559. [Google Scholar] [CrossRef]
  10. Ochiai, T.; Aoki, D.; Saito, H.; Akutsu, Y.; Nagata, M. Analysis of Adsorption and Decomposition of Odour and Tar Components in Tobacco Smoke on Non-Woven Fabric-Supported Photocatalysts. Catalysts 2020, 10, 304. [Google Scholar] [CrossRef]
  11. Takanabe, K.; Domen, K. Toward Visible Light Response: Overall Water Splitting Using Heterogeneous Photocatalysts. Green 2011, 1, 313. [Google Scholar] [CrossRef]
  12. Murakami, S.-Y.; Kominami, H.; Kera, Y.; Ikeda, S.; Noguchi, H.; Uosaki, K.; Ohtani, B. Evaluation of Electron-Hole Recombination Properties of Titanium (IV) Oxide Particles with High Photocatalytic Activity. Res. Chem. Intermed. 2007, 33, 285–296. [Google Scholar] [CrossRef]
  13. Khlyustova, A.; Sirotkin, N.; Kusova, T.; Kraev, A.; Titov, V.; Agafonov, A. Doped TiO2: The Effect of Doping Elements on Photocatalytic Activity. Mater. Adv. 2020, 1, 1193–1201. [Google Scholar] [CrossRef]
  14. Nur, A.S.M.; Sultana, M.; Mondal, A.; Islam, S.; Robel, F.N.; Islam, A.; Sumi, M.S.A. A Review on the Development of Elemental and Codoped TiO2 Photocatalysts for Enhanced Dye Degradation under UV–Vis Irradiation. J. Water Process Eng. 2022, 47, 102728. [Google Scholar] [CrossRef]
  15. Lu, C.-M.; Sharma, R.K.; Lin, P.-Y.; Huang, Y.-H.; Chen, J.-S.; Lee, W.-C.; Chen, C.-Y. Characteristics of Doped TiO2 Nanoparticle Photocatalysts Prepared by the Rotten Egg White. Materials 2022, 15, 4231. [Google Scholar] [CrossRef]
  16. Asahi, R.; Morikawa, T.; Ohwaki, T.; Aoki, K.; Taga, Y. Visible-Light Photocatalysis in Nitrogen-Doped Titanium Oxides. Science 2001, 293, 269–271. [Google Scholar] [CrossRef]
  17. Sirivallop, A.; Areerob, T.; Chiarakorn, S. Enhanced Visible Light Photocatalytic Activity of N and Ag Doped and Co-Doped TiO2 Synthesized by Using an In-Situ Solvothermal Method for Gas Phase Ammonia Removal. Catalysts 2020, 10, 251. [Google Scholar] [CrossRef]
  18. Yu, H.; Irie, H.; Hashimoto, K. Conduction Band Energy Level Control of Titanium Dioxide: Toward an Efficient Visible-Light-Sensitive Photocatalyst. J. Am. Chem. Soc. 2010, 132, 6898–6899. [Google Scholar] [CrossRef]
  19. Huang, F.; Yan, A.; Zhao, H. Influences of Doping on Photocatalytic Properties of TiO2 Photocatalyst. In Semiconductor Photocatalysis—Materials, Mechanisms and Applications; InTech: London, UK, 2016. [Google Scholar]
  20. Slamet; Nasution, H.W.; Purnama, E.; Kosela, S.; Gunlazuardi, J. Photocatalytic Reduction of CO2 on Copper-Doped Titania Catalysts Prepared by Improved-Impregnation Method. Catal. Commun. 2005, 6, 313–319. [Google Scholar] [CrossRef]
  21. Haque, M.M.; Khan, A.; Umar, K.; Mir, N.A.; Muneer, M.; Harada, T.; Matsumura, M. Synthesis, Characterization and Photocatalytic Activity of Visible Light Induced Ni-Doped TiO2. Energy Environ. Focus 2013, 2, 73–78. [Google Scholar] [CrossRef]
  22. Iwasaki, M.; Hara, M.; Kawada, H.; Tada, H.; Ito, S. Cobalt Ion-Doped TiO2 Photocatalyst Response to Visible Light. J. Colloid Interface Sci. 2000, 224, 202–204. [Google Scholar] [CrossRef] [PubMed]
  23. Yalçın, Y.; Kılıç, M.; Çınar, Z. Fe+3-Doped TiO2: A Combined Experimental and Computational Approach to the Evaluation of Visible Light Activity. Appl. Catal. B 2010, 99, 469–477. [Google Scholar] [CrossRef]
  24. Karunakaran, C.; Abiramasundari, G.; Gomathisankar, P.; Manikandan, G.; Anandi, V. Cu-Doped TiO2 Nanoparticles for Photocatalytic Disinfection of Bacteria under Visible Light. J. Colloid Interface Sci. 2010, 352, 68–74. [Google Scholar] [CrossRef] [PubMed]
  25. Alotaibi, A.M.; Williamson, B.A.D.; Sathasivam, S.; Kafizas, A.; Alqahtani, M.; Sotelo-Vazquez, C.; Buckeridge, J.; Wu, J.; Nair, S.P.; Scanlon, D.O.; et al. Enhanced Photocatalytic and Antibacterial Ability of Cu-Doped Anatase TiO2 Thin Films: Theory and Experiment. ACS Appl. Mater. Interfaces 2020, 12, 15348–15361. [Google Scholar] [CrossRef]
  26. Mathew, S.; Ganguly, P.; Rhatigan, S.; Kumaravel, V.; Byrne, C.; Hinder, S.J.; Bartlett, J.; Nolan, M.; Pillai, S.C. Cu-Doped TiO2: Visible Light Assisted Photocatalytic Antimicrobial Activity. Appl. Sci. 2018, 8, 2067. [Google Scholar] [CrossRef]
  27. Li, G.; Dimitrijevic, N.M.; Chen, L.; Rajh, T.; Gray, K.A. Role of Surface/Interfacial Cu2+ Sites in the Photocatalytic Activity of Coupled CuO−TiO2 Nanocomposites. J. Phys. Chem. C 2008, 112, 19040–19044. [Google Scholar] [CrossRef]
  28. Wu, M.-C.; Wu, P.-Y.; Lin, T.-H.; Lin, T.-F. Photocatalytic Performance of Cu-Doped TiO2 Nanofibers Treated by the Hydrothermal Synthesis and Air-Thermal Treatment. Appl. Surf. Sci. 2018, 430, 390–398. [Google Scholar] [CrossRef]
  29. Colón, G.; Maicu, M.; Hidalgo, M.C.; Navío, J.A. Cu-Doped TiO2 Systems with Improved Photocatalytic Activity. Appl. Catal. B 2006, 67, 41–51. [Google Scholar] [CrossRef]
  30. Feng, S.-H.; Li, G.-H. Hydrothermal and Solvothermal Syntheses. In Modern Inorganic Synthetic Chemistry; Elsevier: Amsterdam, The Netherlands, 2017; pp. 73–104. [Google Scholar]
  31. Razali, M.H.; Ahmad-Fauzi, M.N.; Mohamed, A.R.; Sreekantan, S. Hydrothermal Synthesis and Characterisation of Cu Doped TiO2 Nanotubes for Photocatalytic Degradation of Methyl Orange. Adv. Mater. Res. 2014, 911, 126–130. [Google Scholar] [CrossRef]
  32. Deki, S.; Aoi, Y.; Yanagimoto, H.; Ishii, K.; Akamatsu, K.; Mizuhata, M.; Kajinami, A. Preparation and Characterization of Au-Dispersed TiO2 Thin Films by a Liquid-Phase Deposition Method. J. Mater. Chem. 1996, 6, 1879. [Google Scholar] [CrossRef]
  33. Maki, H.; Okumura, Y.; Ikuta, H.; Mizuhata, M. Ionic Equilibria for Synthesis of TiO2 Thin Films by the Liquid-Phase Deposition. J. Phys. Chem. C 2014, 118, 11964–11974. [Google Scholar] [CrossRef]
  34. Herbig, B.; Löbmann, P. TiO2 Photocatalysts Deposited on Fiber Substrates by Liquid Phase Deposition. J. Photochem. Photobiol. A Chem. 2004, 163, 359–365. [Google Scholar] [CrossRef]
  35. Yu, H.; Lee, S.C.; Yu, J.; Ao, C.H. Photocatalytic Activity of Dispersed TiO2 Particles Deposited on Glass Fibers. J. Mol. Catal. A Chem. 2006, 246, 206–211. [Google Scholar] [CrossRef]
  36. Listiani, P.; Sanusi; Honda, M.; Oya, H.; Horio, Y.; Ichikawa, Y. Optimization of Hydrolysis Temperature in Liquid Phase Deposition for TiO2 Photocatalysis. Jpn. J. Appl. Phys. 2022, 61, 075508. [Google Scholar] [CrossRef]
  37. Honda, M.; Ochiai, T.; Listiani, P.; Yamaguchi, Y.; Ichikawa, Y. Low-Temperature Synthesis of Cu-Doped Anatase TiO2 Nanostructures via Liquid Phase Deposition Method for Enhanced Photocatalysis. Materials 2023, 16, 639. [Google Scholar] [CrossRef] [PubMed]
  38. Li, H.; Liu, B.; Yin, S.; Sato, T.; Wang, Y. Visible Light-Driven Photocatalytic Activity of Oleic Acid-Coated TiO2 Nanoparticles Synthesized from Absolute Ethanol Solution. Nanoscale Res. Lett. 2015, 10, 415. [Google Scholar] [CrossRef]
  39. Louwerse, M.J.; Piccinini, M.; de Jong, K.P. Diffusion Mechanisms for Ions over Hydroxylated Surfaces: Cu on γ-Al2O3. J. Phys. Chem. C 2019, 123, 18502–18507. [Google Scholar] [CrossRef]
  40. Challagulla, S.; Tarafder, K.; Ganesan, R.; Roy, S. Structure Sensitive Photocatalytic Reduction of Nitroarenes over TiO2. Sci. Rep. 2017, 7, 8783. [Google Scholar] [CrossRef]
  41. Durante, O.; Di Giorgio, C.; Granata, V.; Neilson, J.; Fittipaldi, R.; Vecchione, A.; Carapella, G.; Chiadini, F.; DeSalvo, R.; Dinelli, F.; et al. Emergence and Evolution of Crystallization in TiO2 Thin Films: A Structural and Morphological Study. Nanomaterials 2021, 11, 1409. [Google Scholar] [CrossRef]
  42. Shannon, R.D. Revised Effective Ionic Radii and Systematic Studies of Interatomic Distances in Halides and Chalcogenides. Acta Crystallogr. Sect. A 1976, 32, 751–767. [Google Scholar] [CrossRef]
  43. Choi, J.; Park, H.; Hoffmann, M.R. Effects of Single Metal-Ion Doping on the Visible-Light Photoreactivity of TiO2. J. Phys. Chem. C 2010, 114, 783–792. [Google Scholar] [CrossRef]
  44. Scanlon, D.O.; Dunnill, C.W.; Buckeridge, J.; Shevlin, S.A.; Logsdail, A.J.; Woodley, S.M.; Catlow, C.R.A.; Powell, M.J.; Palgrave, R.G.; Parkin, I.P.; et al. Band Alignment of Rutile and Anatase TiO2. Nat. Mater. 2013, 12, 798–801. [Google Scholar] [CrossRef] [PubMed]
  45. Brus, L. Electronic Wave Functions in Semiconductor Clusters: Experiment and Theory. J. Phys. Chem. 1986, 90, 2555–2560. [Google Scholar] [CrossRef]
  46. Thompson, T.L.; Yates, J.T. TiO2-Based Photocatalysis: Surface Defects, Oxygen and Charge Transfer. Top. Catal. 2005, 35, 197–210. [Google Scholar] [CrossRef]
  47. Honda, M.; Saito, Y.; Kawata, S. Individual TiO2 Nanocrystals Probed by Resonant Rayleigh Scattering Spectroscopy. Appl. Phys. Express 2014, 7, 112402. [Google Scholar] [CrossRef]
  48. Kusumawardani, L.J.; Syahputri, Y. Study of Structural and Optical Properties of Fe(III)-Doped TiO2 Prepared by Sol-Gel Method. IOP Conf. Ser. Earth Environ. Sci. 2019, 299, 012066. [Google Scholar] [CrossRef]
  49. Vega, M.P.B.; Hinojosa-Reyes, M.; Hernández-Ramírez, A.; Mar, J.L.G.; Rodríguez-González, V.; Hinojosa-Reyes, L. Visible Light Photocatalytic Activity of Sol–Gel Ni-Doped TiO2 on p-Arsanilic Acid Degradation. J. Solgel Sci. Technol. 2018, 85, 723–731. [Google Scholar] [CrossRef]
  50. Boutlala, A.; Bourfaa, F.; Mahtili, M.; Bouaballou, A. Deposition of Co-Doped TiO2 Thin Films by Sol-Gel Method. IOP Conf. Ser. Mater. Sci. Eng. 2016, 108, 012048. [Google Scholar] [CrossRef]
  51. Wtulich, M.; Szkoda, M.; Gajowiec, G.; Gazda, M.; Jurak, K.; Sawczak, M.; Lisowska-Oleksiak, A. Hydrothermal Cobalt Doping of Titanium Dioxide Nanotubes towards Photoanode Activity Enhancement. Materials 2021, 14, 1507. [Google Scholar] [CrossRef]
  52. Nguyen, V.N.; Nguyen, N.K.T.; Nguyen, P.H. Hydrothermal Synthesis of Fe-Doped TiO2 Nanostructure Photocatalyst. Adv. Nat. Sci. Nanosci. Nanotechnol. 2011, 2, 035014. [Google Scholar] [CrossRef]
  53. Guan, B.; Yu, J.; Guo, S.; Yu, S.; Han, S. Porous Nickel Doped Titanium Dioxide Nanoparticles with Improved Visible Light Photocatalytic Activity. Nanoscale Adv. 2020, 2, 1352–1357. [Google Scholar] [CrossRef] [PubMed]
  54. Lin, C.-P.; Chen, H.; Nakaruk, A.; Koshy, P.; Sorrell, C.C. Effect of Annealing Temperature on the Photocatalytic Activity of TiO2 Thin Films. Energy Procedia 2013, 34, 627–636. [Google Scholar] [CrossRef]
  55. Li, D.; Song, H.; Meng, X.; Shen, T.; Sun, J.; Han, W.; Wang, X. Effects of Particle Size on the Structure and Photocatalytic Performance by Alkali-Treated TiO2. Nanomaterials 2020, 10, 546. [Google Scholar] [CrossRef]
  56. Erdem, B.; Hunsicker, R.A.; Simmons, G.W.; Sudol, E.D.; Dimonie, V.L.; El-Aasser, M.S. XPS and FTIR Surface Characterization of TiO2 Particles Used in Polymer Encapsulation. Langmuir 2001, 17, 2664–2669. [Google Scholar] [CrossRef]
  57. Zhu, L.; Lu, Q.; Lv, L.; Wang, Y.; Hu, Y.; Deng, Z.; Lou, Z.; Hou, Y.; Teng, F. Ligand-Free Rutile and Anatase TiO2 Nanocrystals as Electron Extraction Layers for High Performance Inverted Polymer Solar Cells. RSC Adv. 2017, 7, 20084–20092. [Google Scholar] [CrossRef]
  58. Jackman, M.J.; Thomas, A.G.; Muryn, C. Photoelectron Spectroscopy Study of Stoichiometric and Reduced Anatase TiO2 (101) Surfaces: The Effect of Subsurface Defects on Water Adsorption at Near-Ambient Pressures. J. Phys. Chem. C 2015, 119, 13682–13690. [Google Scholar] [CrossRef]
  59. An, H.; Wang, D.; Miao, S.; Yang, Q.; Zhao, X.; Wang, Y. Preparation of Ni-IL/SiO2 and Its Catalytic Performance for One-Pot Sequential Synthesis of 2-Propylheptanol from n-Valeraldehyde. RSC Adv. 2020, 10, 28100–28105. [Google Scholar] [CrossRef]
  60. Yang, S.; Song, X.; Zhang, P.; Sun, J.; Gao, L. Self-Assembled A-Fe2O3 Mesocrystals/Graphene Nanohybrid for Enhanced Electrochemical Capacitors. Small 2014, 10, 2270–2279. [Google Scholar] [CrossRef]
  61. You, M.; Kim, T.G.; Sung, Y.-M. Synthesis of Cu-Doped TiO2 Nanorods with Various Aspect Ratios and Dopant Concentrations. Cryst. Growth Des. 2010, 10, 983–987. [Google Scholar] [CrossRef]
  62. Li, L.; Cai, Y.; Li, G.; Mu, X.; Wang, K.; Chen, J. Synergistic Effect on the Photoactivation of the Methane CH Bond over Ga3+-Modified ETS-10. Angew. Chem. Int. Ed. 2012, 51, 4702–4706. [Google Scholar] [CrossRef]
  63. Li, Q.; Ouyang, Y.; Li, H.; Wang, L.; Zeng, J. Photocatalytic Conversion of Methane: Recent Advancements and Prospects. Angew. Chem. Int. Ed. 2022, 61, e202108069. [Google Scholar] [CrossRef]
Figure 1. Schematic illustration of the setup for testing photocatalysis to degrade methane. (Inset: picture of the setup).
Suschem 06 00001 g001
Figure 2. SEM images of the products prepared with doping Fe (ac), Co (df), Ni (gi), and Cu (jl). The scale bar corresponds to 200 nm.
Suschem 06 00001 g002
Figure 3. Raman spectra of the products prepared with doping of Fe (orange), Co (red), Ni (blue), and Cu (green). Undoped TiO2 (LPD, commercial) is displayed in black color. Eg, B1g and A1g indicate vibrational modes, which are derived from anatase TiO2.
Suschem 06 00001 g003
Figure 4. Molar concentration dependence on FWHM values of Eg mode. Orange, blue, red and green colors indicate Fe, Ni, Co and Cu doping, respectively.
Suschem 06 00001 g004
Figure 5. Molar concentration dependence on peak wavenumber of Eg mode. Orange, blue, red and green colors indicate Fe, Ni, Co and Cu doping, respectively.
Suschem 06 00001 g005
Figure 6. Atomic concentration of dopant elements in the product depends on the molar concentration. Orange, blue, red and green colors indicate Fe, Ni, Co and Cu doping, respectively.
Suschem 06 00001 g006
Figure 7. Correlation between bandgaps and molar concentrations. Orange, blue, red and green colors indicate Fe, Ni, Co and Cu doping, respectively.
Suschem 06 00001 g007
Figure 8. Reduction rate of methane with TiO2 doping Fe, Co, Ni and Cu. The initial concentration of methane gas was (3600 ± 100) ppm. Photocatalytic reaction was initiated by illuminating 24 mg of photocatalyst powder entirely with black light (wavelength: 360 nm, power: (1.60 ± 0.05) mW/cm2).
Suschem 06 00001 g008
Figure 9. Rate of methane reduction per unit area. Photocatalytic reaction was initiated by illuminating the photocatalyst powder (24 mg) entirely with black light (wavelength: 360 nm, power: (1.60 ± 0.05) mW/cm2), while the methane reduction rate per unit area was calculated by dividing the reduction rate by the surface area.
Suschem 06 00001 g009
Figure 10. Narrow scans for O1s (a) and Ti2p (b) peaks for undoped and doped TiO2. The concentration of solutes applied corresponds to 0.1 mM. Dotted spectra are Voigt functions obtained through the deconvolution of spectra.
Suschem 06 00001 g010
Figure 11. Narrow scans for doped elements: (a) Fe2p, (b) Co2p, (c) Ni2p, and (d) Cu2p. Colors are prescribed to spectra of the samples in the same manner as those in Figure 3, Figure 4, Figure 5, Figure 6 and Figure 7. The applied concentration corresponds to 0.1 mM.
Suschem 06 00001 g011
Table 1. Particle size (nm) observed by means of SEM.
Conc.
(mM)
FeCoNiCu
0.1570 ± 150550 ± 70450 ± 601460 ± 190
1.0500 ± 150450 ± 110580 ± 801420 ± 170
10270 ± 40620 ± 130650 ± 1001290 ± 130
Table 2. Comparison of synthetic temperatures, pressures, and bandgaps for 3d metal-doped TiO2.
TemperaturePressureReaction TimeBandgapsRefs.
This studyRT~80 °Catmospheric3 h2.4~3.2 eV-
Sol-gel500~600 °Catmospheric4–7 h2.0~3.0 eV[20,29,48,49,50]
Hydrothermal120~180 °Cseveral GPa1–12 h2.85~3.0 eV[28,30,31,51,52,53]
Aerosol assisted CVD~450 °CatmosphericN/A3.2 eV[25]
Table 3. Surface area measured by BET.
SampleSurface Area (m2/g)
Commercial250.26
Undoped196.84
Fe114.00
Co141.86
Ni141.86
Cu182.61
Disclaimer/Publisher’s Note: The statements, opinions and data contained in all publications are solely those of the individual author(s) and contributor(s) and not of MDPI and/or the editor(s). MDPI and/or the editor(s) disclaim responsibility for any injury to people or property resulting from any ideas, methods, instructions or products referred to in the content.