1. Introduction
Water is one of the most critical things said to exist on earth, and it is also one of the most essential needs for survival. Despite having ample freshwater resources, the region experiences frequent waterborne diseases, such as cholera, hepatitis, typhoid, and diarrhea, due to population growth, urbanization, industrialization, and poor sanitation [
1]. Drinking water tainted with bacteria, viruses, and intestinal parasites can spread pathogenic organisms that cause sickness [
2]. According to WHO, 6.3% of fatalities are attributed to contaminated water, poor sanitation, and poor hygiene [
3]. Based on the Global Burden of Disease report’s projections, waterborne diseases accounted for the second-highest cause of death in 1990 but dropped to the ninth-highest rank in 2020. It is estimated that 829,000 people each year pass away from diarrheal illnesses, mostly cholera, dysentery, and typhoid fever, as a result of contaminated water supplies and poor sanitation practices [
4]. New waterborne infections pose a serious risk to public health in both industrialized and developing countries [
5], as they may spread quickly and impact huge populations. The possible types of contamination in drinking water include bacteria (like
Salmonella,
E. coli,
Campylobacter, and
Vibrio), viruses (like Rotavirus, Hepatitis A and E), protozoa (like amoeba and giardia), helminthic infestation, and chemicals (like lead, mercury, etc.) [
6]. The World Health Organization states that safe policies for the management and monitoring of water resources must be in place, surveillance must be sufficient, and water quality must be pleasant to the user with no unpleasant taste or odor to guarantee that health-based objectives are met [
6].
According to SDG 6, universal access to clean water and sanitation must be ensure by 2030. The United Nations (UN) established the Sustainable Development Goals (SDGs) as a comprehensive and ambitious agenda to address pressing global challenges [
2]. The implementation of SDG 6, “Clean Water and Sanitation”, has been underway in Pakistan, but challenges remain in achieving the targets set by the United Nations. The Government of Pakistan has recognized the importance of SDG 6 and has initiated several programs and policies to improve access to clean water and sanitation facilities across the country [
7]. Efforts have been made to improve access to safe drinking water sources, especially in rural and underserved areas [
8]. The government, in collaboration with international organizations and NGOs, has implemented projects to construct water supply infrastructure, including water treatment plants, tube wells, and hand pumps. However, challenges remain in fully implementing SDG 6 in Pakistan. These challenges include inadequate funding, limited infrastructure in remote areas, water scarcity issues, and governance and institutional constraints [
7,
8].
In 2022, 2.2 billion people worldwide were still lacking access to clean drinking water and 3.5 billion people lacked safely managed sanitation, while 653 million lived in unhygienic conditions [
9]. People are at risk for health problems due to contaminated water and inadequate sanitation methods. In United States, the Center for Disease Control and Prevention (CDC) reported 214 outbreaks from 2015 to 2020. About 80% of these outbreaks were associated with drinking water systems, resulting in 2140 illnesses, 563 hospitalizations, and 88 deaths [
10]. In China, about 190 million people annually suffer from waterborne diseases, out of which 60 thousand people die due to gastric and liver diseases [
11]. Of all the worldwide recorded diarrheal cases, 53% occur in Africa [
12]. The burden of waterborne diseases in South Asia is considerably high. In India, outbreaks of infectious diseases from 2014 to 2018 caused 11,728 deaths due to poor hygiene, lack of adequate sanitation, and the absence of waste disposal systems [
13]. Similarly, in Bangladesh, between January and September 2023, there were 203,406 cases of diarrhea, leading to 989 deaths, with a 0.49% fatality rate [
14]. In low- and middle-income countries, infections are common because of poor hygiene and sanitary practices, where 90% of children have been infected with hepatitis A by the age of 10 years, often without symptoms [
15]. Pakistan’s drinking water quality is compromised by water contamination, which poses a significant global health hazard. Multiple factors, including rapid population growth, extensive industrialization, the impact of climate change, and inadequate water quality management, contribute to the gradual deterioration of drinking water quality [
16]. Microbial infestations, trace metals, and drug toxicity are all contributing factors to the exponential growth of waterborne diseases in numerous Pakistani water bodies [
17]. According to the WHO, 234 laboratory-confirmed cholera cases were reported from 15 January to 27 May 2022, in Sindh province. Similarly, the provinces of Punjab and Balochistan recorded 25 and 31 verified cases of cholera, respectively [
15]. About 80% of all infections in the province of Khyber Pakhtunkhwa (KPK) are waterborne, and they account for 33% of fatalities [
18]. Atif et al. [
19], using secondary data, assessed waterborne diseases such as acute watery diarrhea, cholera, non-cholera, bloody diarrhea, acute viral hepatitis, typhoid fever, and extensively drug-resistant typhoid during 28 weeks in 21 districts of Khyber Pakhtunkhwa. Over the course of the investigation, 478 incidences of these diseases were reported. These diseases are frequently brought on by polluted water sources, poor sanitary facilities, and restricted access to drinking water.
In Abbottabad, the major sources of drinking water are springs, natural streams, and groundwater. The water supply in the Abbottabad area was majorly dependent on groundwater for a long period of time. In recent years, enhancement of the water supply has been urgently required due to the rapid development and increase in the population. To mitigate the shortage of water supply capacity in Abbottabad and surrounding areas, the JICA (Japan International Cooperation Agency, Tokyo, Japan) developed a surface water supply system using gravity from streams in the east of Abbottabad [
20]. Surface water in Abbottabad is more prone to bacterial contamination as compared to groundwater [
16,
21,
22]. Previous studies confirmed the microbial contamination in different urban and rural water supplies of Abbottabad city [
22,
23,
24,
25]. Unclean water in the urban population of Abbottabad was responsible for the regular prevalence of waterborne diseases such as diarrhea, skin infection, typhoid, and hepatitis [
22]. The use of contaminated water by students in academic institutes of Abbottabad was responsible for typhoid, diarrhea, dysentery, hepatitis, stomach pain, and skin infections [
25]. The National Institute of Health, Islamabad, reported 478 acute diarrheal cases in Abbottabad district in 39th week of 2023 [
26]. To maintain a stable state of health, one must prioritize access to safe, clean, and sufficient water sources in addition to adequate sanitation [
16,
27,
28].
Developing countries like those in Central Asia that have inadequate public health infrastructure find it difficult to deal with public health issues [
29]. Access to clean drinking water and sanitation are two of the region’s biggest problems; urban residents have more access to these resources than their rural counterparts. In Central Asian countries, waterborne illnesses resulting from microbiological pollutants and pathogens, including intestinal infections, typhoid, intestinal parasites, and viral hepatitis, are often reported [
30,
31]. Even though waterborne illnesses are known to pose a health risk to the area, not much research has been conducted on how these conditions vary over time or space. Intestinal parasite infections (including helminths and intestinal protozoa) are another public health hazard that appears to most frequently impact children in school [
32]. Waterborne diseases are often caused by inadequate knowledge, attitudes, and practices about handling of drinking water and hygiene after defecation. In villages, drinking water sources were contaminated by penetration of sewerage or surface runoff through pastures [
33]. People who have weakened immune systems are more vulnerable to infections caused by waterborne pathogens, and this is particularly true for pediatric and elderly populations [
3]. Elderly people, along with children and expectant mothers, are known to be vulnerable subpopulations for waterborne illnesses [
34]. Water-related diseases are the world’s largest cause of mortality, taking 1.8 million lives per year, according to UNICEF. Khyber Pakhtunkhwa (KPK) is one of those areas that are particularly known for waterborne illnesses because of its fast population increase, industrialization, and underdeveloped infrastructure [
17]. In Abbottabad, an assessment of water sources found the presence of microbes and nitrates [
16]. Pathogens proliferate in contaminated water sources, which can result in the spread of hepatitis, typhoid fever, gastroenteritis, and diarrhea [
19]. These illnesses not only result in great misery but also place a heavy financial strain on society’s healthcare systems [
35].
This study aimed to assess the relationship between water quality and the prevalence of waterborne diseases in UCs of Abbottabad by analyzing major water quality parameters and their impact on public health. To addresses an existing research gap, the study will employ a mixed-methods approach, combining water quality testing, epidemiological data, and statistical analysis. The study produced baseline information on District Abbottabad’s water quality and rates of waterborne disease incidence.
3. Results and Discussion
3.1. Determination of High- and Low-Prevalence Areas of Waterborne Diseases
Figure 2 shows the trend of high- and low-prevalence areas of waterborne diseases, which were selected based on the secondary data collected from Basic Health Units (BHUs) of Abbottabad district. Abbottabad has a total of 54 Union Councils and 63 BHUs. The year-wise data from 2018–2022 of waterborne disease prevalence in the 54 UCs of Abbottabad district were collected from these 63 BHUs. After the collection of data, the data were analyzed on MS Excel to determine the trend and to identify high- and low-prevalence Union Councils.
The occurrence of diseases (referred to as “Ave-disease”) over a span of five years is shown in
Figure 2. There are mentions of various locations such as Mirpur, Sherwan, Bakote, Nawanshehr, and Moolia. These locations may be relevant to the disease data, potentially indicating different geographical regions or specific areas where the disease is being monitored. Alongside the numbers, there are terms such as “High” and “Low” that could be related to the severity or prevalence of the disease. There is also a list of other medical conditions mentioned, including
Diarrhoea,
Typhoid Fever,
Worm infestation,
Peptic Ulcer Diseases,
Cirrhosis of Liver, and
Hepatitis A (is shown in
Figure 3).
The data also includes descriptors such as “Urban” and “Rural” which might refer to different types of areas within the mentioned locations, potentially indicating variations in disease prevalence based on urban or rural settings.
3.2. Physical Parameters Analysis of Water
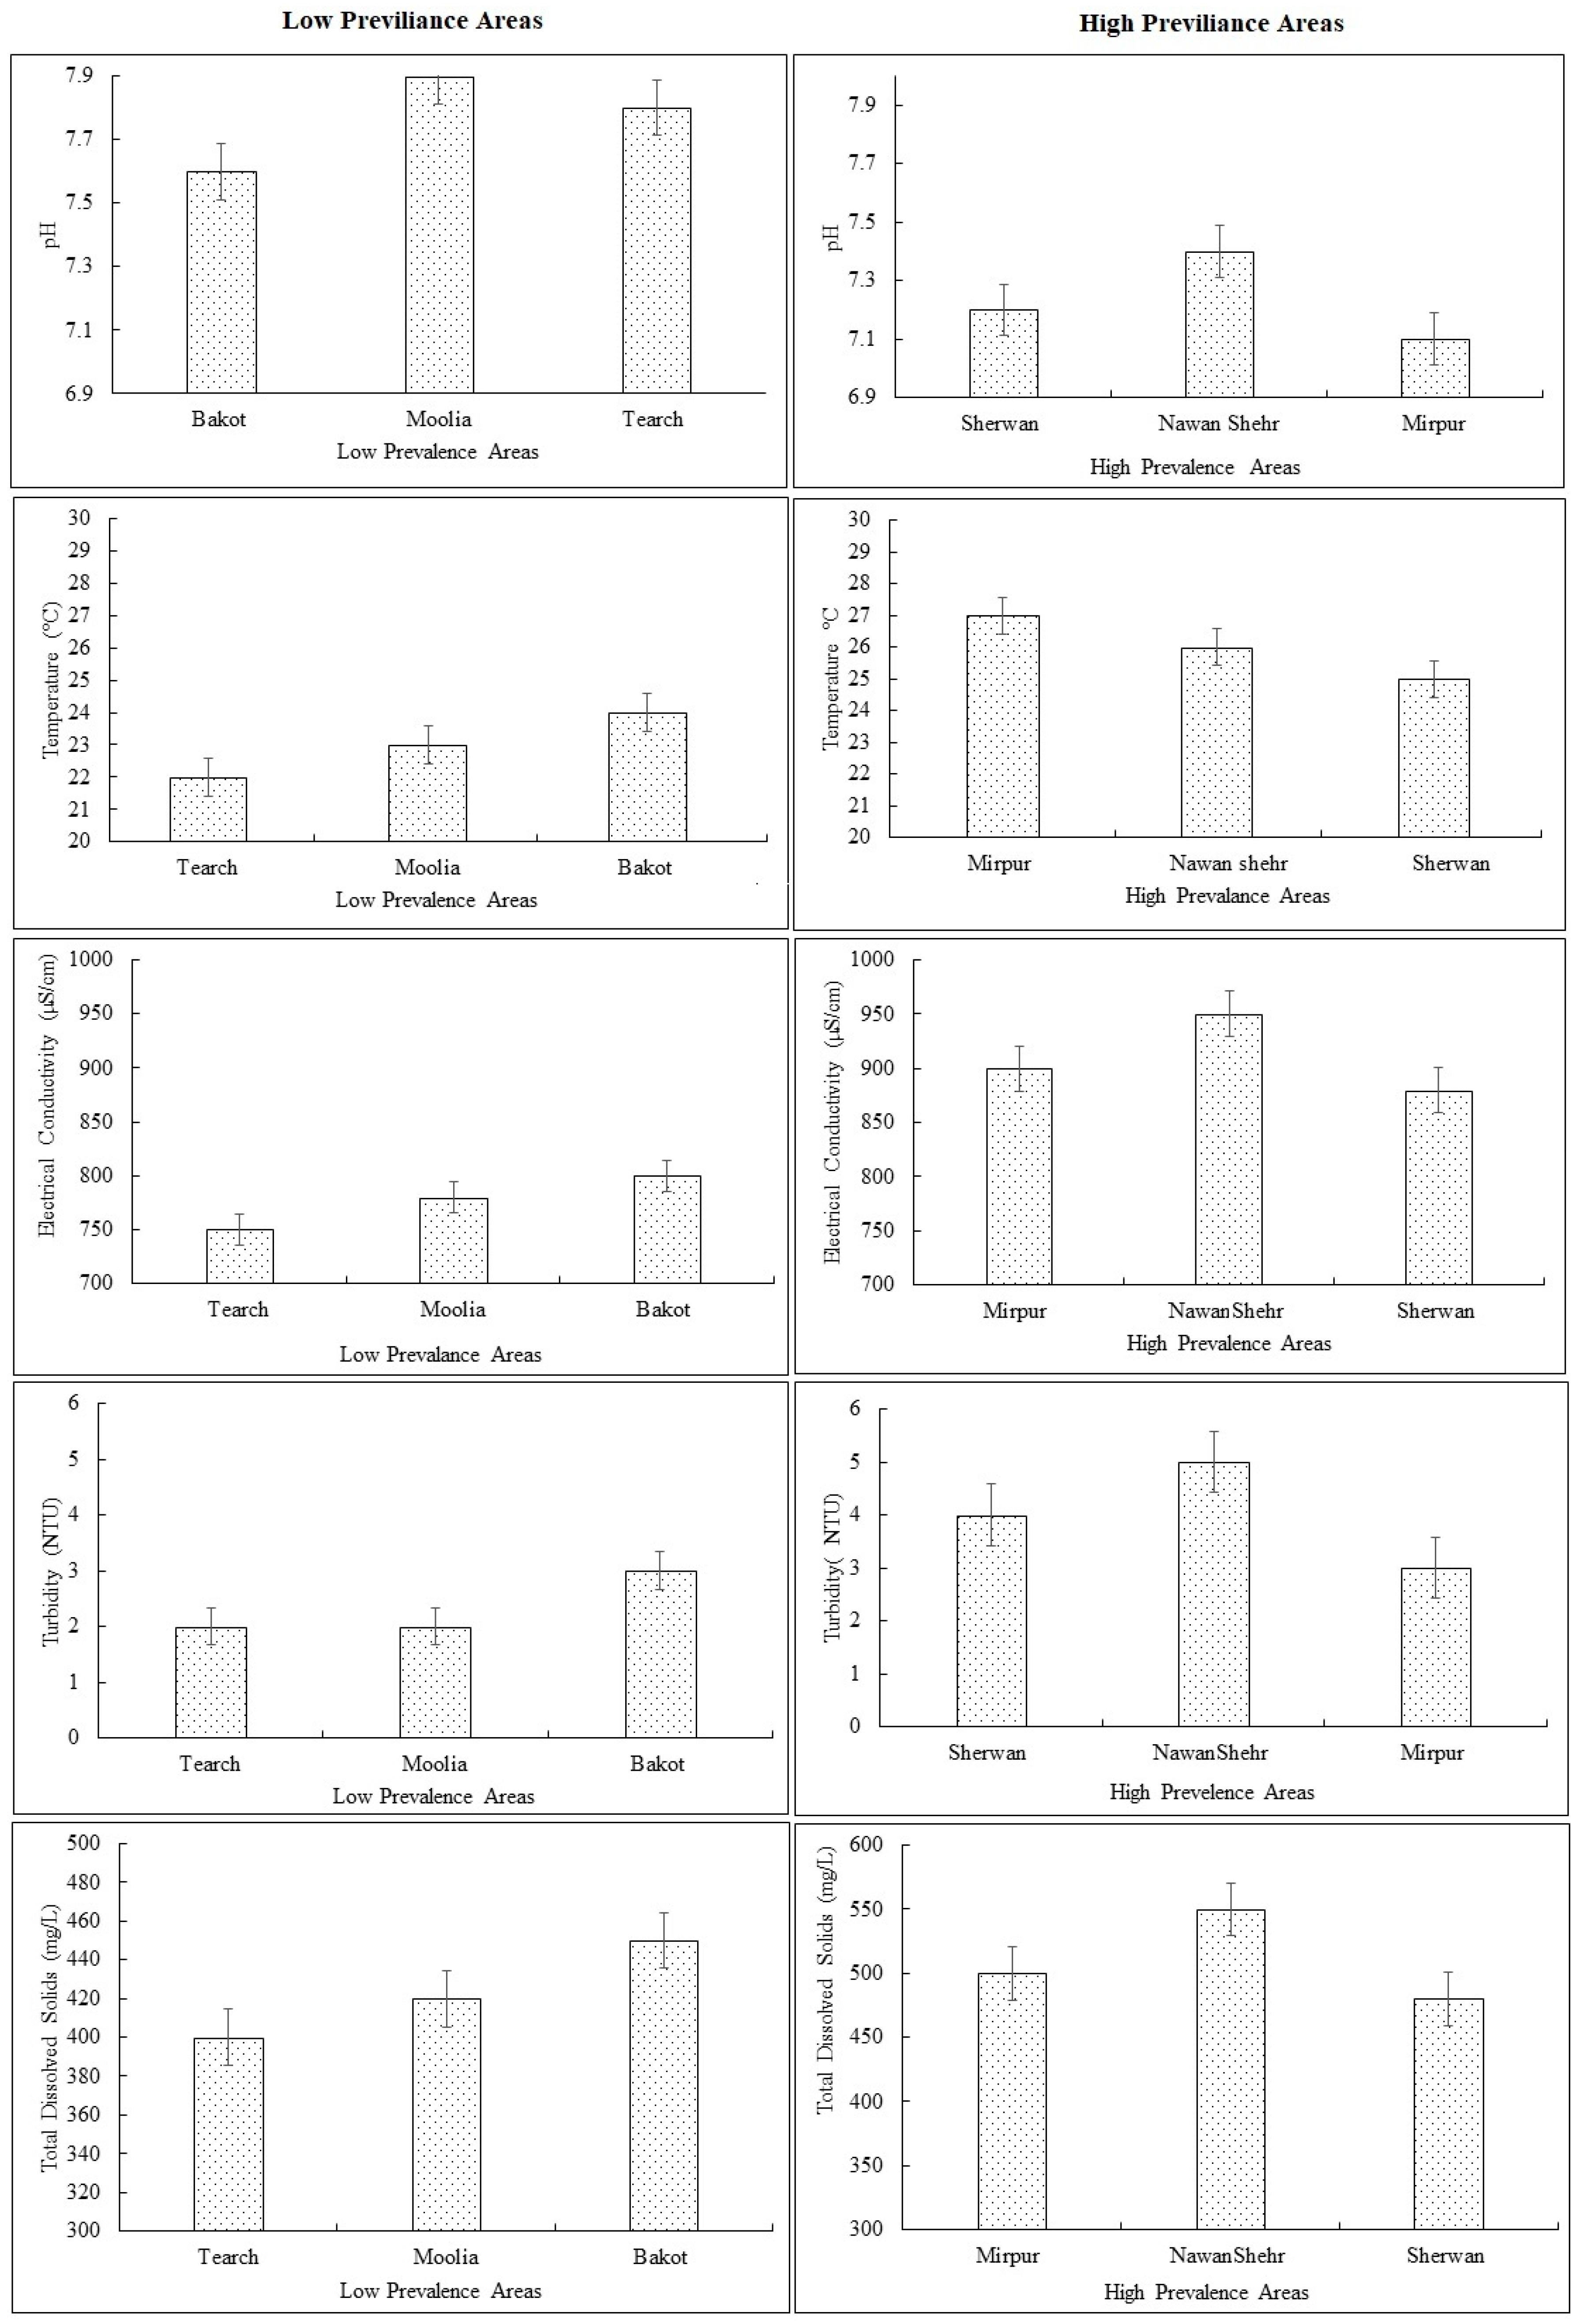
The data represent mean values of physical parameters of data from six Union Councils in Abbottabad, categorized into high-prevalence and low-prevalence areas based on the prevalence of waterborne diseases. The data includes mean values of the physical parameters pH, temperature, electrical conductivity, TDS, and turbidity, helping us to understand the trend and condition of water quality in each Union Council.
3.2.1. pH
Figure 4 depicts the mean values of pH in low-prevalence areas. The pH value ranges from 7.6–7.9. The pH levels of low-prevalence areas lie between neutral and slightly basic. It was noted that the Moolia has a higher value of pH than Bakot and Tearch. However, the values of all UCs lie within the permissible limit defined in National Environmental Quality Standards (NEQs). The permissible limit is 6.5–8.5. Hence, the pH levels in the provided dataset do not show any significant deviations that would directly suggest an association with disease prevalence. Extreme pH values can indicate contamination or potential health risks. The pH levels appear to be within the acceptable range for drinking water (
Figure 4). The pH levels of high-prevalence area samples ranged from 7.1 to 7.4, as shown in
Figure 4. The pH values of all union councils lie from neutral to very slightly basic. Nawashehr has a relatively higher pH value than Sherwan and Mirpur. The basic pH is favorable for microbial growth; however, all the values lie within the permissible limit set by NEQs (6.5–8.5). Hence, the pH levels in the provided dataset do not show any significant deviations that would directly suggest an association with disease prevalence.
3.2.2. Temperature
The water temperatures of low-prevalence areas range from 22 °C to 24 °C, as described in
Figure 4. The highest temperature was recorded for Bakot and the lowest was recorded for Tearch. The sampling period was summer 2023. Water temperature plays a significant role in determining its suitability for consumption. Extreme temperatures can impact the taste, odor, and overall quality of the water. The temperatures are within the range that can support the growth of microorganisms [
16].
The values range from 25–27 °C in high-prevalence areas. The maximum temperature was recorded for Mirpur, which is 27 °C. The higher temperatures observed in the Mirpur (27 °C) may contribute to the increased growth and survival of pathogens like E.coli, Salmonella typhi, and Vibrio cholera. This association suggests that warmer water temperatures can potentially be linked to higher disease prevalence in those areas.
3.2.3. Electrical Conductivity of Water
Electrical conductivity is a measure of the water’s ability to conduct an electric current. It helps gauge the concentration of dissolved salts and minerals.
Figure 4 depicts the mean electrical conductivity of low-prevalence areas. The electrical conductivity values range from 750 to 800 mS/cm in the dataset, indicating variations in the concentration of dissolved salts and minerals. The highest concentration is reported in Bakot and the lowest is reported for Tearch.
The NEQs and WHO do not provide permissible limit for electrical conductivity in drinking water. However, deviations from normal conductivity levels can suggest contamination or high mineral content, affecting water quality and safety. Therefore, the experimental values were compared with other international standards to assess the water quality [
41].
Figure 4 depicts the mean concentration of electrical conductivity in high-prevalence areas. Nawanshehr has the highest EC value and Sherwan has the lowest EC value; however, the electrical conductivity of high-prevalence areas was also within the set limit. This indicates that the water has low mineral content; this is why the turbidity and total dissolved solids are also within the permissible limit.
The higher electrical conductivity values may indicate a higher concentration of dissolved salts and minerals in the water. While this does not directly indicate disease prevalence, it suggests a need for further investigation to assess the potential impact of specific contaminants on waterborne diseases.
3.2.4. Turbidity
The results of low-prevalence areas are depicted in
Figure 4. The values range between 2–3 NTU. Bakot has the highest turbidity value, and the lowest turbidity value was noted for Moolia. The electrical conductivity was also higher in Bakot, which could be the reason behind the similar trend in mean turbidity values. Turbidity refers to the cloudiness or haziness of water caused by suspended particles. This parameter was assessed to determine the clarity of water and potential risks. According to NEQs and WHO water standards, the value of turbidity should not exceed 5 NTU as high turbidity levels may indicate the presence of sediments, pollutants, or microorganisms. The values of turbidity lie within the permissible limit as set by NEQs.
However, the turbidity of high-prevalence areas was higher than low-prevalence areas, as described in
Figure 4. Turbidity values range from 3 to 5 NTU (Nephelometric Turbidity Units) in the dataset. The highest turbidity levels were observed in Nawashehr samples. Surface water source was the cause of the high turbidity levels in the Nawanshehr samples. This can contribute to a higher risk of waterborne diseases, as pathogens can thrive and survive in such conditions.
3.2.5. TDS
Figure 4 depicts the mean total dissolved solids of low-prevalence areas. The results revealed that Bakot has the highest TDS value, and the lowest value is reported for Tearch. The similar trends were observed for turbidity and electrical conductivity. Total Dissolved Solids is a collective measurement of inorganic and organic substances dissolved in water. It includes minerals, salts, metals, and other dissolved particles. High TDS levels can affect taste, appearance, and potential health implications. According to NEQs and WHO water quality standards, the permissible limit of total dissolved solids is less than 1000 mg/L.
The concentration of total dissolved solids, as shown in
Figure 4, revealed that the total dissolved solids of high frequency areas were higher than low frequency areas. The highest TDS value was recorded for Nawansher and the lowest for Sherwan. Although the concentration of both areas lie within the permissible limit, the high-prevalence areas tend to have more dissolved solids. This could be an indication of the presence of contaminants and water pollutants in the water. It is worthy to note that the high TDS in the area could be the reason behind the high microbial contamination in these areas, which is discussed in the next section. The TDS levels in the dataset represent the combined content of inorganic and organic substances in water. Similar to electrical conductivity, the TDS levels in the dataset do not directly indicate disease prevalence. Nevertheless, high TDS levels in water can also be viewed as indicative of probable impurities such as heavy metals or other ions that can further increase the risks of waterborne diseases.
Because of the presence of important minerals that contribute to water hardness, like calcium and magnesium, TDS levels in Abbottabad have varied significantly. A mean value of 298.13 mg/L was recorded for total hardness, which is mostly caused by calcium and magnesium. This suggests water that is somewhat hard, which is typical in the area [
23]. Ahemad et al. [
27] reported mean TDS levels of 335.42 ± 86.3 ppm in another investigation. According to a different investigation, TDS varied significantly throughout water sources, ranging from 179 to 9410 mg/L [
23].
In the low-prevalence Union Council locality of Abbottabad, the prevalence of waterborne diseases is contingent on several factors. In low-prevalence areas, water sources tend to be of near-neutral pH. They are also tepid: low-prevalence areas normally fall within safe temperature thresholds, and the low electrical conductivity of these water sources shows fewer dissolved salts and minerals; in this unsuitable setting, conditions may not favor well-appointed waterborne pathogens [
42]. In addition, the water in these areas is less turbid; hence, there is less cloudiness. Since the particulate matter is low, there is a reduced possibility of these pathogens being present. Physical water parameters in the low-prevalence areas, regarding quality with respect to all abiding limits, are safe.
On the other hand, in Union Councils with more waterborne diseases, the trends are similar but the values are different from low-prevalence areas. The pH level of water sources in these areas is therefore neutral. Also, the water temperatures in these high-prevalence areas are also relatively high, and this may enhance the reproduction and existence of waterborne pathogens, thereby increasing the risk of disease transmission. Also, the water sources in these areas of high prevalence have been seen to have high electrical conductivity, showing that there are higher levels of salts and minerals in the water than in the low-prevalence areas. Also, the water sources in high-prevalence areas are also characterized by high turbidity. Even though the mean physical parameters are higher in the high-prevalence areas than the low-prevalence areas, all the values are within the recommended standards, thereby indicating that the physical parameters are not directly related to disease incidence. However, the synergistic impact may be the cause for disease incidence.
Numerous reasons contribute to the increased TDS, turbidity, conductivity, and pH levels in Nawanshehr. Geographical and geological impacts like mineral compositions may contribute to higher concentrations of dissolved minerals in groundwater, leading to increased TDS and EC levels [
43,
44]. Water supply infrastructure pipe deterioration and inadequate water treatment may also increase the TDS level. Similarly, surface runoff during rainfall carries sediment and pollutants into water sources, increasing turbidity levels [
45]. Tearch has low pH, turbidity, TDS, and EC, and it likely contains less sediments, organic matter, and microbial contamination.
3.3. Microbiological Analysis
Microbial analysis was conducted on water samples collected from three Union Councils (UCs) with low incidence of waterborne diseases and three UCs with high incidence of waterborne diseases. The aim of this analysis was to determine the presence of certain microorganisms including
E. coli,
Salmonella Typhi, and
vibrio cholera in the water samples.
Figure 5 shows the microbial contamination in low-prevalence areas and high-prevalence areas, respectively.
It is justified to include of
E.coli,
Salmonella typhi, and
vibrio cholera in the microbial analysis since they are common pathogens of fecal origin that are associated with waterborne diseases. Gastrointestinal diseases are caused by these microorganisms when contaminated water is consumed. Their presence in the water samples should therefore be tested as this helps in assessing the potential of transmitting waterborne diseases and targeting the areas that require interventions that aim at restoration of safe drinking water and escalation of efforts to abate waterborne diseases. Ahmed et al. [
27] confirmed the presence of coliform in drinking water samples from collected from schools, which is consistent with their previous findings. In previous studies, the presence of microbiological pollution was found in water sources of Abbottabad’s urban and rural areas by [
22,
23,
24]. In Abbottabad, microorganisms were found in around 76.8% of the water samples [
25].
Studies in Abbottabad have shown alarmingly high levels of microbial contamination in the city’s drinking water. Using characteristics such as pH, temperature, chlorine residue, Total Viable Count (TVC), Total Coliform Bacteria (TCB), Total Fecal Coliform Bacteria (TFCB), and the presence of
E. coli, a study evaluated 20 water samples from Abbottabad’s gravity flow water scheme [
46]. All samples had high TVC values, which made them unsafe for human consumption; 85% had TCB levels above allowable limits, 45% had excessive TFCB, and 75% had
E. coli contamination.
Pseudomonas aeruginosa,
Klebsiella oxytoca, and
Escherichia coli were among the microorganisms that were identified. Eight drinking water samples from Abbottabad’s government and semi-government institutions were examined in another study. The findings revealed that
E. coli was present in the same number of samples (76.8%) that tested positive for bacterial contamination [
46].
Salmonella typhi,
Shigella,
Pseudomonas aeruginosa,
Salmonella cholerae,
Bacillus,
Streptococcus,
Klebsiella, and
Staphylococcus aureus were among the other bacteria found [
25]. Water quality assessments conducted across Pakistan have shown a high level of bacterial contamination: according to a study, 35% of 344 groundwater samples from different sources had fecal coliforms/
E. coli and 65% had total coliforms [
47].
Microbial analysis established that both the low- and high-prevalence areas contained contamination from microbial E.coli, salmonella, and cholera organisms. However, it was observed that the contamination levels were comparatively higher in the high-prevalence areas. In all these variations, it is, however, worth mentioning that the levels of microbial contamination in both the low- and high-prevalence areas were above the acceptable limits. The reason for performing these microbial analyses was to assess the potable water quality in the selected UCs and find possible sources of contamination. The analysis attempted to demonstrate the risk of waterborne disease transmission associated with the presence of E. coli, Salmonella typhi, and Vibrio cholera.
The outcomes offer useful information regarding the potential improvement of water treatment approaches, sanitation measures, and efforts to decrease the incidence of water-related diseases in the respective zones. The amounts of E.coli found were greater than those of the other microbes. In Bakot, the highest number of colonies was reported. The outcomes clearly indicate that as the number of colonies of microbes increased, the percentage of disease prevalence also increased. This finding was subsequently confirmed through linear correlation, the results of which are presented in the next subsections.
As can be seen from
Figure 5, the concentration of
E. coli is greater than other microbes. The highest number of all microbial colonies is reported in UC Mirpur. It is clear from the results that when the number of colonies of the microbes increased, the percentage of disease occurrence increased as well. This result was then corroborated with a correlation statistical tool, which is discussed in later subsections.
The presence of E.coli, Salmonella typhi, and Vibrio cholera bacteria in the high-prevalence areas indicates a potential contamination of water sources with fecal matter. These bacteria are known pathogens responsible for causing waterborne diseases. Therefore, the higher concentrations of these bacteria in the high-prevalence areas suggest a higher risk of waterborne diseases and, consequently, higher disease prevalence.
These findings highlight the need to take action to solve water quality issues and promote effective water management techniques. Understanding microbial contamination patterns and identifying high-contamination locations allows for the development of appropriate measures to reduce the risk of waterborne diseases and ensure safe drinking water for populations.
3.4. Association of Water Quality and Waterborne Diseases
Correlation analysis was used to determine the association between water quality and the illnesses that are transmitted by it. To assess the association between water quality and waterborne illnesses, biological parameters of high- and low-prevalence locations were compared. The physical indicators were not associated with disease prevalence because they all fell within the permitted range of NEQs.
3.4.1. Low-Prevalence Area
The information given reflects the biological characteristics of water quality as well as the prevalence of various diseases that are spread by water in the low-prevalence area region. E. coli, Salmonella typhi, and Vibrio cholera are the biological parameters that were detected. The presence of illnesses in a region is referred to as disease prevalence. According to the data, the observed biological parameter E. coli was detected in certain samples, with an average of 7 counts, according to biological criteria. On average, 2 counts were positive for Salmonella typhi and 0.66 were positive for Vibrio cholera. The disease prevalence data values were taken from survey data to analyze the current conditions and association of disease prevalence with biological parameters of drinking water.
The correlation analysis reveals strong positive association between microbial parameters and disease prevalence. The values of the correlation coefficient are depicted in
Table 5.
3.4.2. High-Prevalence Area
The information given demonstrates the high-prevalence areas’ biological water quality characteristics as well as the prevalence of specific waterborne illnesses. E. coli, Salmonella typhi, and Vibrio cholera are the biological parameters that were detected. The presence of illnesses in a region is referred to as disease prevalence. With an average count of 15, E. coli was found in certain samples according to biological criteria. Vibrio cholera was discovered in an average count of 3.66, while Salmonella typhi was discovered in a count of 5.66.
Furthermore, 65.50% of the high-prevalence area is known to have a high prevalence of waterborne illnesses. The correlation study confirms the association between illness prevalence and the biological characteristics of water quality. In conclusion, the information sheds light on the biological aspects of water quality as well as any possible links between them and the prevalence of waterborne illnesses in the high-prevalence region. It emphasizes the need for more research and monitoring to better understand the link between disease incidence and water quality parameters and to put in place the necessary safeguards for a safe water supply and to reduce the risk of waterborne illnesses.
The correlation analysis reveals a strong positive association between microbial parameters and disease prevalence. The values of the correlation coefficient are depicted in
Table 6. Correlations for
Salmonella and Vibrio cholera were 0.8 and 0.5. When
E. coli and water contamination have a correlation value of 1, it means that there is a perfect positive correlation between the two, meaning that water contamination is always present at the same level wherever
E. coli is present. Due to differences in environmental conditions and pollution sources, this is rarely the case in real-world situations.
3.5. Prevalence of Waterborne Diseases
Disease prevalence is stated to be 37.50% in the low-prevalence areas and 65.50% in the high-prevalence areas.
These percentages are determined by Equation (1).
A total of 45 people from the low-prevalence region reported having an illness, with a prevalence of 37.5%. A total of 75 out of 120 individuals in the high-prevalence region reported having an illness, yielding a prevalence of 62.5%.
Table 7 shows the disease prevalence and responses of respondents.
According to the statistics, there is a larger prevalence of illness in the high-prevalence areas compared to the low-prevalence areas.
3.6. Status of SDG-6 in UCs of District Abbottabad
To analyze the status of SDG-6, a questionnaire was designed including information about water sources, water accessibility, water storage, water treatment, and hygiene practices at household levels. The questionnaire is attached in Annex-1.
3.6.1. Water Sources and Water Accessibility
The principal sources of drinking water were many in the study region, including piped water, tube well, bore wells, stream (Chashma), and water pumps. The majority, 95 out of 240, have a piped water (39.5%) connection directly to their dwellings. Streams (Chashma) are also a major water supply source, and 85 out of 240 (35%) use stream water. Most of the people using Chashma waters are from rural areas including Bakot, Tearch, and Moolia. The urban population has bore wells in their houses, with 28 out of 240 (11.6%) useing bore water for drinking purposes. The majority belong to urban areas including Mirpur, Nawasher, and some places of Sherwan. Only 7.08% (17 out of 240) uses tube well water for drinking purposes. The major tube wells are installed in Mirpur and Nawasher. Other areas have very few or no tube wells. A total of 15 out of 240 people use water pumps (6.82%). This percentage represents the water source of UC Sherwan. Sherwan has no water supply scheme and very few people have bore wells in their houses.
Regarding water accessibility, the data revealed various time frames for residents to access water from their primary source. The largest proportion, accounting for 51.25% (123 out of 240), takes less than 10 min to access water. The reason behind immediate access to water is using piped water and bore wells. As the primary supply of water is piped water, it reduces the access time for individuals.
People using water pumps and tube wells for primary water supply require 15–20 min to access water. The longer time is due to manually pumping water by hand. About 30 min access time is for residents who rely on Chashma water for drinking water purposes. Mostly rural areas, including Bakot, Tearch, and Moolia, rely on water from this source. Approximately 20.9% of respondents required more than 30 min to access water. The main water source for these people was Chashma, which is quite far from their residence.
Table 8 depicts the frequency and percentage of both water supply and water accessibility in selected UCs of Abbottabad district.
This data provides valuable insights into the water accessibility situation within the surveyed area. It showcases the predominant sources of drinking water and the varying time it takes for residents to access water. This information can prove vital for policymakers and organizations aiming to enhance water supply infrastructure and address the needs of the community effectively.
In Abbottabad, the reliance on bore wells for water supply has become increasingly common due to contamination in surface and shallow groundwater sources [
48]. This has necessitated drilling deeper wells to access cleaner water. Over the past decade, the water table in Abbottabad has declined by more than 200 feet, prompting residents to drill deeper bore wells to access groundwater (ADB). While specific local construction standards for bore wells in Abbottabad are not extensively documented, best practices generally include utilizing appropriate materials and construction techniques to prevent contamination, proper sealing to prevent surface contaminants from entering the well, and implementing measures to protect the support from sanitary pollutants [
43].
The use of bore wells for water delivery has grown in popularity in Abbottabad as a result of surface and shallow groundwater contamination. In order to obtain cleaner water, deeper wells have had to be drilled. Residents in Abbottabad are drilling deeper bore wells to access groundwater as a result of the water table dropping more than 200 feet in the last ten years [
49]. Although there is not much information on local construction requirements for bore wells in Abbottabad, overall best practices include using the right materials and construction methods to avoid contamination.
3.6.2. Water Storage and Treatment
Among the participants, 59.1% (142 individuals) reported not treating their drinking water before consumption, while 40.09% (98 individuals) stated that they usually treat their water. For those who employed water treatment methods, water filter (54.08%), chlorine (5.10%), and boiling (40.82) were the treatment approaches. Water filters are the most common treatment method adopted by individuals, while very few use chlorine for water treatment. Polypropylene spun or wound filter cartridges are used at the household level, while free residual chlorine with strength of 0.2–0.5 mg/L is added to disinfect water. Most participants, 87.5% (210 individuals), reported that water stayed in their storage tanks for 1–3 days, with only a small percentage storing it for more than a week (3.34%). Closed storage tanks are usually made of plastic material with different capacities ranging from 500 to 1000 L used at household levels. Regarding the coverage of storage vessels, the majority, 93.75% (225 individuals), confirmed that their storage vessels were covered, while 6.25% (15 individuals) stated otherwise. Overall, 29.2% (70 individuals) expressed satisfaction with the quality of the water they use, while 70.8% (170 individuals) reported being dissatisfied (
Table 9).
Table 9 shows the data of water storage and treatment in selected UCs of Abbottabad district.
3.6.3. Hygiene Practices at Household Level
Among the respondents, 9.6% (23 individuals) reported using pit latrines as their usual toilet facility, while 77.9% (187 individuals) used flush toilets connected to a pit or septic tank. A smaller percentage of 12.5% individuals selected other options (30 individuals)
Table 10. When it comes to hand-washing facilities, 10.5% (25 individuals) reported the absence of a designated place to wash their hands by the toilet, while 89.5% (215 individuals) stated that there was a designated hand-washing place. The data indicated that 100% of respondents claimed to always wash their hands after using the toilet, while 85% individual wash their hands before preparing food. A total of 218 out of 240 (90.8%) stated that they use soap for hand washing.
4. Conclusions
The study’s findings show that there are significant differences between Abbottabad’s low- and high-prevalence areas in terms of water quality and waterborne disease prevalence. The microbial contamination of drinking water in both sites highlights a severe issue that must be addressed immediately. The evident correlation between disease incidence and the presence of bacteria in drinking water emphasizes the relevance of water quality to public health.
The survey results revealed valuable information about the primary water sources, accessibility, storage, treatment, illness prevalence, and hygiene practices in the research areas. The majority of participants in low-prevalence areas drank surface water from lakes and rivers, as opposed to those in high-prevalence areas. The region primarily used groundwater from wells and boreholes. Participants demonstrated a basic awareness of the need of clean water and proper hygiene practices, but there were significant gaps in their actual behavior. Notably, a sizable proportion of individuals polled admitted to not boiling or chlorinating their water, endangering its safety for consumption. These findings underline the importance of rapid action to improve hygiene and water quality in both communities.
Microbial analysis and disease statistics show that the availability of safe drinking water to everybody was insufficient in both the urban and rural locations chosen for investigation. Drinking water was also readily available in urban areas of Nawanshehr and Mirpur, while in rural regions, the accessibility and availability of safe drinking water were jeopardized. The data suggested that the current condition could not enable the achievement of SDG-6 in Abbottabad district.
A comprehensive strategy for evaluating water quality across various geographic locations would be necessary for future studies to carry out this research on a worldwide basis. Important recommendations for future research include broadening the geographic focus, adding more water quality parameters, examining the effects of human activity, assessing the implications for public health, applying new analytical methods, conducting policy and sustainability research, and conducting collaborative and longitudinal studies. Researchers can better understand water quality issues and create long-term solutions to guarantee safe drinking water everywhere by combining these factors globally.


 ,
, 


