Abstract
Greenery is one of the most influential factors in reducing the outdoor air temperature and enhancing the microclimate in hot areas. Previous studies focused on studying Urban Heat Islands (UHI) on a specific level; this research investigates the impact of greenery on different levels and three types of UHI, pedestrian, canopy, and boundary, to provide a holistic image of greenery impact on the atmosphere. Further, whereas vegetation impact has been addressed in previous studies, no valuable study has been found that investigates the impact of vegetation within the local climate conditions of the UAE. In this research, different types of greenery will be investigated to find their impact on outdoor microclimate parameters and the UHI within the hot climate conditions of the UAE. The case study of this research is a boulevard located in Dubai; the International Media Protection Zone’s main boulevard was selected to simulate different scenarios based on vegetation type and Leaf Area Density (LAD) using ENVI-met. The results showed that 12 m trees and the cylindrical tree are the most effective vegetation in reducing the air temperature; the variation between these scenarios and the existing case reaches 0.70 °C and 0.66 °C, respectively. The 10 m trees also have an influencing impact on reducing the air temperature by 0.50 °C. The same vegetation types showed a positive performance in absorbing shortwave radiation. The reduction in the reflected wave compared to the reference case was 36.07 W/m2 and 31.45 W/m2 for the 12 m and 10 m trees, respectively. Furthermore, the reduction in air temperature of a proposed scenario can reach 2.41 °C, 1.12 °C, and 1.08 °C for the investigated UHI levels. The results of this study will provide a canyon greenery prototype, with optimized performance in hot, humid climate areas.
1. Introduction
Global warming and climate change are critical issues that raise attention on a global level. Worldwide, some cities are warming twice as fast as the surrounding rural areas [1,2]. Apart from that, a rising temperature has been recorded in Dubai/UAE, with an increase of 2.7 °C between 1975 and 2013 [3]. Generally, the increase in air temperature is attributed to population growth and urban development. However, regional urban increase in air temperature, commonly described as the Urban Heat Island (UHI), is created due to the expansion of the developed and urbanized areas at the expense of the vegetation cover. This expansion, consequently, leads to impervious warming compared to surrounding and rural areas [4,5]. The Urban Heat Island (UHI) is one of the most influential phenomena in global warming and climate change, as it contributes to climate warming by about 30% [6], and it has both outdoor and indoor environmental impacts. In general, the UHI is caused by the solar radiation absorbed by the structures in developed areas [7]. Therefore, the main reason behind the UHI is the modification of the natural land by development and urbanization, which act as the main causes of this phenomenon [8]. Sustainable urban design and the employment of suitable design strategies can have a direct impact on reducing the effect of the UHI on the built environment. Previous studies showed the importance of urban morphology and urban design elements in reducing the effect of UHI on microclimate conditions [9,10,11]. Che-Ani et al. (2009) [12] highlighted the factors that affect the UHI in two ways: (1) microclimate factors: wind speed and behavior, humidity, and cloud layer; and (2) urban geometry factors: urban pattern, density, built-up areas, Sky View Factor (SVF), urban materials, greenery areas, and landscaped areas.
1.1. Urban Heat Island and the Atmospheric Layers
The Earth’s atmosphere layers show that the closest layer to the Earth is the Troposphere layer, which extends 12–20 km from the Earth’s surface into the atmosphere. Microclimate conditions are a part of the Earth’s Troposphere layer, called the Atmospheric Boundary Layer (ABL) [13]. The Atmospheric Boundary Layer (ABL) extends from the Earth’s surface to a range of 200–500 m above the ground surface level [14]. However, the first 100 m of the ABL is the most affected layer by the changes in the Earth’s surface [15,16]. However, this layer is divided into two sub-layers: Urban Boundary Layer (UBL) and Urban Canopy Layer (UCL) [17]. The UBL is above the average height of the buildings, while the UCL is the layer in the space between the buildings. Generally, the UCL microclimate is affected by the morphology, shape, and roughness of the developments [18]. Most of the built environment research is concerned with the UCL, as it has the most significant impact on the thermal performance of the built environment [19,20]. Nevertheless, the microclimate of any area is the climatic conditions of both the UBL and the UCL, and microclimate represents the climatic parameters of a local division from the larger area. It can be the climatic conditions of a small area, such as the canyon between the buildings, or it can also represent the climatic conditions of a larger area, such as neighborhoods or a city with different climatic conditions to the surrounding area [21]. Generally, the microclimate major parameters cover air temperature, solar radiation, humidity, and wind speed and direction. The interaction between the urban morphology and the microclimate conditions has a significant impact on the thermal performance of outdoor and indoor environments. However, it is still difficult to predict every single factor that contributes to the microclimate conditions of the built environment. However, it has been found that some phenomena such as the Urban Heat Island (UHI) have a significant impact on climatic conditions, both on a local and global scale [22]. This research will focus on the interaction of one of the urban environment factors, specifically the greenery, or plants with atmospheric conditions, of the UAE.
1.2. Types of Urban Heat Island UHI
The UHI has been investigated on two levels; (a) Surface Urban Heat Island (SUHI), and (b) Atmospheric Urban Heat Island (AUHI) [22]. The SUHI is the average temperature on the horizontal surfaces such as roofs of buildings, outdoor equipment, and canyon pavements. It is a diurnal phenomenon that is affected by the sun’s position and the surface material [22]. The SUHI on a large scale is measured by using the remote sensing data collected from satellite sensors [23]. The other type, AUHI, within the atmospheric boundary layer, is divided into two types depending on the atmospheric layer. The first one is the UHI, within the UBL above the building’s average height; the air temperature of this layer is affected by the interaction with the roughness of the building’s roof. The second type of UHI is the one within the Canopy Layer Heat Island (CLHI), which represents the area within the urban space between the buildings or the canyon space [24]; the Canopy Layer Heat Island (CLHI) is the part of the high-temperature air within the urban canyon space. It extends from the canyon ground to the average height of the buildings. The microclimate within this layer depends on the building’s geometry, canyon height to width ratio, type and percentage of greenery, and canyon material [24]. The CLHI is generally measured by weather-measuring tools used in fixed stations at ground level; the effect of the UHI on microclimate conditions will be explored in the next section.
1.3. Vegetation and the Impact of the Urban Heat Island UHI on the Microclimate
In 2008, the United States Environmental Protection Agency stated that the impact of the UHI is felt in an increase in the developed area’s air temperature compared to the rural surrounding area air temperature of between 1–3 °C during the day [24]. This increase in air temperature will consequently increase electricity demand and, accordingly, GHG emission and air pollution. The UHI is affected by day and night time; the variation between surface temperature and air temperature at night is less compared to the variation in the daytime. This result reflects the fact that during the daytime the developed surfaces absorb the solar radiation more than reflecting this radiation, while at night time the release of the surface heat and the balance between the surface and air temperature at night occur. Therefore, increasing the surfaces that absorb the solar radiation will consequently reduce the impact of the reflected waves. Wanphen and Nagano (2009) [25] found that the variation in air temperature within the urban context can reach 5–15 °C because of the pockets of small islands. However, the impact of the UHI is varied according to the location of the area and weather conditions. Hirano and Fujita (2012) [26] conducted a field measurement study to find the effect of UHI in Tokyo, Japan. The researchers stated that UHI is an accumulation of high-temperature areas, and it has a more positive effect by reducing heating consumption in winter, compared to the negative effect of increasing cooling consumption in summer. In spite of the positive effect of reducing energy consumption in the winter, the authors did not recommend stopping the effort of mitigating the UHI and its impact on the global environment. However, urban design variables that affect this phenomenon, such as building configuration, Sky View Factor (SVF), materials, vegetation, and landscaped green areas, have been investigated in a number of studies [27,28,29,30]. The UHI was explored and illustrated in the previous literature in order to study the reasons behind these phenomena and their impact on climatic conditions. In addition, the literature also sought to find solutions to reduce and mitigate its negative effect on the built environment. Different strategies have been proven and used for reducing the impact of UHI and enhancing the microclimate of urban areas. Apart from other strategies, urban greenery, especially trees, and vegetation areas have been proven to be one of the most effective measures for enhancing the microclimate and mitigating UHI environmental impacts [31,32,33,34]. Furthermore, previous studies listed a number of benefits that can be achieved by increasing greenery, such as reducing air pollutants and particulates, energy-saving and conservation through cooling benefits, noise buffering, improving psychological wellbeing, human interaction, and social life, and increasing property value [35,36].
However, most of the previous studies evaluated greenery according to the percentage of the greenery ratio applied to the total designed area. Other studies indicated the greenery type according to the Leaf Area Index (LAI) [37]. Leaf Area Index (LAI) could be defined as a dimensionless highly variable value; it can range from 0 to more than 6. Some areas have a Leaf Area Index (LAI) less than 1, while tropical forests can have a Leaf Area Index (LAI) that reaches 9, and moderate forests can have LAI values between 3 and 6. LAI is one of the most widely used measurements for describing the plant structure of the canopy layer, as leaf surfaces are the primary border of mass and heat exchange; the important processes such as evapotranspiration and canopy interception are directly proportional to Leaf Area Index (LAI). Other than that, the Leaf Area Density (LAD) is an important structural property of vegetation; it can be measured by using the Leaf Area Index (LAI), which is the sum of the area of all leaves on a plant relative to the projected area of the crown of the same plant on the ground [38,39,40]. Leaf Area Density (LAD) provides valuable insight into the structure of the vegetation that can be used in guidelines for planning proposals [40]. Leaf Area Density (LAD) plays an important role in providing the shaded environment and absorbs the solar radiation to reduce the reflected waves. The Leaf Area Density (LAD) approach also presents the importance of large and high trees in the environment [41].
Some researchers investigated the impact of light and extensive greenery with low and high LAD on the UHI and microclimate parameters; they resulted in the significant impact of extensive greenery and high LAD on reducing UHI compared to the light or moderate models [42,43]. However, most of the studies evaluated the reduction in the outdoor air temperature as a reference for reducing the UHI impact [44]. Table 1 illustrates the impact of different vegetation strategies on reducing air temperature and, accordingly, UHI impact.

Table 1.
The main and most important findings on UHI mitigation by adopting vegetation strategies.
1.4. Solar Radiation and Greenery Impact
Urban surfaces of the built environment have a significant impact in modifying solar radiation [45]. It has been found that 90% of direct radiation reaches the Earth in clear sky condition, and diffused radiation reaches the Earth after scattering in the atmosphere, also when reflected from surrounding objects. However, on overcast days 100% of the solar radiation is diffused. The radiation balance or the heat balance depends on the direct radiation and the surface [46]. It is directly related to the solar irradiance of the Earth’s surface, and the surface layer is responsible for the heat transfer between the atmosphere and the ground [47,48]. The physical features of an active earth surface depend on the state and type of the vegetation, soil, water, surface material, and albedo, which are determined for the net radiation [49]. The “Canyon effect” or urban high-density housing has a significant on the spatial diversity of the inflowing solar irradiation intensity and UHI phenomena [50,51]. When studying the radiation and the net radiation fluxes or reflection, most of the previous studies focused on the surface albedo, however, the impact of greenery on the reflected wave surfaces in the urban microclimate needs more investigation. This research will focus on the interaction of greenery or plant cover with atmospheric conditions, specifically solar radiation, and how the greenery affects the reflected shortwave radiation. Furthermore, while most of the previous studies investigated the impact of greenery by adopting the coverage ratio and the simulation method [52], this research will investigate the impact of trees and other types of greenery with respect to the type, height, and Leaf Area Density (LAD).
1.5. The Study Contribution
This research aims to investigate the impact of greenery on microclimate parameters and UHI within the UAE local climate content. Previous studies proved the impact of vegetation on UHI mitigation, however, when talking about the UHI and the results of studying this phenomenon, it is important to be more specific about the type or the UHI level, which is the reason behind the variation in the results presented in some studies. Some studies show a significant impact of the green roof, while others show that this impact is negligible [53]. The same thing can be seen in the effect of grass or other vegetation types: the results varied between significant and negligible. Nevertheless, the general impact of vegetation on UHI mitigation and outdoor air temperature reduction has been proven in all of the previous studies. While most of the previous studies investigated the impact of one level of UHI, this research will focus on providing a full image of the greenery impact on different layers of UHI reaching the urban boundary layer (UBL). It has been found that within the local conditions of the UAE and Gulf region, no valuable or consistent findings related to greenery have been published. Some publications have been concerned with vegetation topics from Saudi Arabia, however, all of these studies focused on the types of vegetation spices in rural and desert environments [54]. Therefore, the novelty of this research can be identified in two aspects: (1) providing a full image of the vegetation impact on different levels of UHI and (2) presenting and investigating the impact of different vegetation types within the hot, humid climate conditions of the UAE. Furthermore, previous studies proved the direct relationship between greenery and reducing the outdoor air temperature; no consistent findings have been found for the impact of greenery on the solar radiation absorption or reflection, therefore, the studied output parameters will cover the shortwave reflection in addition to the major microclimate parameters. Other than that, previous studies mostly examined the percentage or ratio of the vegetation coverage; in this research, different types of greenery and trees will be investigated against the UHI and microclimate parameters. The study will focus on the quantification of some microclimate parameter impacts through the application of varied vegetation and greenery strategies. It should be mentioned that the outcome of this research is relevant to the Gulf region and other countries within the same environmental conditions.
2. Methodology
2.1. Microclimate Simulation Software: ENVI-met 4.4.5
ENVI-met microclimate simulation software is one of the pieces of software that has been used to simulate the main processes of urban and atmospheric effect on microclimate. The 3D Computational Fluid Dynamics model (CFD) software computes surface–plant–air interactions at a fine spatial scale. The software was developed by Michael Bruse and the team at the University of Mainz, Germany. The validation and the accuracy of the software for vegetation impact simulation have been addressed and proven in many studies. ENVI-met helps to assess the precise spatial effect of trees on cooling the surrounding environment, further molding buildings with a high degree of precision [55]. The model uses a Fish-eye method to calculate Sky and Surface View Factors (SVF). Through the simulation process, the wind flow molding simulated used Reynolds Averaged Navier-Stokes (RANS) equations, while the Indexed View Sphere (IVS) was used for solving radiated fluxes; the ground evaporation and vegetation’s transpiration were precisely calculated. The software allows for spatial resolution from 1 to 10 m, and the temporal resolution of the output by default is on an hourly basis; however, turbulence and radiated fluxes are updated at the scale of seconds to confirm the accuracy and precision of the software. ENVI-met is able to predict a range of output parameters such as air temperature, wind speed, relative humidity, and other microclimate parameters, which are directly and extensively validated in previous works of the literature [56] The Numerical Simulation of the software provides the opportunity to study different types of greenery potential in controlling meteorological conditions. The software classified the greenery type on a scale from 1 to 6 as low, moderate, and high LAD. In this research, the results of developed greenery scenarios will be assessed quantitatively and qualitatively as each unit (tree) in the domain is included as is the shadow cast by the surroundings, the evapotranspiration for cooling effect is calculated by air and wind movement by applying the CFD model, and CFD analysis is normally conducted to predict the impact of vegetation on microclimate parameters and air pollution reduction. The module solar access of ENVI-met allows to conduct a quick but comprehensive analysis of solar radiation on all building facades, taking into account the environmental factors such as vegetation. Solar Access also generates long-term analyses of important climate parameters such as solar access and offers sophisticated three-dimensional analysis tools to calculate and trace the distribution of short-wave direct, diffused, and reflected solar radiation within the outdoor environment with a high temporal and spatial resolution. Inside the three-dimensional model, the irradiative fluxes are modified by plants and buildings. To estimate their effect on the irradiative conditions, the concept of flux reduction coefficients (σ) ranging from 1 for undisturbed fluxes to 0 for total absorption is used [57].
2.2. The Case Study Area
The main boulevard of the Dubai International Media Production Zone (IMPZ) is the case study canyon for this research. The media production city located in Dubai, UAE is a new development created in 2003 as a world-class ecosystem for media production, publishing, printing, and packaging. The city, which extends to 3.75 km2, and is still under construction, therefore, will be an opportunity to implement the findings of this study for optimizing the outdoor microclimate and thermal performance. The main boulevard is selected to study the impact of greenery on the microclimate parameters; the length of the case study boulevard is 480 m and the width is 80 m (Figure 1).
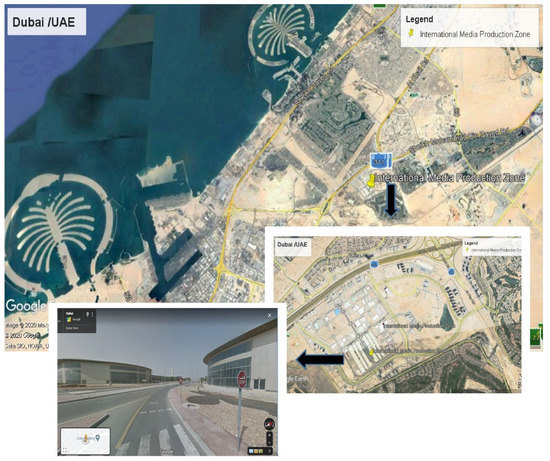
Figure 1.
The case study boulevard location and photo (Google, 2021).
2.3. The Case Study Area Weather Characteristics
The case study area, the United Arab Emirates (UAE) climate represents a hot, humid climate most of the year. In summer, the air temperature averages may exceed 45 °C. In winter, the weather is colder and the average air temperature is reduced to reach 15 °C. The weather can be classified within the desert zone. However, it has more humidity on average than the desert areas; in summer, the humidity may exceed 80% [58].
2.4. The ENVI-met Software Validation
The model of the selected case study boulevard has been validated using ENVI-met simulation software. The data were collected from three points located at two measurement sets using the environmental meter EXTECH 45170. The instrument recorded high accuracy in measuring environmental and microclimate data; the accuracy in measuring the air temperature reaches ±3%. The air temperature was collected from 14:00 to 15:30 on 21 June 2021 from the three indicated points (Figure 2). The average data of two measurement sets were compared to the simulation results data of the same date and time. The validation results for the air temperature showed that the maximum variation reaches 0.55 (Table 2). Simulating the model and the comparison between the actual field measurement data and the simulation data proved the validity of the software as the variation is less than 0.05 [59] (Figure 3).
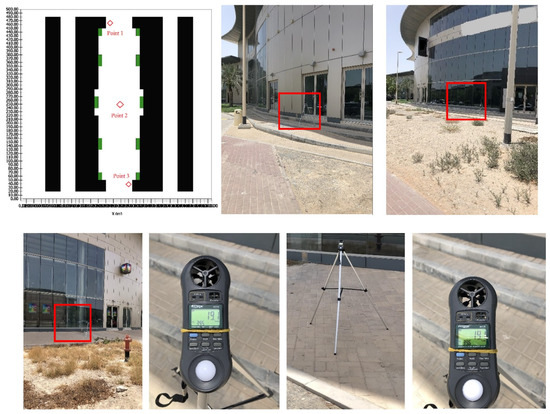
Figure 2.
Case study model and software validarion (Sundus Shareef, 2021).

Table 2.
Measured and simulated data for validation process on 21 June 2021.
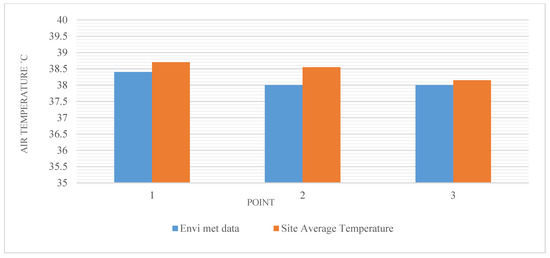
Figure 3.
Variation between measured and simulated air temperature data.
2.5. Model Description and Parametric Design Scenarios
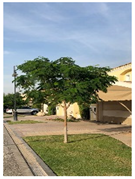
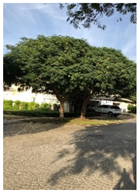
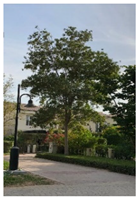
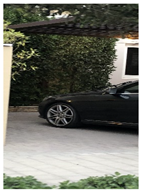
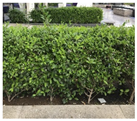
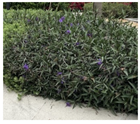
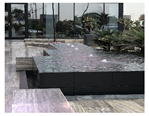
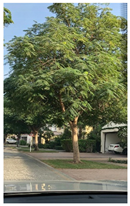
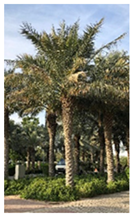
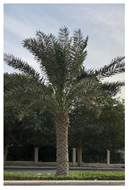
The case study boulevard has been modeled using the ENVI-met 4.4.5 reference case workspace, and the selected grid was a 500 × 500 grid point. The existing case represents the reference case or the reference model against the 11 developed scenarios of different greenery strategies. The main boulevard of the selected case study area consists of buildings with 12 m height, and a 15 m cylindrical tree for the corner buildings, the digital model, and the streets’ subdivisions illustrated in Figure 4. The reference model will be modified by developing 11 scenarios of greenery varied in types, height, and Leaf Area Density (LAD). The modification will be applied in the boulevard on two subdivisions, the median strip, and the pedestrian area. Between the light, moderate, and high LAD greenery, most of the previous studies proved the effectiveness of intensive greenery in reducing air temperature and the impact of UHI in hot climate areas. This study will start from where the previous research ends, investigating the impact of intensive greenery but with different vegetation types and LAD. The greenery description of the reference case and the proposed scenarios are illustrated in Table 3. Since one of this study’s objectives is focusing on greenery types and the local microclimate of the UAE, the greenery types have been chosen from the UAE environment. Evenly distributed street trees were designed and planted in scenarios; the photos in Table 3 show the typical street vegetation and trees in Dubai, which proved the high performance of adaptation to the hot, humid climatic conditions of the city most days of the year. The simulation metrological data and the setup conditions for the reference case and all simulated scenarios are shown in Table 4.
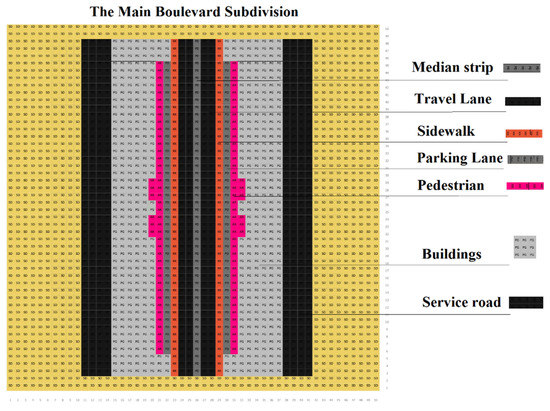
Figure 4.
The ENVI-met model of the boulevard layout and subdivisions.

Table 3.
Developed scenarios description, UAE local greenery types, and the boulevard implantation areas.

Table 4.
Initial physical and microclimate input data in the typical configuration file in ENVI- met.
2.6. Outcome Parameters and Data Analysis
Meteorological variables, including air temperature, relative humidity, and wind speed, were set as an initial condition in the ENVI-met guide files to calculate thermal performance for every grid point; the model boundary and initial conditions are presented in Table 4. The selected domain is 500 × 500 grid points, and the results data was collected at three levels: (1) pedestrian 1.4 m, canopy 13 m, and boundary 18 m. The output meteorological parameters extracted from the simulation results include: (1) air temperature, (2) wind speed, and (3) relative humidity, in addition to (4) the shortwave reflection. The simulation day is the longest day of the year, 21 June, and the 24 h simulation time period covers the daytime starting before sunrise and the solar radiation effect, as the solar radiation largely influences the UHI.
3. Results and Discussion
3.1. The impact of Greenery on UHI and Microclimate Parameters at the Pedestrian Level
The simulation results showed that the impact of the greenery on the boulevard microclimate parameters are varied according to the UHI evaluated layer from one side and the type of vegetation applied from the other side. Simulating the developed scenarios of different greenery types showed significant variation in microclimate parameters, specifically, the air temperature reduction at the pedestrian level. At this level, the 12 m tree in the pedestrian pathway was the most effective vegetation in reducing the air temperature; the variation between this scenario and the reference case reaches 0.70 °C. This result was followed by another scenario of dense greenery type, the cylindrical tree, which recorded a variation in air temperature of 0.66 °C compared to the reference case. The 10 m trees have also an influence effect on reducing the air temperature by 0.5 °C, while using the water for cooling purposes reduced air temperature by 0.41 °C compared to the reference case. However, the green façade and green roof scenarios showed an approximated performance with a reduction of 0.27 °C and 0.3 °C, respectively, while the palm tree reduced the temperature by 0.4 °C at this level (Figure 5).
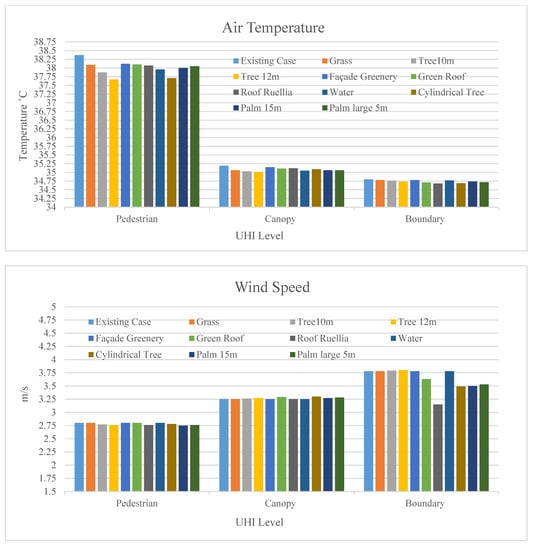
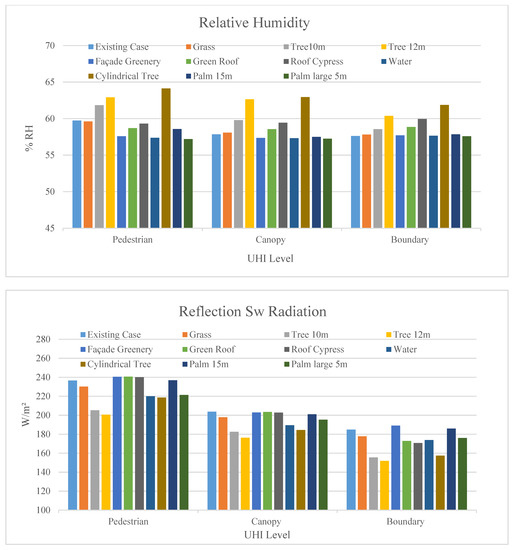
Figure 5.
The impact of the 10 greenery scenarios on the microclimate parameters: air temperature, wind speed, relative humidity, and shortwave reflection.
For the wind speed parameter, most of the vegetation scenarios showed similar performance in this level with a variation less than 0.1 m/s compared to the reference case. Only the scenario of the green roof with 50 cm vegetation recorded a slight increase in wind speed by 0.1 m/s compared to the reference case. On the other hand, the relative humidity of the proposed greenery scenarios at this level varied significantly; the results proved that the high and dense trees increase the relative humidity. The most effective type was the cylindrical tree with an increase of 12.33% compared to the reference case, followed by the 12 m and 10 m trees with an increase of 3.2% and 2.1%, respectively. The scenario of water recorded the lowest value, followed by the two palm scenarios that recorded a reduction in relative humidity of 2.6% and 1.2%, respectively, while the 50 cm green grass has no notable effect on relative humidity compared to the reference case at the pedestrian level. Furthermore, the simulation results in asses the short wave reflection of each scenario. In general, the reflection of the short wave has fluctuated significantly according to the greenery type at the pedestrian level. The most effective greenery type in absorbing the radiation was the 12 m and 10 m trees with a reduction in the reflected ratio by 36.07 W/m2 and 31.45 W/m2, respectively, compared to the reference case. The cylindrical tree and the water scenario showed an effective performance in reducing shortwave reflection by 17.94 W/m2 and 16.54 W/m2, respectively. On the other hand, the reference case showed a better performance in reducing the shortwave impact on the pedestrian level compared to the green roof and green façade. Whereas the palm tree 15 m showed a slight reduction of 0.21 W/m2, the large 5 m palm was more effective in reducing the impact of the shortwave with a reduction of 15.22 W/m2 compared to the reference case at pedestrian level, the 50 cm grass has also an acceptable performance by reducing the shortwave impact 6.48 W/m2 compared to the reference case (Figure 5) (Appendix A).
3.2. Canopy Layer and the Most Affected Microclimate Parameters
The air temperature of developed scenarios for the case study boulevard showed a slight variation within the canopy level compared to the pedestrian level. However, all the types of vegetation recorded lower air temperature compared to the reference case with a slight reduction of around 0.2 °C. The façade greenery and the green roof showed the most approximate values to the air temperature of the reference case. However, the 10 m tree and 15 m cylindrical tree are more effective in reducing the air temperature of this layer than the green roofs. The wind speed profile of the investigated scenarios showed similar performance of the pedestrian level as no significant variation recorded. On the other hand, the relative humidity in the canopy layer has significantly affected by applying different greenery, most of the greenery applied recorded a relative humidity higher than the reference case except for the façade greenery, water, and palm scenarios. However, cylindrical, 12 m, and 10 m trees recorded an increase in the relative humidity by 5.11%, 4.90%, and 2.0%, respectively. This increase in relative humidity related to the dense and high LAD that affects this layer, specifically for the leafless base trees and crown top. The least humidity recorded by the façade greenery and water scenarios with a reduction of 0.5% compared to the reference case; the 15 m palm and large 5 m palm also recorded less humidity compared to the existing case with a variation of 0.35% and 0.6%, respectively.
The shortwave reflection in this layer has also varied between the greenery different scenarios and showed almost similar performance to the pedestrian level as the best performance in reducing the shortwave impact recorded by 12 m, 10 m, and cylindrical trees due to the high leaf performance, and they were followed by the water scenario. However, the 15 m palm was has the same effectiveness in reducing shortwave reflection compared to the pedestrian level, as it reduced the wave impact by only 2.81 W/m2 compared to the reference case, but the large 5 m palm has a higher impact and reduced the shortwave reflection by 8.43 W/m2 compared to the reference case (Figure 5) (Appendix A).
3.3. Boundary Layer and the Effect of Different Greenery Scenarios
The results showed that all of the developed scenarios reduced air temperature in the boundary layer with a slight variation compared to the reference case. However, the most effective scenarios of greenery in reducing air temperature of this level were the green roofs, cylindrical trees, and palm trees, while the 50 cm green grass and water scenarios did not show any notable impact in reducing the temperature at this level. On the other hand, the same mentioned effective scenarios have a notable impact on the wind speed compared to the reference case at this level. The Ruellia green roof reduced the wind by 0.2 m/s, followed by the cylindrical trees and palms, which reduced wind speed by 0.3 m/s compared to the reference case. This reduction in wind speed is related to the obstacles created by the leaves of these greenery types. The impact of greenery on the relative humidity showed a clear variation in this level, however, this variation is less compared to the canopy and pedestrian levels. The 15 m cylindrical tree and the roof with Ruellia greenery recorded higher relative humidity compared to the reference case in this level, with values of 4.3%, 2.8%, and 2.3%, respectively. At this level, the greenery scenarios showed a different performance against the reflection of the shortwave radiation compared to the pedestrian and canopy levels. Most of the scenarios showed a positive impact on reducing the effect of the shortwave radiation by reducing the reflection; the most effective scenarios were the 10 m and 12 m trees, in addition to the 15 m cylindrical tree. Moreover, green roofs played a notable role in reducing the impact of the short wave in this level, by reducing the reflection 14.1 W/m2 compared to the reference case (Figure 5) (Appendix A).
3.4. Urban Greenery and Cooling Effect in the UAE and Gulf Region Climate Conditions
The UAE and Arabian Gulf climate is characterized as more humid than other areas with hot, desert climatic conditions. This study aimed to investigate the impact of greenery on UHI at different levels and evaluate different vegetation impacts within the UAE environment and climate conditions. Simulating the existing case of the selected boulevard and the 10 developed scenarios showed some significant results. Different types of greenery were investigated and compared to each other and to the reference case; the solar radiation and CFD simulation results were extracted at three levels: pedestrian at 1.4 m, canopy at 13 m, and boundary at 18 m.
3.5. The Impact of the Developed Scenarios on Cooling Parameters
Generally, for the reference case and all scenarios, the air temperature decreased as it moved upward toward the boundary level for all greenery types. The variation in air temperature in the pedestrian level between all scenarios reaches 3.0 °C, while this variation significantly decreases in the canopy and boundary layers to reach 1.0 °C and 0.5 °C, respectively (Figure 6). In terms of the investigated microclimate indicators, air temperature, wind speed, relative humidity, and shortwave reflection, for all simulated greenery scenarios the air temperature of the boulevard decreased compared to the reference case at the three levels. However, this reduction varied according to the different types of greenery; the results showed that the 12 m and cylindrical trees with high LAD are the most effective types in reducing air temperature in both pedestrian and canopy levels. While the green roof affected more pedestrian and boundary levels, it does not show a notable impact on the canopy air temperature. This result could be related to the results section of the canopy layer as it represents the average height of the buildings. However, the roof greenery type plays an important role in reducing the other two layers’ air temperature, and for the denser and higher LAD type of roof, the ‘Ruellia’ greenery is more effective, especially in reducing the boundary layer temperature. It is important to mention that the local famous tree, the ‘Palm’ with the medium LAD, showed a good performance in reducing air temperature in the three layers. With respect to water, it mostly affects the pedestrian level due to the evaporative cooling process, while it has no notable impact on the canopy and boundary air temperatures. From this result, it could be predicted that using the water at the building’s roof would have a positive impact on reducing the air temperature within this layer. Furthermore, the results showed that the wind speed in the pedestrian and canopy layer dose not affected by the investigated greenery types. Opposite to that, some greenery types showed a significant impact on the wind velocity of the boundary layer.
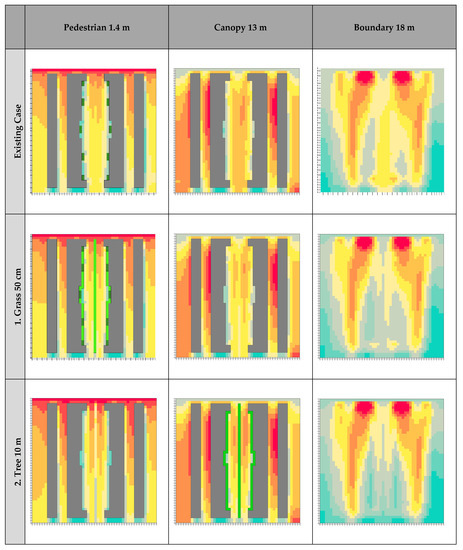
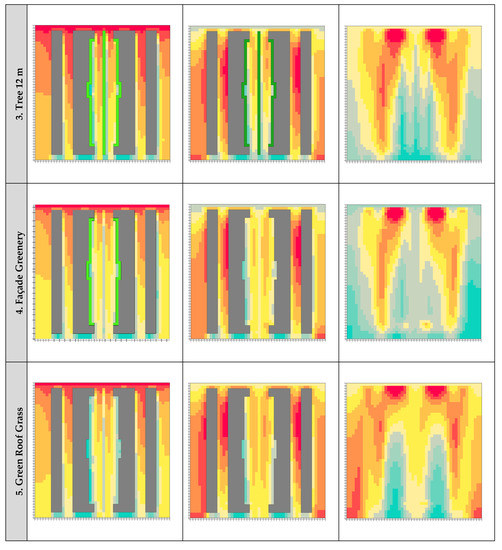
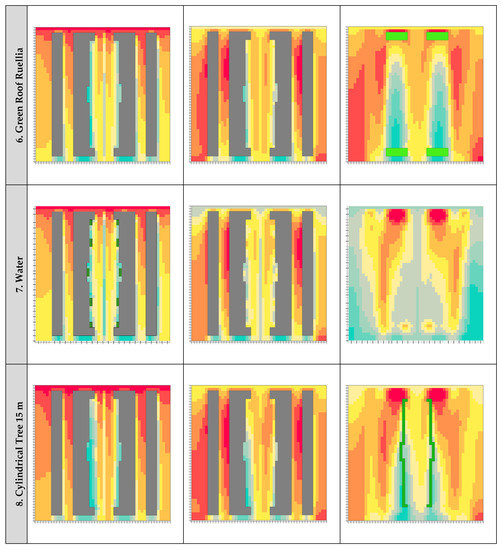
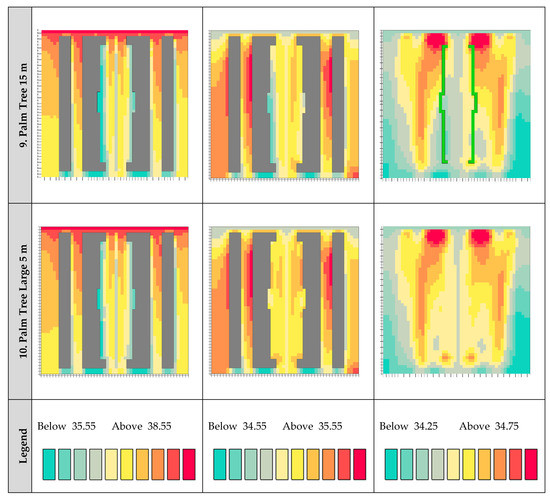
Figure 6.
Air temperature °C distribution at the three investigated levels of UHI at the maximum temperature at 15:00 p.m. on 21 June 2021.
The most effective greenery on reducing wind speed of this level was the ‘Ruellia’ green roof followed by the other type of roof greenery. The palm trees and the cylindrical tree are also showed a significant impact in reducing wind speed in this layer due to the height and high LAD; the reduction in this layer could have a positive consequent impact on reducing particle pollution as well. The relative humidity results showed approximately the same pattern for all greenery types in the three levels. The variation in the relative humidity between the three levels is small and decreases towards the boundary layer. However, it is important to mention that some types of greenery increased the relative humidity in the three levels compared to the reference case. The most notable increase was recorded by cylindrical trees due to the high LAD, followed by 12 m and 10 m trees; these types of greenery, in spite of their performance in reducing air temperature, increased the relative humidity at the pedestrian level, which is not preferable in the humid weather conditions of the UAE. However, other types of investigated greenery reduced the humidity compared to the reference case. The palm trees showed a positive impact on reducing the relative humidity; these results prove the suitability of ‘Palm’ trees for the UAE and its environmental and climate conditions.
3.6. The Optimized Proposal for the Case Study Boulevard
An optimized proposal for the boulevard vegetation design has been developed and simulated. The proposal adopted the most effective greenery that recorded a significant reduction in the boulevard air temperature and played an impressive role in mitigating the UHI in the three levels. The cylindrical, 10 m, and 12 m trees, as well as palm, grass, green roof, and water fountain, have been used in the suggested, optimized scenario.
The strategy of developing the optimized scenario was based on using the most environmentally adapted types that could have a significant impact on reducing the outdoor air temperature without a notable increase in the relative humidity; this was achieved by integrating the high and medium LAD types. The palm trees were used for the median strip, and a small number of cylindrical trees were applied in the pedestrian pathway, in addition to adopting the benefit of the grass in the median strip and the pedestrian pathway next to the buildings. The green roof was used in the optimized proposal since it showed a significant impact on boundary layer air temperature, which will consequently have a positive impact on the total atmosphere.
The results of the proposal have been evaluated against the reference case; the optimized proposal recorded an air temperature of 35.96 °C with a reduction of 2.41 °C compared to the reference case at pedestrian level. Further, the optimized proposal recorded a reduction in the shortwave reflection 16.73 W/m2 compared to the reference case and a slight reduction of 1.2% in the relative humidity at pedestrian level (Figure 7). However, the wind speed does not show any notable variation in the pedestrian and canopy level, while the wind speed in the boundary layer was the most affected parameter due to the impact of the cylindrical trees and the green roof: it recorded a reduction of 0.6 m/s compared to the reference case.
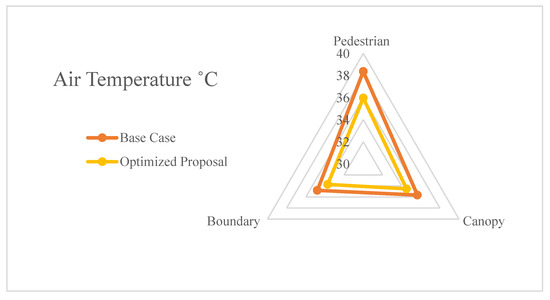
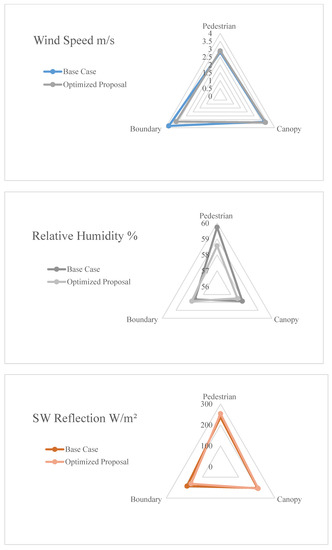
Figure 7.
Microclimate parameters of the optimized proposal compared to the reference case.
On the other hand, it has been observed that the distribution of the air temperature has varied from the reference case at the boundary layer, in spite of the slight reduction in total air temperature of this proposal compared to the reference case. This variation in air temperature distribution mainly related to the cylindrical trees and extensive roof greenery impact that trapped the temperature outside the planted areas. Moreover, it has been observed that in the canopy layer, the area surrounding the boulevard is more affected by the reduction in air temperature (Figure 8). The optimized proposal generally reduced the shortwave reflection of the three levels, however, it mostly affects the surrounded area due to the impact of the green roof and cylindrical trees (Figure 9).
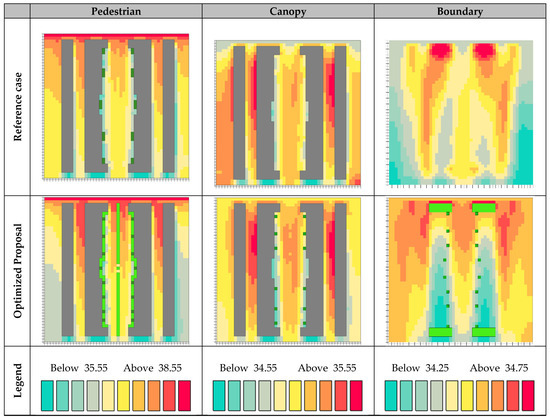
Figure 8.
Air temperature °C distribution of the reference case and the optimized proposal at the three investigated levels of UHI at the maximum temperature at 15:00 p.m. on 21 June 2021.
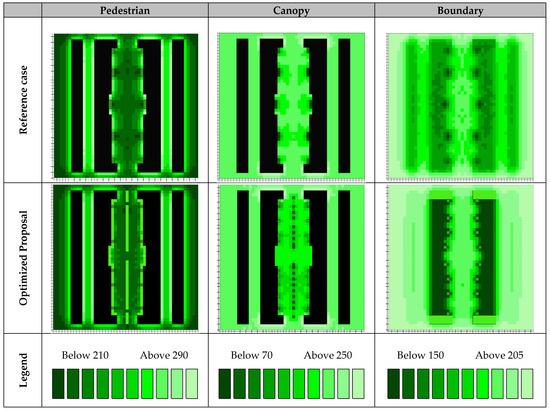
Figure 9.
Shortwave reflection (SW) W/m2 distribution of the reference case and the optimized proposal at the three investigated levels of UHI at the maximum temperature at 15:00 p.m. on 21 June 2021.
4. Conclusions
This research aimed to show the impact of different greenery scenarios on three levels of UHI rather than separate information for each level. Further, the impact of different types of greenery within the UAE climate conditions needs to be investigated and evaluated. The novelty of this research is providing a full image of the effect of different vegetation types on the pedestrian, canopy, and boundary UHI within the hot climate conditions of the UAE. The results showed that the 10 m and cylindrical tree types provide a cooling effect by reducing air temperature and solar radiation reflection on the three investigated levels. The reduction in air temperature at the pedestrian level for these two types reaches 0.7 °C and 0.5 °C, respectively. Furthermore, an optimized proposal for the main boulevard simulation results showed the potential of reducing the air temperature by 2.4 °C and the shortwave reflection by 16.73 W/m2 compared to the reference case. Whereas the green roofs did not have any impact on reducing the effect of the shortwave in pedestrian and canopy levels, they showed a different performance and played a notable role in reducing the impact of shortwave radiation in this level by reducing the reflection 14.1 W/m2 compared to the reference case. Based on the findings from this study, the ‘Palm’ tree was detected to be the most suitable greenery type for the investigated environment and climate conditions of the UAE. The Palm trees recorded a positive impact by enhancing the microclimate parameters as it reduced air temperature andrelative humidity as well as reflected shortwave radiation compared to the reference case and some other greenery types. Therefore, in humid weather conditions, adopting the palm for greenery would help in reducing air temperature and humidity compared to the other types of vegetation. Moreover, using green roofs and façade greenery would have a positive impact on reducing relative humidity on the pedestrian level. Furthermore, in spite of the fact that the cylindrical tree, or ‘Royal Poinciana’, is very common and has widespread use in the UAE public gardens and open areas, it is not recommended to be used on an extensive mode according to the high humidity performance proven by this type. It could be used on a moderated mode, as recommended in the optimized proposal. Finally, the results of this study will help in developing greening policies for the hot, humid, and Arabian Gulf regions, to enhance these areas’ microclimates and total atmosphere.
Funding
This research received no external funding.
Informed Consent Statement
Not applicable.
Data Availability Statement
Not applicable.
Conflicts of Interest
The author declares no conflict of interest.
Appendix A
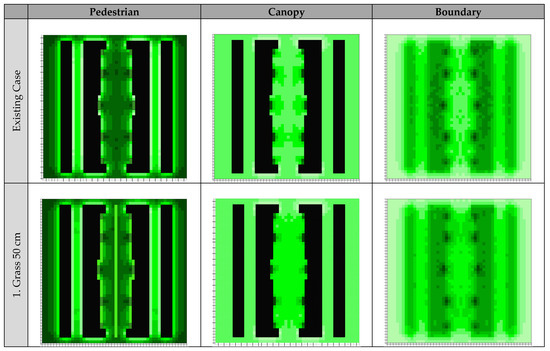
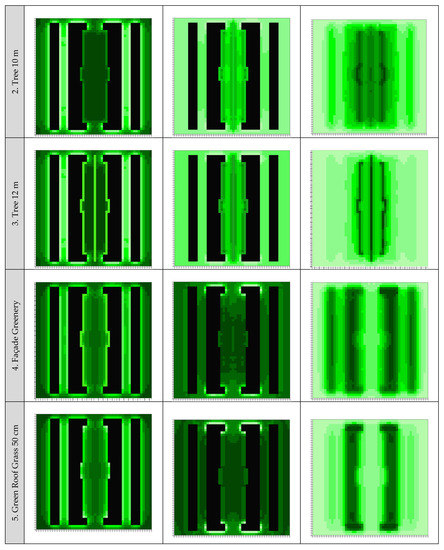
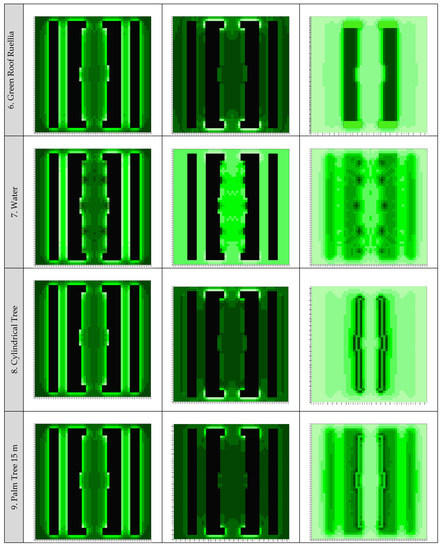
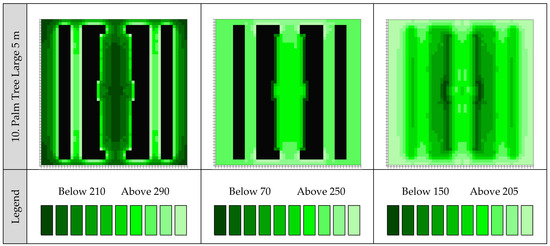
Figure A1.
Shortwave Reflection (SW) W/m2 Distribution at the Three Levels of UHI at the Maximum Temperature on 21 June.
References
- Brazel, A.; Selover, N.; Vose, R.; Heisler, G. The tale of two climates-Baltimore and Phoenix urban LTER sites. Clim. Res. 2000, 15, 123–135. [Google Scholar]
- Stone, B.; Vargo, J.; Habeeb, D. Managing climate change in cities: Will climate action plans work? Landsc. Urban Plan. 2012, 107, 263–271. [Google Scholar]
- Ksiksi, T.S.; Al-Blooshi, L.S. Climate change in the UAE: Modeling air temperature using ARIMA and STI across four bio-climatic zones. F1000Research 2019, 8, 973. [Google Scholar]
- Oke, T.R. The distinction between canopy and boundary-layer urban heat islands. Atmosphere 1976, 14, 268–277. [Google Scholar]
- Santamouris, M.; Haddad, S.; Saliari, M.; Vasilakopoulou, K.; Synnefa, A.; Paolini, R.; Ulpiani, G.; Garshasbi, S.; Fiorito, F. On the energy impact of urban heat island in Sydney: Climate and energy potential of mitigation technologies. Energy Build. 2018, 166, 154–164. [Google Scholar]
- Zhao, F.; Martinez-Moyano, I.J.; Augenbroe, G. Agent-Based Modeling of Commercial Building Stocks for Policy Support. In Proceedings of the 12th Conference of International Building Performance Simulation Association, Sydney, Australia, 14–16 November 2011; pp. 2385–2392. [Google Scholar]
- Park, C. A Dictionary of Environment and Conservation, 1st ed.; Oxford University Press: Oxford, UK, 2007. [Google Scholar]
- Hesslerová, P.; Pokorný, J.; Huryna, H.; Seják, J.; Jirka, V. The impacts of greenery on urban climate and the options for use of thermal data in urban areas. Prog. Plan. 2021, in press. 100545. [Google Scholar]
- Ichinose, T.; Matsumoto, F.; Kataoka, K. Counteracting Urban Heat Islands in Japan. In Urban Energy Transition: From Fossil Fuels to Renewable Power; Droege, P., Ed.; Elsevier: Amsterdam, The Netherlands, 2008; pp. 365–380. [Google Scholar]
- Shareef, S.; Abu-Hijleh, B. The effect of building height diversity on outdoor microclimate conditions in hot climate. A case study of Dubai-UAE. Urban Clim. 2020, 32, 100611. [Google Scholar]
- Rizwan, A.M.; Dennis, L.Y.; Chunho, L. A review on the generation, determination and mitigation of Urban Heat Island. J. Environ. Sci. 2008, 20, 120–128. [Google Scholar]
- Che-Ani, A.I.; Shahmohamadi, P.; Sairi, A.; Mohd-Nor, M.F.I.; Zain, M.F.M.; Surat, M. Mitigating the urban heat island effect: Some points without altering existing city planning. Eur. J. Sci. Res. 2009, 35, 204–216. [Google Scholar]
- Danielson, E.W.; Levin, J.; Abrams, E. Meteorology; McGraw Hill: New York, NY, USA, 2003. [Google Scholar]
- Szokolay, S.V. Introduction to Architectural Science: The Basis of Sustainable Design, 2nd ed.; Elsevier/Architectural Press: Amsterdam, The Netherlands, 2008. [Google Scholar]
- Garratt, J.R. The Atmospheric Boundary Layer; Cambridge University Press: Oxford, UK, 1994. [Google Scholar]
- Kaimal, J.C.; Finnigan, J.J. Atmospheric Boundary Layer Flows: Their Structure and Measurement; Oxford University Press: Oxford, UK, 1994. [Google Scholar]
- Oke, T.R. City size and the urban heat island. Atmos. Environ. (1967) 1973, 7, 769–779. [Google Scholar]
- Oke, T.R. Boundary Layer Climates, 2nd ed.; Taylor & Francis: London, UK, 2002. [Google Scholar]
- Morakinyo, T.E.; Lau, K.; Ren, C.; Ng, E. Performance of Hong Kong’s common trees species for outdoor temperature regulation, thermal comfort and energy saving. Build. Environ. 2018, 137, 157–170. [Google Scholar]
- Pichierri, M.; Bonafoni, S.; Biondi, R. Satellite air temperature estimation for monitoring the canopy layer heat island of Milan. Remote Sens. Environ. 2012, 127, 130–138. [Google Scholar]
- Saitoh, T.S.; Shimada, T.; Hoshi, H. Modeling and simulation of the Tokyo urban heat island. Atmos. Environ. 1996, 30, 3431–3442. [Google Scholar]
- Peng, S.; Piao, S.; Ciais, P.; Friedlingstein, P.; Ottle, C.; Bréon, F.; Nan, H.; Zhou, L.; Myneni, R. Surface Urban Heat Island Across 419 Global Big Cities. Environ. Sci. Technol. 2012, 46, 696–703. [Google Scholar]
- Lindberg, F.; Grimmond, C.S.B. Nature of vegetation and building morphology characteristics across a city: Influence on shadow patterns and mean radiant temperatures in London. Urban Ecosyst. 2011, 14, 617–634. [Google Scholar]
- United States Environmental Protection Agency. U.S. EPA. 2021. Available online: https://www.epa.gov/sites/production/files/201705/documents/reducing_urban_heat_islands_ch_5.pdf (accessed on 7 March 2021).
- Wanphen, S.; Nagano, K. Experimental study of the performance of porous materials to moderate the roof surface temperature by its evaporative cooling effect. Build. Environ. 2009, 44, 338–351. [Google Scholar]
- Hirano, Y.; Fujita, T. Evaluation of the impact of the urban heat island on residential and commercial energy consumption in Tokyo. Energy 2012, 37, 371–383. [Google Scholar]
- Yue, W.; Liu, X.; Zhou, Y.; Liu, Y. Impacts of urban configuration on urban heat island: An empirical study in China mega-cities. Sci. Total Environ. 2019, 671, 1036–1046. [Google Scholar]
- Tan, P.; Ismail, M. Building shade affects light environment and urban greenery in high-density residential estates in Singapore. Urban For. Urban Green. 2014, 13, 771–784. [Google Scholar]
- Shareef, S. The impact of urban morphology and building’s height diversity on energy consumption at urban scale. The case study of Dubai. Build. Environ. 2021, 194, 107675. [Google Scholar]
- Ali-Toudert, F.; Mayer, H. Effects of asymmetry, galleries, overhanging façades and vegetation on thermal comfort in urban street canyons. Sol. Energy 2007, 81, 742–754. [Google Scholar]
- Ghazalli, A.J.; Brack, C.; Bai, X.; Said, I. Alterations in use of space, air quality, temperature and humidity by the presence of vertical greenery system in a building corridor. Urban For. Urban Green. 2018, 32, 177–184. [Google Scholar]
- Richards, D.R.; Fung, T.K.; Belcher, R.N.; Edwards, P. Differential air temperature cooling performance of urban vegetation types in the tropics. Urban For. Urban Green. 2020, 50, 126651. [Google Scholar]
- Speak, A.; Montagnani, L.; Wellstein, C.; Zerbe, S. The influence of tree traits on urban ground surface shade cooling. Landsc. Urban Plan. 2020, 197, 103748. [Google Scholar]
- Huang, Z.; Tan, C.L.; Lu, Y.; Wong, N.H. Holistic analysis and prediction of life cycle cost for vertical greenery systems in Singapore. Build. Environ. 2021, 196, 107735. [Google Scholar]
- Tsai, W.-L.; Davis, A.; Jackson, L.E. Associations between types of greenery along neighborhood roads and weight status in different climates. Urban For. Urban Green. 2019, 41, 104–117. [Google Scholar]
- Pan, L.; Wei, S.; Lai, P.Y.; Chu, L. Effect of plant traits and substrate moisture on the thermal performance of different plant species in vertical greenery systems. Build. Environ. 2020, 175, 106815. [Google Scholar]
- Wei, S.; Yin, T.; Dissegna, M.A.; Whittle, A.J.; Ow, G.L.F.; Yusof, M.L.M.; Lauret, N.; Gastellu-Etchegorry, J.-P. An assessment study of three indirect methods for estimating leaf area density and leaf area index of individual trees. Agric. For. Meteorol. 2020, 292–293, 108101. [Google Scholar]
- Kenney, W.A. Leaf Area Density as an urban forestry planning and management tool. For. Chron. 2000, 76, 235–239. [Google Scholar]
- Hashad, K.; Gu, J.; Yang, B.; Rong, M.; Chen, E.; Ma, X.; Zhang, K.M. Designing roadside green infrastructure to mitigate traffic-related air pollution using machine learning. Sci. Total Environ. 2021, 773, 144760. [Google Scholar]
- Soma, M.; Pimont, F.; Allard, D.; Fournier, R.; Dupuy, J.-L. Mitigating occlusion effects in Leaf Area Density estimates from Terrestrial LiDAR through a specific kriging method. Remote Sens. Environ. 2020, 245, 111836. [Google Scholar]
- Ouyang, W.; Morakinyo, T.E.; Ren, C.; Ng, E.Y.Y. The cooling efficiency of variable greenery coverage ratios in different urban densities: A study in a subtropical climate. Build. Environ. 2020, 174, 106772. [Google Scholar]
- Berardi, U.; Jandaghian, Z.; Graham, J. Effects of greenery enhancements for the resilience to heat waves: A comparison of analysis performed through mesoscale (WRF) and microscale (Envi-met) modeling. Sci. Total Environ. 2020, 747, 141300. [Google Scholar] [PubMed]
- Berardi, U. The outdoor microclimate benefits and energy saving resulting from green roofs retrofits. Energy Build. 2016, 121, 217–229. [Google Scholar]
- Jato-Espino, D.; Castillo-Lopez, E.; Rodriguez-Hernandez, J.; Ballester-Muñoz, F. Air quality modelling in Catalonia from a combination of solar radiation, surface reflectance and elevation. Sci. Total Environ. 2018, 624, 189–200. [Google Scholar]
- Shareef, S.; Altan, H. Sustainability at an Urban Level: A Case Study of a Neighborhood in Dubai, UAE. Sustainability 2021, 13, 4355. [Google Scholar]
- Geiger, R.; Aron, R.; Todhunter, P.; Geiger, R. The Climate Near the Ground; Rowman and Littlefield Publishers: Lanham, MD, USA, 2003. [Google Scholar]
- Taleghani, M.; Sailor, D.; Ban-Weiss, G.A. Micrometeorological simulations to predict the impacts of heat mitigation strategies on pedestrian thermal comfort in a Los Angeles neighborhood. Environ. Res. Lett. 2016, 11, 024003. [Google Scholar]
- Fortuniak, K. Numerical estimation of the effective albedo of an urban canyon. Arch. Meteorol. Geophys. Bioclimatol. Ser. B 2007, 91, 245–258. [Google Scholar]
- Christen, A.; Vogt, R. Energy and radiation balance of a central European city. Int. J. Climatol. 2004, 24, 1395–1421. [Google Scholar]
- Pawlak, W.; Fortuniak, K.; Podstawczynska, A. The influence of urban canyon parameters on downward total solar radiation values–measurements and modelling. DWD Ann. Meteorol. 2005, 41, 200–203. [Google Scholar]
- Marciotto, E.R.; Oliveira, A.; Hanna, S.R. Modeling study of the aspect ratio influence on urban canopy energy fluxes with a modified wall-canyon energy budget scheme. Build. Environ. 2010, 45, 2497–2505. [Google Scholar]
- Lobaccaro, G.; Acero, J.A. Comparative analysis of green actions to improve outdoor thermal comfort inside typical urban street canyons. Urban Clim. 2015, 14, 251–267. [Google Scholar]
- ENVI_MET. ENVI_MET—Decoding Urban Nature. 2020. Available online: http://www.envi-met.com/ (accessed on 1 March 2021).
- Simon, H.; Lindén, J.; Hoffmann, D.; Braun, P.; Bruse, M.; Esper, J. Modeling transpiration and leaf temperature of urban trees—A case study evaluating the microclimate model ENVI-met against measurement data. Landsc. Urban Plan. 2018, 174, 33–40. [Google Scholar]
- Mushtaha, E.; Shareef, S.; Alsyouf, I.; Mori, T.; Kayed, A.; Abdelrahim, M.; Albannay, S. A study of the impact of major Urban Heat Island factors in a hot climate courtyard: The case of the University of Sharjah, UAE. Sustain. Cities Soc. 2021, 69, 102844. [Google Scholar]
- Bruse, M. The Influences of Local Environmental Design on Microclimate. Ph.D. Thesis, University of Bochum, Bochum, Germany, 1999. (In German). [Google Scholar]
- Bruse, M.; Fleer, H. Simulating surface—plant—air interactions inside urban environments with a three dimensional numerical model. Environ. Model. Softw. 1998, 13, 373–384. [Google Scholar]
- Dubai International Airport Weather Station Data—Dubai. Available online: https://www.avmet.ae/omdbfc.aspx (accessed on 1 March 2021).
- Rahman, M.M.; Rasul, M.G.; Khan, M.M.K. Energy Conservation Measures in a Nine Situational Building by Dynamic Simulation Using Design Builder. In Proceedings of the Third International Conference on Energy and Cambridge Environment, Cambridge, UK, 23–25 February 2008. [Google Scholar]
Publisher’s Note: MDPI stays neutral with regard to jurisdictional claims in published maps and institutional affiliations. |
© 2022 by the author. Licensee MDPI, Basel, Switzerland. This article is an open access article distributed under the terms and conditions of the Creative Commons Attribution (CC BY) license (https://creativecommons.org/licenses/by/4.0/).
