1. Introduction
In the past few decades, the global food production system witnessed the emergence of many different certification body standards, each with its trajectory and focus, attempting to address the negative features that underlie global food supply chains [
1]. From Organic, Biodynamic, UTZ Certified, Child Labour Free, Animal Welfare Approved, and Fairtrade, standards and certifications cover almost every ethical issue involved in food production such as environment protection, health, social justice, and animal welfare [
2]. In this scenario, Fairtrade (FT) is the most recognised certification system in the world that deals with social justice and fairness in trade today [
3]. FT attempts to address one of the most ambitious goals: to enable the producers to control and fair conditions over the trading process, proposing “an alternative approach to conventional trade based on a partnership between producers and traders, businesses and consumers, that seeks greater equity in international trade” [
4]. FT aims to empower the most disadvantaged producers in developing countries to improve their businesses through international market access and greater control over the supply chain [
5]. It does so by imposing compliance with a set of social, environmental, and organisational standards that govern the production phases and the subsequent exchanges between traders and producers [
6]. Fairtrade International also works in many programs to promote gender equality, bolster marginalised farmers and the producers’ income, prevent and eliminate all forms of forced labour, child labour and human trafficking, and reduce the environmental impact [
4,
7].
Nowadays, FT encompasses 1.7 million farmers and workers, spread across 73 countries worldwide, producing goods sold in over 125 countries through different distribution channels [
8,
9].
FT standards are declining according to the different product categories, the roles within the supply chain (producers or traders) and organisation type (SPOs or HLs). The target of Fairtrade has traditionally been small producer organisations (SPO) due to their high number in developing countries and to the innate predisposition of cooperatives to being managed democratically [
10,
11]. Every small-scale producer of SPOs has a voice and vote in the organisation’s decision-making process, and profits should be equally distributed among them. First-level cooperatives can join together to form second-grade SPOs, build a stronger mutual economy, and take the cooperative model to scale [
12]. A first-grade organisation describes SPO whose legal members are exclusively individual farmers, while a second-grade organisation describes a SPO whose legal members are exclusively first-grade organisation affiliates. Hired labour (HL) standards do not apply to membership-based companies (i.e., farms, plantations, factories, manufacturing industries) that hire workers to meet their workforce needs. Instead, contract production standards are applied to small producer organisations with no formal structure or legal status [
7].
The inclusion of different organisation types is a relatively recent addition to the system [
11,
13]. Opening up to plantations and farms require different specific standards to be enhanced and has been greeted with scepticism by part of the FT advocates who feared the abandonment of FT’s original target and excessive control by the new actors involved [
13,
14].
Despite the extensive scientific literature on FT, little is still known about its functioning and impact on marginalised producers and their communities [
15,
16]. The complexity and heterogeneity of stories, organisations, and products within FT limit generalisations and compel researchers to contextualise each experience [
17,
18].
Moreover, research has been traditionally based on local case studies, mainly focusing on producer organisations in Central America and the West Indies and mainly focused on three products: coffee, bananas, and cocoa [
15,
16,
17]; data on a larger scale have rarely been analysed [
14,
15].
Although most research agrees that participation in FT brings direct economic benefits to farmers [
3,
19,
20,
21,
22,
23], the results present considerable differences [
24], and sometimes conflicting outcomes [
15,
16,
17,
25]. Schmelzer [
26] pointed out that FT income effects are remarkable if considered on an aggregate level, but are far more complicated when analysing organisations specifically or at the household level. Ruben and Fort [
20] found significant wealth effects but small income gains for organic and conventional coffee farmers in Peru who adopted the FT certification. Dragusanu and Nunn [
3] found an increase in the income among certified producers, but only for the most skilled growers and farm owners. Van Rijn et al. [
14] investigated the impact of FT certification on wageworkers’ banana plantations and found minimal economic improvement but evident benefits in job satisfaction, sense of ownership, and trust.
One of the elements often mentioned in the literature as a limiting agent for FT, while also risking jeopardizing the economic condition of the producers themselves, is linked to the low volumes of product that some producers are able to place on the FT market. Indeed, FT can represent the only sale channel for organisations, which in some cases manage to sell the integrity of their production on the FT market, or an alternative market outlet through which organisations sell just part of their production [
27,
28]. Méndez et al. [
21] found positive effects of the FT market’s involvement, but also that many certified farmers did not sell their entire production under the FT certification, and the average volume of coffee sold by individual households was low. This might cause a severe decrease in the net revenues of producer organisations, as they incur costs for meeting the FT standards [
21,
27,
29] and because an intense concentration on FT production leads producers to neglect other income-generating activities [
21,
30]. Furthermore, it has been argued that when the FT price is higher than the market equilibrium price, the supply of the product exceeds its demand, and producers are not able to sell their entire production at the FT conditions [
31,
32]. The remaining part of their product is then sold at the lower market price while incurring expenses related to FT certification standards [
27,
33].
Some researchers [
34,
35,
36] have highlighted concerns about growing entry barriers and more competitive conditions for current potential Fairtrade market entrants and recently certified organisations. Indeed, the literature reports cases in which organisations with a long involvement in the network have more significant control in the FT market [
37], which could result in an uneven distribution of market shares between producers.
The present study aims to return a comprehensive outline of the FT producer network with a special focus on the revenues that producer organisations derive from FT and other sales channels. We investigate how producers differently engage FT concerning intrinsic and extrinsic characteristics as the type of organisation, the duration of the involvement with FT, the type of product, the geographical location, or the approach that producers have toward the certified market. Studying the allocation of the revenues earned by producer organisations more analytically concerning FT’s stated goals and the previous findings from the literature can improve knowledge about the FT system operations. We also provide helpful information to address some of the longstanding disputes concerning the FT system highlighted in the literature by analysing the entire certified organisations’ network. This study analysed the features of FT organisations from the comprehensive dataset on certified producers worldwide collected by the Monitory, Evaluation and Learning (MEL) Program, which was provided by Fairtrade International. The database comprises the totality of certified producers including all kinds of certifiably organisations, countries, and products.
As FT is increasing its popularity among northern consumers [
18,
38,
39], a rigorous and comprehensive understanding of its functioning is more crucial than ever, at least for two fundamental reasons [
19]: (1) to build and strengthen a relationship of trust between the consumers, producers, and companies; and (2) to improve the FT system, identifying both the strengths and aspects that may be enhanced to better support producers and increase the effectiveness in achieving FT goals.
The rest of this paper is structured as follows.
Section 2 presents the database and methodology.
Section 3 and
Section 4 report the results of the descriptive statistics and regression models, and the last two sections focus on commenting on the findings and the conclusions and limitations.
3. Results
3.1. Descriptive Statistics
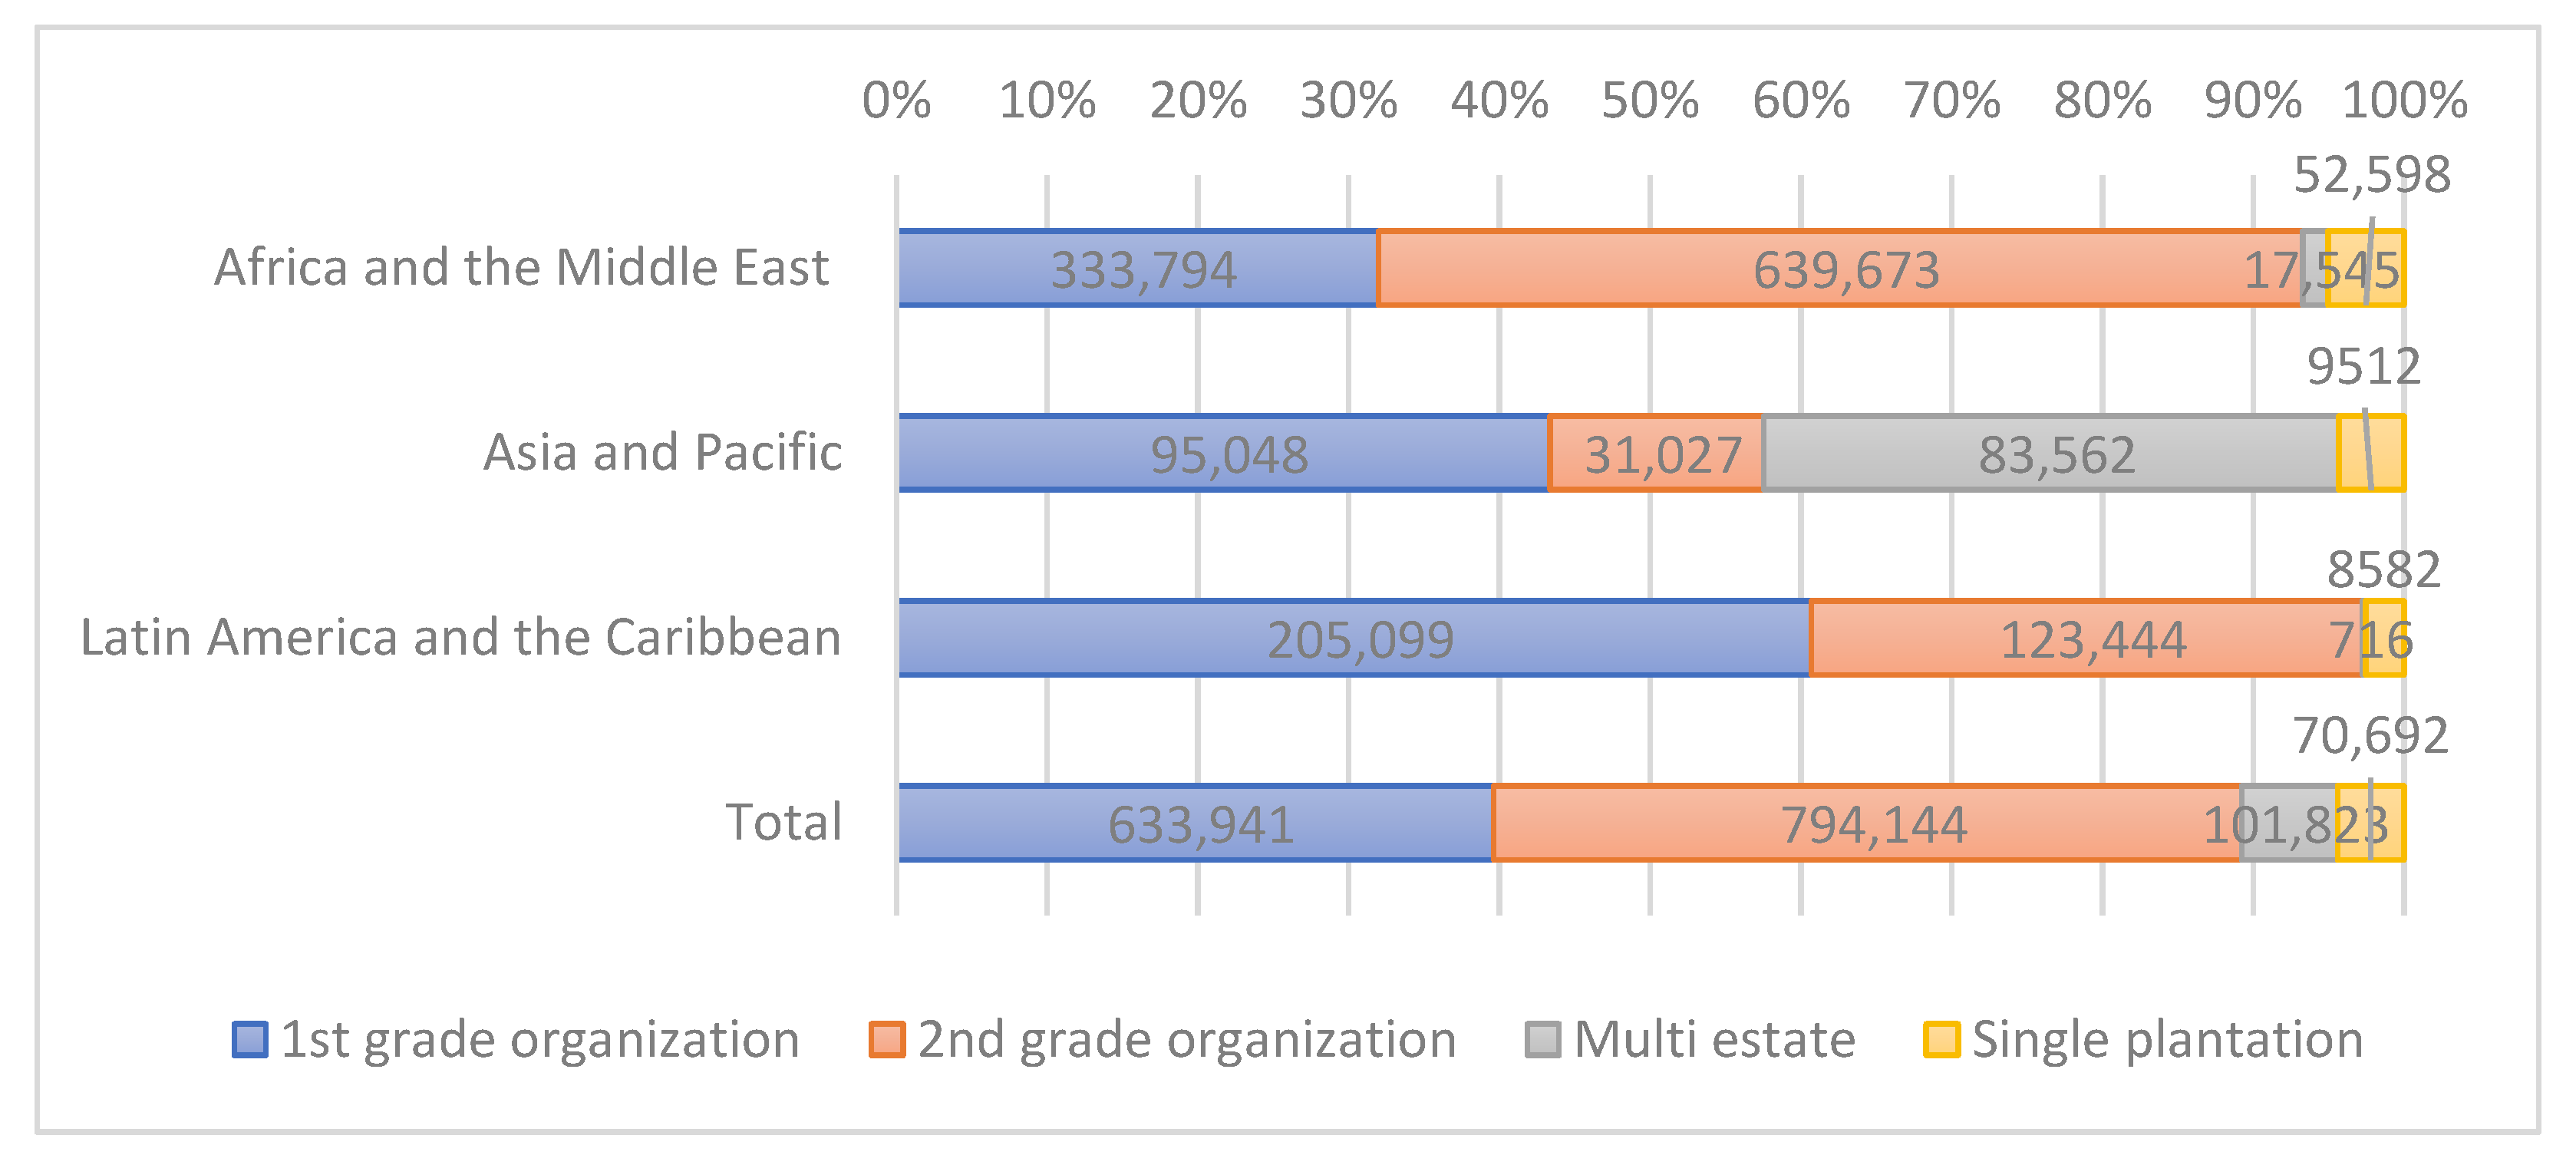
For the main part, FT operates with SPOs, representing hundreds of thousands of farming families and almost 90% of the total number of farmers involved in the FT network. HL organisations represent around 10% of the sample and only deal with specific products: bananas, fresh fruit, tea, and spices. HLs employ only 8% of the total workers. Factories are present in the Middle East (Pakistan), and gold miners are certified in South America (Peru), but they represent a small minority of the sample, and were excluded from the analysis (
Figure 1).
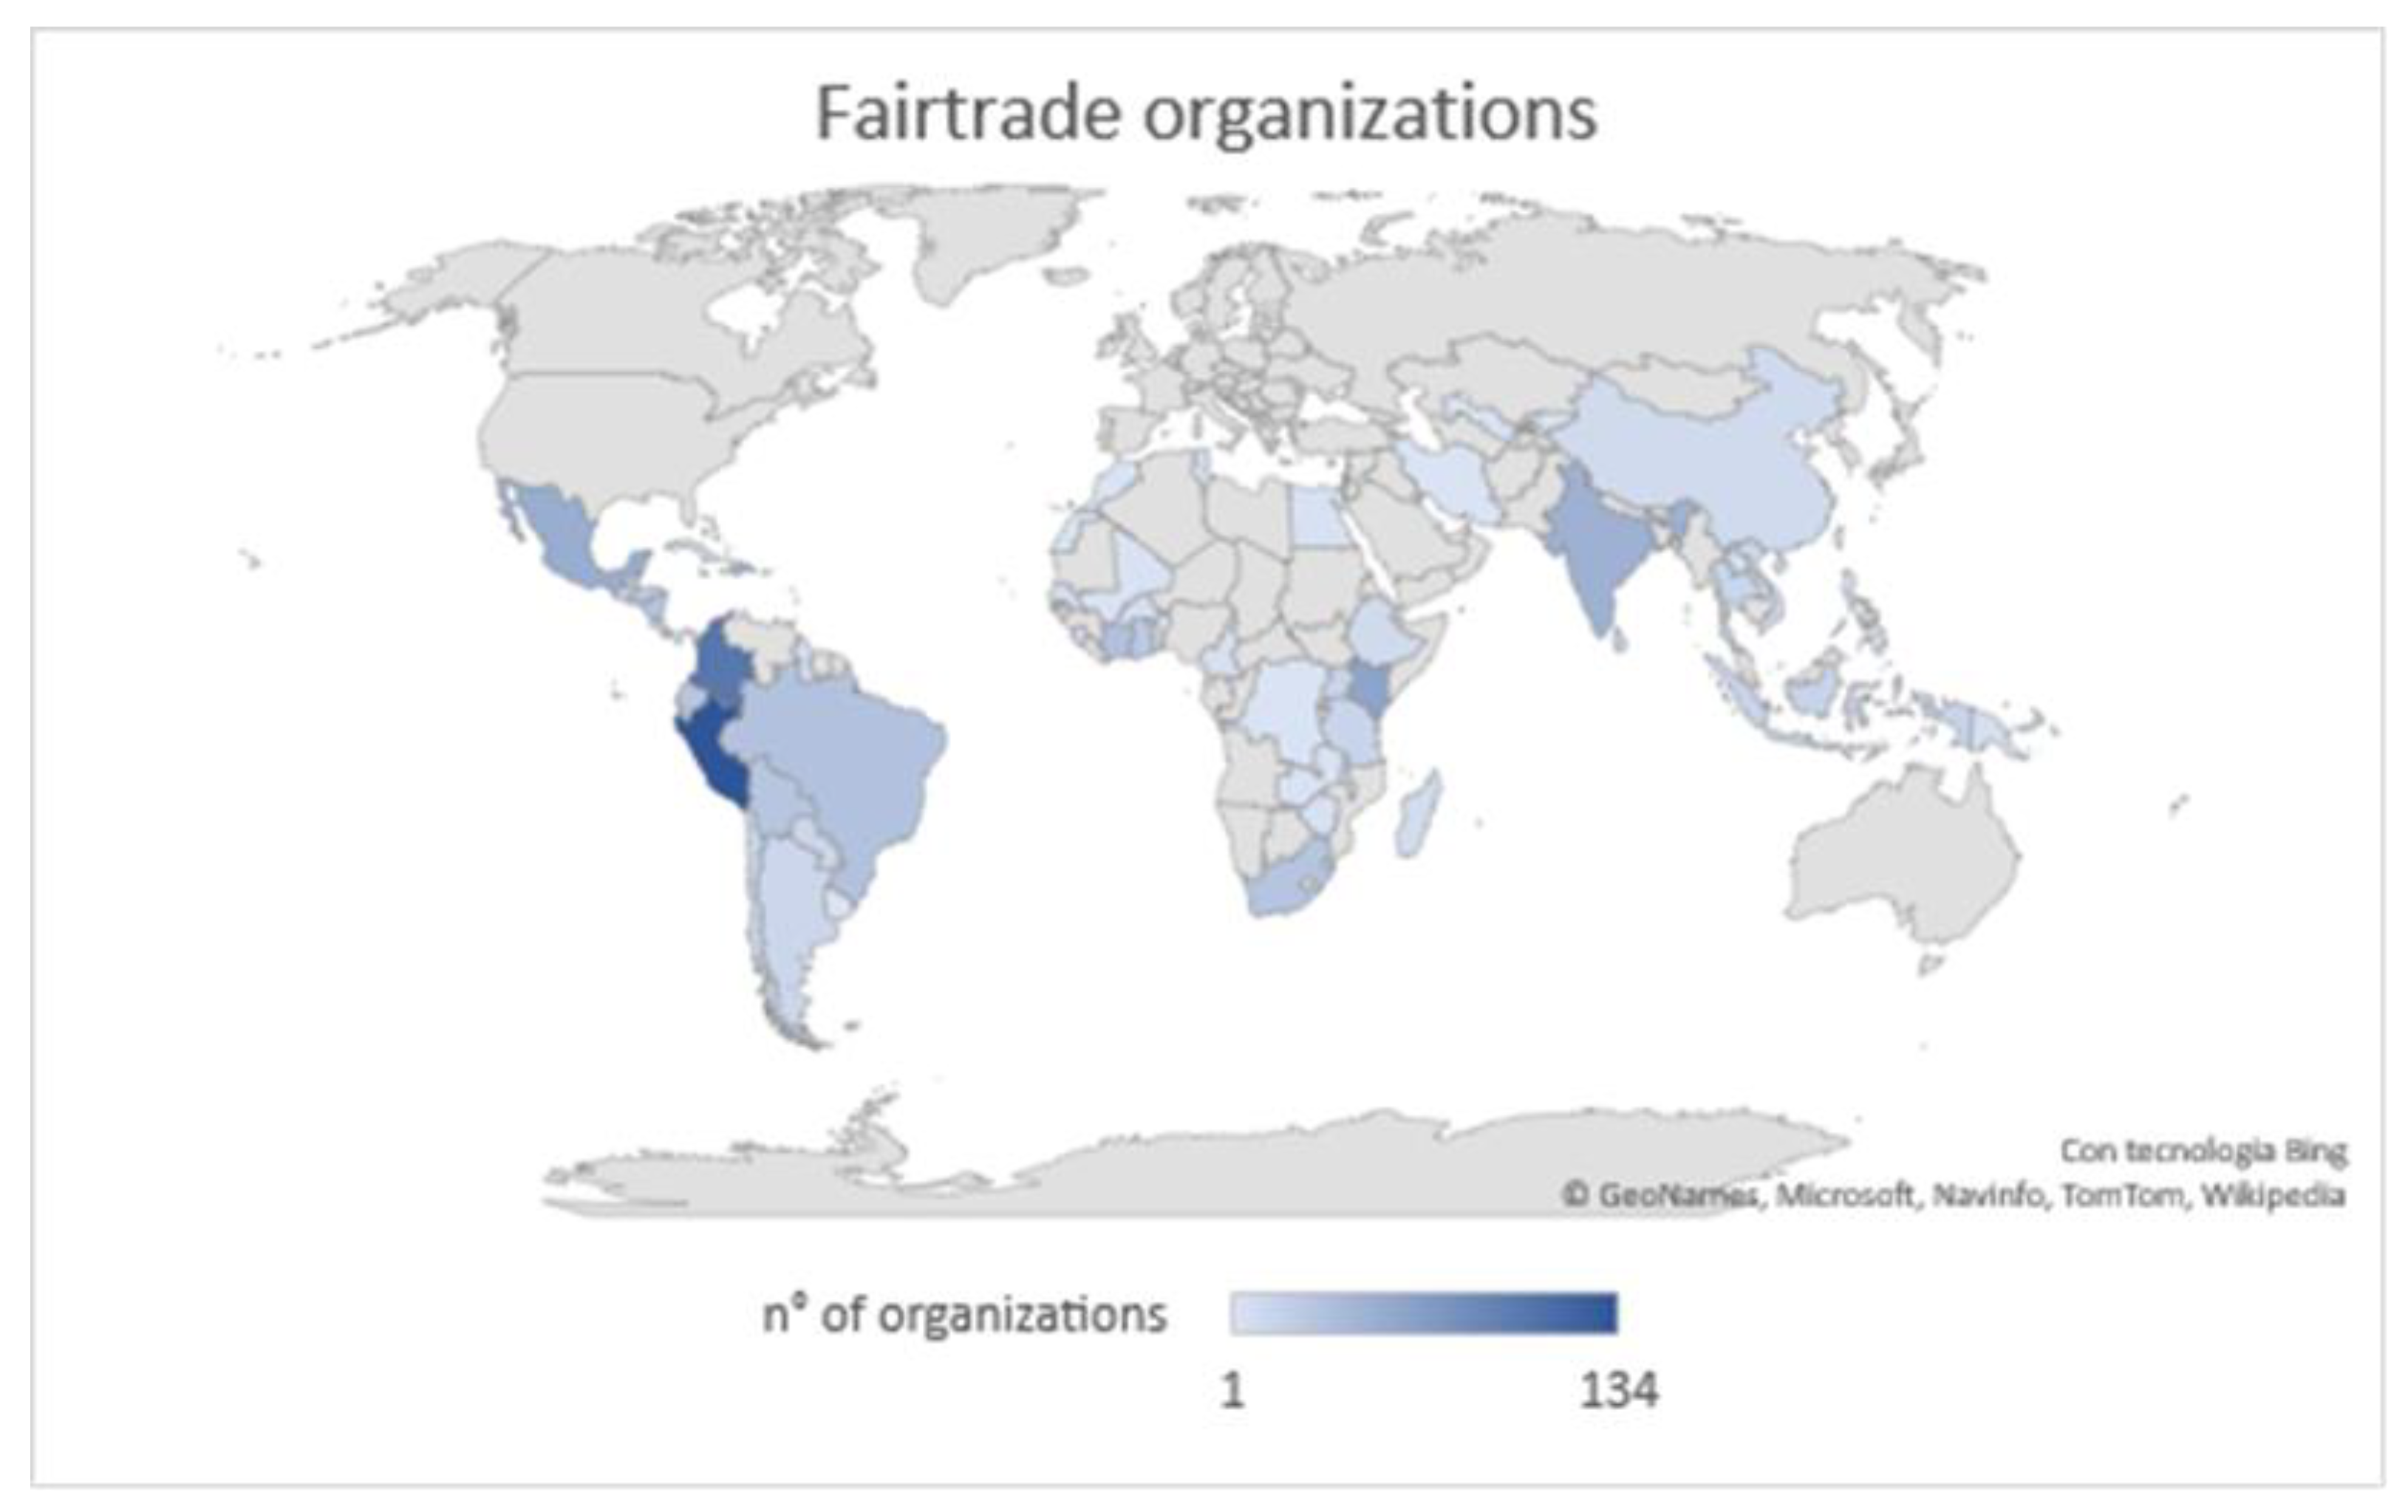
Almost half of the organisations operating with FT are in Latin America and the Caribbean, one third in Africa, and a smaller part in Asia and the Pacific (
Table 1 and
Figure 2). Considering all the organisations worldwide, the greatest concentration of producer organisations is in upper-middle-income countries (according to the World Bank analytical classification), the number decreasing along with a decrease in the level of the income category. Inspecting the distribution in the different macro-regions, we found that this trend was mainly due to Latin America and the Caribbean, while in Africa and Asia, most producers were in so-called lower-middle-income countries.
The distribution of workers in
Figure 3 shows that most of the farmers involved in the FT market were in Africa (57%), while 29% and 13% were in Latin America and Asia, which is mainly due to the large plantations of tea in Africa. The countries with more producer organisations were Peru, Colombia, India, Mexico, and Kenya, while the largest number of individual farmers were in Ethiopia, Kenya, Tanzania, India, Ghana, Peru, and Colombia. Inspecting the workforce composition, only 17% of SPOs members were represented by women, reflecting the difficulties women face in developing countries to secure property rights on land tenure and business. However, when HL organisations are considered, women represent half of the workforce. Many of the women in the FT network are employed in tea plantations, and the percentage of women is higher in low-income countries than in richer ones.
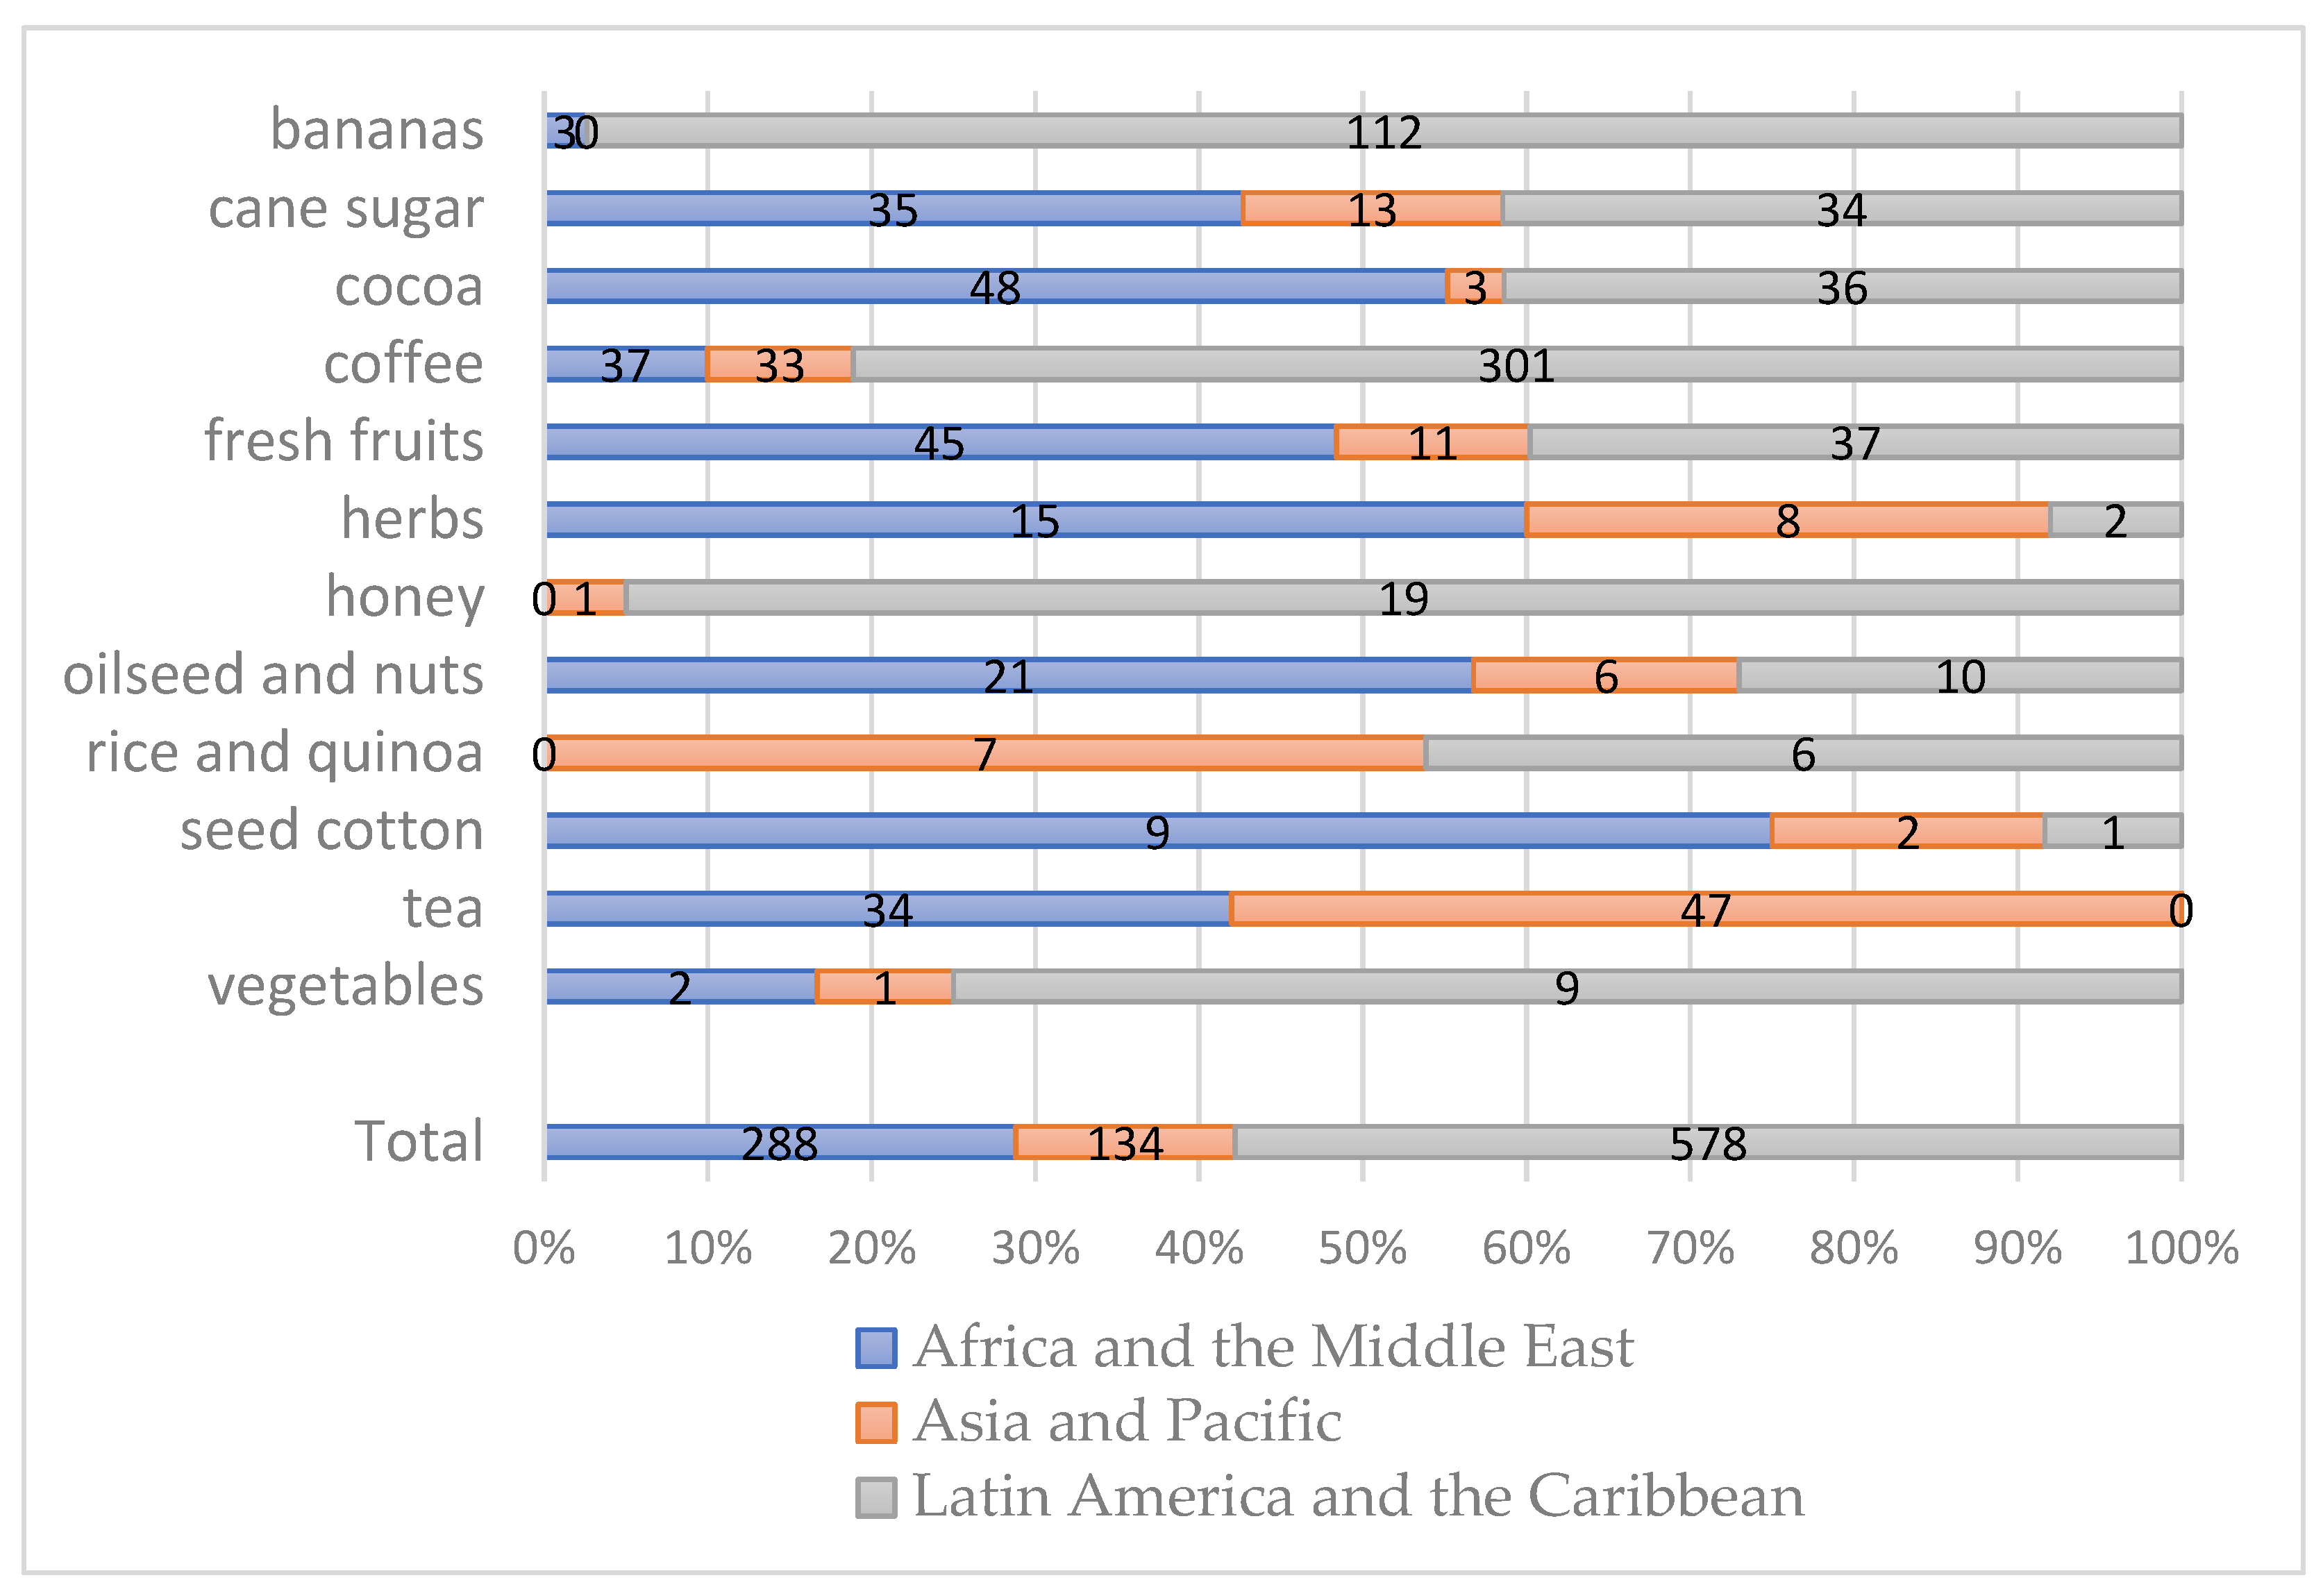
There are over 30,000 FT certified products on sale worldwide, and there are standards for both food and non-food products: the first category includes bananas, cocoa, coffee, dried fruits, fresh fruit and vegetables, honey, juices, nuts, oilseeds, oil, quinoa, rice, spices, sugar, tea, and wine; the former regards beauty products, cotton, flowers, ornamental plants, and sports balls. In recent times, projects on FT mining products like gold, silver, and platinum have been launched.
Figure 4 shows the distribution of producer organisations over products and the macro-regions where FT operates.
Not all certified organisations sell their whole production through the FT channel, mainly due to the FT market’s oversupply [
33,
37]. On average, as shown in
Figure 5 and
Figure 6, FT organisations sell around 60% of their production under FT certification, but substantial differences depend on the organisation and product type. The average percentage of products sold through the FT market is 35% for HL and 65% for SPOs. For bananas, cane sugar, and coffee, the percentage is around 60%, while for other products like tea, vegetables, and fresh fruits, it decreases to 15–30%. In addition, significant regional differences exist: Latin America and the Caribbean are commercialised through FT for more than 60% of their volume yearly, while it is only 36% African producers, and 41% in Asia.
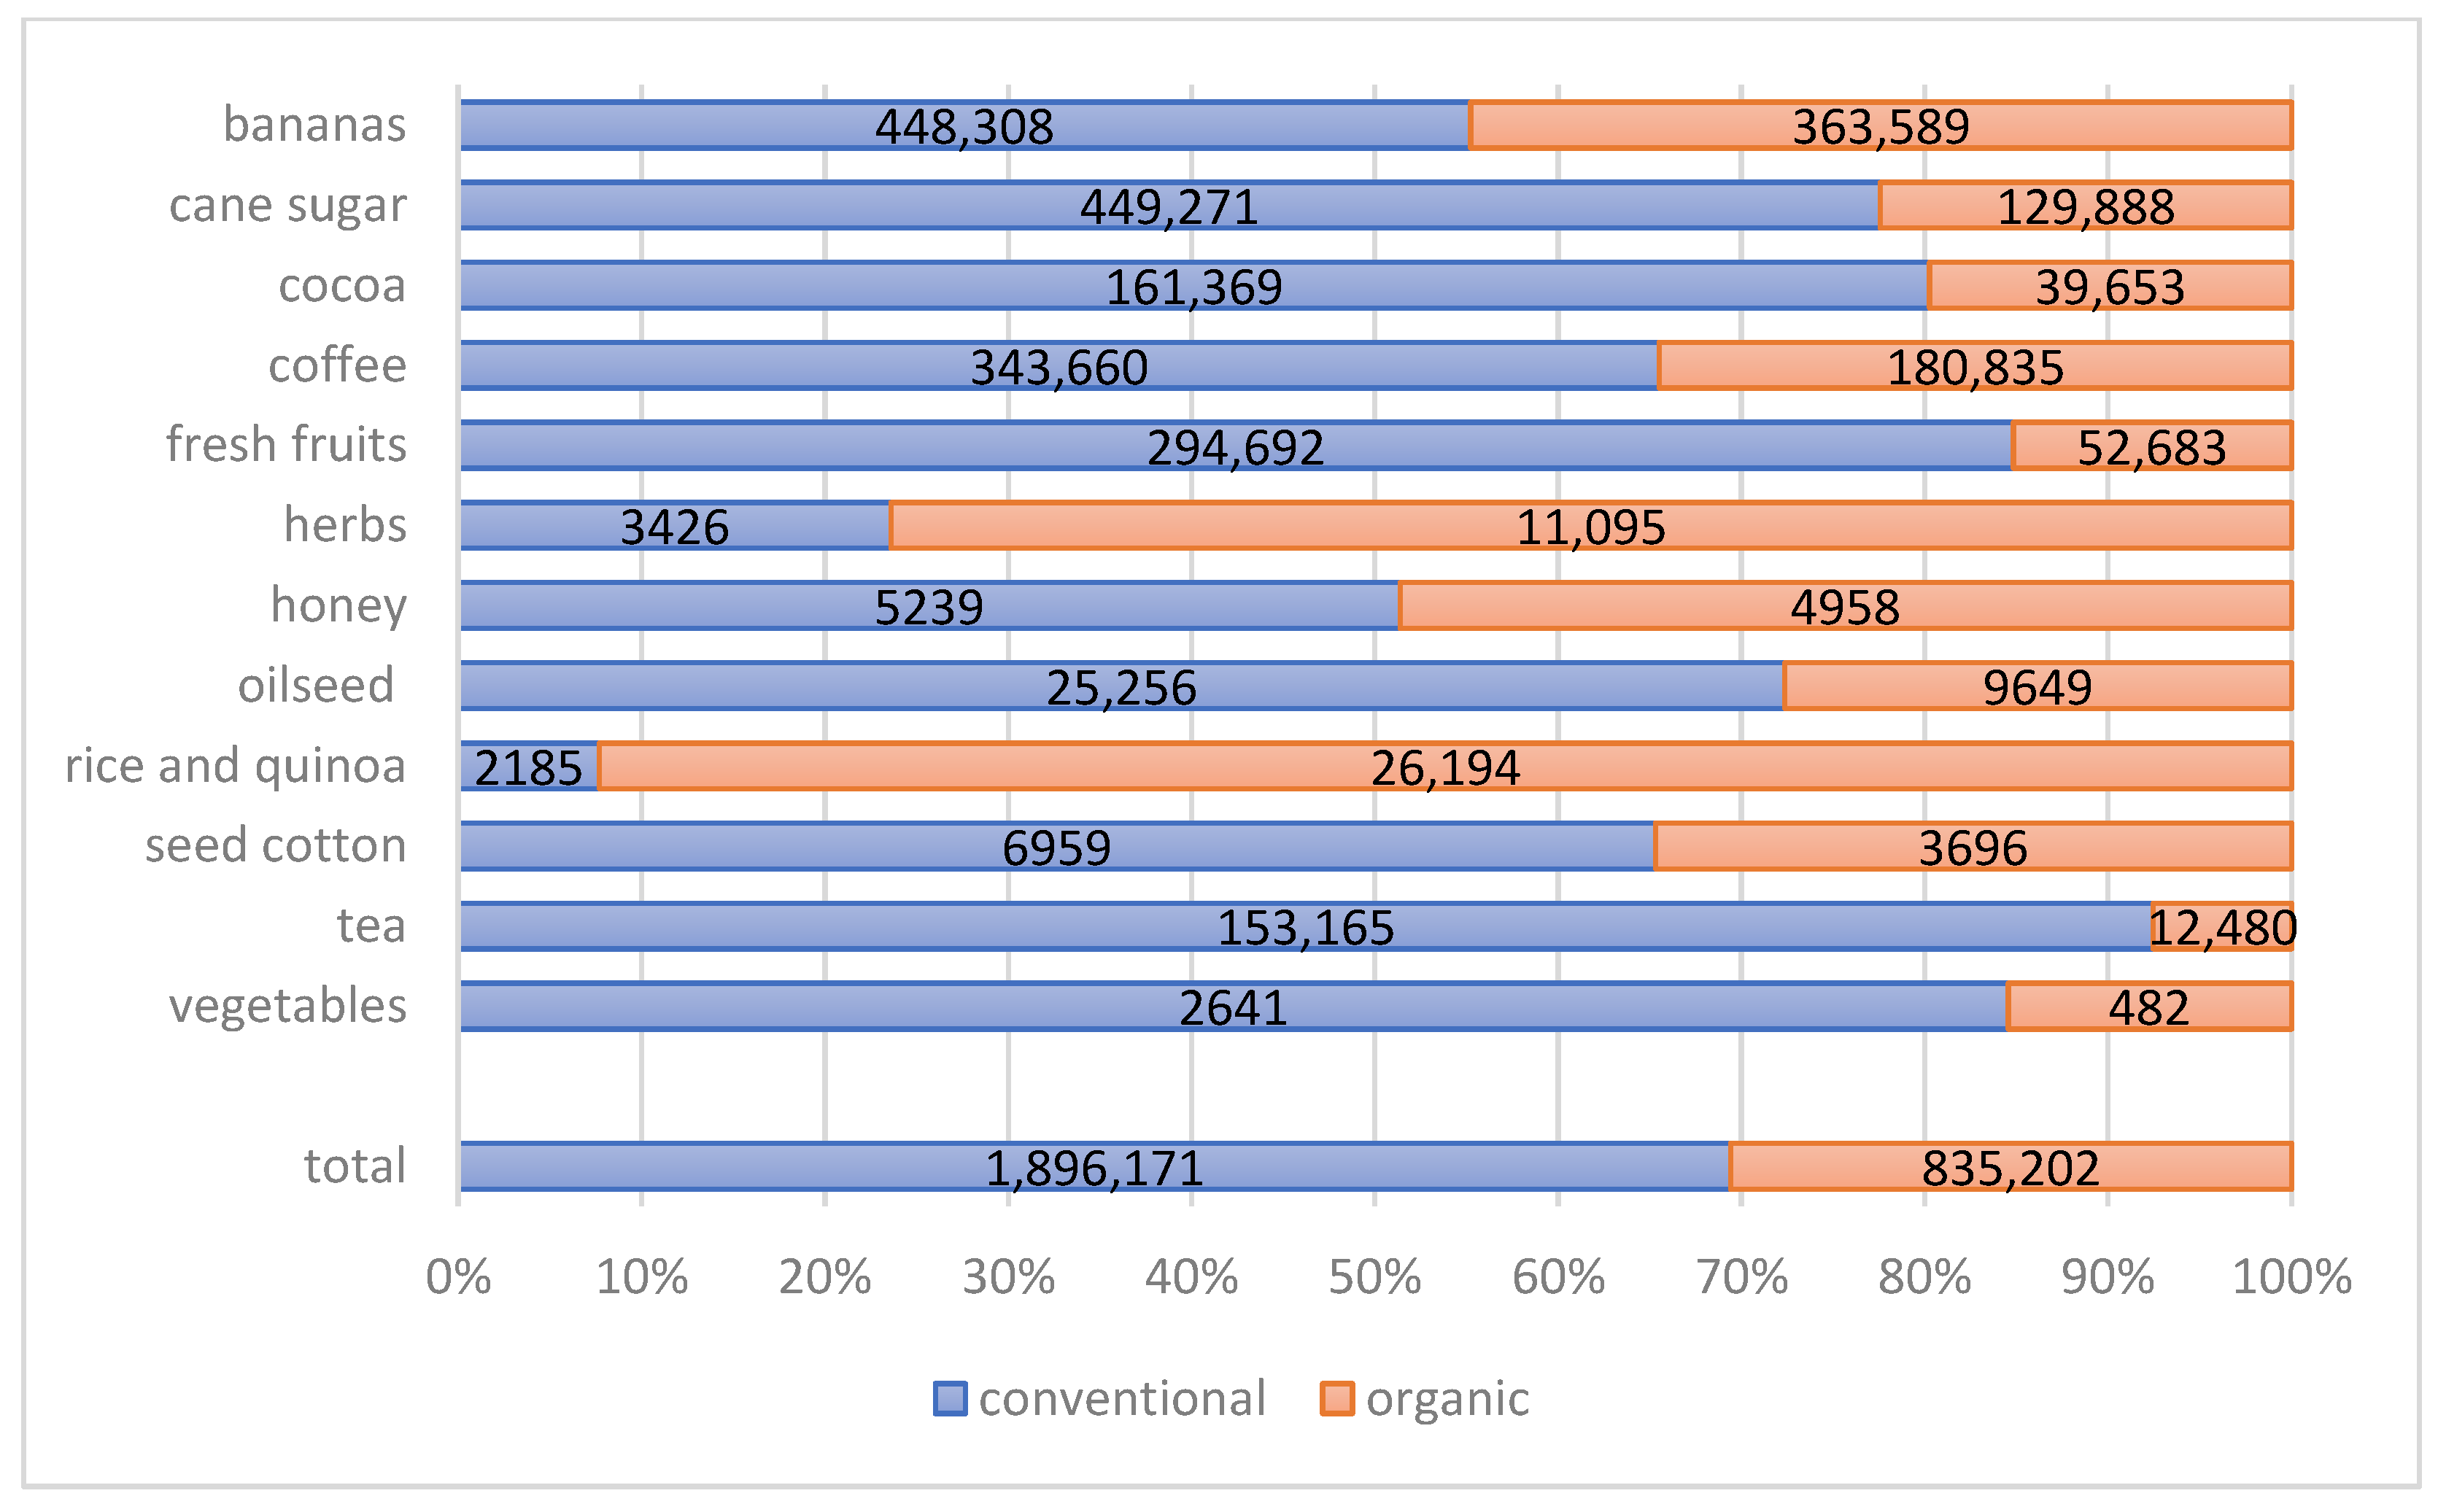
Part of the production is organically grown: when all products were considered, 54% of the organisations had at least some organic produce, and 25% of the overall production was organic. This is the case for the most traded products in the FT supply chain, namely bananas, cane sugar, cocoa, and coffee. Nevertheless, percentages of organic volumes vary greatly depending on the product, as reported in
Figure 7, for example, 88% of the volumes of rice and quinoa and 78% of herbs are organic, while organic represents only 10% of vegetables and 22% of fresh fruits. There is also a difference in the percentages of organic production according to the type of organisation: the mean for the SPO Standard is 49.37%, and this value falls to 25.76% for the HL Standard.
3.2. Regression Results
The results of the regression models are reported in
Table 2 and
Table 3. The dependent variables for the regressions are the logarithm of the total revenues in the first model (
Table 2) and the percentage of revenues derived from FT compared to the total revenues (
Table 3) in the second. We draw on the existing literature of FT’s impact to identify explanatory variables [
21,
44,
45]. The independent variables in the regressions included both continuous and categorical data. The independent variables used were the logarithm of the number of members/workers, the duration of the involvement in FT, the percentage of females among producer organisations, the percentage of organic production, the percentage of the volume of product sold on the FT market, and the ratio between the number of members/workers and the cultivated hectares. Furthermore, dummy variables were added concerning the type of organisation, the practice of product differentiation, the primary product, and country. These last two variables were not included in the first model (1) and were progressively included in the following models (2 and 3).
3.3. Total Revenues
The logarithm of the number of workers/members was included in the regressions as a control variable, as it was expected—and confirmed—that larger organisations were positively related to the total amount of revenue earned. Similarly, the ratio between the number of members/workers and the cultivated hectares was negatively correlated to the total revenues.
The percentage of products sold under the FT certification was negatively correlated to the total revenues earned by producer organisations, suggesting that a more significant share of production sold with FT certification is generally associated with obtaining lower overall revenues (i.e., the revenues deriving from the sales in both FT and non-certified markets). Organic production seems to be more profitable for FT certified producer organisations as higher percentages of organic production are associated with higher revenues.
The type of organisation also seems to influence the performance of FT certified producers. Using the plantation as the reference base, the negative and statistically significant dummy variables relating to the 1st- and 2nd-grade organisations indicate that SPOs earn a lower average level of total revenue compared to HL organisations. Moreover, within the HL group, multi-estates seemed to perform better than plantations in terms of total revenues.
The estimated coefficients for the percentage of women among members/workers, the duration of involvement in FT and product differentiation were not statistically different from zero at the 5% confidence level, suggesting that these variables have no direct effects on the total revenues.
3.4. FT Revenues
Results of the fractional logistic regression are reported in
Table 3. The logarithm of the number of workers/members of the organisations and the share of revenues derived from FT were negatively correlated, suggesting that the producer organisations that sell most of their production to FT were those with fewer members/workers. We tested the same model using the total volume produced by each organisation instead of the logarithm of the number of members/workers (two correlated variables, corr. = 0.83
p = 0.01) and found that the results remained unchanged.
The duration of involvement in the FT system also had a negative coefficient, meaning that the organisations involved in FT for the longest time did not obtain the majority of their revenue from the FT market. However, this information must be considered knowing that we do not have data relating to cooperatives or plantations that do not participate in FT or have abandoned it for any reason.
In contrast, the percentage of organic production is positively correlated to the share of revenues derived from FT (i.e., the producer organisations that produce higher volumes of organic product sell most of their production on the FT certified market).
Regarding the type of organisation, the data showed no clear dominance of one form of organisation over the others (SPO vs. HL) in terms of the share of revenues derived from FT. We also observed that more significant FT involvement was associated with a lower percentage of women among the members/workers, which is relevant, especially in the case of HL organizations.
4. Discussion
The literature analysis and the descriptive findings highlighted significant differences in how economic value is created among FT certified producer organisations. FT mainly operates in middle-income countries and only to a lesser extent in low-income countries. This is because it requires conditions that guarantee the continuous feasibility of production processes and subsequent logistics and because the costs to comply with the FT standards can drive away producers from the poorest countries. Coffee, bananas, and cane sugar, the products with the longest history in FT, make up the bulk of the FT network in terms of volume produced, number of producer organisations, and workers/members.
A positive relationship between the number of workers/members and the overall revenues was expected, as bigger organisations generate greater product flows than small ones. Similarly, organisations with a lower ratio between the number of workers and cultivated hectares are generally associated with higher revenues. These organisations are likely to be the most technologically equipped, less labour intensive, more efficient in using workers, and perhaps with more productive workers and experience in the market [
3]. Larger shares of organic production are also associated with higher revenues. This aspect is crucial when considering that one of FT’s objectives includes promoting sustainable agricultural production systems. Though Ruben and Fort [
20] and Parvathi [
46] found that joining FT did not significantly increase the income of organic farmers, we found that a greater share of organic production was correlated to higher revenues among FT certified producer organisations.
The low percentage of production that farmers manage to sell to FT markets has been considered a limiting factor for the system’s full effectiveness [
21,
27,
37,
44]. On average, organisations sell about 60% of their overall production within the FT certified market, while the remainder is distributed via conventional trading channels. Nevertheless, substantial differences depend on the organisation and product type. Organisations that manage to sell larger shares of their total production in the certified market report higher revenues deriving from FT, but lower overall revenue as the income from other sales channels are also considered. In particular, smaller organisations sell most of their production on the FT market and therefore have a greater reliance on it to sell their products. In contrast, larger organisations sell smaller quantities of their overall production within the FT certified market and distribute the largest part on conventional markets. This phenomenon highlights an important function implemented by FT in supporting small producer organisations, which by having the possibility of selling large quantities of their products in the certified market, obtain better access to profitable international markets. In this sense, FT provides for the lack of structuring and organising capacity of the small organisation.
The quantity of product sold in the FT market is usually not at the producers’ discretion due to different reasons including quality standards, limited market demand, and cooperative quotas [
21,
44]. Therefore, we evaluated the distribution of revenues within the FT network and the different relationships producer organisations have toward FT rather than the strategies of the producer organisations.
Prolonged participation in the certified market is generally associated with lower reliance in terms of revenues on FT, which over time becomes a less predominant sales channel for producers. Although we have no data on producers not affiliated with FT or those abandoned for any reason, our results seem to contrast the allegations concerning a dominance of the market by the so-called “early entrant” organisations, as it is shown that the longer the organisations are involved in FT, the lower the share of products they sell on the FT market. In contrast, FT appears to act as a springboard for new and small organisations, which, once positioned in the FT market, can successfully expand into other international value chains. As mentioned in the introduction, FT’s opening to fresh produce plantations and multi estates has been a highly contested issue in the past [
27,
47]. From our results, the HL producer organisation model is more efficient in generating revenues than the SPO type, which still represents most organisations and farmers certified by FT. Moreover, the opening to HL has widened FT’s range of action where the cooperative approach is lacking or not suitable for certain types of products (e.g., fresh products), allowing some of the benefits granted by FT to be extended to wageworkers. In this sense, HL is a parallel and complementary model to the SPO, which has made it possible to introduce FT in specific markets and different contexts. Among SPOs, women represent 18% of the members, while more than one-third of the workers are women for HL organisations. As previously mentioned, this figure suggests a greater difficulty for women in being owners or partners of a business than just hired workers. Still, it is impossible to draw general conclusions over women’s involvement in FT because of the limited evidence and heterogeneity of the experiences that compose it [
48].
5. Conclusions and Limitations
The analysis of the MEL database provides a detailed image of the FT certified farming organisations worldwide, highlighting the geographical distribution of organisations and their main characteristics. Our study has provided an exploratory look at the entire FT certified producers’ network, providing useful elements to address questions from previous literature and to consider in the debate on FT’s effectiveness in pursuing its objectives.
While FT is mainly considered as a positive developmental tool, its profitability is not homogeneous for all organisations worldwide, as there are specific case differences that are challenging to grasp and abstract to generalisations valid for the producers’ entire network. Results highlight the different approaches to FT by the organisations that make up the network of suppliers: smaller organisations tend to sell a greater share of their products through the FT market, while larger organisations seem to use FT as part of a strategy to diversify sales channels and derive from the FT market lower shares of revenue compared to the overall revenue.
We also found that producer organisations selling a larger share of production in the FT market did not score higher overall revenues, as those selling only a small portion of their production at FT conditions obtained higher overall revenues by selling most of their products in other markets. These results may indicate that FT participation is most effective and profitable when FT does not represent the only sale channel. Therefore, considering the overall revenue for producer organisations, FT involvement is to be assessed considering the organisation’s capabilities and market conditions, whether as a main, if not unique, form of sales channel, or within a diversified distribution strategy. Indeed, FT might be more effective in using tailored forms of support and involvement of producer organisations according to the type of organisation, production capacity, and size.
Moreover, we did not detect any dominance in terms of revenue, either by any type of producer organisations (HL and SPO) or by the organisations involved in FT for the longest time. Indeed, long involvement in FT is associated with lower reliance in terms of revenues on FT, which over time accounts for a decreasing part of the total revenue. Thanks to their combined strengths, second- and third-level SPOs can become extremely large and powerful, operate successfully in national and international markets, and collaborate with other large value chain actors.
Although we analysed a database that included all the organisations participating in the FT certification, this work is not free from limitations. For example, we did not have information about a counter sample of non-certified producer organisations, which did not allow us to address the fundamental question of whether FT participation is beneficial to producers. Furthermore, we did not have information from producers who abandoned the certification before 2015. Although our research focused mainly on the generation of revenue derived from FT participation, considering the benefits of FT participation exclusively in monetary terms would limit the comprehension of its potential [
35,
46,
49]. Benefits derived from participation in FT are not limited to income, but include improvement in organisational abilities, access to market, production quality, technical support, inclusion, and network development [
19,
20,
30,
37,
46,
50].
Future research should investigate the comparison between the HL and SPO models, the different types of relationships that producer organisations have with FT and the role of FT for small producer organisations and “new entrants” in the certified market.


