Article

Energy-Environmental Impact Assessment of Greenhouse Grown Tomato: A Case Study in Almeria (Spain)

by
Katia Hueso-Kortekaas
1,*,
José C. Romero
2 and
Raquel González-Felipe
1
1
ICAI School of Engineering, Universidad Pontificia Comillas, 28015 Madrid, Spain
2
Institute for Research in Technology (IIT), ICAI School of Engineering, Universidad Pontificia Comillas, 28015 Madrid, Spain
*
Author to whom correspondence should be addressed.
World 2021, 2(3), 425-441; https://doi.org/10.3390/world2030027
Submission received: 29 July 2021 / Revised: 10 August 2021 / Accepted: 3 September 2021 / Published: 7 September 2021

Abstract

:
Tomato is one of the most common crops across the world, but it is also one of the types of food that generates the most losses across its life cycle. This paper addresses this issue by providing a Life Cycle Analysis of greenhouse grown tomato in southern Spain. The results confirm that tomatoes are a thirsty and frail crop. Most of its energy demands and carbon emissions go to packaging (35%) and transportation (42%) as well as supplying water for their growth. There seems to be room for improvement in the recovery of energy (54.6%) and CO2 emissions, mainly addressing the waste treatment of packaging and plastic as well as improving transportation. Despite being highly water demanding, irrigation processes are already efficient in industrial greenhouses, and most of the water recovery will need to take place in the waste recovery stage. Food losses at the consumption phases do not constitute a significant loss in energy or a significant amount of carbon emissions saved.

1. Introduction

There is an ever-growing interest in increasing the sustainability of the food chain for social, economic, and environmental reasons [1]. One of the key aspects to be addressed in this effort is the reduction of food losses in the different stages of the food chain. Indeed, food loss is one of the biggest global challenges alongside the need to combat hunger, raise income, and improve food security, especially in lower-income regions [2]. Target three of Sustainable Development Goal number twelve (SDG12) is to, “By 2030, halve per capita global food waste at the retail and consumer levels and reduce food losses along production and supply chains, including post-harvest losses,” because the issue of food loss and waste has become a major problem. If we look at the data provided by the United Nations (UN), each year, an estimated one-third of all food produced, i.e., 1.3 billion tons worth around $1 trillion, ends up in the bins of consumers and retailers, or spoiling due to poor transportation and harvesting practices. In the European Union alone, 88 million tons (Mt) of food is lost each year [3]. Food waste has a major impact on natural resources. It is estimated that 25% of the water used for irrigation is lost [4], and 8% of annual global greenhouse gases (GHG) emissions are caused by food waste [5]. It is important to distinguish here the difference between food loss and food waste. The former refers to the “decrease in edible food mass throughout the part of the supply chain that specifically leads to edible food for human consumption” [2]. Food loss typically occurs before reaching the commercial end of the distribution chain, that is, in the production, harvest, and processing stages. Food losses occurring at the retail, consumption, and disposal stages are named “food waste” and are strongly linked to the behavior of retail store owners and final consumers [6].
There are many policy-based initiatives to reduce food loss and waste across the world. Examples of these are the US Federal Law Bill Emerson Good Samaritan Food Donation Act (1996), which is aimed at “encouraging the donation of food and grocery products to nonprofit organizations for distribution to needy individuals”. Similar laws exist in Europe [7], such as the Good Samaritan Law in Italy (2003). Other actions to lengthen the lifetime of food are the review and harmonization of date labeling of food products in the European Union (EU) as well as a set of guidelines on food donation that address various regulatory requirements (e.g., food safety and hygiene, liability) and intend to facilitate the compliance of related requirements of donors and food banks across the EU. Fiscal measures, such as VAT deduction, for food donations are another policy tool that has been successfully implemented in several EU countries. Other legislation regarding food waste includes other aspects of the food waste chain, addressing challenges at the production end (agriculture, fisheries, animal husbandry) and intermediate stages, such as distribution. In addition, drivers such as food marketing, consumer behavior, coordination of stakeholders, harmonization of criteria, etc. are also essential to reduce food waste [8].
Together, these policy and legislative efforts tackle key elements of food waste: its generation, management, reduction, and optimization. A very useful tool to understand the environmental challenges of food losses and waste in the different phases that it can be produced is indeed Life Cycle Analysis (LCA), which can be defined as “a method used to evaluate the environmental impact of a product through its life cycle encompassing the extraction and processing of the raw materials, manufacturing, distribution, use, recycling, and final disposal” [9]. Food loss and waste translates into an overuse of the resources needed for production such as land, water, energy, and inputs such as nutrients. As producing food that will not be consumed leads to unnecessary CO2 emissions, among other impacts, the environmental outcome of food waste is considered very relevant [2]. A review of 134 existing LCA studies on nine well-known products (apple, tomato, potato, bread, milk, beef, pork, chicken, white fish) in Europe shows that food waste represents an equivalent of 186 Mt CO2. Together with other impacts considered in the review, it amounts to ca. 16% of the total impact of the entire food supply chain [10].
The LCA method has been applied for different case studies related to food waste, such as its generation in the mass retail sector [11], its generation in the food service sector (such as hotels, restaurants, canteens, or health care centers) [12], or the influence of packaging [13], to name a few examples. Others have focused on the efficient disposal and optimization of the material and energy valuation of food waste (e.g., [14,15,16]). Life cycle analysis of single food products or processed foods have also been performed, the tomato and its by-products being a popular study case, i.e., tomato ketchup [17], biodiesel production [18], tomato production in UK [19], tomato in Spain [20], LCA food waste minimization [21], tomato and cucumber in open fields and greenhouses [22], or tomato production in Albania [23].
The relation between the LCA stages of food products and the food waste generation of each one is not so often addressed. This contribution presents a simplified LCA on the food waste generated by the different life cycle stages of greenhouse tomatoes (Solanum lycopersicum), from cradle to grave, obtained from a real-life case in Almería, SE Spain. The aim of this case study is to highlight the environmental impact based on three indicators, namely CO2 emissions, energy, and water consumption [24], at each stage and to provide insight on possible solutions to decrease these impacts. The goal of this study is to understand the role of food waste in the selected impacts of tomato production throughout its life cycle. It is expected that the food waste of tomato production is found in all stages of production but especially in the harvest, consumption, and disposal, being lower in the packaging and transportation stages.

2. Materials and Methods

LCA is a complex tool that requires a deep study and very detailed baseline information of a large number of parameters. Therefore, LCA analysis can provide a very comprehensive picture of different potential environmental impacts of a given productive activity, such as greenhouse gas generation, ozone layer depletion, eutrophication of soil and water, ecotoxicity, etc. [25]. However, an analysis of this kind falls beyond the scope of this study. The simplified LCA of the food waste of greenhouse tomatoes presented here is based on the eco-audit methodology. An eco-audit is a “fast initial assessment [that] identifies the phase of life—material, manufacture, transport, use, disposal—that carries the highest demand for energy or creates the greatest burden of CO2” [26]. Therefore, in this case study, the CO2 emissions and energy consumption of this activity are estimated, to which the consumption of water is added, as tomatoes are a thirsty crop. These three indicators provide a rough estimate of the most sensitive stages of food production, consumption, and disposal, which are especially relevant when looking at the food waste each one generates.
The eco-audit methodology needs to be applied to a (near) real case situation in which a goals statement, functional unit, system boundaries, and assumptions are set. All data used for calculations are obtained from the Government of Andalusia [27] unless otherwise stated.

2.1. Goal and Scope of the Study

The main goal of this study is to evaluate three types of environmental impacts—namely, CO2, emissions, energy use, and water consumption—of the life cycle of spring cultivation of greenhouse tomatoes in Almeria, SE Spain. The results of the study are aimed at both food producers and consumers. The functional unit in this study is 100 kg of harvested tomatoes.

2.2. System Boundaries and Assumptions

In this study, the following system boundaries and assumptions have been made, which are broken down here per life cycle stage. The assumptions are based on the information available to the authors in the different sources consulted in [22].
  • Production and processing stage (aka materials and manufacturing)
The cultivation phase of the life cycle of the greenhouse tomato consists of the following activities: soil preparation, preparation of the greenhouse, sowing, plantation, pruning, tutoring (i.e., vertical support), leaf removal, pollination and maturing, fertigation, and harvest. The cultivation conditions are as follows:
Daytime temperature between 20 and 25 °C;
Night temperature between 15 and 18 °C;
Relative humidity between 60 and 80%;
Sun exposure of between 8 and 16 h per day;
CO2 concentration of ca. 335 ppm with open windows and 650 ppm with closed windows.
The nutrients needed per ton of harvested tomatoes are as follows:
Nitrogen, N: 3.11 kg;
Phosphorous, P: 0.6 kg;
Potassium, K: 4.21 kg;
Calcium, Ca: 2.26 kg;
Magnesium, Mg: 1.08 kg.
As said, the study will focus on the cultivation during the spring cycle, that is, between November and June. In this cycle, the seeds are sown between November and February, fruits mature between February and April, and harvest takes place between April and June.
The greenhouse has a surface of 7500 m2, and it is 125 m long, 60 m wide, and 4 m high. The material used to cover the greenhouse is three-layer low-density polyethylene (LDPE), with a thickness of 200 microns and a density of 0.92 g/cm3. The plastic manufacturer provides a 4-year guarantee of use, which is deemed as its expected lifetime. However, for the purpose of this case, it is assumed that one-quarter of the roofing needs to be replaced on an annual basis, due to weather-related damage.
It is also assumed that the greenhouse has all the necessary equipment and infrastructure needed for the cultivation, care, and harvest of the tomatoes. The machinery has a longer lifespan, and its wear and tear will not be considered in this study.
To define the amount of water and energy needed to grow tomatoes in the greenhouse throughout the production cycle, this study will use data collected during a campaign of the same characteristics in 2011 as a reference, which was obtained by the Department of Agriculture, Fisheries, and Rural Development of the Government of Andalusia [22]. According to these data, water has a cost of €1.5 per cubic meter and of €0.19 per m2 of greenhouse. The calculated energy consumption of this case study during the 2011 harvest season was 142.319 €/MWh, which equals €0.22/m2. The cost of the energy consumed includes the expense of auxiliary equipment during sowing, care, and harvest. The consumption of fossil fuels for auxiliary motor equipment and the energy consumption associated with agricultural workers (e.g., commuting to work) is neglected.
In addition, the plantation must be provided with fertilizers and phytosanitary products so that the crop grows with the desired properties and is protected from diseases that can attack the species. The nutritional needs of the crop vary throughout the season, and the following daily amounts are broken down per stages, as follows: sowing needs 1.5 g of agrochemical solution per day (during ca. 60 days) of greenhouse surface; maturing, 3 g/day (during ca. 90 days) and harvest, 4 g/day (during ca. 75 days).
In this stage, up to 27% of the tomatoes are lost. The following losses are considered: mechanical damage and/or spillage during harvest operation (e.g., threshing or fruit picking), crops sorted out post-harvest, etc. Especially in the phases of leaf removal, pruning, and care of the plantation, fresh waste is generated that must be managed. A smaller loss is produced during packaging, as only the fruits in top condition are chosen, and this operation is done by hand. The amount generated and collected is 71.31 tons of waste in each hectare dedicated to cultivation. This amount is considered difficult to reduce, as the operations in industrial greenhouses are already quite efficient.
b.
Transportation stage
The average production yield of tomato grown in the greenhouse is 13.5 kg/m2, obtaining 101,250 kg of harvested fruit. The quantity of tomato produced is transferred to the city of Madrid from Almería, traveling 550 km one-way, in refrigerated 14-tonne diesel trucks, assuming they are loaded to full capacity. The energy needed to refrigerate the produce en route is considered to be embedded in the energy needed for transportation. In addition, it is assumed that the truck returns to Almería transporting another product, so the return journey is not considered here. Finally, it has been considered that the fruit will be collected directly from the greenhouse and, without any intermediaries, sent directly to the supermarket.
In order to keep the tomato in the best condition and prevent a loss of quality during transportation, double-wave cardboard boxes will be used. The boxes have a size of 40 × 30 × 14 cm, the thickness of the double wave cardboard is 6.5 mm, and its density is 605 g/m2. Each box holds 6 kg of tomatoes.
Transportation losses, which in the case of tomatoes rise up to 10%, include spillage and degradation during handling, storage, and transportation between farm and distribution, as well as to the final user. They typically respond to human, environmental, and managerial factors [28]. In the first case, these are often caused by lack of training, human errors, and non-compliance with regulations. In the second, they are mainly related to exposure to microorganisms, whether due to inadequate storage or breach of adequate conditions of temperature and humidity, especially during transshipment from one mode of transportation to another. The latter is caused by improper packaging, (un-)loading protocols, and rough handling. Other studies indicate that up to 22% of tomatoes can be lost due to crushing or bruising [29], providing a broad range of situations and, as a consequence, room for improvement.
c.
Use stage
The tomatoes are destined to private consumption and are sold fresh. To properly preserve the tomato, the refrigeration temperature will be 4 ° C. The fruit spends an average of 21 h in refrigeration in the supermarket until it is purchased by a customer. Once at home, it continues with being refrigerated. An average refrigeration time in an EU class A fridge of 3 days has been assumed until consumption and 7 days until it is wasted. It is assumed that the refrigerators are energy class A, as defined by the European Union.
Food losses during the final use, i.e., in the household, are by far the largest. On average, they account for 13.5% of the total food loss in the production and consumption chain. However, this figure may vary considerably depending on the type of food and location. Fruits and vegetables are one of the types of food with the highest losses due to their short shelf life in general, reaching up to 20% of the losses in their life cycle [2].
d.
Disposal stage
The tomatoes at their end-of-life will either be consumed or discarded in the form of losses. The most common method of disposal will be composting, in which the material embedded in the tomato waste will be recovered. The remaining tomato losses (67%) are not recovered in any form (material or energy-wise). With respect to other wastes, it is assumed all fresh residue in the production phase is burnt. It is estimated that 73.31 tons of fresh residue are produced per hectare of greenhouse tomato. Residual plant parts of the tomato production have an internal calorific value of is 3630 kcal/kg. Carbon emissions during combustion are considered negligible, as it equals the amount of carbon absorbed during growth. Part of the plastic (8.44%) is recovered via recycling (i.e., material recovery), and the rest is being burnt, therefore losing the material and energy embedded in it. Similarly, 72% of the cardboard is recycled, the rest being burnt.
There is also a small amount of water recovered from the recycling of cardboard. It is estimated that 61% of the water used in the primary production of cardboard can be recovered with a 72% recycling rate, as expected in this case study. The rest of the water consumption corresponds exclusively to the irrigation of the tomatoes and cannot be recovered.

2.3. Calculations

Table 1 provides the baseline data for the calculations needed to compare the life cycle stages of the greenhouse tomato in the present case study. These data are specific to the system boundaries provided above and include the energy used, the CO2 emissions, and the water consumption per functional unit (100 kg tomatoes) in each stage.
It should be noted that these calculations are based on a screenshot of the past (mainly data from 2011) plus information from several databases consulted in [22]. The authors are well aware of the statistical weaknesses of this dataset not only due to its limited scope in time and space and their scattered origin but also due to the age of the data, which may not represent current practices accurately. Therefore, the numerical results offered here should be considered as a general approach to the topic, providing a baseline for comparison between life cycle stages, between environmental impacts, and between food lost and food not lost. Therefore, this should be considered a fast initial assessment and a qualitative approach to the topic, despite being expressed in hard figures, and it may serve as a head start for an in-depth analysis of tomato losses at a broader scope [21].

3. Results

With the baseline information from Table 1, it was possible to calculate the energy expenditure, CO2 emissions, and water consumption for the different life cycle stages of greenhouse tomatoes as well as the influence that discarded tomatoes have on these factors.

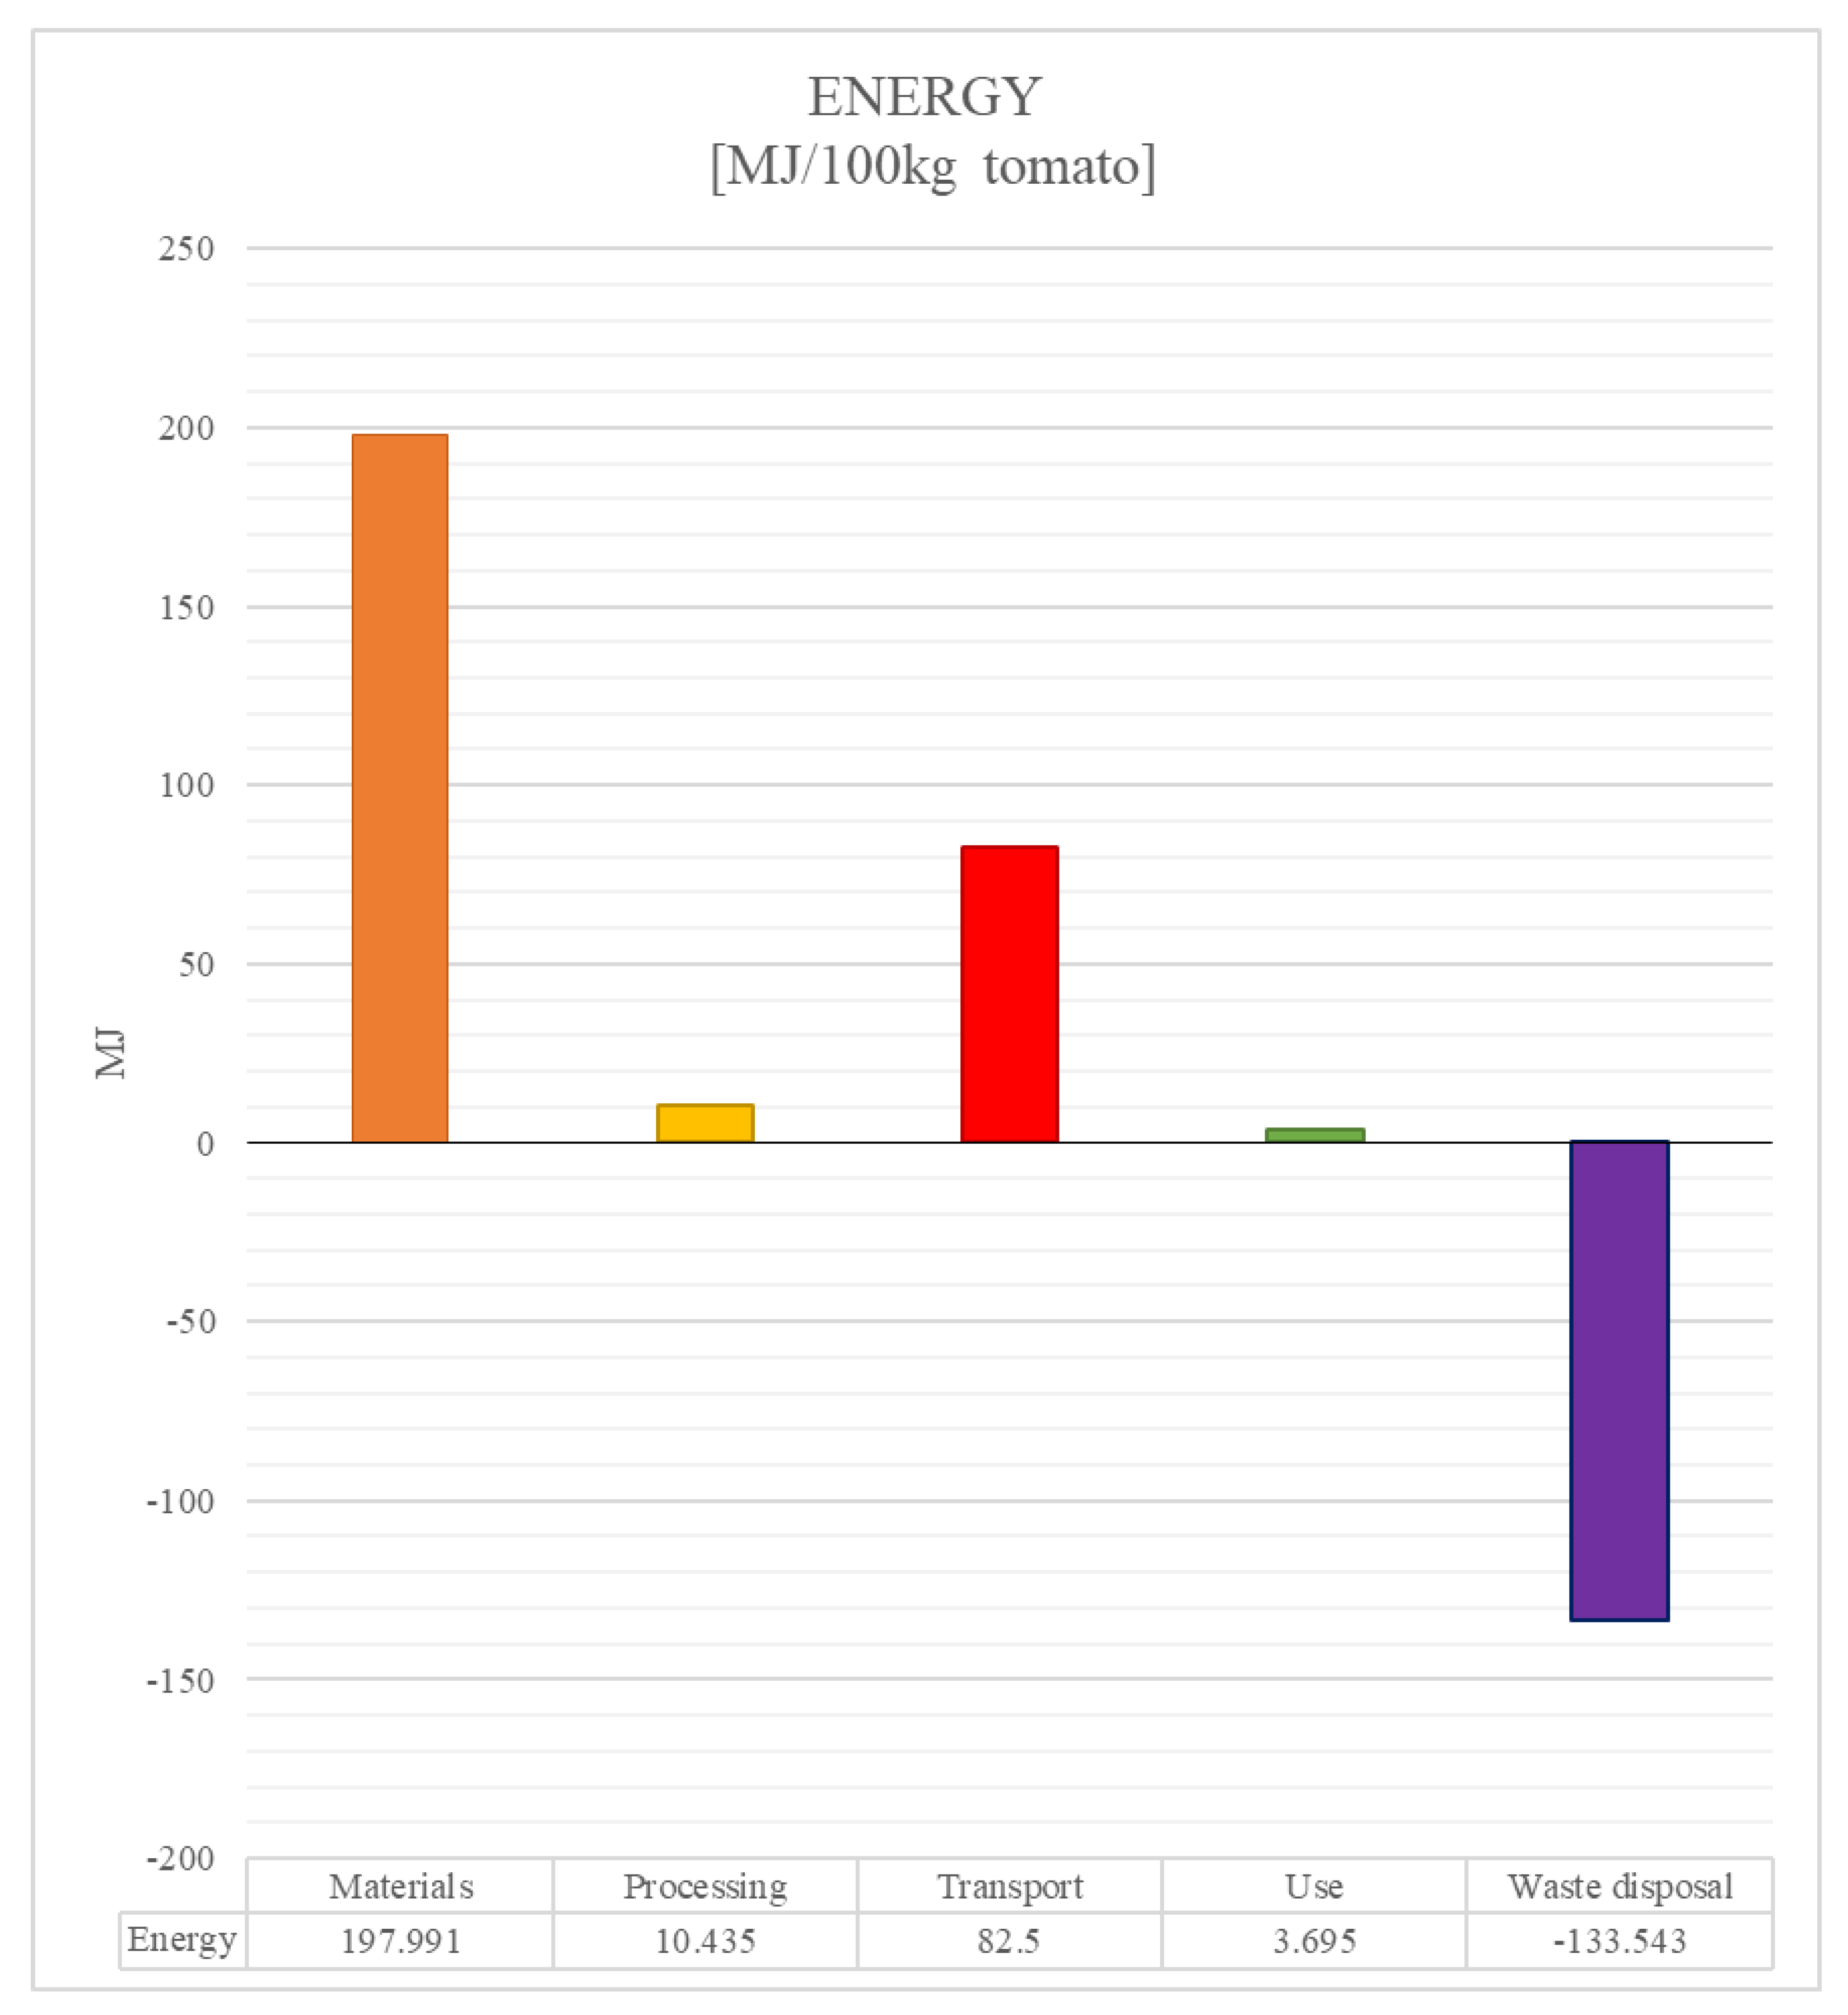
3.1. Energy Consumption
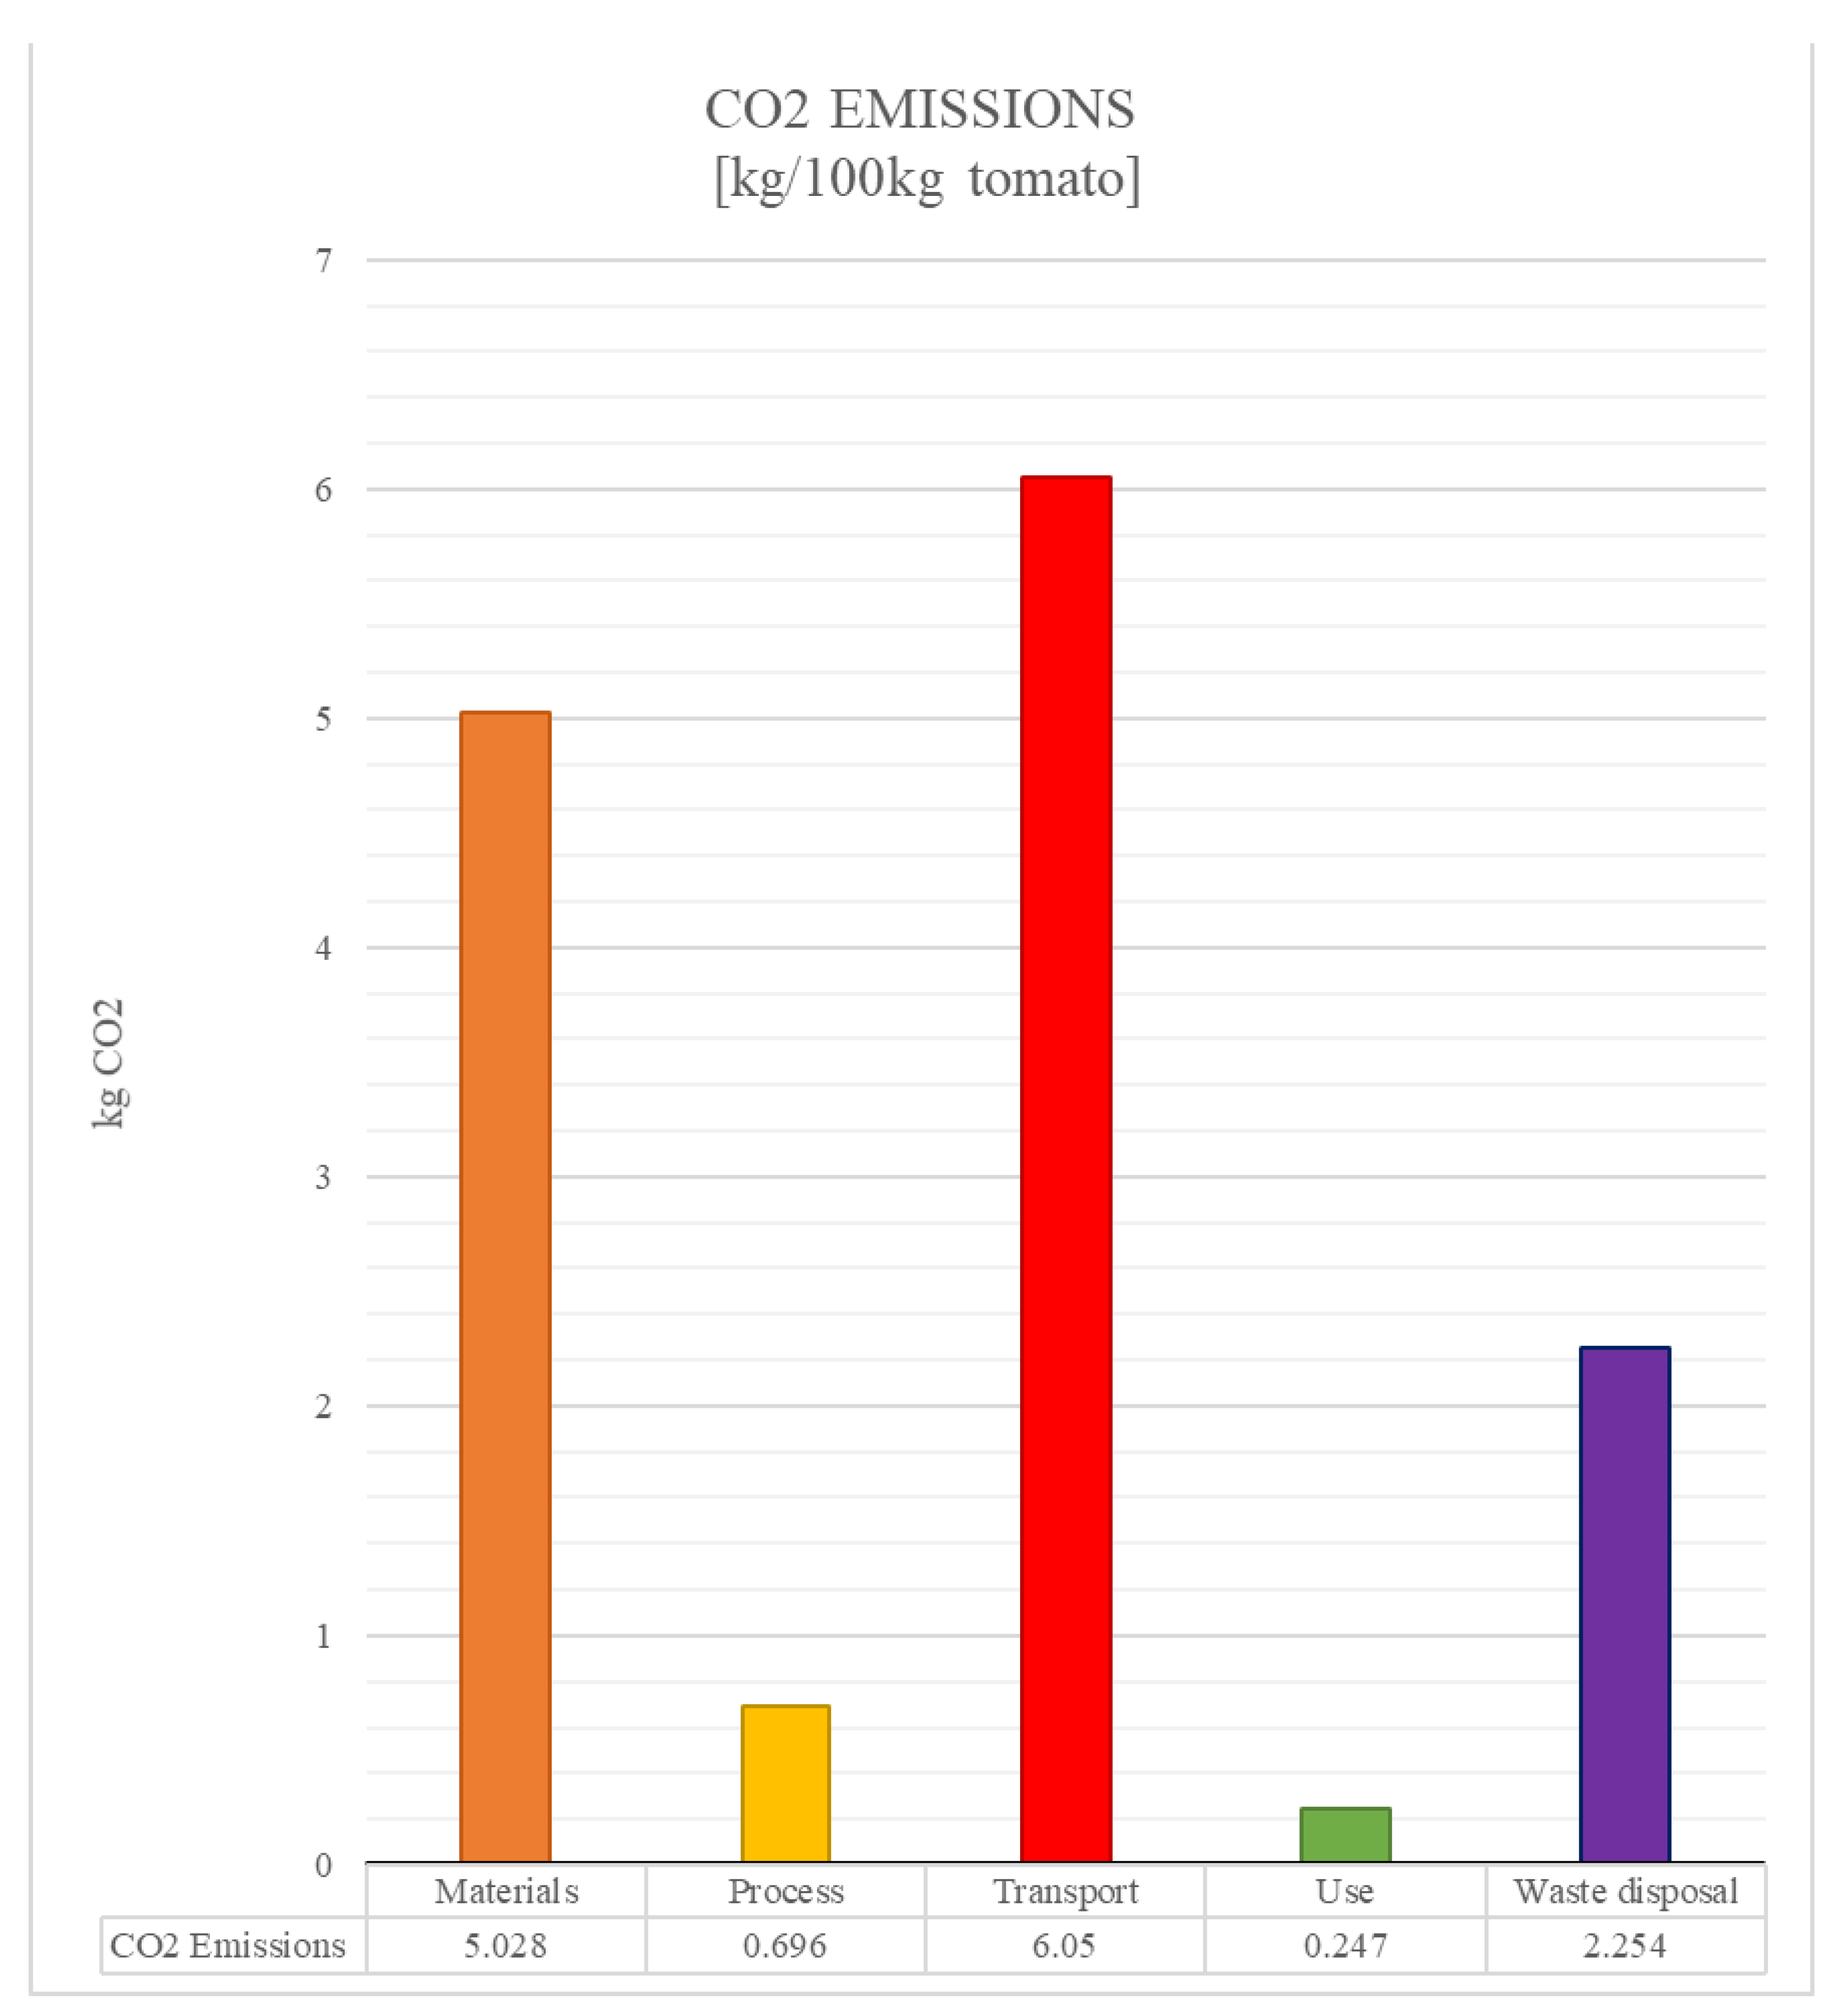
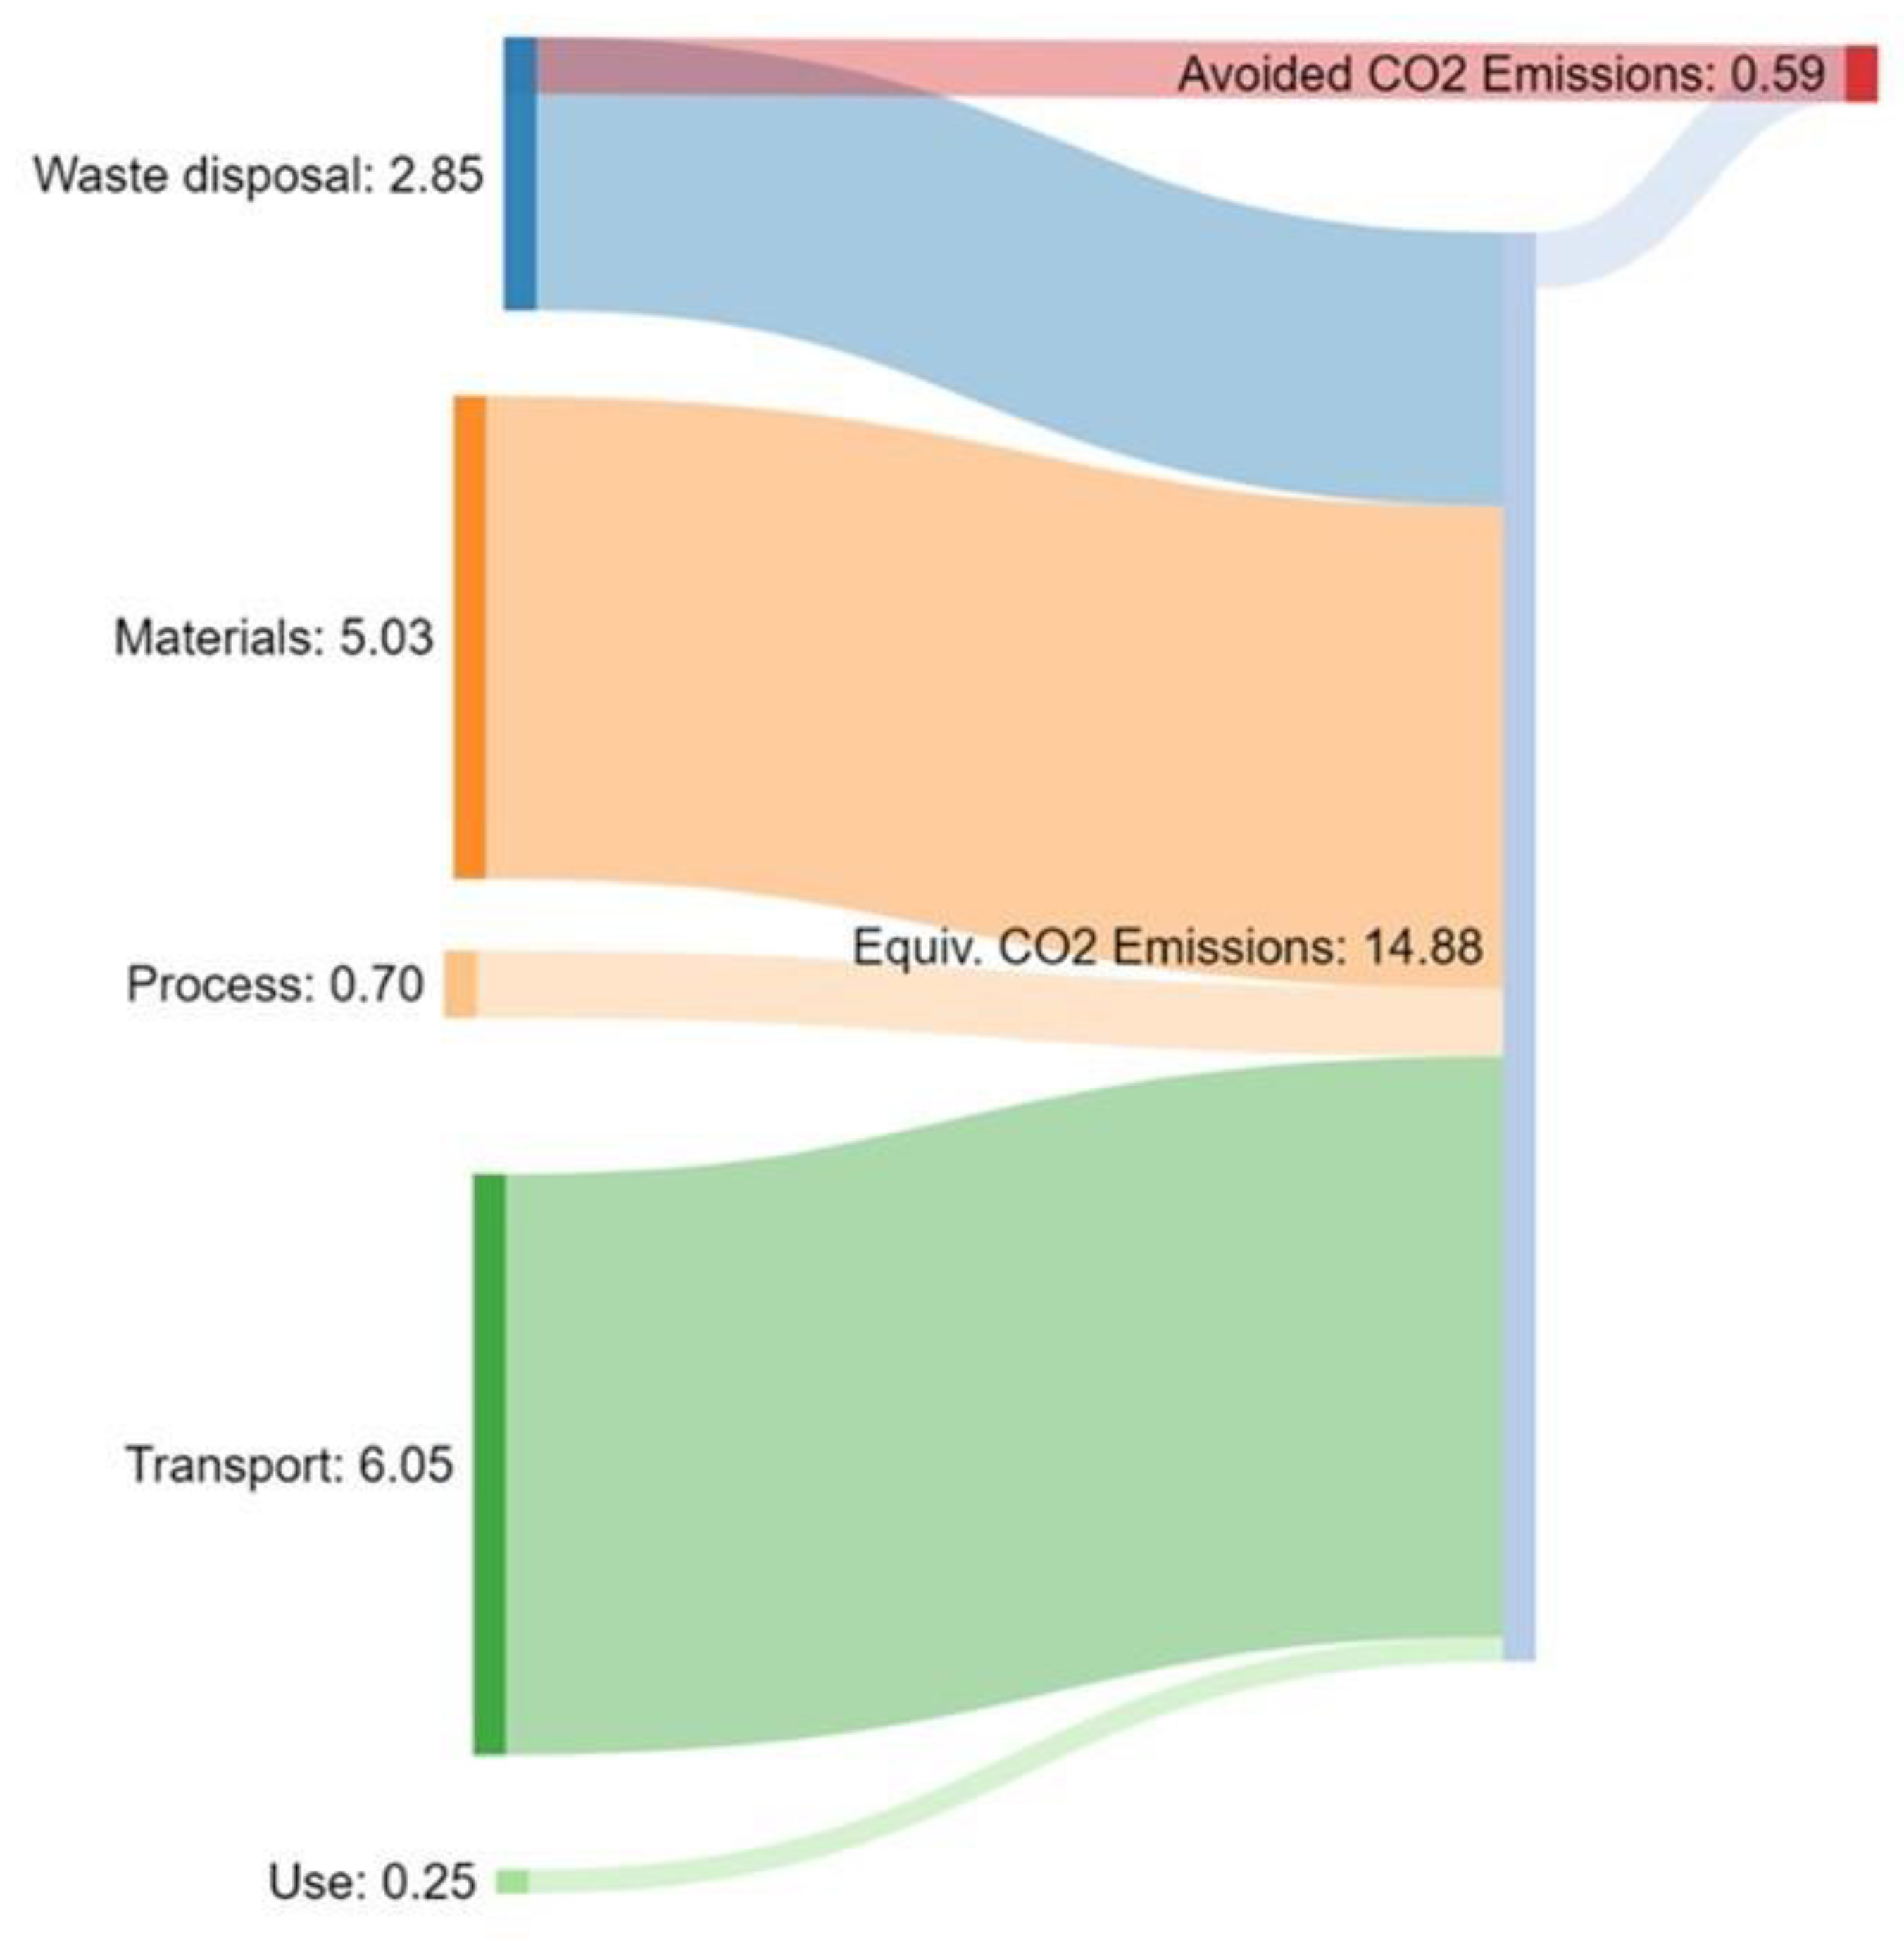
The highest energy consumption occurs in the manufacture of materials needed and used in the production of tomatoes, namely 197.991 MJ per 100 kg of production, accounting for 67% of total consumption (Figure 1 and Figure 2). In addition, it should be noted that 83% of the equivalent energy used in obtaining these materials corresponds to the production of the cardboard that will be used to transport the fruit under optimal conditions. Transport is the second most energy-demanding stage of the life cycle of the tomato, covering 28% of total energy consumption.
On the other hand, the maintenance and care of the plant and fruit in the greenhouse is equivalent to 4% of the total energy consumption of the life cycle. Packaging is done by hand, and therefore, no external source of energy is needed. The equivalent energy consumption for product transportation is 82.5 MJ per 100 kg of product. The equivalent energy consumption associated with the use of tomatoes, through refrigeration, accounts for 1% of total consumption, which is a figure slightly higher if the fruit is discarded, due to a longer residence time in the fridge.
In the last stage of the production chain, disposal, 133.543 MJ are recovered per 100 kg of tomato, being 45% of the equivalent energy consumed in the other stages of the process under study. This energy is recovered in the process of biomass combustion (treatment of plant residual waste), the recycling and combustion of both cardboard and plastic, as well as the composting of discarded tomatoes. Thirty-two percent of the energy recovered belongs to energy recovery through the combustion of the waste generated and 56% belongs to energy recovery through the recycling of cardboard. The energy recovered generates a positive impact on the overall value of the production process studied here. In addition, from the point of view of materials recovery, 72% of the cardboard and 8.44% of the plastic entering the system are recovered in recycling. However, in total, there is a loss of energy of more than 54.6% of the total energy needs of the system (Figure 2), giving ample room for improvement in the recovery efforts.

3.2. CO2 Emissions

The largest amount of emissions are produced during the transport of the food, 6.05 kg of carbon dioxide per 100 kg of tomatoes, constituting 42% of total emissions during their life cycle (Figure 3 and Figure 4). In turn, the second stage that produces the most emissions is the procurement of input materials to the system under study, specifically 5.028 kg of CO2, which is 35% of the total amount. In addition, 77% of these emissions belong to the primary production of the cardboard that will be used to transport the product in good conditions.
On the other hand, the minimum of emissions generated is found in the use of the product, being 0.247 kg of carbon dioxide per 100 kg of product. Up to 31% of the amount of emissions of this stage corresponds to the 19% mass of the product wasted in the households of final consumers. Discarded tomatoes generate more emissions than those that are consumed due to the longer residence time of the former in fridges. However, these are not significant amounts throughout the food production process, as the use stage accounts for 2% of total emissions throughout the life cycle of the tomato. Another stage that is relatively low in carbon emissions is the maintenance and care of the plants and the final product in the greenhouse, accounting for 5% of the total of CO2 emitted, namely 0.696 kg per 100 kg of tomato.
It is worth mentioning the waste management stage, during which 2.254 kg of CO2 are generated in total, producing 16% of total emissions. It should be noted that a total of 2.845 kg of CO2 is generated in the disposal phase, but 0.591 kg of these are avoided in recycling. Emissions during waste management originate from the combustion of a percentage of the system’s output materials, cardboard and plastic, plus a smaller fraction of the combustion of plant residue. The emissions avoided originate from the recycling treatment, 90% of which are related to cardboard, and the rest are related to plastic recycling. Overall, 3.96% of CO2 emissions are recovered in the process of recycling, the rest being emitted to the atmosphere (Figure 4). There is very large room for improvement with this impact category.

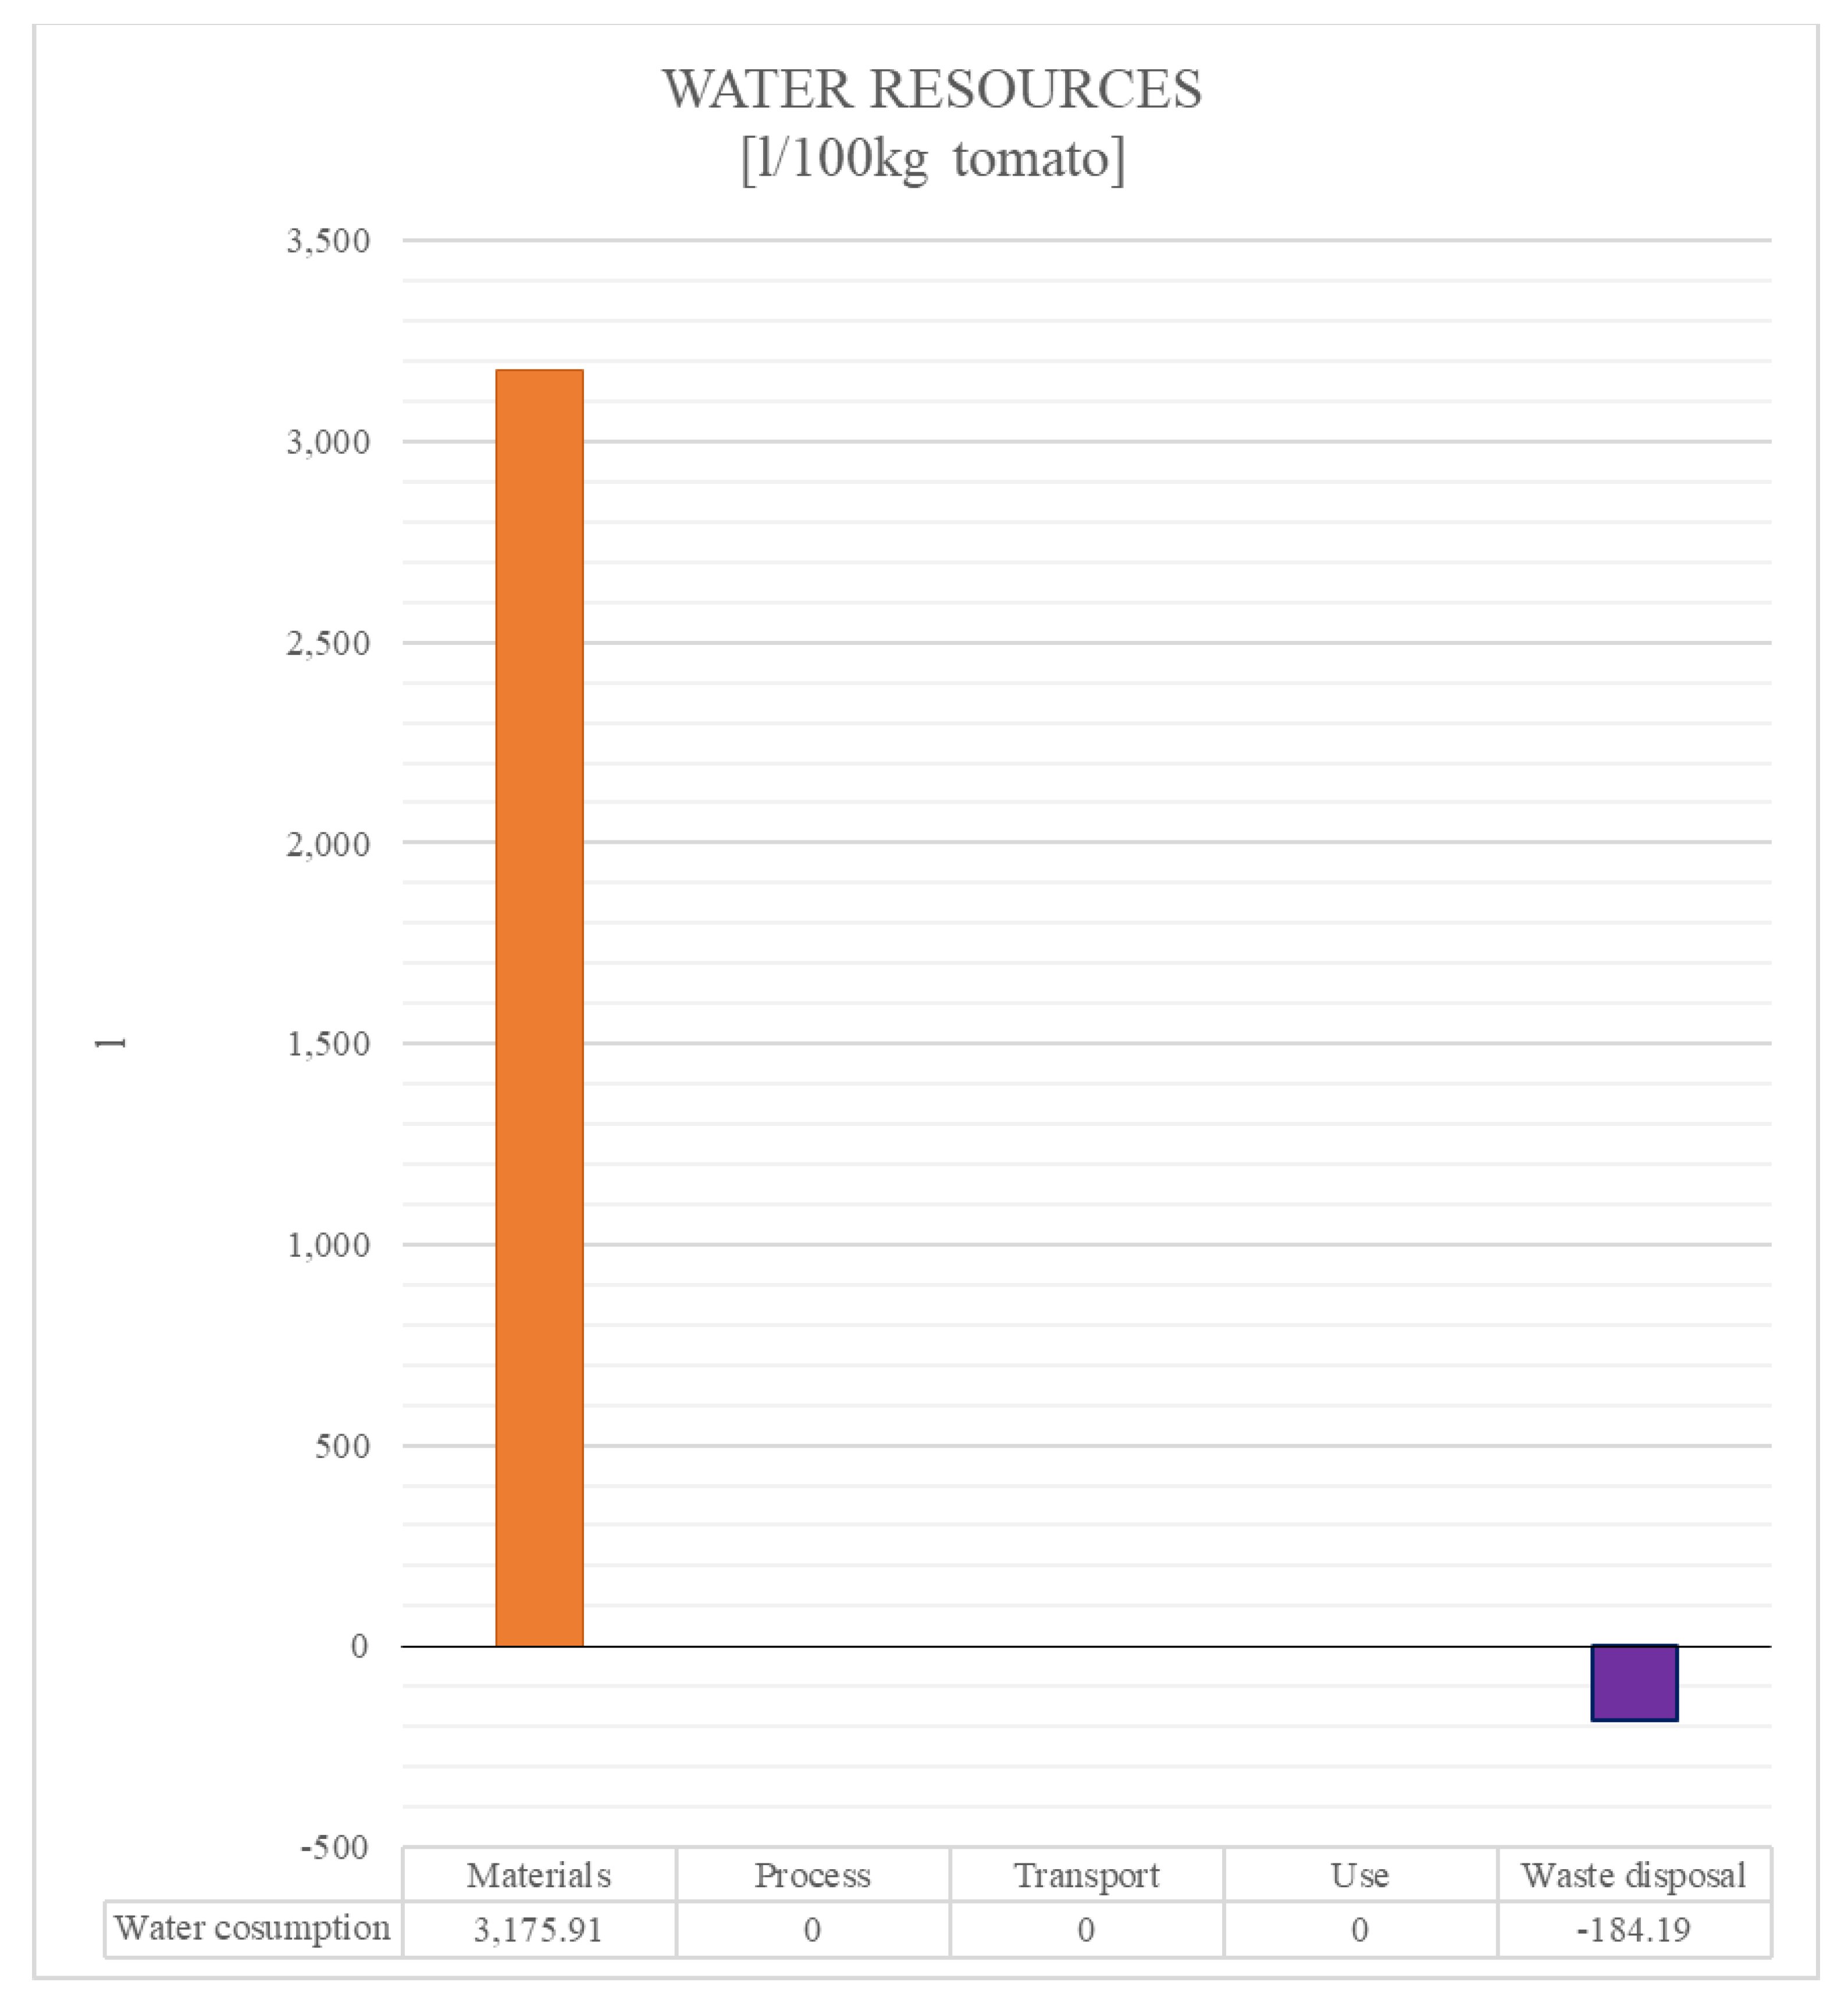
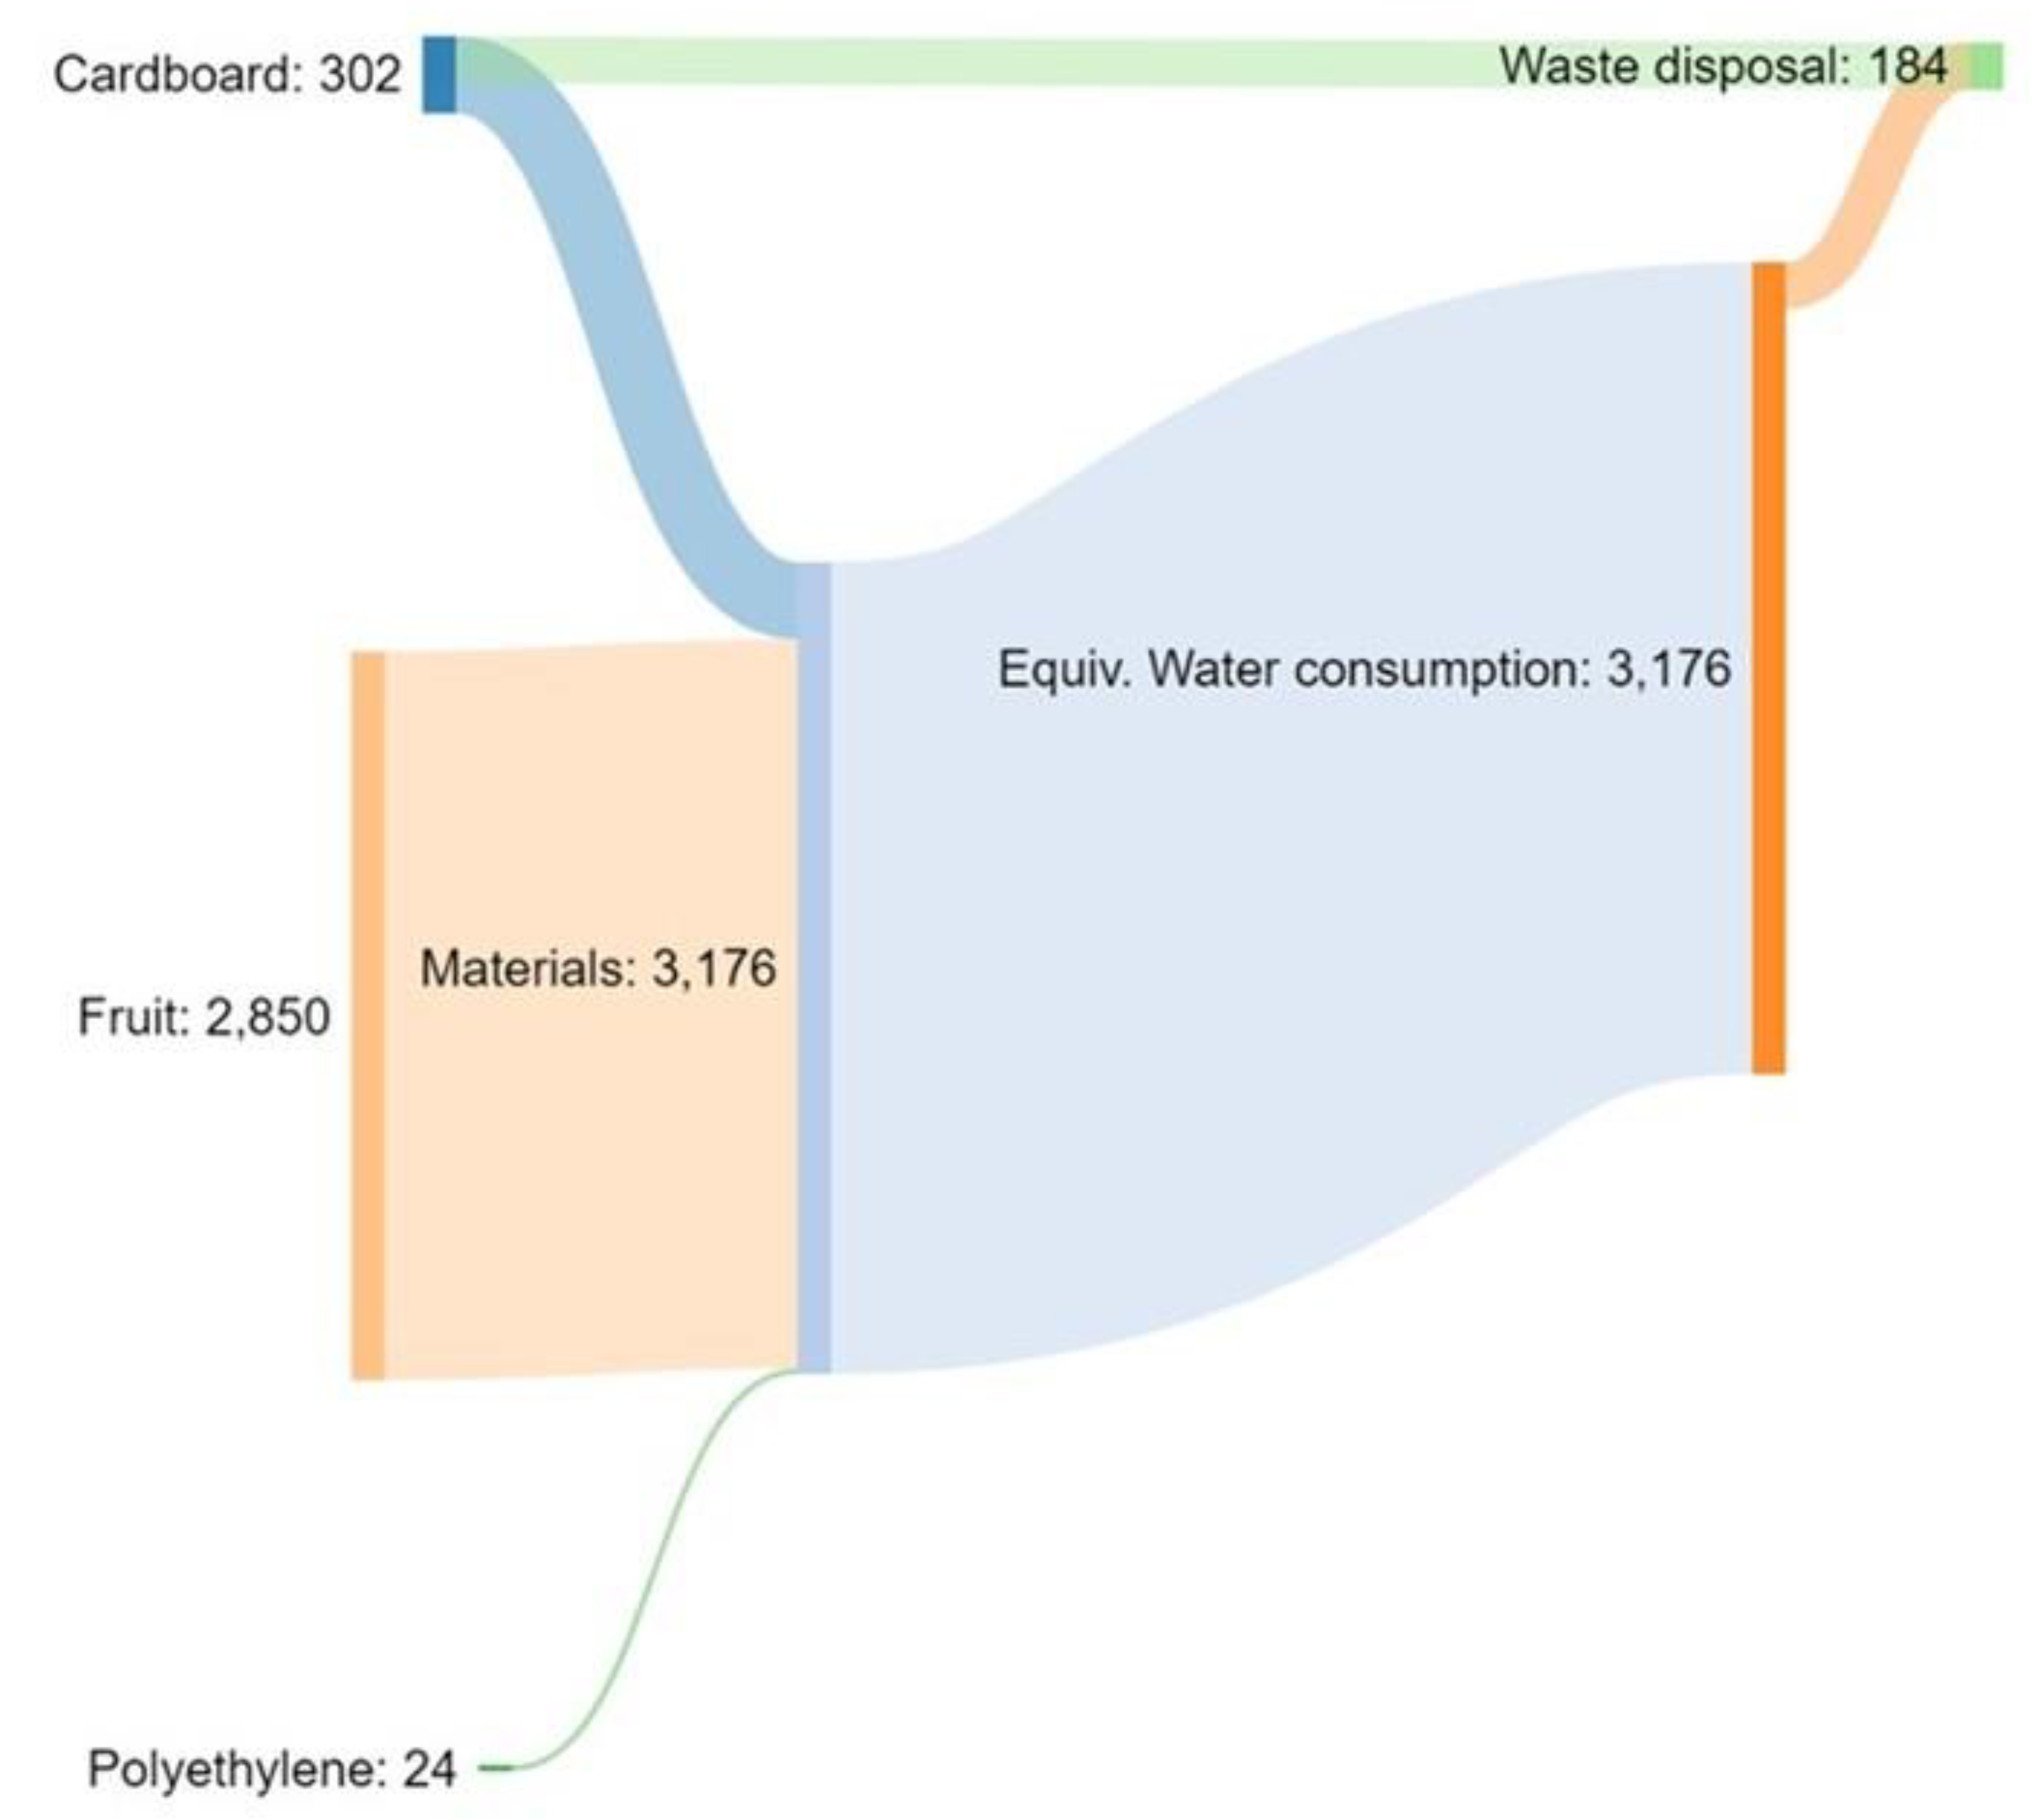
3.3. Water Consumption

With respect to the consumption and recovery of water along the production chain, it is observed that it is only consumed when materials are obtained in primary form, in the same way that water consumption is only avoided during the recycling process of the output materials of the system subject to study of the project.
The maximum water consumption occurs in the manufacturing stage of the materials, plastic and cardboard, and in the production of the fruit, the tomato (Figure 5 and Figure 6). A total of 3175.91 L of water is consumed per 100 kg of product, 90% of which is consumed in the production of the food, which is an indispensable consumption. Water is used for irrigation and is the solvent for fertilizers and pesticides needed for the growth and health of the plants.
There is no consumption of water during the packaging and processing of the plants other than the water needs for hygiene purposes of the facilities and the workers, which has not been considered here. The transportation stage does not need water, again, other than the cleaning and maintenance of vehicles, which is not considered, either. Finally, the use of tomatoes for final consumption needs a very small amount of water for rinsing, which is virtually impossible to calculate, as it largely depends on individual practices. Discarded tomatoes do not need water.
During waste management, a water consumption of 184.19 L per 100 kg of tomatoes is avoided. This volume of water avoided corresponds entirely to the recycling of the cardboard of the material leaving the system. No water is saved in the recycling of plastic nor in the composting of discarded tomatoes or the combustion of plant residue. Although the amount of water recovered is very low (5.8%), there is little room for improvement, as most water is needed for plant growth.

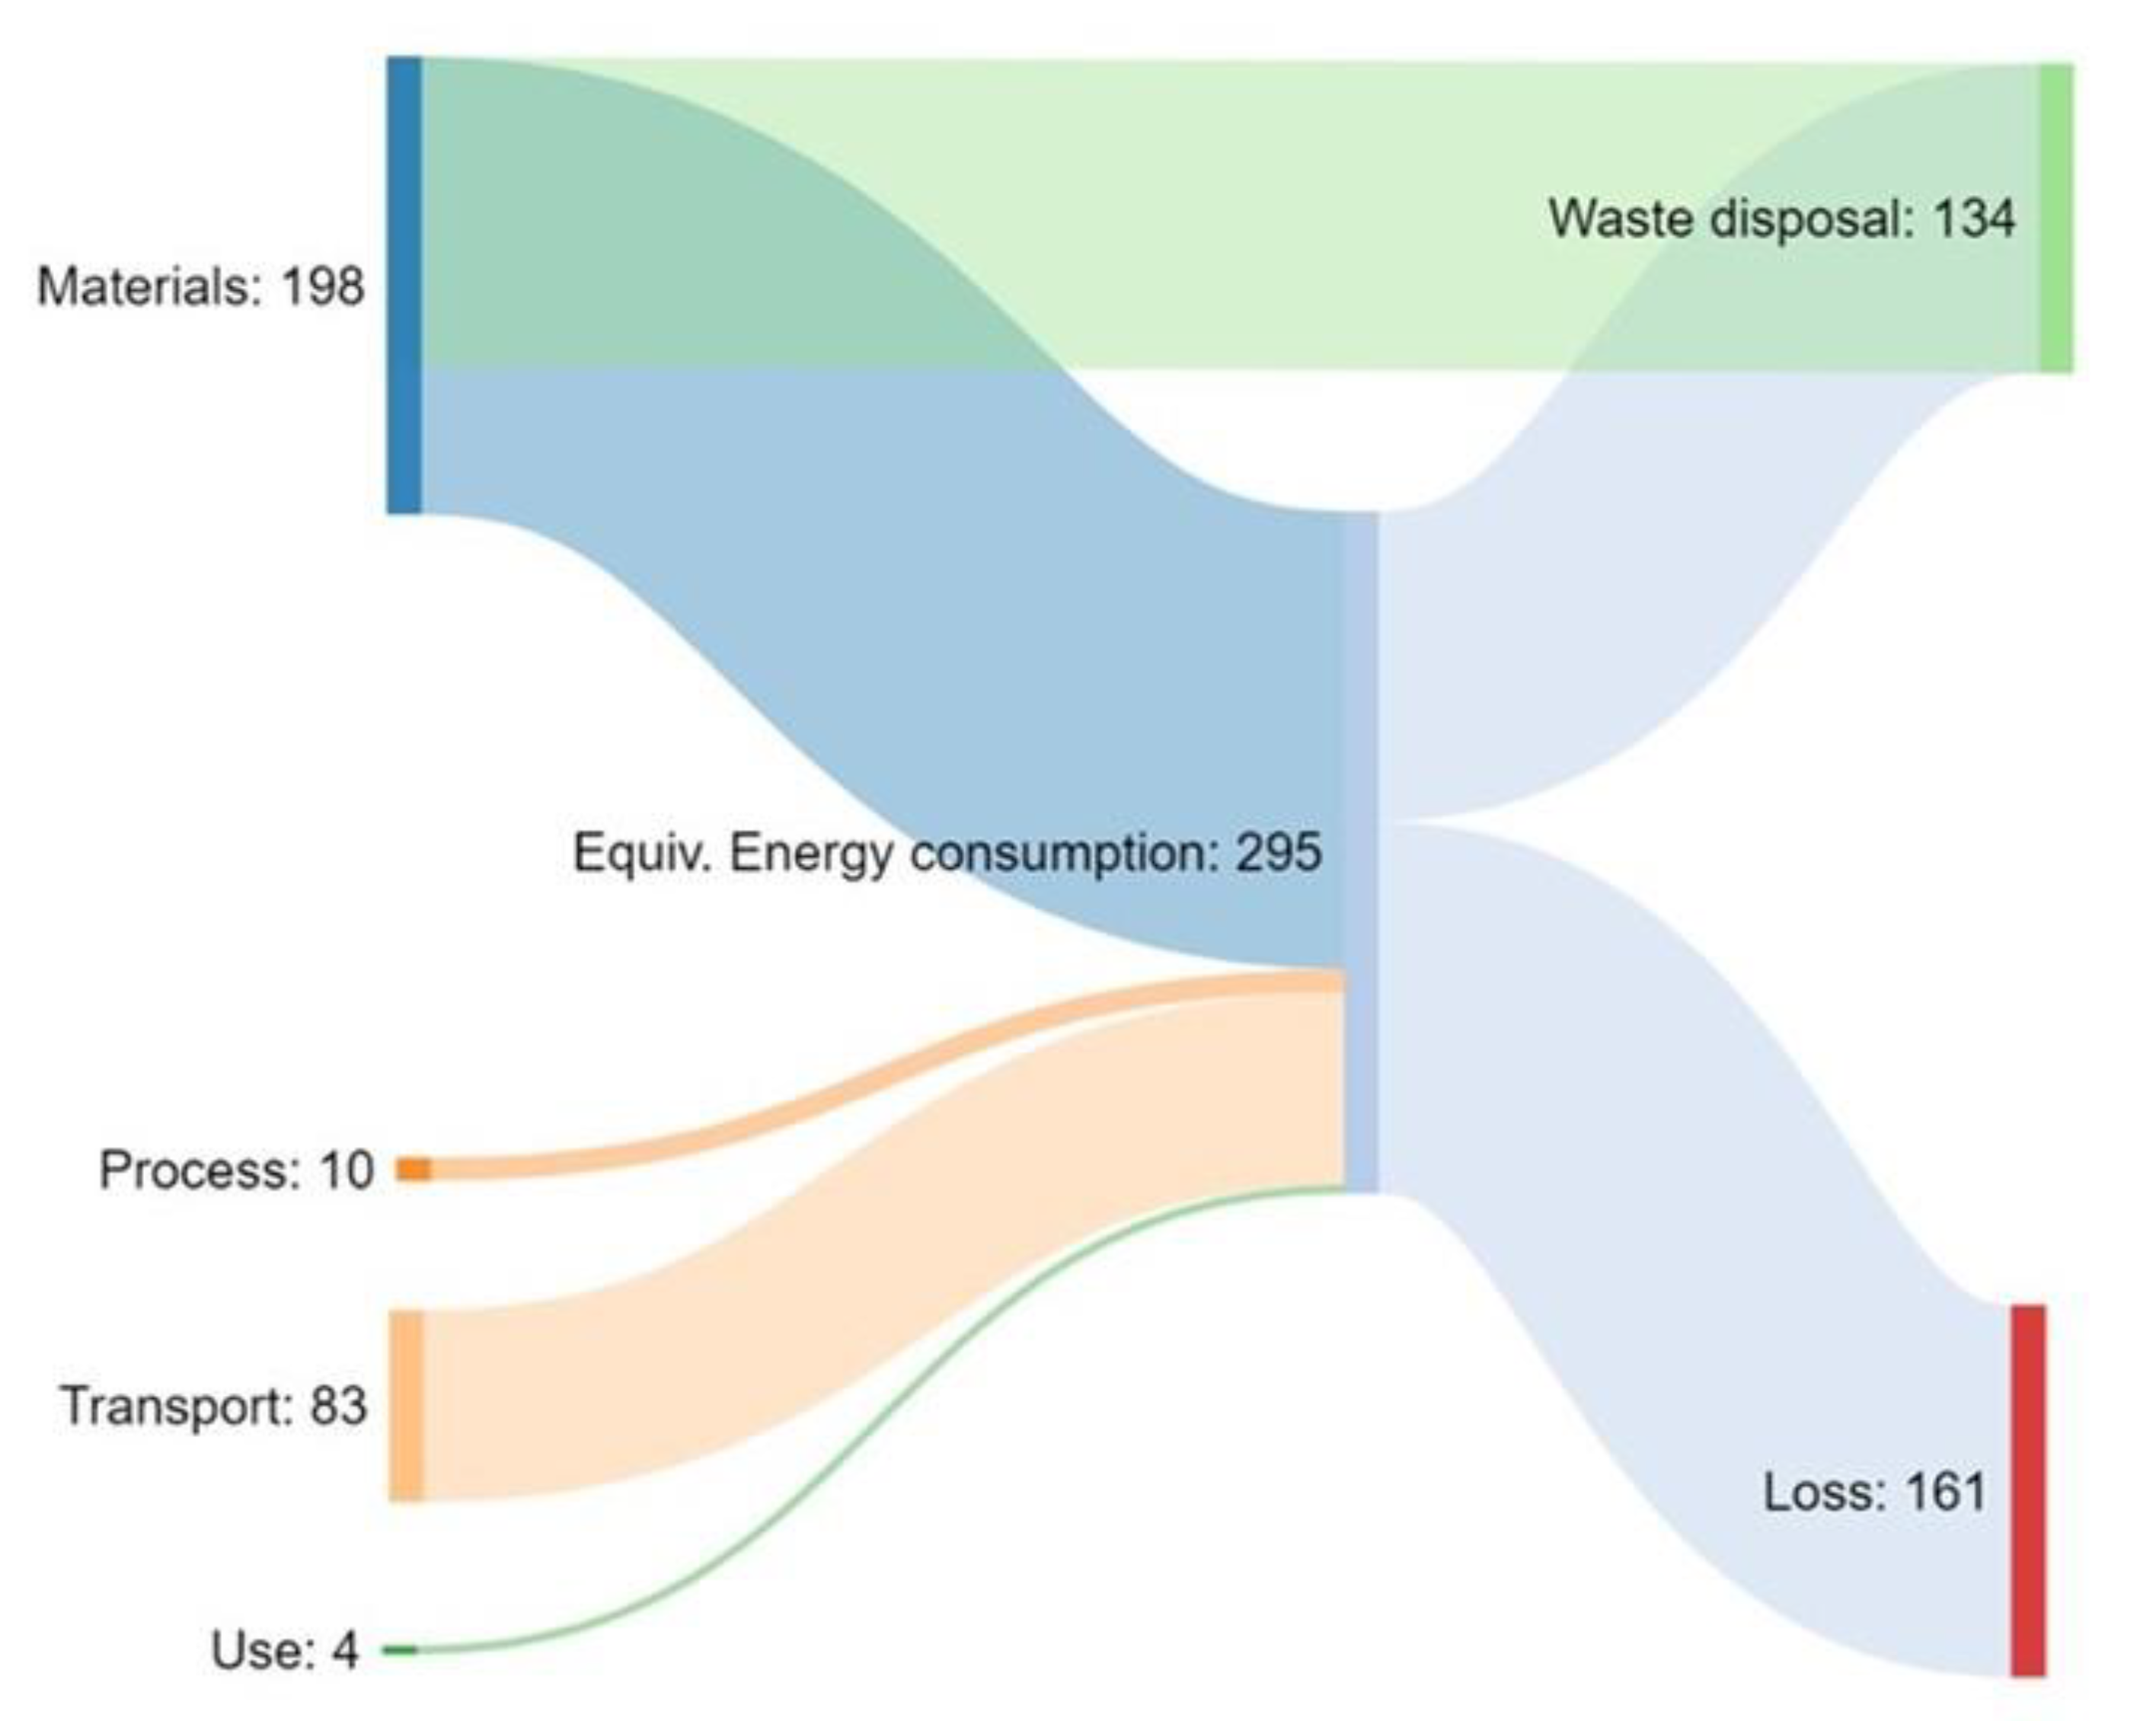
3.4. The Role of Food Losses on the Environmental Impact of Tomatoes

One of the most significant food losses in the tomato life cycle is at the use stage, with 19% of the total losses. The focus of this study lies on this stage, as this percentage is considered almost entirely avoidable. Other significant losses are 27% at the production stage, although this includes plant residue (non-harvested parts), damaged fruit during harvesting and handling, and odd-shaped fruits, among others. Of these, some are considered unavoidable losses, whereas others may still be avoidable. Since no data were found to distinguish the mass of avoidable losses, these have not been considered for analysis. Distribution has the lowest percentage of losses, with 10%, which are due to different factors, the details of which are unknown to the authors and hence could neither be considered for analysis.
Comparing the environmental impact in terms of energy expenditure, carbon emissions, and water consumption between consumed and discarded tomatoes at the use stage, the difference is lower than 3% in the case of energy consumption and emissions, being higher for discarded tomatoes. Water consumption did not vary between these two types.

4. Discussion

Tomato is one of the most common crops across the world, but it is also one of the types of food that generates most losses across its life cycle. As one-third of all food produced for human consumption is wasted globally, there is the need for measures at different levels. Such measures typically target (1) preventable food waste minimization and (2) non-preventable food waste valorization [1], as shall be seen.
The case study presented here confirms that tomatoes are a thirsty and frail crop. Most of its energy demands and carbon emissions go to packaging and transportation. There seems to be room for improvement in the recovery of energy and CO2 emissions, mainly addressing the waste treatment of packaging and plastic, as well as improving transportation. Despite being highly water demanding, irrigation processes are already efficient in industrial greenhouses, and most of the water recovery will need to take place in the waste recovery stage. Food losses at the consumption phases do not constitute large losses in energy or a large amount of carbon emissions saved.

4.1. Energy Alternatives

When evaluating the results obtained for equivalent energy consumption in the tomato production chain, the use of cardboard for transporting food under appropriate conditions generates a large impact on energy consumption, and only 45% of the energy used in its manufacture is recovered.
The cardboard boxes used in this case study are for single use only, so the analysis shows the real impact of their use. Choosing biodegradable plastic boxes that can be reused several times before they deteriorate would require reframing the analysis, as this one considered the impact of a single use. However, it is expected that the overall impact of these boxes during their life span is much lower. Therefore, in line with EU and national policies promoting the transition to the circular economy, it would be of great interest to carry out a study using reusable packaging that analyzes the impact of a single use of the packaging, as it is expected to reduce the environmental impacts of packaging [30]. Thus, the inputs of the materials belonging to the packaging would be present only in the first use, and in the rest of the times it is reused, they would be zero. On the other hand, reusable agricultural packaging has additional challenges and potential impacts, which are returning the packages and cleaning them after each use. A study comparing single-use cardboard and polypropylene foldable boxes in fact concluded that the former had a lower carbon footprint than the latter [31].
An adequate choice of packaging is not only important from the material and energy points of view but also essential to keep the fruit in top condition during transportation, in order to prevent food losses. Bruising due to vibrations en route needs to be avoided, and the materials should allow preventing heat accumulation and over maturation of the fruit, especially for long-distance transportation (e.g., [32]).
Another relevant energy consumption is during the transportation stage, with 28% of the total expenditure. The choice of mode of transportation can be relevant in this case and will be discussed below. More ethical considerations regarding the consumption of crops off-season or transported over long distances may apply, although in this case, being within the season and within a reasonable distance, these factors are not considered significant. Several authors also highlight the need to perform further studies to challenge the common idea that local, seasonal food has a lower impact on the environment, which has not yet been solidly proven [33].

4.2. Reducing CO2 Emissions

After an analysis of the results obtained with respect to carbon dioxide equivalent emissions, the emissions originated by the manufacture of the carton are indeed relevant, which reaffirms that the impact generated by a reusable container should be evaluated, as stated above.
However, the main source of emissions along the tomato production chain is the transportation of tomatoes, accounting for 40.66% of them. There are two possible ways to reduce these emissions: namely, choosing a source of road transport energy that does not generate them (hydrogen, biofuels) or shifting the mode of transportation to a cleaner one. The first is out of question in this analysis, as it is out of the control of the manufacturer.
Nowadays, there are alternatives that are sufficiently clean and just as efficient as conventional technologies, such as electric trucks and electrified rail. Since the former is yet to be developed at full scale, the discussion will focus on the second solution. It should be noted that neither guarantee the reduction of emissions at the source of production, but they do reduce them due to increased efficiency [34] and the higher probability, in the case of rail, to originate from renewable sources.
In Spain, only 4% of goods are transported by rail, placing the country at the bottom of the European Union in this form of transportation [35], which has an average of 17% and aims at reaching 50% by 2050. The convenience to implement the transportation of goods by electrified rail is supported by European policies, since the impact is 3.5 times less than that generated by road transport, in trucks [36]. Therefore, it would be very valuable to carry out actions aimed at promoting the use of electrified transport, proposing solutions, and encouraging its application.

4.3. Reducing Water Consumption

After studying the results related to water consumption along the tomato production chain, it can be observed that the highest consumption originates in the cultivation of the food crop, during irrigation and care. There is no alternative to this primary consumption of water resources, since it is essential for the crop’s production in optimal conditions. Industrial greenhouses as these are already very efficient in the use of water due to the economic cost it entails. Aspects that need to be studied with care are possible losses due to defective pipes or valves, to evaporation due to the wrong timing of watering or soil type, or less efficient irrigation mechanisms [37]. Another option to reduce this consumption would be the production of another variety of tomato, since each crop has different needs [38], even by applying advanced genetic technology to increase resistance to (a-)biotic stressors and therefore reducing their need for water [39]. In addition, other innovative options exist, such as the use of recycled or saline water [40]. Finally, one of the often-overlooked problems is the surplus harvest of food for human consumption. Although it typically is sent to landfill, alternatives such as sending it to processing or transforming it into animal feed may reduce its footprint [41].
The water consumption for cardboard production can be further reduced if the recycling rate of cardboard is upscaled to a higher percentage or a different, non-water using material is used. The choice of plastic-based reusable packaging could be an option, but it needs to be cleaned after every use and therefore consumes water in the process [31].

4.4. Considerations on Food Loss

The impact of the avoidable food loss derived from greenhouse tomatoes has only been possible to quantify in the life cycle stage of use. An increase in 3% of impact has been observed for 19% of the total losses, which were those corresponding to the use stage. Considering that an additional 37% of the tomatoes are lost in the rest of its life cycle, it can be inferred that the impact may be at least double that (i.e., ca. 6%), although the impacts will also depend on the relative needs for energy and water and amount of carbon emissions, which vary from one stage to the other. More importantly, many of these losses are considered unavoidable [42]. A study on the average calorific content of each food category in the average Swiss consumer basket concluded that 23% of the energy of the food purchased was wasted (as compared to the 19% losses in the greenhouse tomato studied here). From the Swiss study, 16% (out of this 23%, that is, more than two-thirds) is avoidable, the rest being “possibly avoidable” or unavoidable [43]. In the case of food waste at the consumption phase, there is still room to transform “unavoidable” into “possibly avoidable” losses by modifying the expectations of customers. One of the aspects that is easier to implement, is to broaden the scope of acceptable fruit from an aesthetic point of view. Odd-shaped tomatoes, typically eliminated from the distribution chain, can re-enter it with adequate marketing and awareness raising. Several initiatives exist in this respect, such as the Fruta Feia (Ugly Fruit) project in Portugal [44] or the “ugly cucumbers” labeling system performed in Canada [45]. It should be borne in mind that the losses for cosmetic reasons, as has been observed both in Europe as in the UK alone, ranges between 17% and 25% [46].
With similar figures, it seems pertinent that the focus on avoiding the environmental impact of food losses studied here should go to the treatment of these losses or waste, rather than avoiding them altogether [47]. An example of this is another type of “possibly avoidable” losses, which are those caused by tomatoes that do not comply with quality criteria early on and are lost at the production and packaging stages. These waste by-products can be transformed into pomace (i.e., the skin, pulp, and crushed-up seeds of raw tomatoes, usually found in the processing industry) and valorized via anaerobic digestion, among other similar techniques [48].
However, from a sustainability perspective, in which socioeconomic factors as well as other environmental impacts may come into view, it is important to include a broader perspective into the sustainability of greenhouse tomato, expanding to a full LCA. Sustainability analysis can also benefit from also including a social LCA analysis, as has already been done in several studies related to greenhouse tomato elsewhere [49,50,51] but is still demanded by other scholars [52].
One of the most commons strategies to avoid food losses, as indicated in the introduction, is creating incentives for the recovery or lengthening of the life cycle of food and supporting them with awareness-raising campaigns. A 19% loss in households is a significant amount of food that can be recovered and enjoyed. Thus, the public can be aligned with international and national policy objectives related to circular economy and sustainability, as is acknowledged in different studies [53] or [54], while enjoying their tomatoes the extra mile they can still get.

5. Conclusions

From the general calculations performed in this study, it can be concluded that the environmental impact of greenhouse tomato in Almería is highest for energy expenditure and CO2 emissions—the KEPI chosen by the classic eco-audit methodology—in the packaging and transportation stages, slightly less in the use stage. On the other hand, water consumption—another common LCA indicator—is highest in the production stage, as it is needed for plant growth.
From the literature, tomato losses are being observed in all five stages of its production life cycle, being highest in the production and in the use stages. In the former, most of these losses are considered unavoidable and can be compensated by choosing a disposal method that allows the recovery of the energy or material embedded in it. The water consumption can be reduced only with even more efficient processes or choosing varieties that are more resistant to water stress. These are considered partially avoidable losses. Food waste, i.e., food loss at the use stage, has a relatively higher impact on energy consumption. This type of loss is mostly avoidable and can be addressed via socioeconomic incentives, marketing strategies, and awareness campaigns. This is the stage with the best potential for improvement.
Thus, it can be concluded that the stage with the highest possibilities for improvement is the use of the tomatoes, although the tools to save environmental impacts are more of a socioeconomic nature. Further research is needed to pinpoint other impacts in the different stages, for which a more detailed analysis is needed via a full (social) LCA.

Author Contributions

Conceptualization, J.C.R. and K.H.-K.; methodology, K.H.-K.; investigation, R.G.-F.; resources, R.G.-F.; data curation, R.G.-F., J.C.R., K.H.-K.; writing—original draft preparation, R.G.-F., K.H.-K.; writing—review and editing, J.C.R. and K.H.-K. All authors have read and agreed to the published version of the manuscript.

Funding

This research received no external funding.

Institutional Review Board Statement

Not applicable.

Informed Consent Statement

Not applicable.

Data Availability Statement

Regarding data, the authors will provide details upon requirement.

Conflicts of Interest

The authors declare no conflict of interest.

References

  1. Morone, P.; Koutinas, A.; Gathergood, N.; Arshadi, M.; Matharu, A. Food Waste: Challenges and Opportunities for Enhancing the Emerging Bio-Economy. J. Clean Prod. 2019, 221, 10–16. [Google Scholar] [CrossRef]
  2. Gustafsson, J.; Cederberg, C.; Sonesson, U. The Methodology of the FAO Study: Global Food Losses and Food Waste-Extent, Causes and Prevention-FAO, 2011; SIK Institutet för Livsmedel och Bioteknik: Göteborg, Sweden, 2013. [Google Scholar]
  3. Teigiserova, D.A.; Hamelin, L.; Thomsen, M. Towards Transparent Valorization of Food Surplus, Waste and Loss: Clarifying Definitions, Food Waste Hierarchy, and Role in the Circular Economy. Sci. Total Environ. 2020, 706, 136033. [Google Scholar] [CrossRef]
  4. World Resources Institute. Creating a Sustainable Food Future: A Menu of Solutions. Available online: https://www.wri.org/research/creating-sustainable-food-future (accessed on 9 August 2021).
  5. IPCC Summary for Policy Makers. Climate Change 2014 Impacts, Adaptation Vulnerability—Contribution of Working Group II to the Fifth Assessment Report of the Intergovernmental Panel on Climate Change; Cambridge University Press: Cambridge, UK, 2014; pp. 1–32. [Google Scholar] [CrossRef]
  6. Xue, L.; Liu, G.; Parfitt, J.; Liu, X.; Herpen, E.; Van Stenmarck, Å.; O’Connor, C.; Östergren, K.; Cheng, S. Missing Food, Missing Data? A Critical Review of Global Food Losses and Food Waste Data. Environ. Sci. Technol. 2017, 51, 6618–6633. [Google Scholar] [CrossRef] [PubMed]
  7. Canali, M.; Amani, P.; Aramyan, L.; Gheoldus, M.; Moates, G.; Östergren, K.; Silvennoinen, K.; Waldron, K.; Vittuari, M. Food Waste Drivers in Europe, from Identification to Possible Interventions. Sustainability 2016, 9, 37. [Google Scholar] [CrossRef] [Green Version]
  8. Vittuari, M.; Politano, A.; Gaiani, S.; Canali, M.; Elander, M. Review of EU Legislation and Policies with Implications on Food Waste; European Union: Brussels, Belgium, 2015. [Google Scholar]
  9. Ilgin, M.A.; Gupta, S.M. Environmentally Conscious Manufacturing and Product Recovery (ECMPRO): A Review of the State of the Art. J. Environ. Manag. 2010, 91, 563–591. [Google Scholar] [CrossRef]
  10. Scherhaufer, S.; Moates, G.; Hartikainen, H.; Waldron, K.; Obersteiner, G. Environmental Impacts of Food Waste in Europe. Waste Manag. 2018, 77, 98–113. [Google Scholar] [CrossRef] [PubMed]
  11. Mondello, G.; Salomone, R.; Ioppolo, G.; Saija, G.; Sparacia, S.; Lucchetti, M.C. Comparative LCA of Alternative Scenarios for Waste Treatment: The Case of Food Waste Production by the Mass-Retail Sector. Sustainability 2017, 9, 827. [Google Scholar] [CrossRef] [Green Version]
  12. Beretta, C.; Hellweg, S. Potential Environmental Benefits from Food Waste Prevention in the Food Service Sector. Resour. Conserv. Recycl. 2019, 147, 169–178. [Google Scholar] [CrossRef]
  13. Wikström, F.; Williams, H.; Venkatesh, G. The Influence of Packaging Attributes on Recycling and Food Waste Behaviour—An Environmental Comparison of Two Packaging Alternatives. J. Clean Prod. 2016, 137, 895–902. [Google Scholar] [CrossRef] [Green Version]
  14. Rigamonti, L.; Grosso, M.; Giugliano, M. Life Cycle Assessment of Sub-Units Composing a MSW Management System. J. Clean Prod. 2010, 18, 1652–1662. [Google Scholar] [CrossRef]
  15. Saer, A.; Lansing, S.; Davitt, N.H.; Graves, R.E. Life Cycle Assessment of a Food Waste Composting System: Environmental Impact Hotspots. J. Clean Prod. 2013, 52, 234–244. [Google Scholar] [CrossRef]
  16. Yeo, J.; Chopra, S.S.; Zhang, L.; An, A.K. Life Cycle Assessment (LCA) of Food Waste Treatment in Hong Kong: On-Site Fermentation Methodology. J. Environ. Manag. 2019, 240, 343–351. [Google Scholar] [CrossRef]
  17. Andersson, K.; Ohlsson, T.; Olsson, P. Screening Life Cycle Assessment (LCA) of Tomato Ketchup: A Case Study. J. Clean Prod. 1998, 6, 277–288. [Google Scholar] [CrossRef]
  18. Gasol, C.M.; Salvia, J.; Serra, J.; Antón, A.; Sevigne, E.; Rieradevall, J.; Gabarrell, X. A Life Cycle Assessment of Biodiesel Production from Winter Rape Grown in Southern Europe. Biomass Bioenergy 2012, 40, 71–81. [Google Scholar] [CrossRef]
  19. Denny, G.M. Urban agriculture and seasonal food footprints: An LCA study of tomato production and consumption in the UK. In Sustainable Food Planning: Evolving Theory and Practice; Chapter 27; Wageningen Academic Publishers: Wageningen, The Netherlands, 2012; pp. 323–336. [Google Scholar] [CrossRef]
  20. Torrellas, M.; Antón, A.; López, J.C.; Baeza, E.J.; Parra, J.P.; Muñoz, P.; Montero, J.I. LCA of a Tomato Crop in a Multi-Tunnel Greenhouse in Almeria. Int. J. Life Cycle Assess. 2012, 17, 863–875. [Google Scholar] [CrossRef]
  21. Bernstad Saraiva Schott, A.; Andersson, T. Food Waste Minimization from a Life-Cycle Perspective. J. Environ. Manag. 2015, 147, 219–226. [Google Scholar] [CrossRef] [PubMed]
  22. Zarei, M.J.; Kazemi, N.; Marzban, A. Life Cycle Environmental Impacts of Cucumber and Tomato Production in Open-Field and Greenhouse. J. Saudi Soc. Agric. Sci. 2019, 18, 249–255. [Google Scholar] [CrossRef]
  23. Canaj, K.; Mehmeti, A.; Cantore, V.; Todorović, M. LCA of Tomato Greenhouse Production Using Spatially Differentiated Life Cycle Impact Assessment Indicators: An Albanian Case Study. Environ. Sci. Pollut. Res. 2020, 27, 6960–6970. [Google Scholar] [CrossRef]
  24. Benedetti, B.; De Toso, D.; Baldo, G.L.; Rollino, S. EcoAudit: A Renewed Simplified Procedure to Facilitate the Environmentally Informed Material Choice Orienting the Further Life Cycle Analysis for Ecodesigners. Mater. Trans. 2010, 51, 832–837. [Google Scholar] [CrossRef] [Green Version]
  25. European Commission. Life Cycle Indicators Framework: Development of Life Cycle Based Macro-Level Monitoring Indicators for Resources, Products and Waste for the EU-27; Institute for Environment and Sustainability: Luxembourg, 2012. [Google Scholar]
  26. The CES EduPack Eco Audit Tool? A White Paper—MAELabs UCSD. Available online: https://www.yumpu.com/en/document/view/18639559/the-ces-edupack-eco-audit-tool-a-white-paper-maelabs-ucsd (accessed on 29 July 2021).
  27. González, R. Evaluación del Impacto Energético-Ambiental Asociado a la Pérdida y el Desperdicio de Alimentos en España; Comillas Pontifical University: Madrid, Spain, 2021. [Google Scholar]
  28. Lipińska, M.; Tomaszewska, M.; Kołożyn-Krajewska, D. Identifying Factors Associated with Food Losses during Transportation: Potentials for Social Purposes. Sustainability 2019, 11, 2046. [Google Scholar] [CrossRef] [Green Version]
  29. Bani, R.J.; Josiah, M.N.; Kra, E.Y. Postharvest Losses of Tomatoes in Transit; University of Ghana: Accra, Ghana, 2006. [Google Scholar]
  30. Singh, J.; Shani, A.B.R.; Femal, H.; Deif, A. Packaging’s Role in Sustainability: Reusable Plastic Containers in the Agricultural-Food Supply Chains. Organ. Sustain. Eff. 2016, 5, 175–204. [Google Scholar] [CrossRef]
  31. Lo-Iacono-Ferreira, V.; Viñoles-Cebolla, R.; Bastante-Ceca, M.; Capuz-Rizo, S. Carbon Footprint Comparative Analysis of Cardboard and Plastic Containers Used for the International Transport of Spanish Tomatoes. Sustainability 2021, 13, 2552. [Google Scholar] [CrossRef]
  32. Chonhenchob, V.; Singh, S.P. A Comparison of Corrugated Boxes and Reusable Plastic Containers for Mango Distribution. Packag. Technol. Sci. 2003, 16, 231–237. [Google Scholar] [CrossRef]
  33. Edwards-Jones, G. Does Eating Local Food Reduce the Environmental Impact of Food Production and Enhance Consumer Health? Proc. Nutr. Soc. 2010, 69, 582–591. [Google Scholar] [CrossRef] [PubMed] [Green Version]
  34. Pérez-Martínez, P.J.; Sorba, I.A. Energy Consumption of Passenger Land Transport Modes. Energy Environ. 2010, 21, 577–600. [Google Scholar] [CrossRef]
  35. Ministerio de Transportes, Movilidad y Agenda Urbana. Report of the Technical-Scientific Commission for the Study of Improvements in the Railway Sector. Available online: https://www.mitma.gob.es/ferrocarriles/informe-para-el-estudio-de-mejoras-en-sector-ferroviario/english-version (accessed on 28 July 2021).
  36. McKinnon, A.C. Green Logistics: Improving the Environmental Sustainability of Logistics; Kogan Page: London, UK, 2010; p. 372. [Google Scholar]
  37. Gerçek, S.; Demirkaya, M.; Işik, D. Water Pillow Irrigation versus Drip Irrigation with Regard to Growth and Yield of Tomato Grown under Greenhouse Conditions in a Semi-Arid Region. Agric. Water Manag. 2017, 180, 172–177. [Google Scholar] [CrossRef]
  38. Valenzano, V.; Parente, A.; Serio, F.; Santamaria, P. Effect of Growing System and Cultivar on Yield and Water-Use Efficiency of Greenhouse-Grown Tomato. J. Hortic. Sci. Biotechnol. 2008, 83, 71–75. [Google Scholar] [CrossRef]
  39. Wang, T.; Zhang, H.; Zhu, H. CRISPR Technology Is Revolutionizing the Improvement of Tomato and Other Fruit Crops. Hortic. Res. 2019, 6, 77. [Google Scholar] [CrossRef] [PubMed] [Green Version]
  40. Cheng, J.; Shearin, T.E.; Peet, M.M.; Willits, D.H. Utilization of Treated Swine Wastewater for Greenhouse Tomato Production. Water Sci. Technol. 2004, 50, 77–82. [Google Scholar] [CrossRef]
  41. Løvdal, T.; Droogenbroeck, B.; Van Eroglu, E.C.; Kaniszewski, S.; Agati, G.; Verheul, M.; Skipnes, D. Valorization of Tomato Surplus and Waste Fractions: A Case Study Using Norway, Belgium, Poland, and Turkey as Examples. Foods 2019, 8, 229. [Google Scholar] [CrossRef] [PubMed] [Green Version]
  42. Global Food Losses and Food Waste. Available online: http://www.fao.org/3/mb060e/mb060e00.htm (accessed on 28 July 2021).
  43. Beretta, C.; Stoessel, F.; Baier, U.; Hellweg, S. Quantifying Food Losses and the Potential for Reduction in Switzerland. Waste Manag. 2013, 33, 764–773. [Google Scholar] [CrossRef] [Green Version]
  44. Ribeiro, I.; Sobral, P.; Peças, P.; Henriques, E. A Sustainable Business Model to Fight Food Waste. J. Clean Prod. 2018, 177, 262–275. [Google Scholar] [CrossRef]
  45. Mookerjee, S.; Cornil, Y.; Hoegg, J. From Waste to Taste: How “Ugly” Labels Can Increase Purchase of Unattractive Produce. J. Mark. 2021, 85, 62–77. [Google Scholar] [CrossRef]
  46. Porter, S.D.; Reay, D.S.; Bomberg, E.; Higgins, P. Avoidable Food Losses and Associated Production-Phase Greenhouse Gas Emissions Arising from Application of Cosmetic Standards to Fresh Fruit and Vegetables in Europe and the UK. J. Clean Prod. 2018, 201, 869–878. [Google Scholar] [CrossRef] [Green Version]
  47. Bernstad, A.K.; Cánovas, A.; Valle, R. Consideration of Food Wastage along the Supply Chain in Lifecycle Assessments: A Mini-Review Based on the Case of Tomatoes. Waste Manag. Res. 2017, 35, 29–39. [Google Scholar] [CrossRef]
  48. Benítez, J.J.; Castillo, P.M.; Del Río, J.C.; León-Camacho, M.; Domínguez, E.; Heredia, A.; Guzmán-Puyol, S.; Athanassiou, A.; Heredia-Guerrero, J.A. Valorization of Tomato Processing by-Products: Fatty Acid Extraction and Production of Bio-Based Materials. Materials 2018, 11, 2211. [Google Scholar] [CrossRef] [Green Version]
  49. Benoît, C.; Parent, J.; Kuenzi, I.; Revéret, J.-P. Corporate social responsibilities. In Developing a Methodology for Social Life Cycle Assessment: The North American Tomato’s CSR Case, Proceedings of the Governance and Life Cycle Analysis Opportunities for Going Beyond ISO-LCA, Brussels, Belgium, 27–28 September 2007; CIRAIG: Montréal, QC, Canada, 2007. [Google Scholar]
  50. Bouzid, A.; Padilla, M. Analysis of Social Performance of the Industrial Tomatoes Food Chain in Algeria. New Medit 2014, 13, 60–66. [Google Scholar]
  51. Petti, L.; Sanchez Ramirez, P.K.; Traverso, M.; Ugaya, C.M.L. An Italian Tomato “Cuore Di Bue” Case Study: Challenges and Benefits Using Subcategory Assessment Method for Social Life Cycle Assessment. Int. J. Life Cycle Assess. 2018, 23, 569–580. [Google Scholar] [CrossRef]
  52. Gillman, A.; Campbell, D.C.; Spang, E.S. Does On-Farm Food Loss Prevent Waste? Insights from California Produce Growers. Resour. Conserv. Recycl. 2019, 150, 104408. [Google Scholar] [CrossRef] [Green Version]
  53. Goossens, Y.; Wegner, A.; Schmidt, T. Sustainability Assessment of Food Waste Prevention Measures: Review of Existing Evaluation Practices. Front. Sustain. Food Syst. 2019, 3, 90. [Google Scholar] [CrossRef]
  54. Hebrok, M.; Boks, C. Household Food Waste: Drivers and Potential Intervention Points for Design—An Extensive Review. J. Clean Prod. 2017, 151, 380–392. [Google Scholar] [CrossRef]
Figure 1. Energy consumption of 100 kg of greenhouse tomatoes per life cycle stage (in MJ).
World 02 00027 g001
Figure 2. Energy flows needed and lost for 100 kg of greenhouse tomatoes (in MJ).
World 02 00027 g002
Figure 3. CO2 emissions of 100 kg of greenhouse tomatoes per life cycle stage (in kg).
World 02 00027 g003
Figure 4. CO2 emissions of 100 kg of greenhouse tomatoes per life cycle stage, including avoided emissions (in kg).
World 02 00027 g004
Figure 5. Water consumption of 100 kg of greenhouse tomatoes per life cycle stage (in L).
World 02 00027 g005
Figure 6. Water consumption for 100 kg of greenhouse tomatoes per life cycle stage (in L).
World 02 00027 g006
Table 1. Baseline data for the environmental impact calculations for the life cycle stages of the greenhouse tomato, per 100 kg of tomatoes.
Life Cycle StageSystem BoundariesEnergyCO2-e
Emissions
Water
MaterialsLDPE0.4131 kg81 MJ/kg2.8 kg CO2/kg58 L/kg
Water2850 LEmbedded in fruit-1 L/kg
Nutrients4.6125 kgEmbedded in fruit-See water
Cardboard3.226 kg51 MJ/kg1.2 kg CO2/kg93.6 L/kg
ProcessingGreenhouseN/A11.594 kWh…0.9 MJ/kWh 10.06 CO2/kWh-
PackagingN/AManual work--
TransportationDiesel 14 t truck550 km1.5 MJ/km/t0.11 kg CO2/Km/t-
UseConsumed3 d in fridge3.4768 kWh…0.9 MJ/kWh 10.06 CO2/kWh-
Discarded7 d in fridge6.7881 kWh…0.9 MJ/kWh 10.06 CO2/kWh-
Disposal
(tomatoes)
Losses at greenhouse0.5498 kg---
Losses at packaging2 kg---
Losses at distribution9.8 kg---
Losses in households (compost)16.8 kg (33%)−1.33 MJ/kg--
Disposal
(other)
Combustion fresh residue (plant parts)0.5498 kg−15.194 MJ/kg 2--
Recycling LDPE8.44%−27.3 MJ/kg 2−1.02 kg CO2/kg 2-
Combustion LDPE91.66%−45.1 MJ/kg 23.14 kg CO2/kg-
Recycling cardboard72%−18.85 MJ/kg 2−0.973 kg CO2/kg 2−61% 2
Combustion cardboard28%−19.7 MJ/kg1.835 kg CO2/kg-
1 Data for energy mix in MJ-OE (oil-equivalent) in France, closest to the case of Spain. 2 Written in negative to express the recovery of energy/emissions/water.
Publisher’s Note: MDPI stays neutral with regard to jurisdictional claims in published maps and institutional affiliations.

