Abstract
This paper deals with a non-contact method to identify the aerodynamic propeller constants of the Parrot AR.Drone quadrotor. The experimental setup consists of a microphone installed in the flight arena to record audio data. In terms of methodology, a spectrogram analysis is adopted to estimate the propeller velocity based on the filtered sound signal. It is known that, in a hovering maneuver, when the UAV mass increases, the propellers rotate faster to produce the necessary thrust increment. In this work, the rotorcraft takes off with its factory settings, first with no hull, corresponding to a mass of 413 g, and after with a small hull, corresponding to a mass of 444 g, and a bigger hull, corresponding to a mass of 462 g. In the sequence, the velocity of the propellers are estimated for each of these three cases using spectrograms of audio recorded by a microphone, corresponding to the sound generated by the four rotors. Finally, the estimated velocity is used to identify the aerodynamic parameters, thus validating the proposal.
1. Introduction
Recent advances in technology have generated high-performance Unmanned Aerial Vehicles (UAVs), which have been used in a wide range of applications. Most such advances are related to the increasing computational power of embedded systems and the improvement in sensor accuracy. However, UAV navigation is still a challenge, motivating research groups worldwide to develop UAV navigation systems.
Rotorcraft UAVs, in particular, have become a great testbed, due to its three-dimensional mobility when compared with ground vehicles or even other aerial ones (airplanes and balloons, for instance). However, such an advantage has a price: they are inherently unstable nonlinear multi-variable systems with complex and highly coupled dynamics [1].
The design of a suitable controller for such UAVs starts from a dynamic model representing them. However, precise modeling of the UAV model is also a challenge. In [2], the mathematical model of a quadrotor, obtained using Euler–Lagrange equations, is represented as a cascade connection of four interconnected subsystems, which compose the low- and high-level models. The low-level part represents the actuator model (which involves the input signals, the internal PD control loop, the electronic speed controller, the dynamics, and the angular velocities of the motors and the generated thrust), whereas the high-level one corresponds to the rigid body dynamics (which considers the thrust applied to the UAV body and its 3-D displacement.
Nonetheless, to automatically control the flight of a UAV using a controller designed considering its dynamic model, reliable sensory information is necessary. For the Parrot AR.Drone quadrotor, the UAV used in this work, this information is provided by a inertial measurement unity (IMU), an ultrasound sensor, and a built-in camera. Then, a Kalman filter algorithm embedded on its firmware is responsible for determining its altitude, attitude, and linear and angular velocities by performing a data fusion procedure. As a result, such a UAV can accomplish several flight tasks, including collision avoidance, as described in [3,4,5].
The whole parameter identification for a quadrotor requires input signal information, rotor-speed values, and a 3-D pose during a non-constrained flight. In the case of rotor-speed estimation, one can use the mathematical model of the propeller system and then validate it with a tachometer sensor, for instance. This is illustrated in [6], where an identification technique allows for estimating the brushless motor parameters of RC helicopters and quadrotors. A rotary encoder and a hall sensor inform about the rotor-speed and the electric current supplied to reach such speed, respectively, thus making it possible to indirectly estimate the velocity of the propellers.
Using spectrograms is another way to estimate rotational velocities, with the advantage of not demanding the mechanical contact or proximity necessary when using optical sensors or other measuring equipment. According to [7], there is a proportional relationship between the audio frequency and the angular frequency. An example is discussed in [8], where acoustic signals and mechanical vibration produced by a motor are recorded and then analyzed. In the case of aerial robotics, spectrogram and sound processing can be used to identify the acoustic signature and to classify UAVs [9]; to determine the altitude, velocity, and revolutions per minute of an aircraft [10]; and to estimate the UAV location based on beacon signals [11]. In this last case, the strategy adopted allowed us to identify the UAV at long distances and to determine the number of revolutions per minute of the rotors as well, using the Doppler effect. Moreover, in [12], a microphone array was used to track a light-weight aircraft and to measure its variables.
Another perspective is to use a microphone array in the quadrotor for use in missions involving “search and locate” or sound source localization. In such applications, however, one certainly deals with a noisy environment, since the microphone array is mounted in the quadrotor. The same happened in the cases reported in [13,14], which used a microphone array to detect humans in disaster situations in missions of “search and rescue”. Reference [15] proposed a compass made of microphones that are used for sound source localization.
Acoustic technologies have also become an important tool for solving problems related to the navigation of UAV swarms. In [16], the noise emitted by the propellers was used to detect and identify the position of the UAVs, minimizing the risk of mid-air collision (it is well known that there is an imminent risk of collision when UAVs share the airspace).
The sound signature of a UAV was studied in [17]. The Flyper autonomous helicopter was mounted on a platform, where a set of microphones recorded its acoustic signal. Then, the rotor speed information was extracted and evaluated without any prior knowledge about its acoustic properties. In such a case, the genetic algorithm identifies frequency bands while the neural network estimates the rotor speed.
In a similar way, the present work aims to estimate the propeller velocity of a rotary-wing vehicle, the AR.Drone Parrot quadrotor. However, in our approach, the UAV flies without constraints in an indoor environment. A single stationary microphone installed in the flight arena captures its acoustic signal, and spectrogram analysis is used to estimate the rotation speeds of its rotors. Thus, the constants related to the propellers, associated with the low-level model of the quadrotor, can be determined. Notice that this is a non-contact measurement, which avoids risk to the user when trying, for instance, to manually measure the rotor speed, and allows us to obtain the value of such parameters even when dealing with vehicles that do not provide such information through the embedded sensors (close vehicles).
To deal with this subject, this paper is hereinafter split in a few sections, starting with Section 2, which briefly presents the quadrotor dynamic model, emphasizing its rotary wing dynamics (thrust model). Subsequently, Section 3 describes the experimental setup adopted, whereas Section 4 shows and discusses the results obtained. The analysis of the acoustic spectrogram is also presented. Finally, Section 5 highlights the main conclusions and gives suggestions for the continuity of the research.
2. The Dynamic Model of the Quadrotor
Figure 1 illustrates the reference frames and the propeller forces acting on the quadrotor. Its complete model can be represented by four interconnected subsystems [18], as shown in Figure 2. The actuator dynamics is responsible for transforming the servo inputs into rotor speed. The rotary wing dynamics relates the aerodynamic parameters to the thrust/propulsion. The force/torques generation decomposes the thrust into the 3-D forces/torques actuating on the UAV rigid body. Finally, the rigid body dynamics describes the aircraft displacement in the Cartesian space.
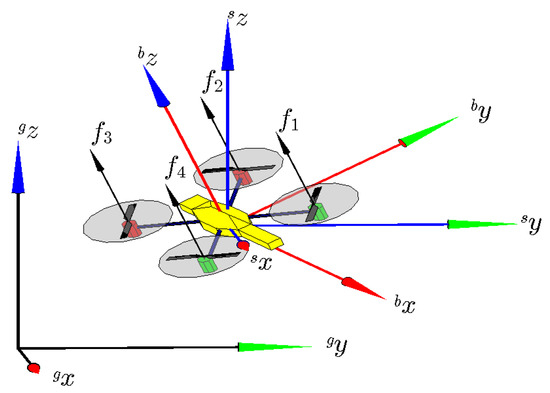
Figure 1.
Six-DOF CAD model of a quadrotor, including the reference frames and abstract control inputs (forces ) associated with it. The inertial, the spatial, and the body reference frames are referred to as , and , respectively.

Figure 2.
Block diagram of the UAV complete model.
The two first subsystems in Figure 2 are commonly labeled the Low-level Model. They receive the control signals and transform them into real forces applied to the aircraft, with all of them in the normal direction (see Figure 1). The other two subsystems are the High-level Model, which describes the aircraft movement in 3-D space. More details about the complete model can be found in [19].
The rotary wing dynamics (also called thrust model) is the focus of this work. According to [20,21,22], these dynamics can be approximated and written as
where and are the thrust and load torque generated by the ith motor, respectively. Moreover, and are the aerodynamic constants, which are dependent on the number, the width and the shape of the rotor blades, the inner and outer radius of the airflow through the rotor, and the air density, among other phenomena. These parameters are considered constants for restricted applications, such as non-aggressive maneuvers and low altitude flights.
In this work, however, the estimation of is not considered because its computation requires torque measurements, which are not available. The constant depends only on the force exerted on the UAV, which can be easily obtained considering the UAV hovering and knowing the mass of the vehicle, as described in a later section.
3. The Experimental Setup
A set of dynamic equations can describe the whole AR.Drone Parrot model (see [19]), i.e., the vehicle can be represented using a white box model. However, the parameter identification of each subsystem shown in Figure 2 requires the input signals, the rotor speeds, the thrust produced by each propeller, and the 3-D pose of the UAV. For the low-level model, a force sensor could be used to straightforwardly relate the inputs and the thrusts However, such a sensor is commonly dedicated for specific application of the robotic manipulators (force feedback control in welding tasks, for instance), besides not being available for use in many research laboratories. Hence, the objective is to estimate the rotor speed and, then, to indirectly determine the thrust of the propellers.
In our approach, the spectrogram analysis estimates the rotor speed. Then, the first step is to obtain the spectrogram, which is obtained as
where is the discrete signal, is the discrete window function adopted, and N is the number of samples in the window.
The sound signature is measured during flight, and then, a relationship between the mass of the UAV plus additional load (the hoods inside the box of the Parrot Ar.Drone quadrotor) and the thrust is obtained, allowing us to write (1), from which can be estimated.
According to [7], the audio signature is represented by
where is the number of revolutions per minute, b is the number of blades, and is the audio frequency. In our case, , once each propeller has two blades, and all of them contributes constructively to the audio signature. For the AR.Drone Parrot, the propeller gear reduction r is .
The experiments took place in a regular laboratory with no concern about the acoustic performance of the room. There was also some background noise, such as people talking outside and the sound of the equipment running. The proposed method considers that even a regular camera can measure the desired frequencies and intensities to estimate the aerodynamic constants. Therefore, all of the experiments were recorded with a digital camera and the audio was extracted.
In our proposal, the rotor speed varies according to the weight, increasing somewhat to maintain the same altitude, with the addition of extra mass. Then, the controller increases the control signals to compensate for the extra weight. Thus, the propellers rotate faster, and consequently, the thrust along the z-axis increases, keeping the vehicle hovering at the same altitude.
Three different configurations were adopted, regarding the mass of the quadrotor, as illustrated in Figure 3.

Figure 3.
The quadrotor Parrot AR.Drone without a hull and with the two hulls designed for it.
In the first case, no hull is added to the quadrotor, as Figure 3a shows, resulting in a total mass of 413 g, with a battery of 2000 mA included. In the second case, illustrated in Figure 3b, the small hull designed for the quadrotor is added, in which the mass is 31 g ( of the total mass of the vehicle), resulting in a total mass of 444 g. For the third case, the bigger hull designed for the quadrotor (see Figure 3c) is installed, adding 59 g to the 413 g of the vehicle (a mass increment of ), resulting in a total mass of 462 g.
As additional information, the AR.Drone data sheet gives its main characteristics. It has 4 brush-less in-runner motors, consuming 14.5 Watts and working at 28,500 rpm in hovering mode; self-lubricating bronze bearings; low noise Nylatron gears with 8.625:1 speed reduction; and specific, high-propelled drag for great maneuverability.
In order to achieve a good amount of data to perform a reliable estimation, three experiments of altitude control were run, in which the vehicle was controlled by an external computer to maintain a hovering altitude of 1 m for no hull, the small hull, and the big hull installed in the quadrotor (see Figure 3). Each experiment was repeated five times, with a standard duration of approximately 10 s, thus generating five trials per experiment or 15 trials in total. All of the trials were recorded with a digital camera, and the correspondending audio was extracted. To guarantee regular values, the parts of the audio correspondending to take off and landing were removed, resulting in about 8 s of useful audio per trial. Then, the audio correspondending to each trial was split in five segments, each one containing of the original trial, which corresponds to about 5 s, with of superposition with the previous segment, resulting in 25 sets of audio signal for each experiment. Figure 4 shows the spectrogram corresponding to one such audio sets, whereas Figure 5 shows the structure of the resulting database.
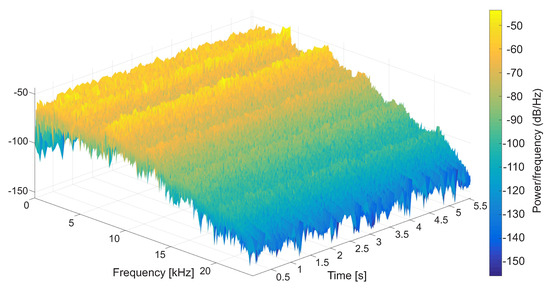
Figure 4.
The spectrogram of an audio set for the case illustrated in Figure 3a.
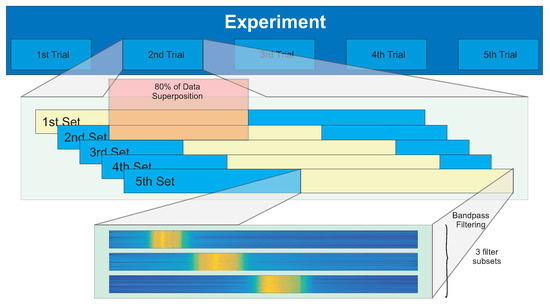
Figure 5.
Schematic of the database for one experiment.
Two methods are proposed to estimate the mean velocity of the rotors from the audio recorded, both using the fundamental frequency of the propellers, and its second and third harmonics. Then, three band-pass filters are applied, creating three subsets, one for each filter. There is no need to use a narrow band or a high-order filter, it only must contain the desired frequency. Therefore, each one of the 25 audio sets generated three, leading to 75 audio subsets per experiment.
In this work, two simple methods are proposed to estimate the constant, the Maximum Trace, and the Gaussian approximation, which is made to allow for a comparison, since using one of them is enough to estimate the parameter.
3.1. The Maximum Trace Method
For each one of the audio subsets, the Maximum Trace method consists of finding the highest magnitudes of the FFT along each time window and of identifying in which frequency it occurs. Then, using the frequency to velocity transformation in (4), a velocity vector is obtained. If only the fundamental frequency is considered, one can use
to find the frequency mean , where is the ith entry of the frequency vector. The case with the fundamental, second, and third harmonics are considered; it is used a weighted mean, with the frequencies weighted by their respective standard deviation (STD), this last one given by
where n is the number of observations in the sample.
In the weighted mean approach, harmonics are used to improve the velocity estimation. As the first harmonic has twice the frequency of the fundamental one, it must be divided to match the same frequency as the fundamental one. Here, the standard deviation is used as a weight to compensate for any variation in the camera microphone. Thus, the rotor speed becomes
where is the weighted frequency mean and H is the number of the harmonic, with for the fundamental one.
3.2. Gaussian Approximation Method
The second method adopted consists in considering not only the highest magnitudes of the signal FFT but also a percentage of this value. In this work, the upper values are collected for the output of each filter. Then, the Gaussian approximation
is adopted.
4. Experimental Results and Discussion
As aforementioned, three experiments were undertaken. For all of them, an altitude controller was used to keep the quadrotor hovering at the desired altitude. Nonetheless, longitudinal and lateral oscillations occur since there is no external active controller for such variables, so that only the embedded PID controller of the vehicle takes care of them, with a zero value as the setup.
The spectrograms for the three experiments can be seen in Figure 6. The duration is a little more than 40 s because all five trials of each experiment were added to calculate the spectrogram. Furthermore, an attentive reader can see the slight difference between the trials, more easily seen at higher frequencies, showing constant frequency values for the same propeller force. Additionally, comparing the spectrograms, one can see an increase in the frequency with the mass increase, corresponding to an increased propeller speed. Indeed, increasing the total mass of the vehicle, the natural response of the controller is to increase the thrust to compensate for the additional mass, i.e., the velocities of the propellers increase evenly, to keep the vehicle hovering at the same altitude.
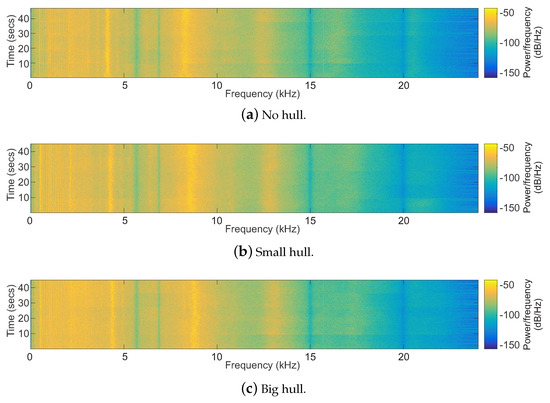
Figure 6.
Altitude flight with no hull, a small hull, and a big hull.
The resulting spectrogram of an audio set is shown in Figure 7a, with the result of the implemented filtering in Figure 7b.
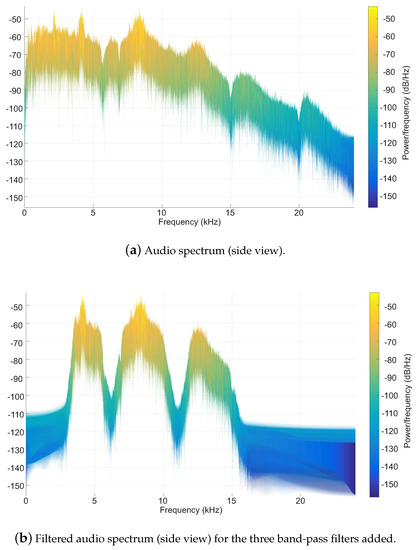
Figure 7.
A set division with the band-pass filter.
4.1. The Maximum Trace Method
Using the first approach, the Maximum Trace, one has to identify the highest values of the FFT magnitude for each time window (see Figure 8). The average value of the estimated together with other interesting values for each experiment is shown in Table 1. The final value of the aerodynamic constant, using a regular mean, is .
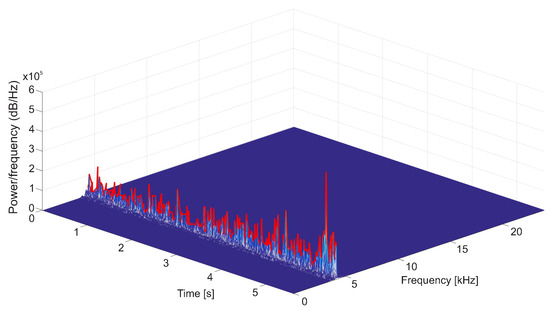
Figure 8.
The 3-D view of the spectrogram using the Maximum Trace Method.

Table 1.
Measured velocities and the value estimated with the Maximum Trace Method.
4.2. Gaussian Approximation Method
The Gaussian approximation method was used taking the magnitude values above of the highest value for each time window. The result for a whole set is shown in Figure 9. Each subplot shows the result of the three subsets, one for each band-pass frequency. The frequencies were merged, considering that the velocity found with the first harmonic should be divided by two, whereas for the second harmonic, it should be divided by three.
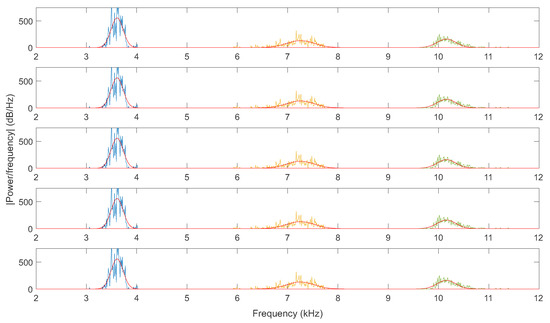
Figure 9.
Gaussian approximation method. Each subplot shows the result of the application of the three bandpass filters to an audio set obtained as illustrated in Figure 5, for the case of Figure 3a. The blue, yellow, and green lines correspond to the readings for the fundamental, first, and second harmonic frequencies, respectively. The red line corresponds to the Gaussian estimation of such frequencies.
The estimated together with other values of interest are shown in Table 2. The final value of the aerodynamic constant using a regular mean is . An interesting remark is that, even when using or of the highest magnitude values, instead of the used to estimate the value, the variation is negligible.

Table 2.
Measured velocities and the value estimated with the Gaussian Method.
The difference between the results obtained with the two methods, in what concerns , is , which is absolutely negligible. This means that any of the two methods could be used without any special concern.
Another worthy remark is that, although a big amount of data was used to estimate the parameter , using only one random subset, one obtains a value of , which is quite a good approximation.
5. Concluding Remarks
This work presents a non-contact method to identify the aerodynamic propeller constants of the quadrotor Parrot AR.Drone. The procedure involves two great steps, namely recordings of the sound generated by the rotors of a vehicle hovering at a fixed controlled altitude, and the computation and analysis of the frequency profile. The results obtained demonstrated that masses added to the UAV body demand more thrust from the propellers to maintain the preset altitude. Therefore, it is verified that there is a direct relationship between the rotor speed and the sound frequency, which is used to determine the aerodynamic coefficient for the propellers.
Two approaches are proposed to analyze the frequency profile obtained, namely the Maximum Trace method and the Gaussian approximation, and it is verified that both yield the same result. It is worth emphasizing that a mathematical determination of the aerodynamic constant is not easy, since it depends on the number, the width and the shape of the rotor blades, the inner and outer radius of the airflow through the rotor, and the air density, among other phenomena. Thus, a simple method to estimate it, as the one proposed here, is useful to obtain a reliable model for the UAV, mainly when the vehicle does not provide information on the rotor speed, which is common regarding on-the-shelf quadrotors.
To continue this research, the authors intend to perform whole identification of the AR.Drone low-level model, which includes estimation of the aerodynamic constant . As shown in this text, the rotor speed can be used to identify the parameters of the motor controller and its dynamic model separately. Another option is a gray box model that describes both sets of parameters and relates the joystick inputs to the rotor speeds. However the challenge is to discriminate, from the spectrogram, which acoustic signature corresponds to which motor.
Author Contributions
Conceptualization, A.S.B. and M.S.-F.; methodology, A.S.B.; software, I.H.B.P. and A.S.B.; validation, I.H.B.P.; formal analysis, I.H.B.P. and A.S.B.; resources, A.S.B. and M.S.-F.; data curation, I.H.B.P.; writing—original draft preparation, I.H.B.P. and A.S.B.; writing—review and editing, M.S.-F.; supervision, A.S.B.; project administration, A.S.B. and M.S.-F.; funding acquisition, A.S.B. and M.S.-F. All authors have read and agreed to the published version of the manuscript.
Funding
The authors thank CNPq (Conselho Nacional de Desenvolvimento Científico e Tecnológico), an agency of the Brazilian Ministry of Science, Technology, Innovations, and Communications that supports scientific and technological development, and FAPES (Fundação de Amparo à Pesquisa e Inovação do Espírito Santo), an agency of the State of Espírito Santo, Brazil, that supports scientific and technological development, for the financial support granted to this research. They also thank UFES (Universidade Federal do Espírito Santo), IFES (Instituto Federal de Educação, Ciência e Tecnologia do Espírito Santo), UFV (Universidade Federal de Viçosa), and FAPEMIG (Fundação de Amparo à Pesquisa de Minas Gerais) for making it possible to develop this work.
Institutional Review Board Statement
Not applicable.
Informed Consent Statement
Not applicable.
Conflicts of Interest
The authors declare no conflict of interest. The funding sponsors had no role in the design of the study; in the collection, analyses, or data interpretation; in the writing of the manuscript; and in the decision to publish the results.
References
- Dzul, A.; Lozano, R.; Castillo, P. Adaptive altitude control for a small helicopter in a vertical flying stand. Int. J. Adapt. Control Signal Process. 2004, 18, 473–485. [Google Scholar] [CrossRef]
- Brandão, A.S.; Gandolfo, D.; Sarcinelli-Filho, M.; Carelli, R. PVTOL maneuvers guided by a high-level nonlinear controller applied to a rotorcraft machine. Eur. J. Control 2014, 20, 172–179. [Google Scholar] [CrossRef]
- Lin, Y.; Saripalli, S. Path planning using 3D Dubins Curve for Unmanned Aerial Vehicles. In Proceedings of the 2014 International Conference on Unmanned Aircraft Systems (ICUAS), Orlando, FL USA, 27–30 May 2014; pp. 296–304. [Google Scholar] [CrossRef]
- Lin, Y.; Saripalli, S. Sampling based collision avoidance for UAVs. In Proceedings of the 2016 American Control Conference (ACC), Boston, MA, USA, 6–8 July 2016; pp. 1353–1358. [Google Scholar] [CrossRef]
- Israelsen, J.; Beall, M.; Bareiss, D.; Stuart, D.; Keeney, E.; van den Berg, J. Automatic collision avoidance for manually tele-operated unmanned aerial vehicles. In Proceedings of the 2014 IEEE International Conference on Robotics and Automation (ICRA), Hong Kong, China, 31 May–7 June 2014; pp. 6638–6643. [Google Scholar] [CrossRef]
- Xiang, C.; Wang, X.; Ma, Y.; Xu, B. Practical Modeling and Comprehensive System Identification of a BLDC Motor. Math. Probl. Eng. 2015, 501, 879581. [Google Scholar] [CrossRef] [Green Version]
- Lin, H.; Ding, K. A new method for measuring engine rotational speed based on the vibration and discrete spectrum correction technique. Measurement 2013, 46, 2056–2064. [Google Scholar] [CrossRef]
- Pedersen, T.F.; Herlufsen, H.; Hansen, H.K. Order Tracking in Vibro-Acoustic Measurements: A Novel Approach Eliminating the Tacho Probe; Technical Report; SAE International: Warrendale, PA, USA, 2005. [Google Scholar] [CrossRef]
- Molchanov, P.; Harmanny, R.I.; de Wit, J.J.; Egiazarian, K.; Astola, J. Classification of small UAVs and birds by micro-Doppler signatures. Int. J. Microw. Wirel. Technol. 2014, 6, 435–444. [Google Scholar] [CrossRef] [Green Version]
- Sadasivan, S.; Gurubasavaraj, M.; Sekar, S.R. Acoustic signature of an unmanned air vehicle exploitation for aircraft localisation and parameter estimation. Def. Sci. J. 2002, 51, 279–284. [Google Scholar] [CrossRef] [Green Version]
- Gustavsson, M.; Andersson, A.; Johansson, T.; Jonsson, R.; Karlsson, N.; Nilsson, S. Micro-Doppler extraction of a small UAV in a non-line-of-sight urban scenario. Proc. SPIE 2017, 10188. [Google Scholar] [CrossRef]
- Tong, J.; Hu, Y.H.; Bao, M.; Xie, W. Target tracking using acoustic signatures of light-weight aircraft propeller noise. In Proceedings of the 2013 IEEE China Summit & International Conference on Signal and Information Processing (ChinaSIP), Beijing, China, 6–10 July 2013; pp. 20–24. [Google Scholar]
- Morito, T.; Sugiyama, O.; Kojima, R.; Nakadai, K. Partially Shared Deep Neural Network in sound source separation and identification using a UAV-embedded microphone array. In Proceedings of the 2016 IEEE/RSJ International Conference on Intelligent Robots and Systems (IROS), Daejeon, Korea, 9–14 October 2016; pp. 1299–1304. [Google Scholar] [CrossRef]
- Wang, L.; Cavallaro, A. Time-frequency processing for sound source localization from a micro aerial vehicle. In Proceedings of the 2017 IEEE International Conference on Acoustics, Speech and Signal Processing (ICASSP), New Orleans, LA, USA, 5–9 March 2017; pp. 496–500. [Google Scholar] [CrossRef]
- Tiete, J.; Domínguez, F.; Silva, B.d.; Segers, L.; Steenhaut, K.; Touhafi, A. SoundCompass: A distributed MEMS microphone array-based sensor for sound source localization. Sensors 2014, 14, 1918–1949. [Google Scholar] [CrossRef] [PubMed] [Green Version]
- Marmaroli, P.; Falourd, X.; Lissek, H. A UAV motor denoising technique to improve localization of surrounding noisy aircrafts: Proof of concept for anti-collision systems. Acoustics 2012, 2012, 2937–2942. [Google Scholar]
- Passow, B.N.; Gongora, M.A.; Hopgood, A.A.; Smith, S. Intelligent acoustic rotor speed estimation for an autonomous helicopter. Appl. Soft Comput. 2012, 12, 3313–3324. [Google Scholar] [CrossRef]
- Ahmed, B.; Pota, H.R.; Garratt, M. Flight control of a rotary wing UAV using backstepping. Int. J. Robust Nonlinear Control 2010, 20, 639–658. [Google Scholar] [CrossRef]
- Brandão, A.S.; Sarcinelli-Filho, M.; Carelli, R. High-level underactuated nonlinear control for rotorcraft machines. In Proceedings of the 2013 IEEE International Conference on Mechatronics (ICM), Vicenza, Italy, 27 February–1 March 2013; pp. 279–285. [Google Scholar] [CrossRef]
- Li, Q. Grey-Box System Identification of a Quadrotor Unmanned Aerial Vehicle. Ph.D. Thesis, Delft University of Technology, Delft, The Netherlands, 2014. [Google Scholar]
- Luukkonen, T. Modelling and Control of Quadcopter; Technical Report; School of Science, Aalto University: Espoo, Finland, 2011. [Google Scholar]
- Bouabdallah, S. Design and Control of Quadrotors with Application to Autonomous Flying. Ph.D. Thesis, Ecole Polytechnique Federale de Lausanne, Lausanne, Switzerland, 2007. [Google Scholar]
Short Biography of Authors
 | Igor Henrique Beloti Pizetta received the B.S. degree in Electrical Engineering from the Federal University of Viçosa (UFV), Brazil, in 2010, and the M.Sc. and Ph.D. degrees, also in Electrical Engineering, from the Federal University of Espírito Santo (UFES), Brazil, in 2013 and 2019, respectively. The emphasis of his Ph.D. research was on Aerial Robotics, specifically dealing with the transport of suspended loads using UAVs, based on non-linear control. Since 2013 he has been a professor at the Federal Institute of Education, Science and Technology of Espírito Santo, Brazil, working on the following research topics: Robotics, Control and Automation, Non-Linear Control, Embedded Systems and Electronics. |
 | Alexandre Santos Brandão received the B.S. degree in Electrical Engineering from Federal University of Viçosa, Minas Gerais, Brazil, in 2006, and the M. Sc. and Ph.D. degrees, also in Electrical Engineering, from Federal University of Espírito Santo, Brazil, in 2008 and 2013, respectively. He also received the Ph.D. degree in Control System Engineering from the National University of San Juan, San Juan, Argentina, in 2014. Dr. Brandão has co-authored more than 20 journal papers, 2 book chapters and more than 120 conference papers, besides having advised 8 M.Sc. and 4 Ph.D. students. His research interest is nonlinear control of aerial and terrestrial mobile vehicles. |
 | Mário Sarcinelli-Filho received the B.S. degree in Electrical Engineering from Federal University of Espírito Santo, Brazil, in 1979, and the M. Sc. and Ph.D. degrees, also in Electrical Engineering, from Federal University of Rio de Janeiro, Brazil, in 1983 and 1990, respectively. He is currently a Professor at the Department of Electrical Engineering, Federal University of Espírito Santo, Brazil, a researcher of the Brazilian National Council for Scientific and Technological Development (CNPq), and Senior Editor of the Journal of Intelligent and Robotic Systems. Dr. Sarcinelli-Filho has co-authored more than 60 journal papers, more than 340 conference papers, and 17 book chapters, besides having advised 20 Ph.D. and 25 M.Sc. students. His research interests are nonlinear control, mobile robot navigation, multi robot systems, coordinated control of mobile robots, unmanned aerial vehicles and coordinated control of ground and aerial robots. |
Publisher’s Note: MDPI stays neutral with regard to jurisdictional claims in published maps and institutional affiliations. |
© 2021 by the authors. Licensee MDPI, Basel, Switzerland. This article is an open access article distributed under the terms and conditions of the Creative Commons Attribution (CC BY) license (https://creativecommons.org/licenses/by/4.0/).