Article

Static and Dynamic Torque in the Modulation of the Caudal Vertebral Growth

1
Department of Orthopaedic Surgery, Children’s Wisconsin, Medical College of Wisconsin, Milwaukee, WI 53226, USA
2
Department of Mechanical Engineering, Milwaukee School of Engineering, Milwaukee, WI 53202, USA
3
Medical School, Medical College of Wisconsin, Milwaukee, WI 53226, USA
4
Department of Pathology, Children’s Wisconsin, Medical College of Wisconsin, Milwaukee, WI 53226, USA
5
Biomedical Resource Center, Office of Research, Medical College of Wisconsin, Milwaukee, WI 53226, USA
6
Department of Pediatrics, Medical College of Wisconsin, Milwaukee, WI 53226, USA
*
Author to whom correspondence should be addressed.
Osteology 2025, 5(4), 31; https://doi.org/10.3390/osteology5040031
Submission received: 11 July 2025 / Revised: 10 September 2025 / Accepted: 18 September 2025 / Published: 14 October 2025

Abstract

Background/Objective: Major research demonstrates that longitudinal loading affects the vertebral growth and disc wedging in the scoliotic animal models; however, there is a scarcity of research on the effect of torque on the vertebral growth. Comparison of the effect of static and dynamic torque on growth is also lacking. The aims of this study were to assess the morphological, histological, and immunohistochemical changes in caudal vertebrae of rats under controlled, static, and dynamic torque. Methods: Adjacent vertebral bodies of female Sprague-Dawley rats were loaded with a torque for 4 weeks. Six rats received a static torque of 1.25 Nm while 6 additional rats received a dynamic torque (2.4 Nm, 1.0 Hz for 15 min/time, 3 times/week). An additional 6 rats formed the control group and received no torque at all. All the rats were later sacrificed, and the tails for histological analysis, immunocytochemistry, and X-rays were obtained. Results: Among the three groups, there were significant differences in right side disc height and average disc height on the proximal vertebrae space in the coronal plane of the X-ray. There were significant differences in the physeal height between static torque and control, or between dynamic torque and control (p < 0.05). The proliferating cell nuclear antigens were detected with variable percentages in samples among the three physeal zones for all groups. Conclusions: Both static and dynamic torque induced asymmetric reduction in the physis and intervertebral disc, which may help to explain the development and vertebral tethering of scoliosis.

1. Introduction

Much debate and research concerning the etiology of scoliosis has focused on the “vicious cycle” hypothesis on 2D spine modeling [1,2]. This hypothesis maintains that loads on the spine are asymmetric and involved in scoliosis progression through changes in bone and disc growth, and hence to vertebral body and disc wedging [3,4,5,6]. Nonetheless, it is relatively unknown what role torque plays in the development of spinal asymmetry, as most studies have concentrated on static or cyclic compression in rat, calf, or pig species rather than torque [7]. Despite this deficit in the current literature, clinical assessment of adolescent idiopathic scoliosis (AIS) patients highlights the severe extent of changes that occur within the transverse plane. In the study [8], a 21.9° ± 7.4° average axial vertebral rotation at the apex of the spinal curve was noted. For comparison, a study of healthy individuals with no history of spinal deformity revealed a maximum vertebral rotation of 2.6° to the right at T7 [9].
In investigating the intravertebral disc, one study applied static and dynamic torsional loading to rat tails over the course of 90 min [10]. The in vitro portion of this study found that the torsional stiffness of the disc was increased by the torsional loading. The in vivo testing indicated that there was a significant difference between compressional loading and torsional loading, with torsional shear increasing elastin expression [10]. Additional studies have been performed to determine the impact of injury in the annulus fibrosis [11,12]. These studies indicate that needle injury of the disc through the annulus is impacted differently by the mode of mechanical load, with torsion impacting the properties of the disc directly in terms of the amount of fiber disruption. Under injured conditions, the study showed decreased disc height due to a reduction in torsional stiffness [12].
The studies exploring loading effects on the growth plate and its rate of growth have been primarily concerned with axial tensile or compressive. This loading has been shown to modulate endochondral growth rate relative to a control [6,13,14,15,16,17,18]. In vivo studies using animal models have found static compressive loading to be associated with significantly decreased overall growth plate thickness [6,17,19], while dynamic compression appears to have less of an effect [14,17]. Investigation of static compression’s effects on physeal zones has found decreased proliferative and hypertrophic zone heights [17,20], while dynamic compression has only been associated with a decrease in proliferative zone height [17]. While our previous pilot study in the Sprague-Dawley (SD) rat model demonstrated that a controlled static torque can be successfully applied to the rat tail and affect the physeal growth [21,22], dynamic torque was not studied. Other studies in the literature that do consider torsion appear to only focus on longitudinal bone growth and do not demonstrate the direct impact of torsion on the overall growth plate or zone height [23,24]. The application of direct or indirect torque to the growth plate may have an additional role in the development of spinal curvature in scoliotic growth induced by asymmetric loading and epiphysiodesis in animal models [15,16,22,25,26]. Although MRI images showed that the vertebral body tethering (VBT) device achieved a reduction in apical axial rotation from 10° to 4.5° (over 36 months) for thoracic idiopathic scoliosis, the in vivo impact on microstructures of the physis in the transversal plane still remains unclear [27].
To further understand the mechanical stress effect at the molecular level, Proliferating Cell Nuclear Antigen (PCNA) is often implemented as a measure of chondrocyte proliferative capabilities at animal growth plates [28,29,30]. The use of PCNA with torsional loading has not yet been implemented.
The specific aims of this study were to: (1) assess the bony morphological changes in radiography under sham control (no loading), static and dynamic torque; (2) investigate the effect of static and dynamic torque on the growth plate of caudal rat vertebrae (coccygeal), including a longitudinal growth rate and the microstructural changes in the growth plate; and (3) determine the changes in PCNA expression in the growth plate following the application of static and dynamic torque, as compared to the sham control group.

2. Materials and Methods

2.1. Animal Model

Eighteen five-week-old female Sprague-Dawley rats (Inotiv, Greenfield, Indiana facility, USA) were acquired. The use of female rats was justified due to estrogen predisposing to the development of idiopathic scoliosis. The animal research was approved by the Institutional Animal Care and Use Committee (IACUC) of the Medical College of Wisconsin (Protocol No. AUA00003531). Rats have long tails with different segments that are used as a research spine model due to an analogous physeal growth plate structure [31,32]. Two sequential caudal bones and an intermediate disc form the functional spinal unit (FSU). The range of peak growth rate occurs between 3 and 5 weeks of age, which is close to adolescent. The rats were allowed to acclimate for approximately 1 week prior to surgical manipulation. During that time, the rats were introduced to the restraint device (Broome restrainer) for about 10 min, once a day for 5 days. A total of 6 rats formed the Sham Control Group (SC) and had no torque applied, but the torque apparatus was mounted on the FSU to provide control over the impact of attaching this device. A group with 6 rats received a static torque (ST) in its FSU, and another group consisting of 6 rats received a dynamic torque (DT). Then the study was carried out for 4 weeks. At the study endpoint, the six rats from each respective group were euthanized by CO2 asphyxiation. A thoracotomy was performed to confirm death, and the appropriate tissues were harvested for analysis.

2.2. In Vivo Torque Apparatus with Static Loading and Its Validation

An in vivo test fixture capable of applying controlled static torsional, bending, and axial loads to a segmented body was developed and validated in a pilot in vivo study of SD tail models for static loading [22]. The fixture is composed of two components that allow independent control of torsional, axial, and bending loads (Figure 1a). For static loading, the spring-loaded detent pins were set so that the torque was 1.25 Nm. A torque of 2.4 Nm with 20.5° of rotation was applied at 1.0 Hz for 15 min per day, three times per week, over 4 weeks. The springs at A and B were used to remove bending loads. The K-wires at C attached each ring to its corresponding caudal vertebrae.

2.3. Caudal Vertebrae Surgery to Mount the In Vivo Torque Apparatus

The rat was placed in a transparent induction chamber, and isoflurane was delivered to the chamber via a precision vaporizer and compressed O2. Once the animal was unconscious, it received a single, sustained-release (72-h) dose of buprenorphine as well as a long-acting (1 week) antibiotic, cefovecin. Sterile ophthalmic ointment was applied to the rats’ corneas. The skin on the tail was prepped with alternating scrubs of chlorhexidine and alcohol.
The rat was then placed in the supine position for surgery. Two K-wires with 0.9 mm diameter were inserted into the middle of the 7th caudal vertebral body (Ca7) and the 8th caudal vertebral body (Ca8) (Figure 1a). Pin placement was verified by palpation (and finally by radiography). A torque apparatus was mounted on the caudal vertebrae from Ca7 (proximal to the rat body) to Ca8 (distal to the body), thus forming one FSU. The rats had free range of their standard housing rat cage during the entire study time. There were no appreciable differences in movement or activity post-operatively.

2.4. Adjusting the In Vivo Torque Device for Static and Dynamic Loading

Immediately after surgery, torque was applied to the tail, thereby generating shear stress in the caudal vertebrae. During the adjustment and data acquisition period, the rats were first briefly anesthetized with isoflurane gas and then gently placed in the Broome Restrainer and immediately allowed to wake up. The head of the rat was placed away from the opening, and the hind positioned against a sliding partition. The tail extended through a hole in the chamber. Torque was applied clockwise in the torque groups. For static loading, the spring-loaded detent pins (McMaster-Carr part No. 8495A12, Elmhurst, IL, USA) were set so that the torque was 1.25 Nm (Figure 1a). For dynamic loading, the pins at D (Figure 1a) were replaced with microcontrolled solenoids (Planet Engineers, Van Nuys, Los Angeles, CA, USA) (Figure 1b). When the torque is applied to the caudal vertebra, there is a resistance due to the structure and material properties of the tail that resists rotation (viscoelastic behavior). The device cycles on and off cyclically and is in a state of no applied torque for a portion of the cycle. In order to overcome this resistance, a torque of 2.4 Nm with 20.5° of rotation was applied at 1.0 Hz for 15 min per day, three times per week, over 4 weeks (Figure 1b). However, based upon the previous study [22], the direct torque applied to the tail was 1.024 ± 0.011 Nm. The rats had free range of their standard housing rat cage during the entire study time. If there was a change in the set values of the torque and axial loads due to the viscoelastic behavior of the tissue or mobilization of rats, then the adjustment screws were tightened or loosened as necessary to maintain a constant load level. The dynamic loads were controlled via a custom electronics board.

2.5. Experimental Protocol

Evaluation of Macroscopic appearance: Macroscopic appearance was documented to record changes in color, alignment, swelling, etc.
X-ray measurements: To review the development of the angular alignment and tail bone modulation, the rats had an anterior–posterior X-ray (AP view) taken of their tails at the 1st week and the end of the 4th week. The rats were lightly anesthetized using isoflurane anesthesia with MAC of 1–1.25% for restraint purposes to obtain appropriate images. A general account of the tail bone morphologic changes was made, including the caudal vertebrae, epiphyseal plate, and intercaudal vertebral space (disc), measured in the AP view.
Histology and Immunohistochemistry: Four weeks after implementation of the torque device, all six rats from each group were euthanized and prepared for histological studies as follows:
Nanozoomer digital slide scanner (Hamamatsu, Japan): The parameters included the vertebral body length at left, middle, and right, the growth plate thickness (height) at left, middle, and right, growth plate width, and disc space at left, middle, and right portions (Figure 2).
Histomorphometry: Histological measurements were made using computer-imaged microscopy (Olympus, Leeds Precision Instruments, Minneapolis, MN, USA). MicroSuite software version 3.1 (Olympus Soft Imaging Solution GmbH, Munster, Germany) was utilized in quantifying the length of all three zones (Reserve, Proliferative, and Hypertrophic of the growth plates).
Alcian Blue staining: Helped with the differentiation of the cartilage tissue from bone.
Proliferating cell nuclear antigen (PCNA) detection: Directly targets the proliferative chondrocytes and highlights the level of activity of these cells in the growth plate. PCNA is a cofactor of DNA Polymerase δ that is expressed in actively proliferating cells. Active primarily during the S-phase of replication, PCNA forms a homotrimeric ring that slides along DNA, anchoring polymerase and other editing enzymes [33].

2.6. Statistical Analysis

A Shapiro–Wilk test was performed for the data’s normal distribution prior to other statistical analyses. Analysis of Variance (ANOVA), Analysis of Covariance (ANCOVA), and Post hoc testing were performed. The ANOVA compared mean changes between treatment groups (DT, ST, or SC), but did not indicate which group was different from the others. If the ANOVA test was significant, then post hoc pairwise tests compared groups on a pairwise basis (DT vs. ST, DT vs. SC, ST vs. SC). By analogy with ANOVA, ANCOVA compared mean changes between treatment groups (DT, ST, or SC) but controlled for baseline. If the ANCOVA test showed that at least one group was different, then post hoc pairwise tests comparing groups on a pairwise basis (DT vs. ST, DT vs. SC, ST vs. SC) were performed. All p-values < 0.05 were considered significant.

3. Results

3.1. Visual Observation and Radiographic Measurements

There was no notable skin infection or systemic signs of illness. After euthanasia and dissection of the tails, there was no apparent trauma, injury, fracture, infection, or notable swelling. Upon examination, the pins were found to be in place as surgically positioned without any significant breakage or migration.
Across both measurements on X-ray, the ST and DT groups had significantly smaller heights in the right-side proximal intravertebral disc space or mean disc height (between 6th and 7th caudal vertebrae), compared to the SC group (p < 0.05) (Table 1). There was no significant difference in the disc space between the ST and DT groups (p > 0.05).
Overall, there were no bony morphologic changes in the caudal vertebrae in the torque groups, including the 7th and 8th vertebrae. There was no obvious wedge or narrow joint space among proximal, middle, and distal caudal vertebrae in AP X-ray on the 4th week for each group.
There was no significant change in the longitudinal growth rate of the statically torque (Ca7: 28.5 ± 5.0 μm/day; Ca8: 23.2 ± 7.1 μm/day) and dynamically torque (Ca7: 26.1 ± 7.3; Ca8: 27.5 ± 5.7) loaded vertebrae, compared to the SC (Ca7: 27.5 ± 4.0; Ca8: 19.6 ± 11.3) (p > 0.05).

3.2. Histological Analysis-Physeal Height

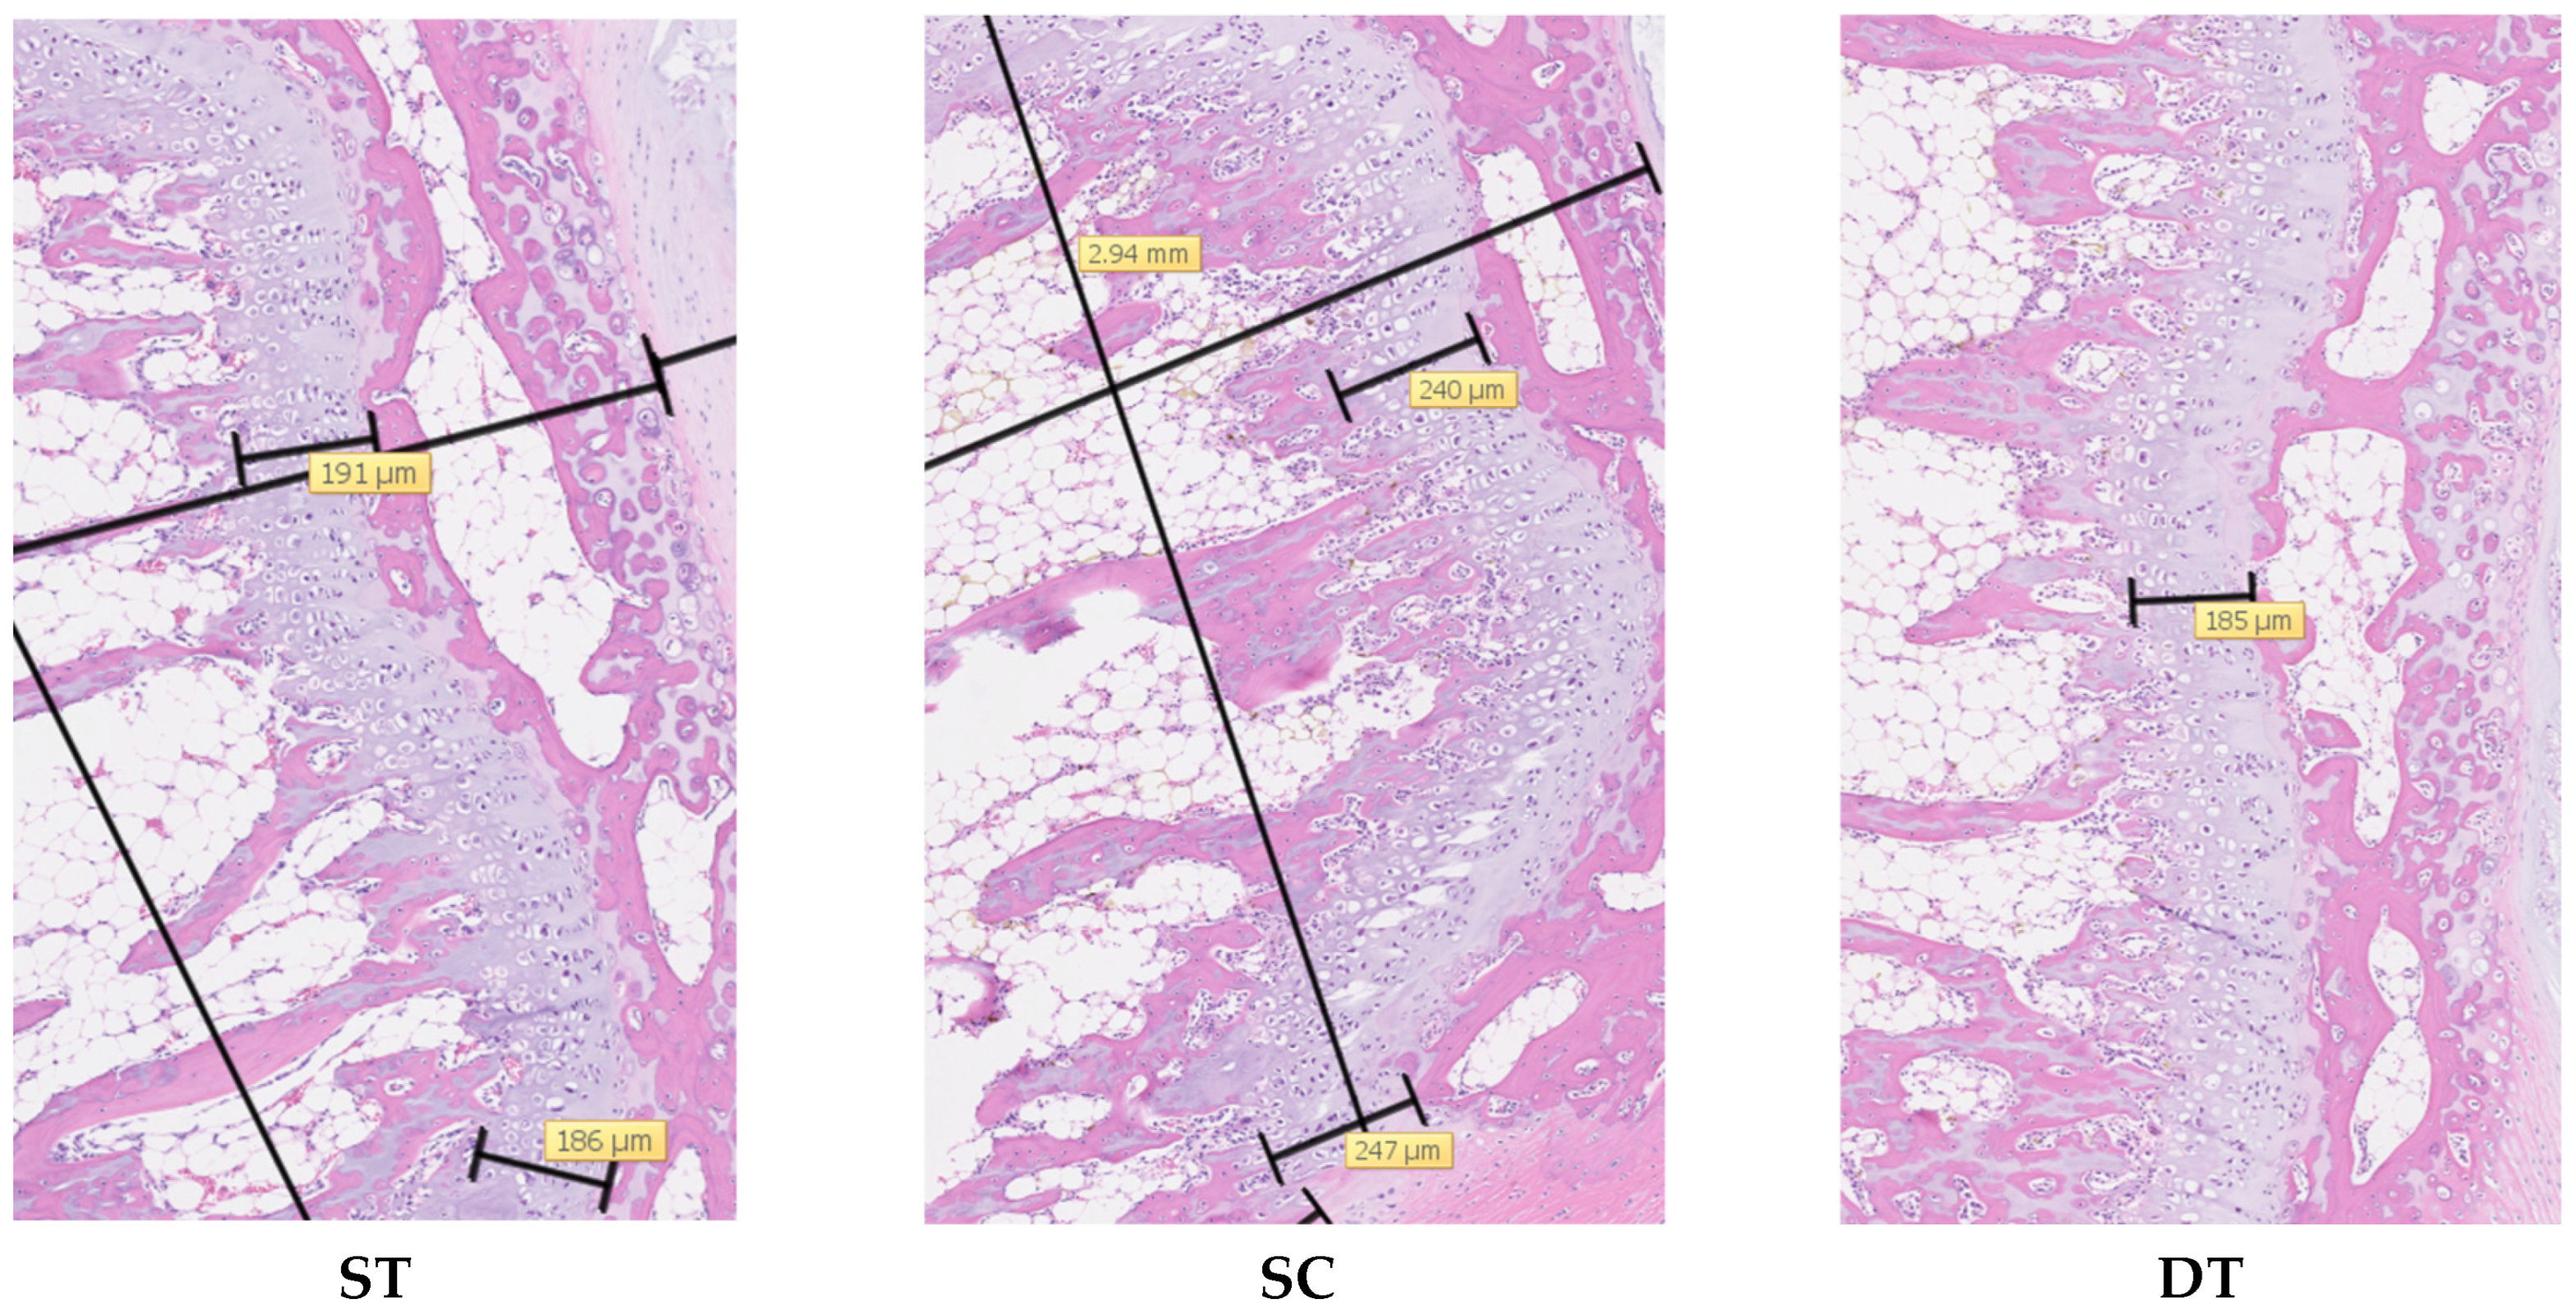
On Ca7, the average middle height of the proximal growth plate was significantly shorter in the ST and DT groups compared to the SC group, while the left side of the distal growth plate was also shorter in the ST and DT groups compared to the SC (p < 0.05) (Table 2). Similarly, the average height of the Ca8 proximal growth plate was shorter on the middle and right side of both the ST and DT groups, compared to the SC. There were no significant differences in the physeal heights between the ST and DT groups (p > 0.05) (Table 2) (Figure 3).

3.3. Histological Analysis-Physeal Zone Heights

There was a significant decrease in left-sided reserve zone height of the distal physis in both the ST and DT groups as compared to the SC group (p < 0.05) (Table 3). There was also a significant increase noted in the right-sided height of the proximal Ca7 physis proliferative zone in the DT group as compared to both the SC and ST groups (p < 0.05). Lastly, there was some significant change in hypertrophic zone heights. Specifically, dynamic torque was associated with an increase in the Ca7 distal physis middle hypertrophic zone, as well as a decrease in the Ca8 proximal physis hypertrophic zone on the right side (p < 0.05). In response to static torque, there was an increase in the middle hypertrophic zone of the Ca8 distal growth plate (p < 0.05).

3.4. PCNA in Physeal Zones

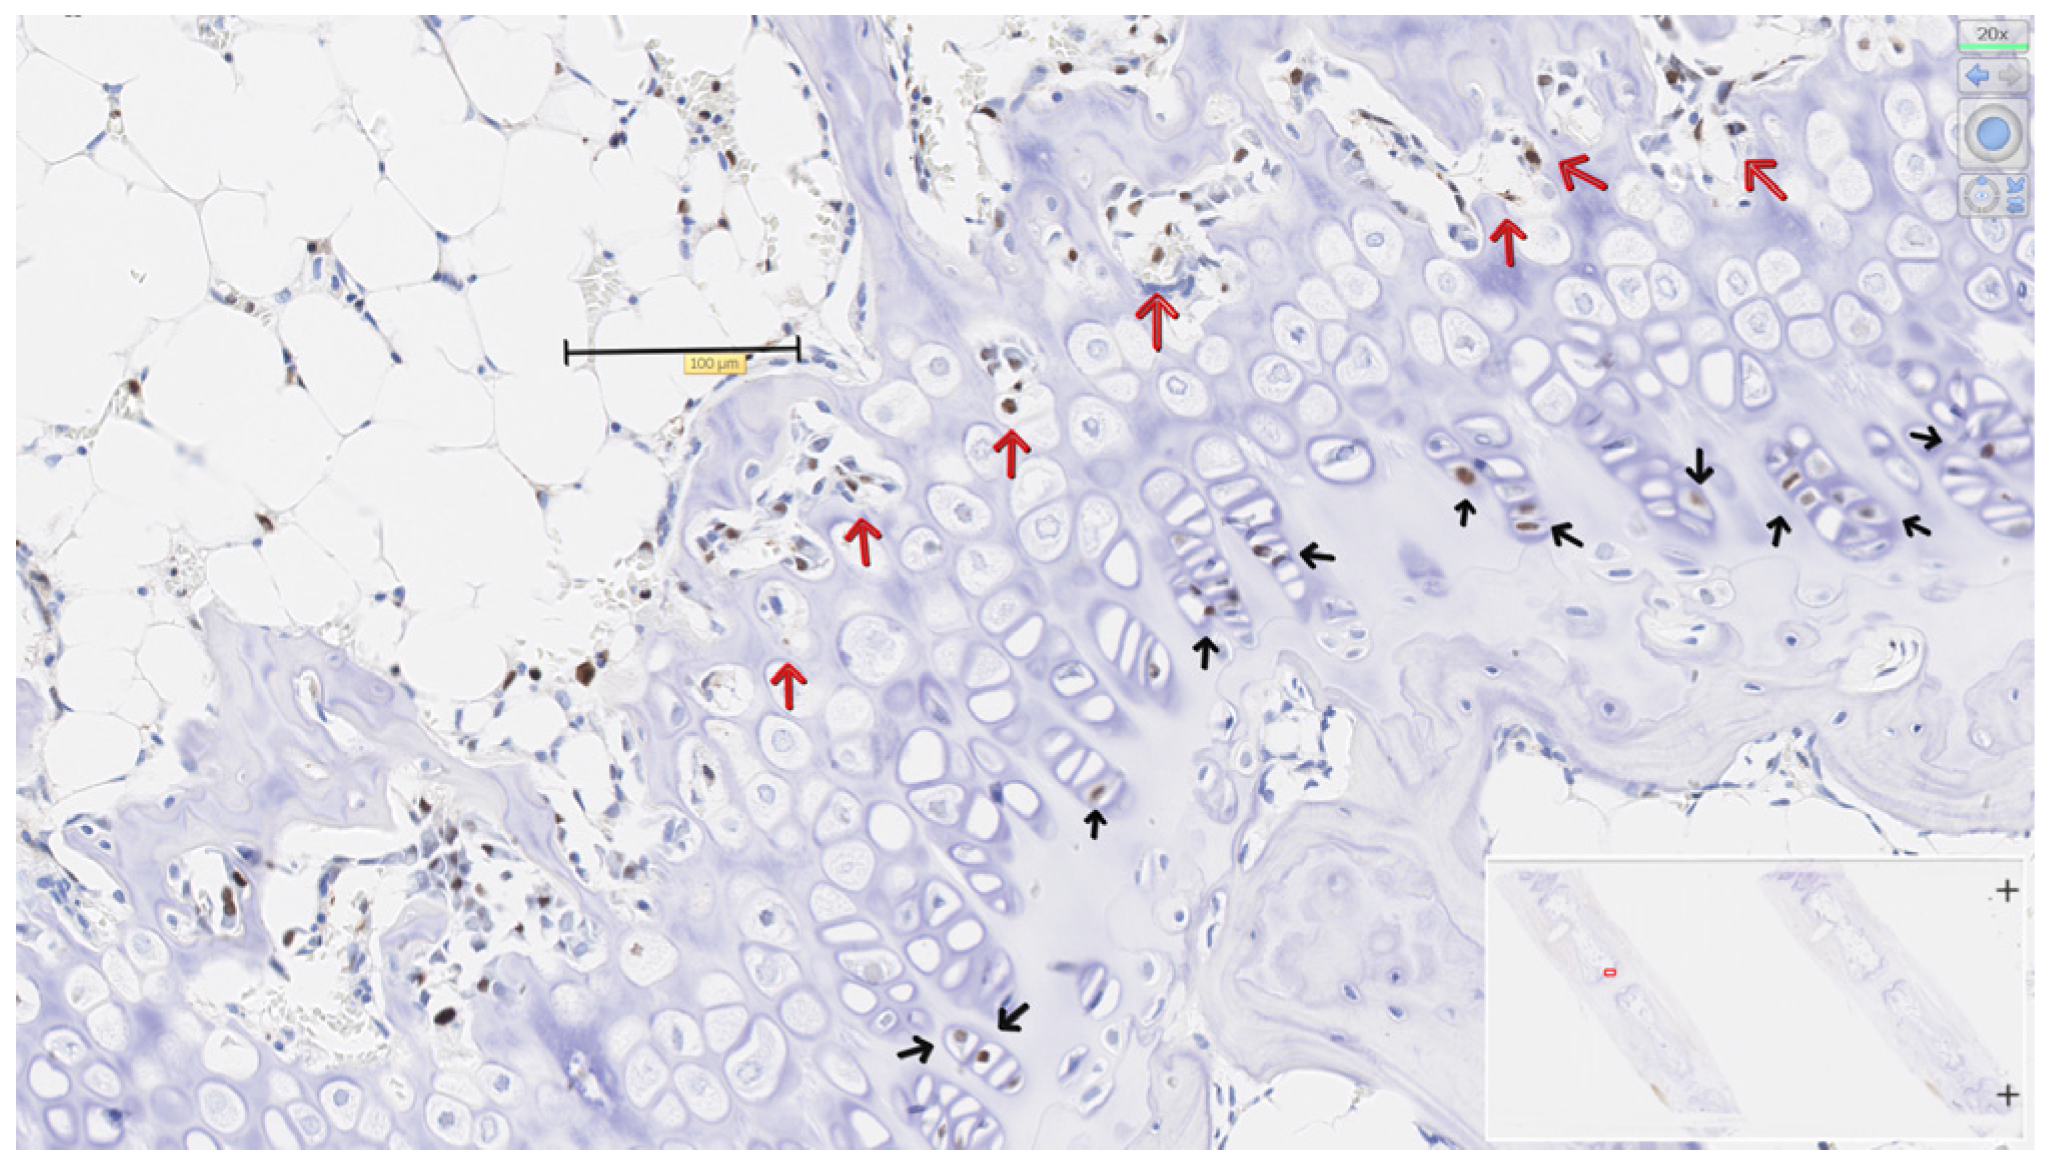
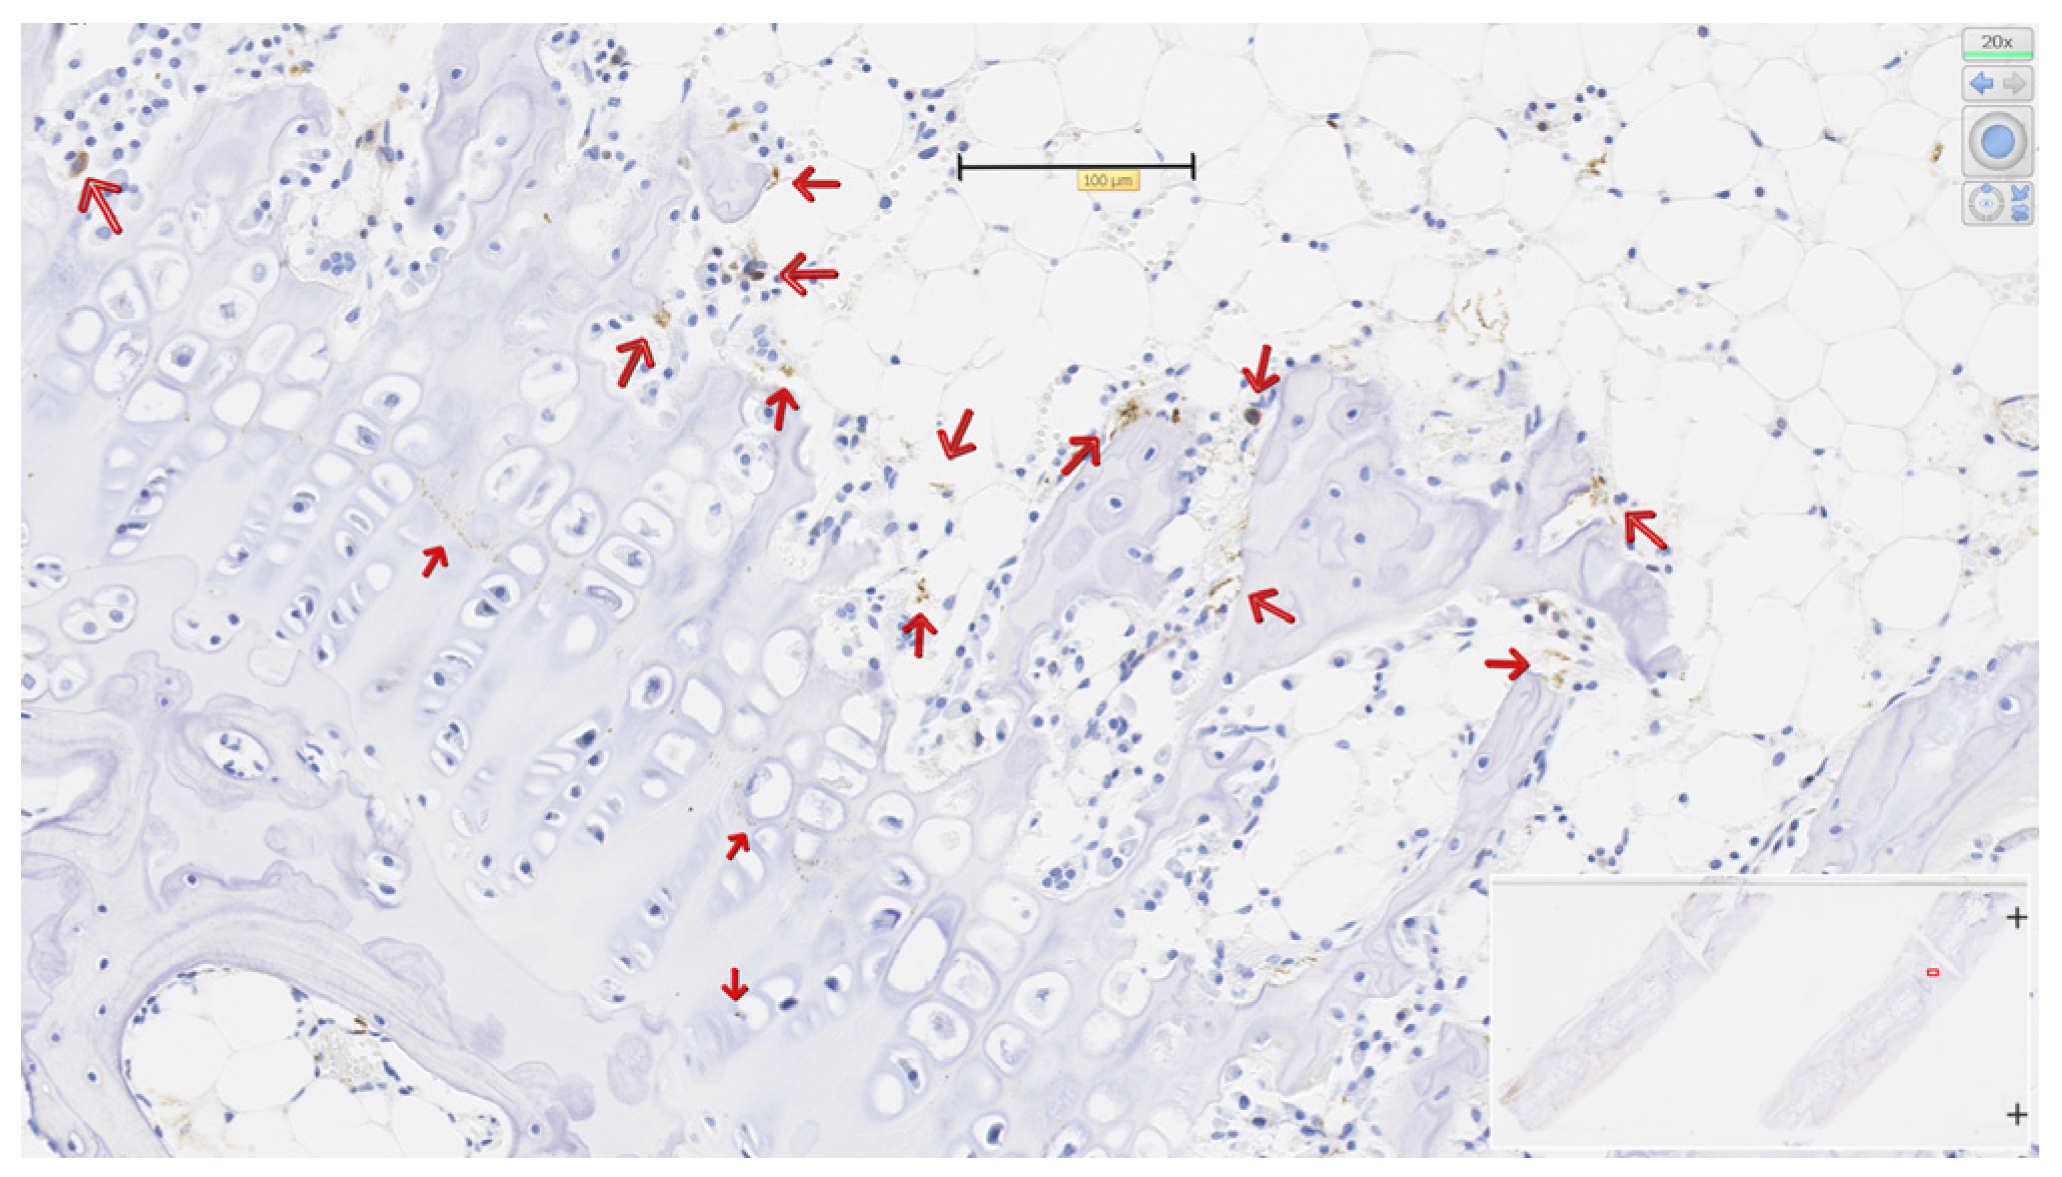
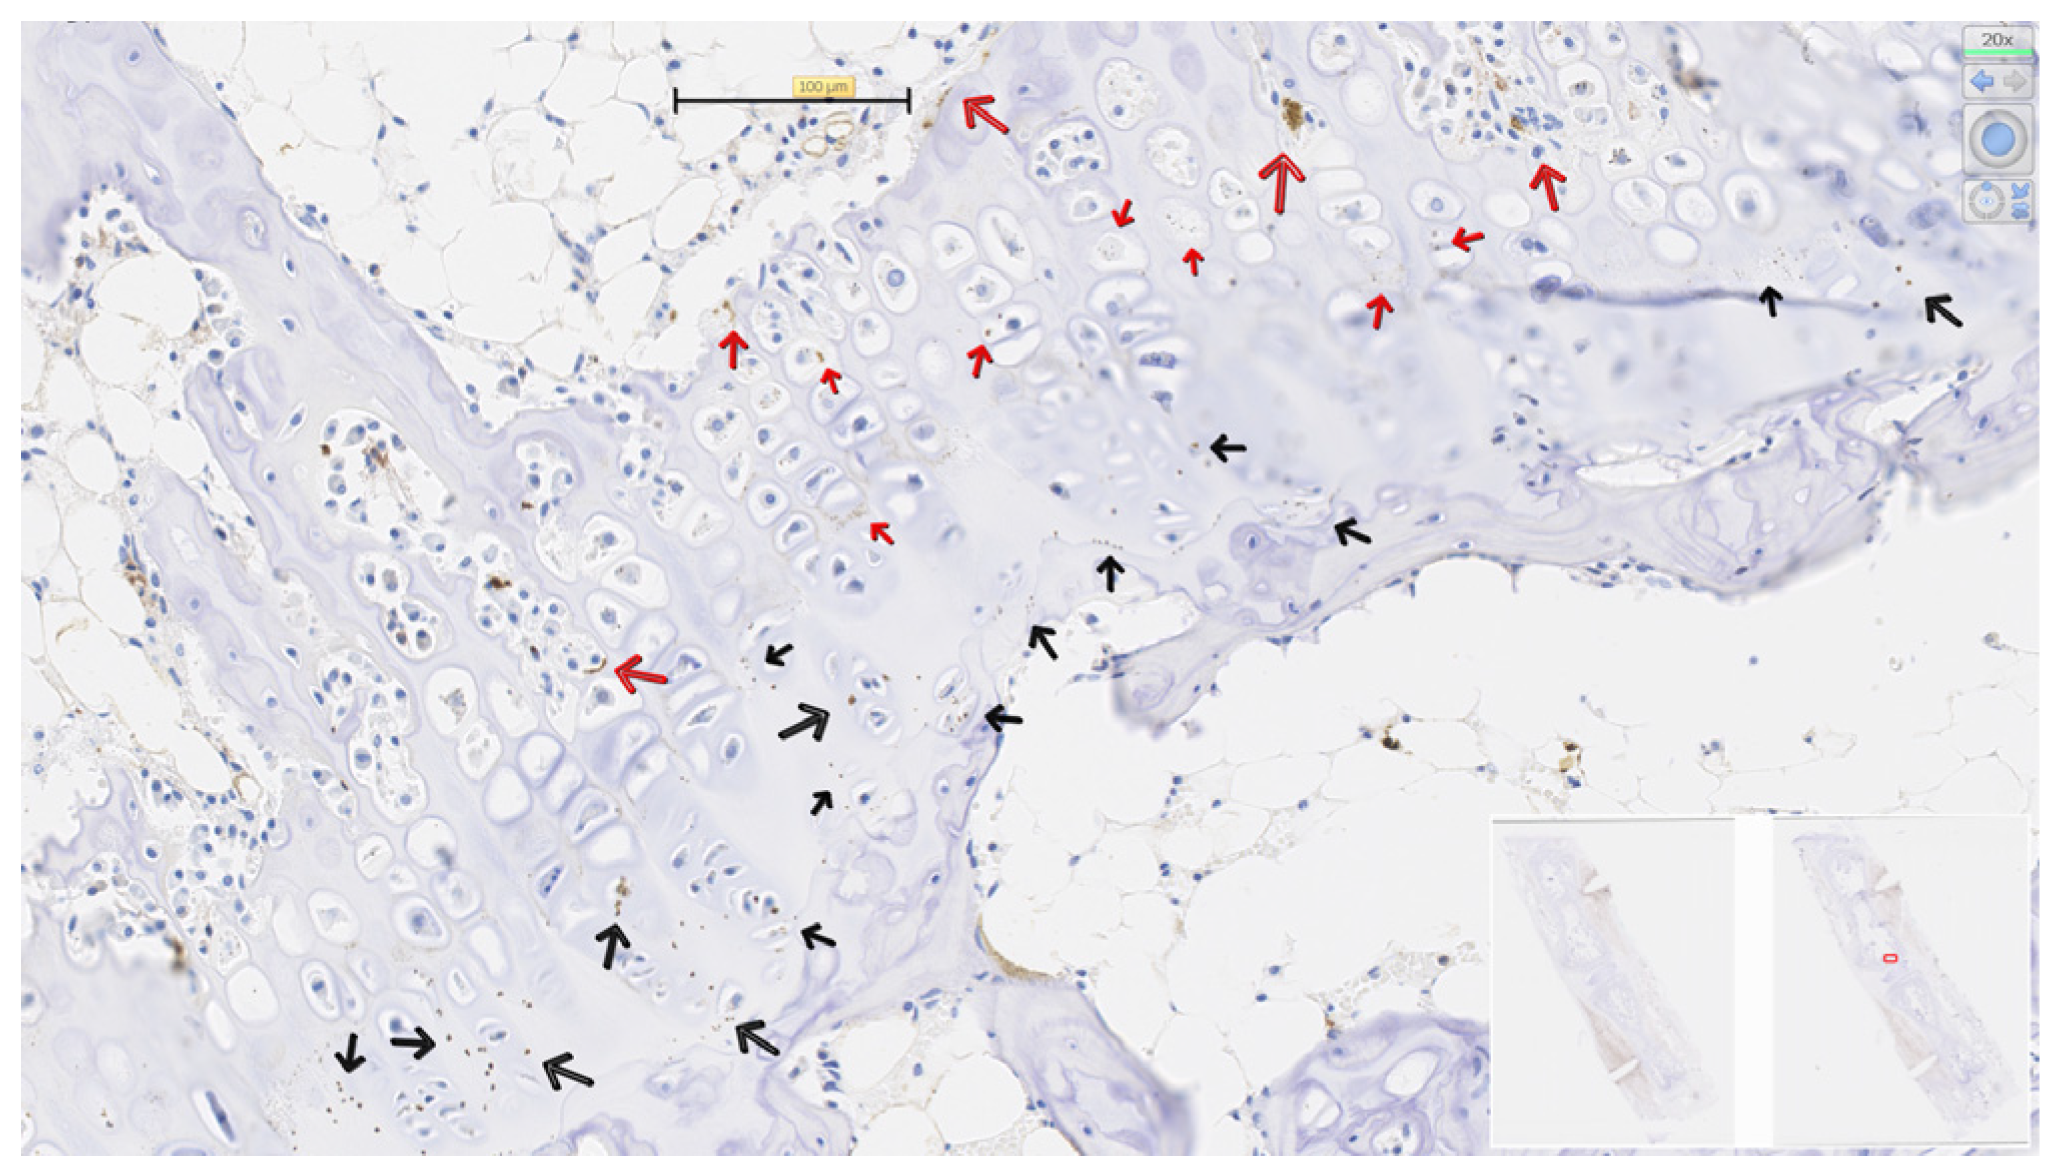
The differential expression of PCNA in the three zones was varied, with no clear patterns for the three groups. The PCNA was only detected in the reserve zone for the DT with 50% of the samples and was found in the proliferative zone for both the ST and DT with 50% of the samples, as compared to the SC with 17% of the samples (Figure 4, Figure 5 and Figure 6). In the hypertrophic zone, adjacent to the calcified area, the PCNA was apparently present in the three groups (100% in the SC, 67% in the ST, and 50% in the DT) (Figure 4, Figure 5 and Figure 6).

4. Discussion

There is little published work for comparison that uses torque, specifically with no studies having used the segmented rat tail model. Moreland et al. applied torsional loads to rabbit tibias and found that short-term longitudinal growth was not significantly changed [24]. Lazarus et al. performed oblique plating to rabbit femurs and found a decrease in longitudinal growth 4 weeks post-installation [23]. In this study, there was no change in the longitudinal vertebral growth rate as well as morphologies in X-ray across all three groups.
Application of static and dynamic torque led to asymmetrical reduction in the proximal intervertebral disc space, but not the Ca7-Ca8 middle disc space (Table 1). The decrease in disc space height is localized to the proximal intravertebral space, which aligns with work focused on compression [34,35,36]. They also found decreases in disc height with application of axial compressive loads, but in the middle disc. While asymmetrical loads and wedging are often attributed to compression, our result could point to torsion playing a role in the progression of scoliotic wedging at an adjacent level.
There was no significant difference between the decreased right-sided and mean heights of the proximal intravertebral disc space in the DT and ST groups. When comparing static and dynamic compression of intravertebral discs in rat caudal vertebrae, Ménard et al. also found no difference between the static and dynamic compression groups’ middle disc heights. Likewise, static and dynamic decreased significantly compared to shams [35]. Upon removal of the compression, static loading rats in Menard et al. had significantly decreased nucleus proteoglycan contents compared to dynamic loading rats, which could be a sign of increased disc degeneration in the static group [35].
The results of this study also suggest that when compared to shams, both DT and ST may be associated with a significant decrease in height across various regions of the growth plates (see Table 2) but no differences in overall vertebral growth rate. Under static compression (0.2 MPa) for two weeks on SD rat tails, the previous study supports the current results, including a decrease in physeal height when comparing loaded and sham groups and no significant decrease in longitudinal vertebral growth rates [19]. In our study, the torque was applied in the clockwise direction. This torque generates a shear stress in the vertebral body, which is in the direction of the torque. It is well known that compressive loading leads to a reduction in growth of the physis. In a similar way, the shear stress may be in the direction that leads to a reduced growth of the physis.
Notably, there was no significant difference in physeal height measurements across the DT and ST groups, suggesting that the force generated by each loading protocol had a similar effect on the growth plate over the course of the 4 weeks. Compared to the sham control, ST growth plates exhibited a 21.7% decrease in Ca8 proximal middle physeal height, while DT yielded a 26.1% decrease in height. Within the Ca7 proximal growth plate, there was a 19.0% decrease in physeal height of statically loaded vertebrae compared to shams, while the DT group displayed a 23.8% decrease. This contrasts with Valteau et al., who found a significant difference between growth plate heights in rat tail subject to static (0.2 MPa) and dynamic axial compression (0.2 MPa ± 30%, 0.1 Hz) over the course of four weeks [17]. When compared to shams, the reductions in physeal height for this study were 14.0% and 3.8% for the static and dynamic compression groups, respectively. Torsional loading may be associated with further differences in physeal height compared to axial compression loading; however, there are several factors that influence the findings across studies, such as loading frequency or loading device.
There was a torque-associated decrease in chondrocyte reserve zone height on the distal Ca7 physes (Table 3). The decrease in reserve zone height (on the left side) of the Ca7 distal growth plate in both the ST and DT groups aligned with measured decreases in the overall physeal height in both torque groups (Table 2). This result could suggest that the torque associated with significant decreases in reserve zone height was driving the decreases in physeal height. While a change in physeal zone height can be associated with variation in chondrocyte height or overall count [37]. However, there were areas of increased or reduced proliferative and hypertrophic zone height in response to static or dynamic torsion (Table 3), which could represent unpredictable impacts on the activity of chondrocytes.
The various detections of PCNA could suggest chondrocyte cell-proliferating capacity and subsequent division in the proliferative zone of growth plates subject to torsional shear stress. As well as an opposing reduction in proliferation and division in the hypertrophic zone, indicating an increase in programmed cell apoptosis or reduced cell proliferating capabilities for both the ST and DT groups (Figure 4, Figure 5 and Figure 6). However, this hypothesis is not entirely in agreement with our noted significant changes in zone height. On review of the 1 h of cyclic tensile strain for 3 days on SD rats [30], a significant increase in the “optical density” of PCNA within physeal chondrocytes was also coupled with an increase in longitudinal growth [6].
In our previous study [22], the use of the finite element analysis examined the mechanical deformation of the growth plates and disc, distribution of the stress, and stress components (shear, torsional, axial compression), and found that the pure shear component varied in annular rings circumferentially with the center of the growth plate. The minimal stress is found at the center of the growth plate and is increased towards the outer perimeter. The shear stress is primarily due to the torque that may affect the number of endochondral cells in the proliferative and hypertrophic zone. However, the previous study was limited to the static torque only.
One of the limitations of this study is the short duration of static or dynamic torque on the rat tail for 4 weeks. Although current research attempted to validate the static or dynamic torque device and provided a pilot result, it failed to clearly address the loading responses on the physis, wedged vertebrae, rotational segments, compensatory alignments, or reversal of morphological or histological changes following removal of the loads. So a long-term study may warrant observing changes as mentioned above and further understanding the development of scoliosis and the mechanism of a growth-friendly surgical intervention. Another limitation of our study is the duration of torque loading on the SD tail at an age of 7 weeks. Normal skeletal maturity of SD rats is achieved by 11.5–13 weeks with peak growth rate between 3 and 5 weeks of age [31,32,38], so we should have observed the period around peak growth velocity. Other limitations are the small sample size of only 6 rats per group, and PCNA visualization in the three chondrocyte zones was not measured in a quantifiable manner.

5. Conclusions

In summary, both static and dynamic torque-generated shear stress are associated with asymmetric reduction in the growth plate height, as well as asymmetric reduction in the proximal intravertebral disc space. Within the physis, there were noted decreases in reserve zone height in response to torque that aligned with overall decreases in growth plate height. However, there were mixed observations in the hypertrophic and proliferative zones, evidenced by the unpredicted chondrocyte proliferating capability or apoptosis noted in the PCNA staining. These findings suggest that torsional shear stress may play a role in the development of spinal curvature or its pathological progression. Lastly, there were no considerable differences at the histomorphology and immunohistochemistry levels between static and dynamic torques.

Author Contributions

Conceptualization, X.-C.L. and R.R.; Methodology, X.-C.L., R.R., P.N. and E.J.; Software and device, R.R.; Validation, R.R. and D.R.; Formal analysis, X.-C.L., D.R., P.N., J.T.; C.T. and A.A.; Investigation, D.R. and E.J.; Resources, E.J.; Data curation, D.R.; Writing—original draft preparation, X.-C.L., R.R., D.R.; Writing—review and editing, A.A., J.T., C.T., P.N., E.J.; Funding acquisition, X.-C.L., R.R. All authors have read and agreed to the published version of the manuscript.

Funding

This research was funded by the Scoliosis Research Society for the support of animals and the torque devices. The APC was not funded.

Institutional Review Board Statement

The animal research was approved by the Institutional Animal Care and Use Committee (IACUC) of Medical College of Wisconsin (protocol AUA0003531, date of approval 7 June 2014).

Data Availability Statement

No new data were created or analyzed in this study.

Acknowledgments

We would like to thank Sergey Tarima, the Biostatistics Department, and the Medical College of Wisconsin for their support of statistical analysis in this project.

Conflicts of Interest

The authors declare no conflicts of interest.

Abbreviations

The following abbreviations are used in this manuscript:
AISAdolescent idiopathic scoliosis
SDSprague-Dawley
VBTVertebral body tethering
MACMinimum alveolar concentration
PCNAProliferating cell nuclear antigen
CaCaudal vertebral body
ANOVAAnalysis of variance
ANCOVAAnalysis of covariance
SCSham control
STStatic torque
DTDynamic control
FSUFunctional spinal unit

References

  1. Bagnall, K.M. Using a synthesis of the research literature related to the etiology of adolescent idiopathic scoliosis to provide ideas on future directions for success. Scoliosis 2008, 3, 5. [Google Scholar] [CrossRef]
  2. Desroches, G.; Aubin, C.-E.; Rivard, C.H. Biomechanical modeling of anterior spine instrumentation in AIS. Stud. Health Technol. Inform. 2006, 123, 415–418. [Google Scholar]
  3. Gardner-Morse, M.G.; Stokes, I.A.F. Structural behavior of human lumbar spinal motion segments. J. Biomech. 2004, 37, 205–212. [Google Scholar] [CrossRef]
  4. Stokes, I.A.F.; Burwell, R.G.; Dangerfield, P.H.; IBSE. Biomechanical spinal growth modulation and progressive adolescent scoliosis—A test of the “vicious cycle” pathogenetic hypothesis: Summary of an electronic focus group debate of the IBSE. Scoliosis 2006, 1, 16. [Google Scholar] [CrossRef] [PubMed]
  5. Alfraihat, A.; Olson, J.C.; Snyder, B.D.; Cahill, P.J.; Balasubramanian, S. Thoracic vertebral morphology in normal and scoliosis deformity in skeletally immature rabbits: A Longitudinal study. JOR Spine 2020, 3, e1118. [Google Scholar] [CrossRef] [PubMed]
  6. Stokes, I.A.; Aronsson, D.D.; Dimock, A.N.; Cortright, V.; Beck, S. Endochondral growth in growth plates of three species at two anatomical locations modulated by mechanical compression and tension. J. Orthop. Res. 2006, 24, 1327–1334. [Google Scholar] [CrossRef] [PubMed]
  7. D’Andrea, C.R.; Alfraihat, A.; Singh, A.; Anari, J.B.; Cahill, P.J.; Schaer, T.; Snyder, B.D.; Elliott, D.; Balasubramanian, S. Part 1. Review and meta-analysis of studies on modulation of longitudinal bone growth and growth plate activity: A macro-scale perspective. J. Orthop. Res. 2021, 39, 907–918. [Google Scholar] [CrossRef]
  8. Brink, R.C.; Homans, J.F.; Schlösser, T.P.C.; van Stralen, M.; Vincken, K.L.; Shi, L.; Chu, W.C.W.; Viergever, M.A.; Castelein, R.M.; Cheng, J.C.Y. CT-based study of vertebral and intravertebral rotation in right thoracic adolescent idiopathic scoliosis. Eur. Spine J. 2019, 28, 3044–3052. [Google Scholar] [CrossRef]
  9. Kouwenhoven, J.-W.M.; Vincken, K.L.; Bartels, L.W.; Castelein, R.M. Analysis of Preexistent Vertebral Rotation in the Normal Spine. Spine 2006, 31, 1467–1472. [Google Scholar] [CrossRef]
  10. Barbir, A.; Godburn, K.E.; Michalek, A.J.; Lai, A.; Monsey, R.D.; Iatridis, J.C. Effects of Torsion on Intervertebral Disc Gene Expression and Biomechanics, Using a Rat Tail Model. Spine 2011, 36, 607–614. [Google Scholar] [CrossRef]
  11. Michalek, A.J.; Funabashi, K.L.; Iatridis, J.C. Needle puncture injury of the rat intervertebral disc affects torsional and compressive biomechanics differently. Eur. Spine J. 2010, 19, 2110–2116. [Google Scholar] [CrossRef]
  12. Michalek, A.J.; Iatridis, J.C. Height and torsional stiffness are most sensitive to annular injury in large animal intervertebral discs. Spine J. 2012, 12, 425–432. [Google Scholar] [CrossRef] [PubMed]
  13. Benoit, A.; Mustafy, T.; Londono, I.; Grimard, G.; Aubin, C.E.; Villemure, I. In vivo dynamic compression has less detrimental effect than static compression on newly formed bone of a rat caudal vertebra. J. Musculoskelet Neuronal Interact 2016, 16, 211–220. [Google Scholar]
  14. Ménard, A.L.; Grimard, G.; Valteau, B.; Londono, I.; Moldovan, F.; Villemure, I. In vivo dynamic loading reduces bone growth without histomorphometric changes of the growth plate: Growth plate dynamic loading. J. Orthop. Res. 2014, 32, 1129–1136. [Google Scholar] [CrossRef] [PubMed]
  15. Stokes, I.A.; Spence, H.; Aronsson, D.D.; Kilmer, N. Mechanical modulation of vertebral body growth. Implications for scoliosis progression. Spine 1996, 21, 1162–1167. [Google Scholar] [CrossRef] [PubMed]
  16. Stokes, I.A.; Mente, P.L.; Iatridis, J.C.; Farnum, C.E.; Aronsson, D.D. Enlargement of growth plate chondrocytes modulated by sustained mechanical loading. J. Bone Jt. Surg. Am. 2002, 84, 1842–1848. [Google Scholar] [CrossRef]
  17. Valteau, B.; Grimard, G.; Londono, I.; Moldovan, F.; Villemure, I. In vivo dynamic bone growth modulation is less detrimental but as effective as static growth modulation. Bone 2011, 49, 996–1004. [Google Scholar] [CrossRef]
  18. Alberty, A.; Peltonen, J.; Ritsilä, V. Effects of distraction and compression on proliferation of growth plate chondrocytes. A study in rabbits. Acta Orthop. Scand. 1993, 64, 449–455. [Google Scholar] [CrossRef]
  19. Cancel, M.; Grimard, G.; Thuillard-Crisinel, D.; Moldovan, F.; Villemure, I. Effects of in vivo static compressive loading on aggrecan and type II and X collagens in the rat growth plate extracellular matrix. Bone 2009, 44, 306–315. [Google Scholar] [CrossRef]
  20. Stokes, I.A.F.; Clark, K.C.; Farnum, C.E.; Aronsson, D.D. Alterations in the growth plate associated with growth modulation by sustained compression or distraction. Bone 2007, 41, 197–205. [Google Scholar] [CrossRef]
  21. Rizza, R.; Liu, X.C.; Thometz, J.; Lyon, R.; Tassone, C. Implementation of a New Torque Device in Ox-Tails. In Summer Bioengineering Conference; American Society of Mechanical Engineers: New York, NY, USA, 2010; Parts A and B:819–820. [Google Scholar] [CrossRef]
  22. Rizza, R.; Liu, X.C. Mechanics and validation of an in vivo device to apply torsional loading to caudal vertebrae. J. Biomech. Eng. 2013, 135, 81003. [Google Scholar] [CrossRef]
  23. Lazarus, D.E.; Farnsworth, C.L.; Jeffords, M.E.; Marino, N.; Hallare, J.; Edmonds, E.W. Torsional Growth Modulation of Long Bones by Oblique Plating in a Rabbit Model. J. Pediatr. Orthop. 2018, 38, e97–e103. [Google Scholar] [CrossRef]
  24. Moreland, M. Morphological effects of torsion applied to growing bone. An in vivo study in rabbits. J. Bone Jt. Surg. 1980, 62, 230–237. [Google Scholar] [CrossRef]
  25. Driscoll, M.; Aubin, C.É.; Moreau, A.; Wakula, Y.; Amini, S.; Parent, S. Novel Hemi-Staple for the Fusionless Correction of Pediatric Scoliosis: Influence on Intervertebral Disks and Growth Plates in a Porcine Model. Clin. Spine Surg. 2016, 29, 457–464. [Google Scholar] [CrossRef]
  26. Liu, J.; Li, Z.; Shen, J.; Xue, X. Spinal growth modulation with posterior unilateral elastic tether in immature swine model. Spine J. 2015, 15, 138–145. [Google Scholar] [CrossRef]
  27. Wong, H.K.; Ruiz, J.N.M.; Newton, P.O.; Liu, K.P.G. Non-Fusion surgical correction of thoracic idiopathic scoliosis using a novel, braided vertebral body tethering device: Minimum follow-up of 4 years. JBJS Open Access 2019, 4, e0026. [Google Scholar] [CrossRef]
  28. Sun, K.; Liu, F.; Wang, J.; Guo, Z.; Ji, Z.; Yao, M. The effect of mechanical stretch stress on the differentiation and apoptosis of human growth plate chondrocytes. In Vitro Cell Dev. Biol. Anim. 2017, 53, 141–148. [Google Scholar] [CrossRef] [PubMed]
  29. Irie, T.; Aizawa, T.; Kokubun, S. The role of sex hormones in the kinetics of chondrocytes in the growth plate: A study in the rabbit. J. Bone Jt. Surg. 2005, 87, 1278–1284. [Google Scholar] [CrossRef] [PubMed]
  30. Yang, K.; Wu, Y.; Cheng, P.; Zhang, J.; Yang, C.; Pi, B.; Ye, Y.; You, H.; Chen, A.; Xu, T.; et al. YAP and ERK mediated mechanical strain-induced cell cycle progression through RhoA and cytoskeletal dynamics in rat growth plate chondrocytes. J. Orthop. Res. 2016, 34, 1121–1129. [Google Scholar] [CrossRef]
  31. Akyuz, E.; Braun, J.T.; Brown, N.A.T.; Bachus, K.N. Static Versus Dynamic Loading in the Mechanical Modulation of Vertebral Growth. Spine 2006, 31, E952–E958. [Google Scholar] [CrossRef] [PubMed]
  32. Mente, P.L.; Aronsson, D.D.; Stokes, I.A.; Iatridis, J.C. Mechanical modulation of growth for the correction of vertebral wedge deformities. J. Orthop. Res. 1999, 17, 518–524. [Google Scholar] [CrossRef] [PubMed]
  33. González-Magaña, A.; Blanco, F.J. Human PCNA Structure, Function and Interactions. Biomolecules 2020, 10, 570. [Google Scholar] [CrossRef]
  34. Hirata, H.; Yurube, T.; Kakutani, K.; Maeno, K.; Takada, T.; Yamamoto, J.; Kurakawa, T.; Akisue, T.; Kuroda, R.; Kurosaka, M.; et al. A rat tail temporary static compression model reproduces different stages of intervertebral disc degeneration with decreased notochordal cell. J. Orthop. Res. 2014, 32, 455–463. [Google Scholar] [CrossRef] [PubMed]
  35. Ménard, A.L.; Grimard, G.; Massol, E.; Londono, I.; Moldovan, F.; Villemure, I. Static and dynamic compression application and removal on the intervertebral discs of growing rats: Disc compression in growing rats. J. Orthop. Res. 2016, 34, 290–298. [Google Scholar] [CrossRef] [PubMed]
  36. Stokes, I.A.F.; McBride, C.A.; Aronsson, D.D.; Roughley, P.J. Metabolic Effects of Angulation, Compression, and Reduced Mobility on Annulus Fibrosis in a Model of Altered Mechanical Environment in Scoliosis. Spine Deform. 2013, 1, 161–170. [Google Scholar] [CrossRef]
  37. D’Andrea, C.R.; Alfraihat, A.; Singh, A.; Anari, J.B.; Cahill, P.J.; Schaer, T.; Snyder, B.D.; Elliott, D.; Balasubramanian, S. Part 2. Review and meta-analysis of studies on modulation of longitudinal bone growth and growth plate activity: A micro-scale perspective. J. Orthop. Res. 2021, 39, 919–928. [Google Scholar] [CrossRef]
  38. Roach, H.I.; Mehta, G.; Oreffo, R.O.; Clarke, N.M.; Cooper, C. Temporal analysis of rat growth plates: Cessation of growth with age despite presence of a physis. J. Histochem. Cytochem. 2003, 51, 373–383. [Google Scholar] [CrossRef]
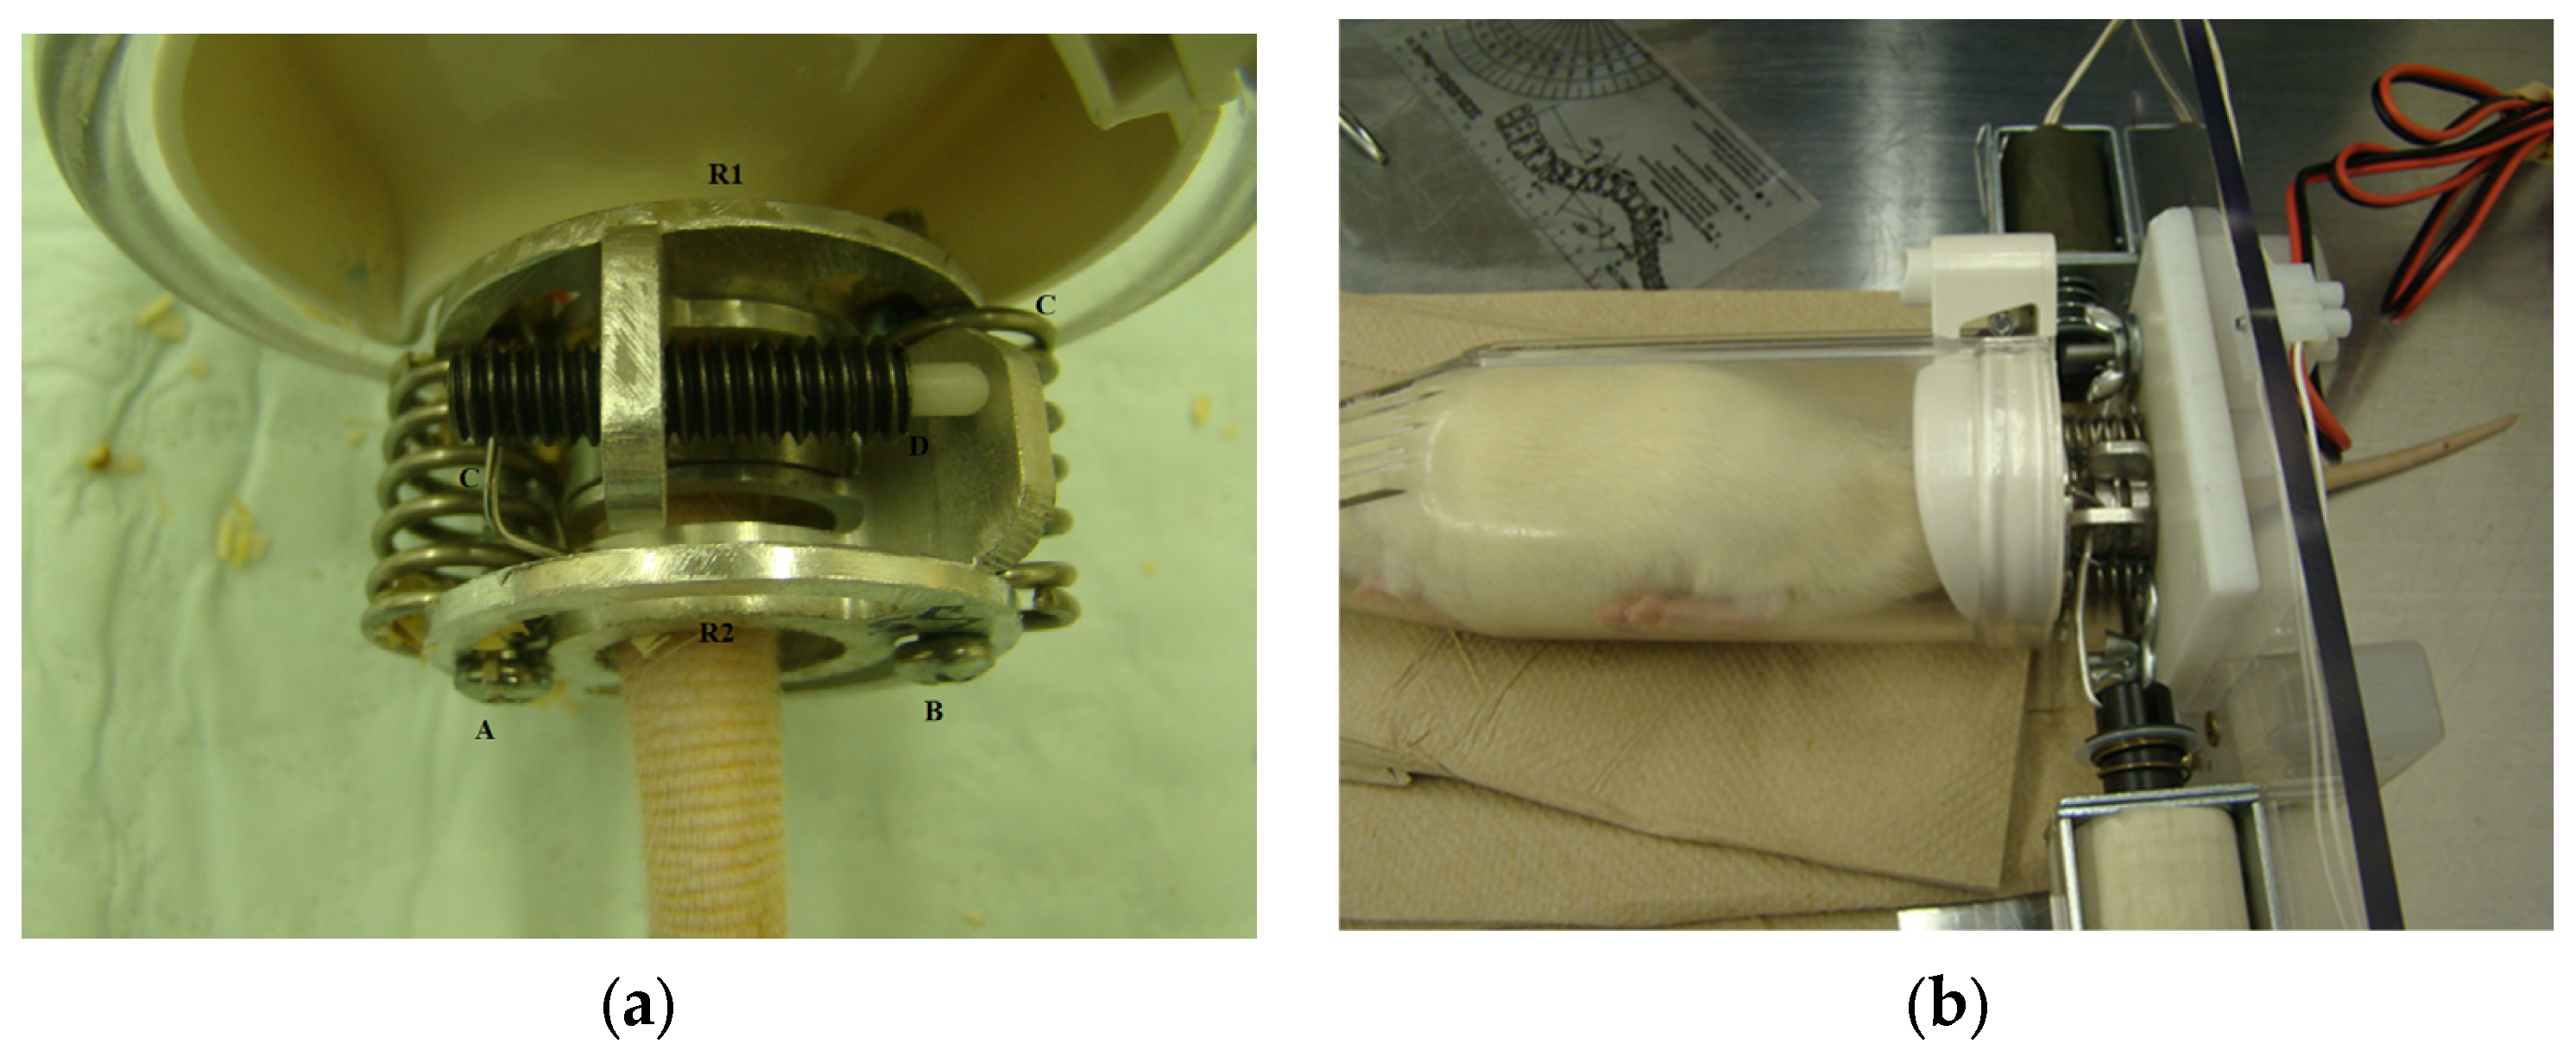
Figure 1. (a). For static loading, the spring-loaded detent pins were set so that the torque was 1.25 Nm for a total of 4 weeks on the Sprague-Dawley tail (R1, R2: rings; A, B: axial compression screws; C: k-wires; D: detent pin). (b). A Sprague-Dawley rat placed in a restrained chamber to allow for access to the tail. For dynamic loading, the detent pins were replaced with microcontrolled solenoids. A torque of 2.4 Nm with 20.5° of rotation was applied at 1.0 Hz for 15 min per day, three times per week, over 4 weeks.
Osteology 05 00031 g001
Figure 2. Histomorphological assessment using Nanozoomer scanning of the Ca7-Ca8 spinal unit for an 11-week-old SD rat. Measuring the length of vertebrae on medial, lateral, and middle parts (i.e., medial bony point on PP-Ca8 to medial bony point on DP-Ca8; lateral bony point on PP-Ca8 to lateral bony point on DP-Ca8; middle bony point on PP-Ca8 to middle bony point on DP-Ca8), the width of vertebrae (i.e., medial to lateral bony point on PP-Ca8 or DP-Ca8); height of physis on medial, lateral, and middle part (i.e., measuring length from the reserve zone to the hypertrophic zone on the medial, lateral, or middle area on PP-Ca8 or DP-Ca8), width of physis (i.e., medial to lateral point of physis on PP-Ca8 or DP-Ca8), and intra-disc space heights on medial, lateral, and middle parts (i.e., outer layer fiber or annulus on DP-Ca7 to outer layer fiber on PP-Ca8 on the medial, lateral or middle of disc) or width of disc (medial point of annulus to lateral point of annulus between Ca7 and Ca8) (H&E Staining; magnifications × 0.57) (arrows: PP-Ca7 for proximal physis on Ca7; DP-Ca7 for distal physis for Ca7; PP-Ca8 for proximal physis for Ca8; DP-Ca8 for distal physis for Ca8).
Osteology 05 00031 g002
Figure 3. Histomorphological assessment using Nanozoomer scanning of the proximal growth plate (measuring from the reserve zone to the hypertrophic zone) at Ca8 spinal unit for 11-week-old SD rat. Displaying the middle physis height among three groups: the height of mid-physis in SC group (240 μm = 0.24 mm) is greater than those in ST (191 μm = 0.191 mm) and DT (185 μm = 0.185 mm) groups, respectively (H&E Staining; magnifications × 3.15).
Osteology 05 00031 g003
Figure 4. Immunohistochemistry and Alcian Blue Staining on the growth plate of the Ca7-Ca8 for 11-week-old SD rat in ST group (Alcian Blue Staining; magnifications × 20). Proliferating cell nuclear antigen (PCNA) detection in the middle growth plate for the SD rat in ST group, displaying in proliferative zone (black arrow) and hypertrophic zone (red arrow). No PCNA detection in the reserve zone.
Osteology 05 00031 g004
Figure 5. PCNA detection in the middle growth plate of the Ca7-Ca8 for 11-week-old SD rat in SC group (Alcian Blue Staining; magnifications × 20), displaying in hypertrophic zone or calcified zone (red arrow). No PCNA detection in the reserve zone.
Osteology 05 00031 g005
Figure 6. PCNA detection in the growth plate of the Ca7-Ca8 for 11-week-old SD rat in DT group (Alcian Blue Staining; magnifications × 20), displaying in reserve zone or proliferative zone (black arrow) and hypertrophic zone (red arrow) in the middle of the physis. The PCNA detection in the reserve zone.
Osteology 05 00031 g006
Table 1. Significant differences in the proximal disc height from day 0 to 4th weeks between ST and SC or between DT and SC on X-ray (Mean ± SD, mm, ANOVA, ANCOVA, p < 0.05).
ParameterStatic
Torque
Sham
Control
Dynamic
Torque
Mean disc height (mm)0.004 ± 0.03 *10.16 ± 0.290.001 ± 0.05 *2
Right-sided disc height (mm)−0.01 ± 0.05 *30.15 ± 0.290.03 ± 0.06 *4
Note: * where p < 0.05 compared to sham control (*1 as p = 0.02; *2 as p = 0.005; *3 as p = 0.009; *4 as p = 0.009). (−): reduced difference in the disc height between day zero and the 4th week.
Table 2. Significant differences in the physeal height between ST and SC or between DT and SC on histological analysis (Mean ± SD, mm, ANOVA, ANCOVA, p < 0.05).
ParameterSTSCDT
Ca7 Growth Plate Heights
 Middle of Proximal Growth Plate (mm)0.17 ± 0.02 *10.21 ± 0.030.16 ± 0.03 *2
 Left side of Distal Growth Plate (mm)0.18 ± 0.03 *30.24 ± 0.040.18 ± 0.06 *4
Ca8 Growth Plate Heights
 Middle of Proximal Growth Plate (mm)0.18 ± 0.02 *50.23 ± 0.030.17 ± 0.02 *6
 Right side of Proximal Growth Plate (mm)0.18 ± 0.04 *70.23 ± 0.050.16 ± 0.03 *8
Note: The Ca7 and Ca8 are the proximal (7th) and distal caudal vertebral body (8th). * p < 0.05 compared to sham control (*1 as p = 0.02; *2 as p = 0.01; *3 as p = 0.02; *4 as p = 0.045; *5 as p = 0.008; *6 as p = 0.001; *7 as p = 0.02; *8 as p = 0.003).
Table 3. Significant differences in physeal zone heights on histological analysis (Mean ± SD, μm, ANOVA, ANCOVA, p < 0.05).
ParameterSTSCDT
Ca7 Growth Plate Zones
 Proliferative (R-side) of Proximal Physis (μm)66.23 ± 24.8566.3 ± 13.65108.4 ± 21.8 a1,b1
 Reserve (L-side) of Distal Physis (μm)26.6 ± 12.28 a247.18 ± 7.8824.96 ± 9.22 a3
 Hypertrophic (Middle) of Distal Physis (μm)105 ± 16.8577.77 ± 17.75113.6 ± 31.71 a4
Ca8 Growth Plate Zones
 Hypertrophic (R-side) of Proximal Physis (μm)75.6 ± 16.9471.27 ± 14.5048.55 ± 12.88 a5,b2
 Hypertrophic (Middle) of Distal Physis (μm)97.93 ± 28.15 a664.3 ± 18.2862.22 ± 19.73 b3
Note: The Ca7 and Ca8 are the proximal and distal caudal vertebral bodies. a p < 0.05 DT/ST compared to SC group (a1 as p = 0.005; a2 as p = 0.003; a3 as p = 0.003; a4 as p = 0.02; a5 as p = 0.02; a6 as p = 0.03). b p < 0.05 DT compared to ST group (b1 as p = 0.004; b2 as p = 0.007; b3 as p = 0.02).
Disclaimer/Publisher’s Note: The statements, opinions and data contained in all publications are solely those of the individual author(s) and contributor(s) and not of MDPI and/or the editor(s). MDPI and/or the editor(s) disclaim responsibility for any injury to people or property resulting from any ideas, methods, instructions or products referred to in the content.