Article

Discrepancy Between the 10-Year Probability of Major Osteoporotic Fracture with FRAX and the Actual Fracture Prevalence over 10 Years in Japanese

1
Department of Musculoskeletal Medicine, Yoshii Clinic, 6-7-5 Nakamura-Ohashidori, Shimanto City 787-0033, Kochi Prefecture, Japan
2
Department of Rheumatology, Dohgo-Onsen Hospital Rheumatology Center, Matsuyama 790-0858, Ehime Prefecture, Japan
3
Department of Rheumatology, Kochi Memorial Hospital, Kochi 780-0824, Kochi Prefecture, Japan
*
Author to whom correspondence should be addressed.
Osteology 2025, 5(4), 28; https://doi.org/10.3390/osteology5040028
Submission received: 12 July 2025 / Revised: 12 September 2025 / Accepted: 22 September 2025 / Published: 25 September 2025

Abstract

Background/Objectives: Comparison between the 10-year probability of major osteoporotic fracture (MOF) calculated with FRAX (pFRAX) and the actual MOF rate was conducted, and the availability of pFRAX was evaluated with a one-center cohort study. Methods: Eligible patients were followed up for 10 years. Risk factors listed as items in the FRAX, and presence of lifestyle-related diseases (LS-RDs), escalated ability to fall (Fall-ability), cognitive impairment (CI), etc., were evaluated concerning MOF. The 10-year probability and actual MOF rate were compared. Risk factors contributing to the discrepancy between the probability and the actual rate were evaluated after dividing subgroups. Results: The study included 931 patients. Factors that contributed to the significantly higher ratio for incident MOF besides items in the FRAX were LS-RD, Fall-ability, CI, and anti-osteoporotic drug intervention. The higher the number of factors presented, the higher the actual MOF prevalence compared to the probability rise. Presenting LS-RD, Fall-ability, and CI are independent of the items in the FRAX. pFRAX was overestimated in the low-risk groups and underestimated in the high-risk group compared to the actual MOF rate. These phenomena are caused by the lack of consideration of these three comorbidity risks. Conclusions: A discrepancy between pFRAX and the actual MOF rate exists. LS-RD, Fall-ability, and CI should be listed in the items of the FRAX for more concision.

1. Introduction

Osteoporotic fractures are conditions where bone tissue breaks due to bone fragility, even with minor external forces, and are mainly caused by aging, especially among postmenopausal women, who are the primary population affected. Osteoporotic fractures are different from traumatic fractures, including high-energy fractures. Osteoporotic fracture is the most significant social and economic threat factor worldwide because society is aging and the number of elderly women is increasing globally [1,2,3], especially in Japan, which is a world-leading aging society [4,5]. Preventing this outbreak is one of the main objectives of medical care [6]. Hagino proposed naming osteoporotic fractures with more impactful and intuitive, serious terms, particularly calling the proximal femoral fracture “bone stroke”, as it is similarly imaged as brain strokes. He argues that it is a disease with a high mortality rate, similar to stroke, and requires public awareness [7].
Predicting the occurrence of osteoporotic fractures is a crucial task in clinical practice nationwide. FRAX is a computer-based algorithm [8,9] that calculates the 10-year probability of a major osteoporotic fracture (MOF; hip, spine, humerus, or wrist fracture) and the 10-year probability of hip fracture. Fracture risk is determined by 12 items in a questionnaire. These are age, sex, body mass index (BMI) [10], bone mineral density (BMD) or T-score, which is derived from BMD in the hip [11], and well-validated dichotomized risk factors, such as current smoking habits [12], alcohol consumption of three or more units per day [13], presence of rheumatoid arthritis (RA) [14], previous fracture [15], parental history of hip fracture [16], and glucocorticoid steroid (GCS) usage [14]. FRAX assesses these risk factors to predict the likelihood of an osteoporotic fracture within 10 years. Currently, it is used in more than 64 countries and is becoming the global standard for predicting osteoporotic fractures [9]. However, the formula that calculates the 10-year probability inside FRAX remains unknown, and the weighting of individual factors is also unknown.
In the early 2000s, when FRAX was developed, the main risk factor of MOF was bone strength. The diagnosis of osteoporosis depended on the quantitative assessment of BMD; thus, the results of measurements using dual-energy X-ray absorptiometry (DXA) were incorporated into the FRAX parameters [17,18]. However, later or nearly simultaneously, fracture risk related to so-called lifestyle-related diseases (LS-RD) was considered [19,20,21]. Recently, the risk of bone fragility fractures associated with LS-RDs, such as diabetes mellitus (DM) [22,23,24], chronic obstructive pulmonary disease (COPD) [25,26,27], and chronic kidney dysfunction (CKD) [28,29], has been widely recognized as solid. However, options for factors belonging to LS-RD are not included in FRAX, except for current smoking habits and the consumption of three or more units of alcohol per day. There is a dichotomized option for secondary osteoporosis where type 1 DM is included, but type 2 DM is not included. This could reduce the accuracy of the 10-year probability calculations using FRAX. Some reports describe discordance between the probability estimated with FRAX and the actual occurrence rate of hip fractures in patients with type 2 DM, with FRAX estimating a relatively lower fracture risk in these patients [30]. Not only type 2 DM but also other LS-RDs, such as COPD, CKD, arteriosclerosis, or aortic calcification [31,32,33], have been suggested to carry a higher fracture risk, despite these diseases not being included as dichotomized factors in FRAX. These risks are mainly caused by deterioration of bone quality due to abnormal collagen cross-linking [34,35].
Another factor that affects the accuracy of the 10-year fracture risk predicted by FRAX is hyper fall-ability, which refers to a situation that elevates fall risk [36,37,38,39]. As a risk factor for osteoporotic fracture, it was identified long before FRAX was developed, but it was not included in the assessment items.
The objective of this study was to measure the incidence of osteoporotic fractures in a single-center retrospective cohort study in order to statistically verify the weight of individual risk factors, and to compare the overall risk with the predicted FRAX.

2. Materials and Methods

2.1. Recruiting Patients, Bone Mineral Density Measurement, and Existing Fracture Evaluation

Outpatients who underwent bone mineral density (BMD) assessment using dual-energy X-ray absorptiometry (DXA) also had X-ray images of the thoraco-lumbar spine taken simultaneously. Their BMD was measured in the lumbar spine and femoral neck. DXA measurements were performed with the DPX® Bravo ME9309 Bone Densitometer (GE Healthcare, Chicago, IL, USA; coefficients of variation: CV: 1.1% for lumbar spine, 0.9% for femoral neck). These measurements were recorded as baseline data. The patients’ T-scores, which indicate the deviation of BMD from the mean BMD of healthy 30-year-olds of the same sex (with a standard deviation), were presented in the study. Therefore, the risk factor we evaluated was the minimum T-score in the lumbar spine (T-LS) or the femoral neck (T-FN).
From the X-ray images, existing vertebral body fractures (ex-VF) were evaluated using the semiquantitative score (SQ) developed by Genant et al. [40]. The SQ classifies VF from Grade-0 to Grade-3. In this study, ex-VF was defined as Grade 3 or the presence of endplate collapse in Grades 1 and 2, which was considered a risk factor. Proximal femoral fractures and other non-vertebral fractures were assessed through radiographs of the pelvis or fractured areas or via medical records. Existing non-vertebral fractures, including hip fractures (ex-NVF), were regarded as risk factors. In this study, both ex-VF and ex-NVF were included as risk factors for current MOFs. The other fractures in the MOFs, namely, proximal humerus and distal radius fractures, were determined from the medical record, and X-ray images were obtained and verified.
These patients, who underwent BMD assessment using DXA, SQ assessment using X-ray images, a 10-year fracture probability assessment using FRAX, and were continuously followed up over a 10-year period, are included in this study. Patients who dropped out for any reason without incident fractures, including hospitalization due to other severe comorbidities or censored death, were excluded. The date when the BMD measurement and X-ray were taken was set as the baseline.

2.2. Risk Factor Selection and Group Comparison

In addition to BMD measurement and X-ray evaluation, patients’ risk factors were collected from their medical records. Lifestyle choices such as current smoking and alcohol use, which might be linked to osteoporotic fractures, as well as so-called lifestyle-related diseases (LS-RDs), such as type 2 diabetes mellitus (DM), hypertension (HT), hyperlipidemia (HL), chronic heart failure (CHF), chronic obstructive pulmonary disease (COPD), chronic kidney dysfunction (CKD) ≥ Stage 3a (estimated glomerular filtration rate with serum creatinine level (eGFR) < 60 mL/min/1.73 m2), and insomnia, were identified. These conditions were grouped together as a single risk factor, LS-RDs.
Hyper fall-ability (Fall-ability) was also evaluated as a risk factor in patients diagnosed with musculoskeletal ambulation disability symptom complex (MADS), presence of osteoarthritis in the lower limb joints (OA), joint contracture in the trunk or lower limbs (Contracture), disuse syndrome (Disuse), Parkinsonism, and neuromuscular diseases (Parkinsonism).
Other information, such as the presence of cognitive impairment (CI), administration of anti-osteoporotic drugs at baseline (Drugs), administration of glucocorticoid steroids at baseline (GCS), rheumatoid arthritis (RA), and parental history of hip fracture (PH), was collected from medical records, and each was evaluated as a risk factor. The presence of type 1 DM, adult osteogenesis imperfecta, hyperthyroidism, sexual dysfunction, premature menopause, chronic malnutrition, malabsorption, and chronic liver diseases was also collected and considered as risk factors for secondary osteoporosis from medical records. When osteoporosis and the above diseases were presented in the medical record, secondary osteoporosis was diagnosed in the study. All of these diseases were diagnosed by an internal medicine specialist certified by the Japanese Society of Internal Medicine and an orthopedic specialist certified by the Japanese Orthopaedic Association.
Patients were divided into two groups based on the presence of MOF (MOF/non-MOF). The prevalence of risk factors was compared between the two groups using Student’s t-test.

2.3. Following Up

Patients were followed up, and incident osteoporotic fractures were recorded. Of these, only those who were followed for more than 10 years or who experienced a fracture during this period were included.
Our primary endpoint was the occurrence of incident MOFs as well as the time from baseline to the fracture. The risk ratios of the candidate risk factors included were assessed using Cox regression analysis, which evaluated items from the FRAX and significant variables identified in the group comparison study. Statistical evaluations began with each factor analyzed through a univariate model.

2.4. Fracture Probability Calculation with FRAX and Comparison with Actual Fracture Performance

The 10-year fracture risk for MOFs was estimated using FRAX (version 3, as of 2024) [41] in each of these patients. After calculating the average values, the 10-year probability was compared between the MOF and non-MOF groups.
The discrepancy between the 10-year probability estimated using FRAX and actual fracture prevalence was compared using a Mann–Whitney U-test. The discrepancies, categorized by age in 10-year increments, were also analyzed.
Patients were divided into four equal groups by number of patients based on the 10-year probability with FRAX (Q1, Q2, Q3, and Q4 in order of increasing probability), and their mean values were compared to the corresponding actual MOF rates.
The actual fracture prevalence was calculated from the crude dataset, with patients grouped by 10-year age increments and categorized by the presence of comorbidities such as LS-RD, Fall-ability, and CI, as well as the total number of these comorbidities (present = 1, absent = 0). Differences between these groups were assessed using Student’s t-test and a Kaplan–Meier survival analysis. Discrepancies between the number of comorbidities and the corresponding 10-year probability were examined.
Distribution and the MOF prevalence in subgroups divided into these two categories were evaluated using a Chi-square test.

2.5. Statistical Procedures and Software

All statistical analyses were performed using StatPlus® (AnalystSoft Inc., Walnut, CA, USA). Statistical significance was set at p < 0.05. The Student’s t-test was evaluated using a two-tailed model.

2.6. Ethical Considerations

The Ethics Committee of the Associated Institute approved the study protocol and patient consent requirements. The participants and their families were informed that the personal information obtained in this study was anonymous and would only be used for analysis.

3. Results

3.1. Patient Demographic Characteristics

A total of 1051 patients were enrolled in the study. Among these patients, 120 patients dropped out. As a result, a total of 931 patients were included in the study, with 203 in the MOF group and 728 in the non-MOF group. The mean follow-up periods were 34.8 months (Standard Deviation: 28.7) for the MOF group and 120 months for the non-MOF group, ranging from 0 to 120 months. Among these patients, 131 were male and 802 were female. Their mean age at baseline was 78.6 years, with a range of 54 to 93 years. The counts of ex-VF, ex-HF, ex-SF, ex-WF, and ex-MOF were 181, 31, 10, 11, and 223, respectively. The mean T-LS and T-FN scores were −2.29 and −2.05, respectively. The average body mass index (BMI) was 22.5. Current smoking habits and alcohol use were reported by 24 and 13 patients, respectively. The counts for type 2 DM, HT, HL, CHF, COPD, CKD, and insomnia were 202, 468, 247, 79, 358, 197, and 197, respectively. A total of 622 patients (66.9%) were classified with LS-RD. Counts for MADS, OA, Contracture, Disuse, and Parkinsonism were 197, 528, 91, 65, and 25, respectively. Fall-ability was present in a total of 617 patients (66.3%). CI was present in 146 patients. Patients with RA numbered 284. Patients with PH were zero; however, many patients experienced hearing impairment due to cognitive issues, which was also the reason for the zero count. Zero patients presented with secondary osteoporosis. Medication use was reported by 574 patients, and GCS counts were 168. Patients’ demographic characteristics at baseline are seen in Table 1. Female patients and patients who have many risk factors are the majority of participants. These participants represent a typical clinical-based patient population.

3.2. Group Comparison

The percentage of females presenting with rates of ex-VF, ex-MOF, HT, HL, CHF, insomnia, LS-RD, MADS, OA, Contracture, Disuse, Fall-ability, and CI was significantly higher in the MOF group than in the non-MOF group at baseline, and the estimated 10-year probability of MOF and HF using FRAX was also significantly higher in the MOF group than in the non-MOF group. Comparison between the two groups at baseline and the p-values are shown in Table 2.

3.3. Cox Regression Analysis in the Follow-Up Period

During the follow-up period, vertebral body fractures occurred in 112 patients (12.0%), hip fractures in 87 patients (9.3%), proximal humerus fractures in 12 patients (1.3%), and wrist fractures in 17 patients (1.8%). Incident MOF occurred in 203 patients (21.8%). That is relatively higher than the 10-year probability of MOF using FRAX. Figure 1 shows the Kaplan–Meier survival curve for incident MOFs.
Female gender, lower body weight and BMI, existing prevalent MOFs, VFs, lower T-score, the presence of HT, HL, CHF, insomnia, LS-RD, MADS, osteoarthritis, Contracture, Disuse, Fall-ability, and CI showed significantly higher risk ratios for incident MOF. Risk ratios in the variables in the follow-up period are shown in Table 3.

3.4. Comparison Between the 10-Year Probability with FRAX and the Actual Incidence of Fracture Performance

The average 10-year probability in the FRAX was 21.7% for MOFs and 10.1% for hip fractures, while the actual fracture prevalence was 21.8% (203) and 12.8% (119), respectively. The actual MOF rate was slightly higher than the 10-year probability of MOF estimated by FRAX, as was the case for hip fractures. There was a significant difference between the two (p < 0.001).
When patients were divided into 10-year increments of age groups, the corresponding actual MOF rates exceeded the FRAX 10-year probability until the 70s but decreased in the 80s, underperforming the 10-year probability (Figure 2).
When looking at the corresponding prevalence in each comorbidity, LS-RDs are relatively evenly distributed across age groups. Fall-ability increases with age, but not steeply. In contrast, CI increases sharply starting from the 60s (Figure 3).
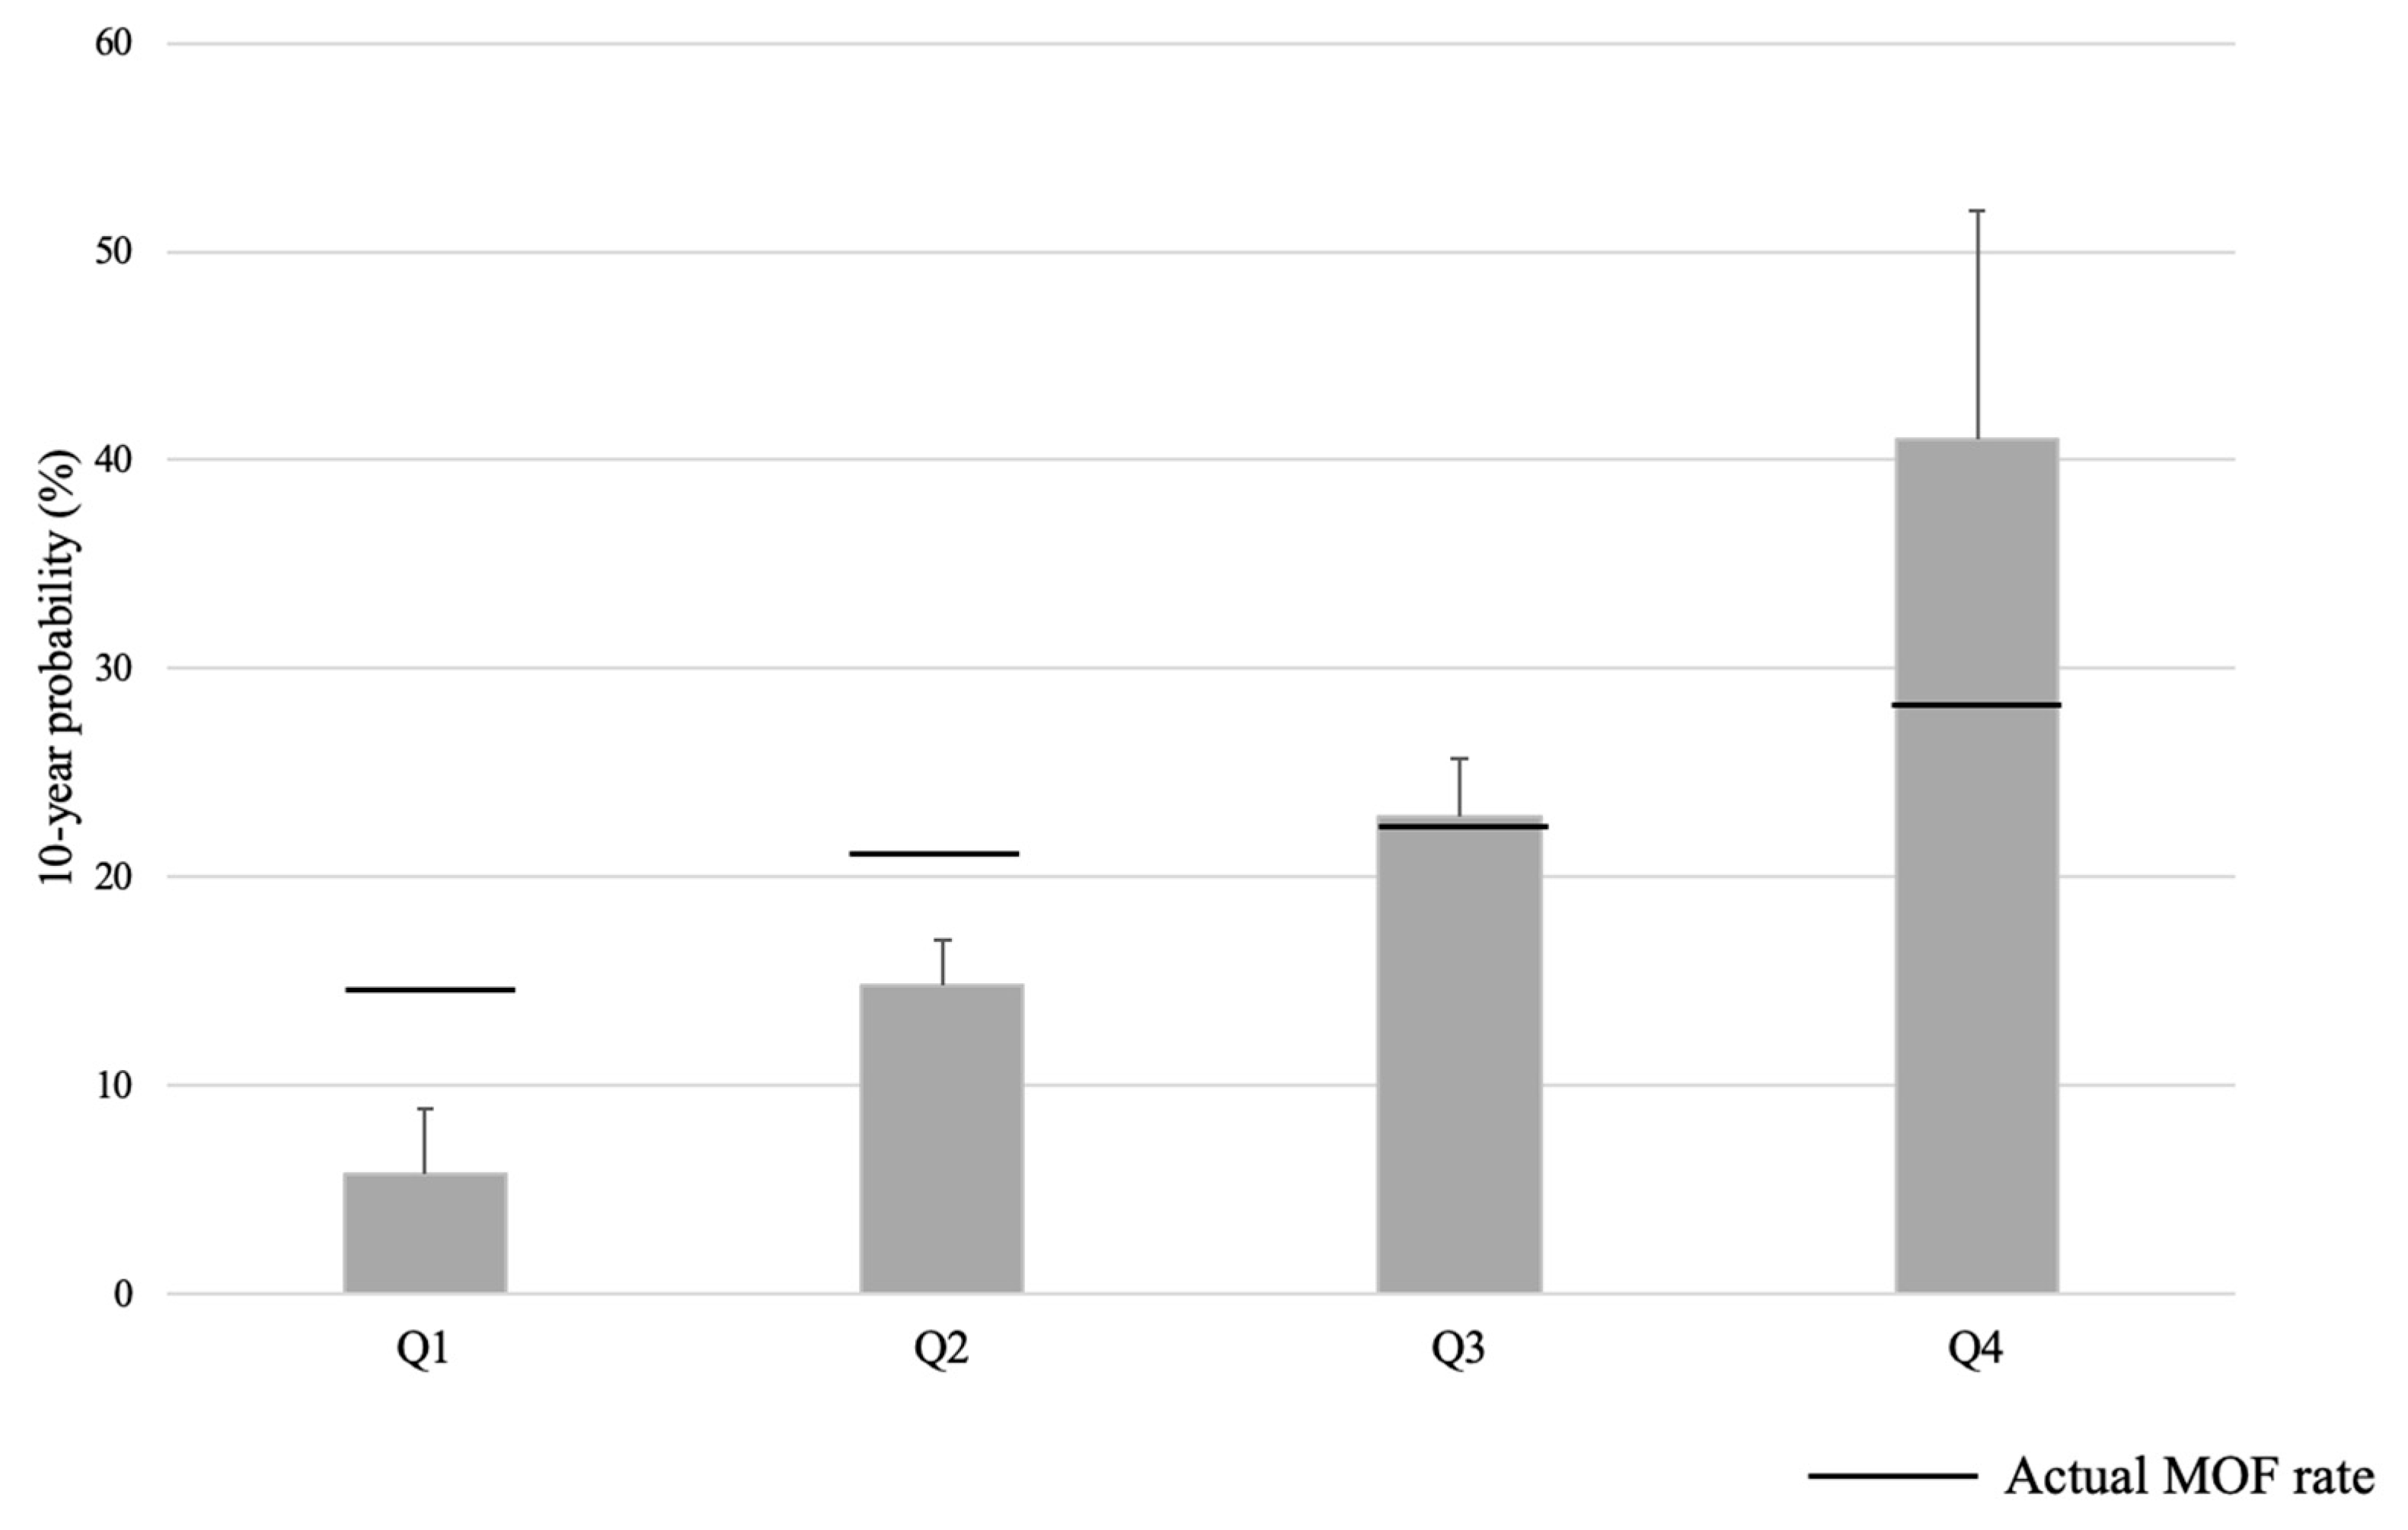
After dividing the patients by the 10-year probability, 229 were included in Q1, 251 in Q2, 217 in Q3, and 234 in Q4. The 10-year probability of MOF in each group ranged from 0 to 10% in Q1 (mean: 5.8%), 11 to 18% in Q2 (mean: 14.8%), 19 to 28% in Q3 (mean: 22.9%), and 29 to 91% in Q4 (mean: 41.0%). The actual MOF rates were 15.3% in Q1, 21.1% in Q2, 22.1% in Q3, and 28.6% in Q4. These values exceeded the 10-year probability in Q1 and Q2, whereas they were nearly equal in Q3 and lower in Q4 (Figure 4).
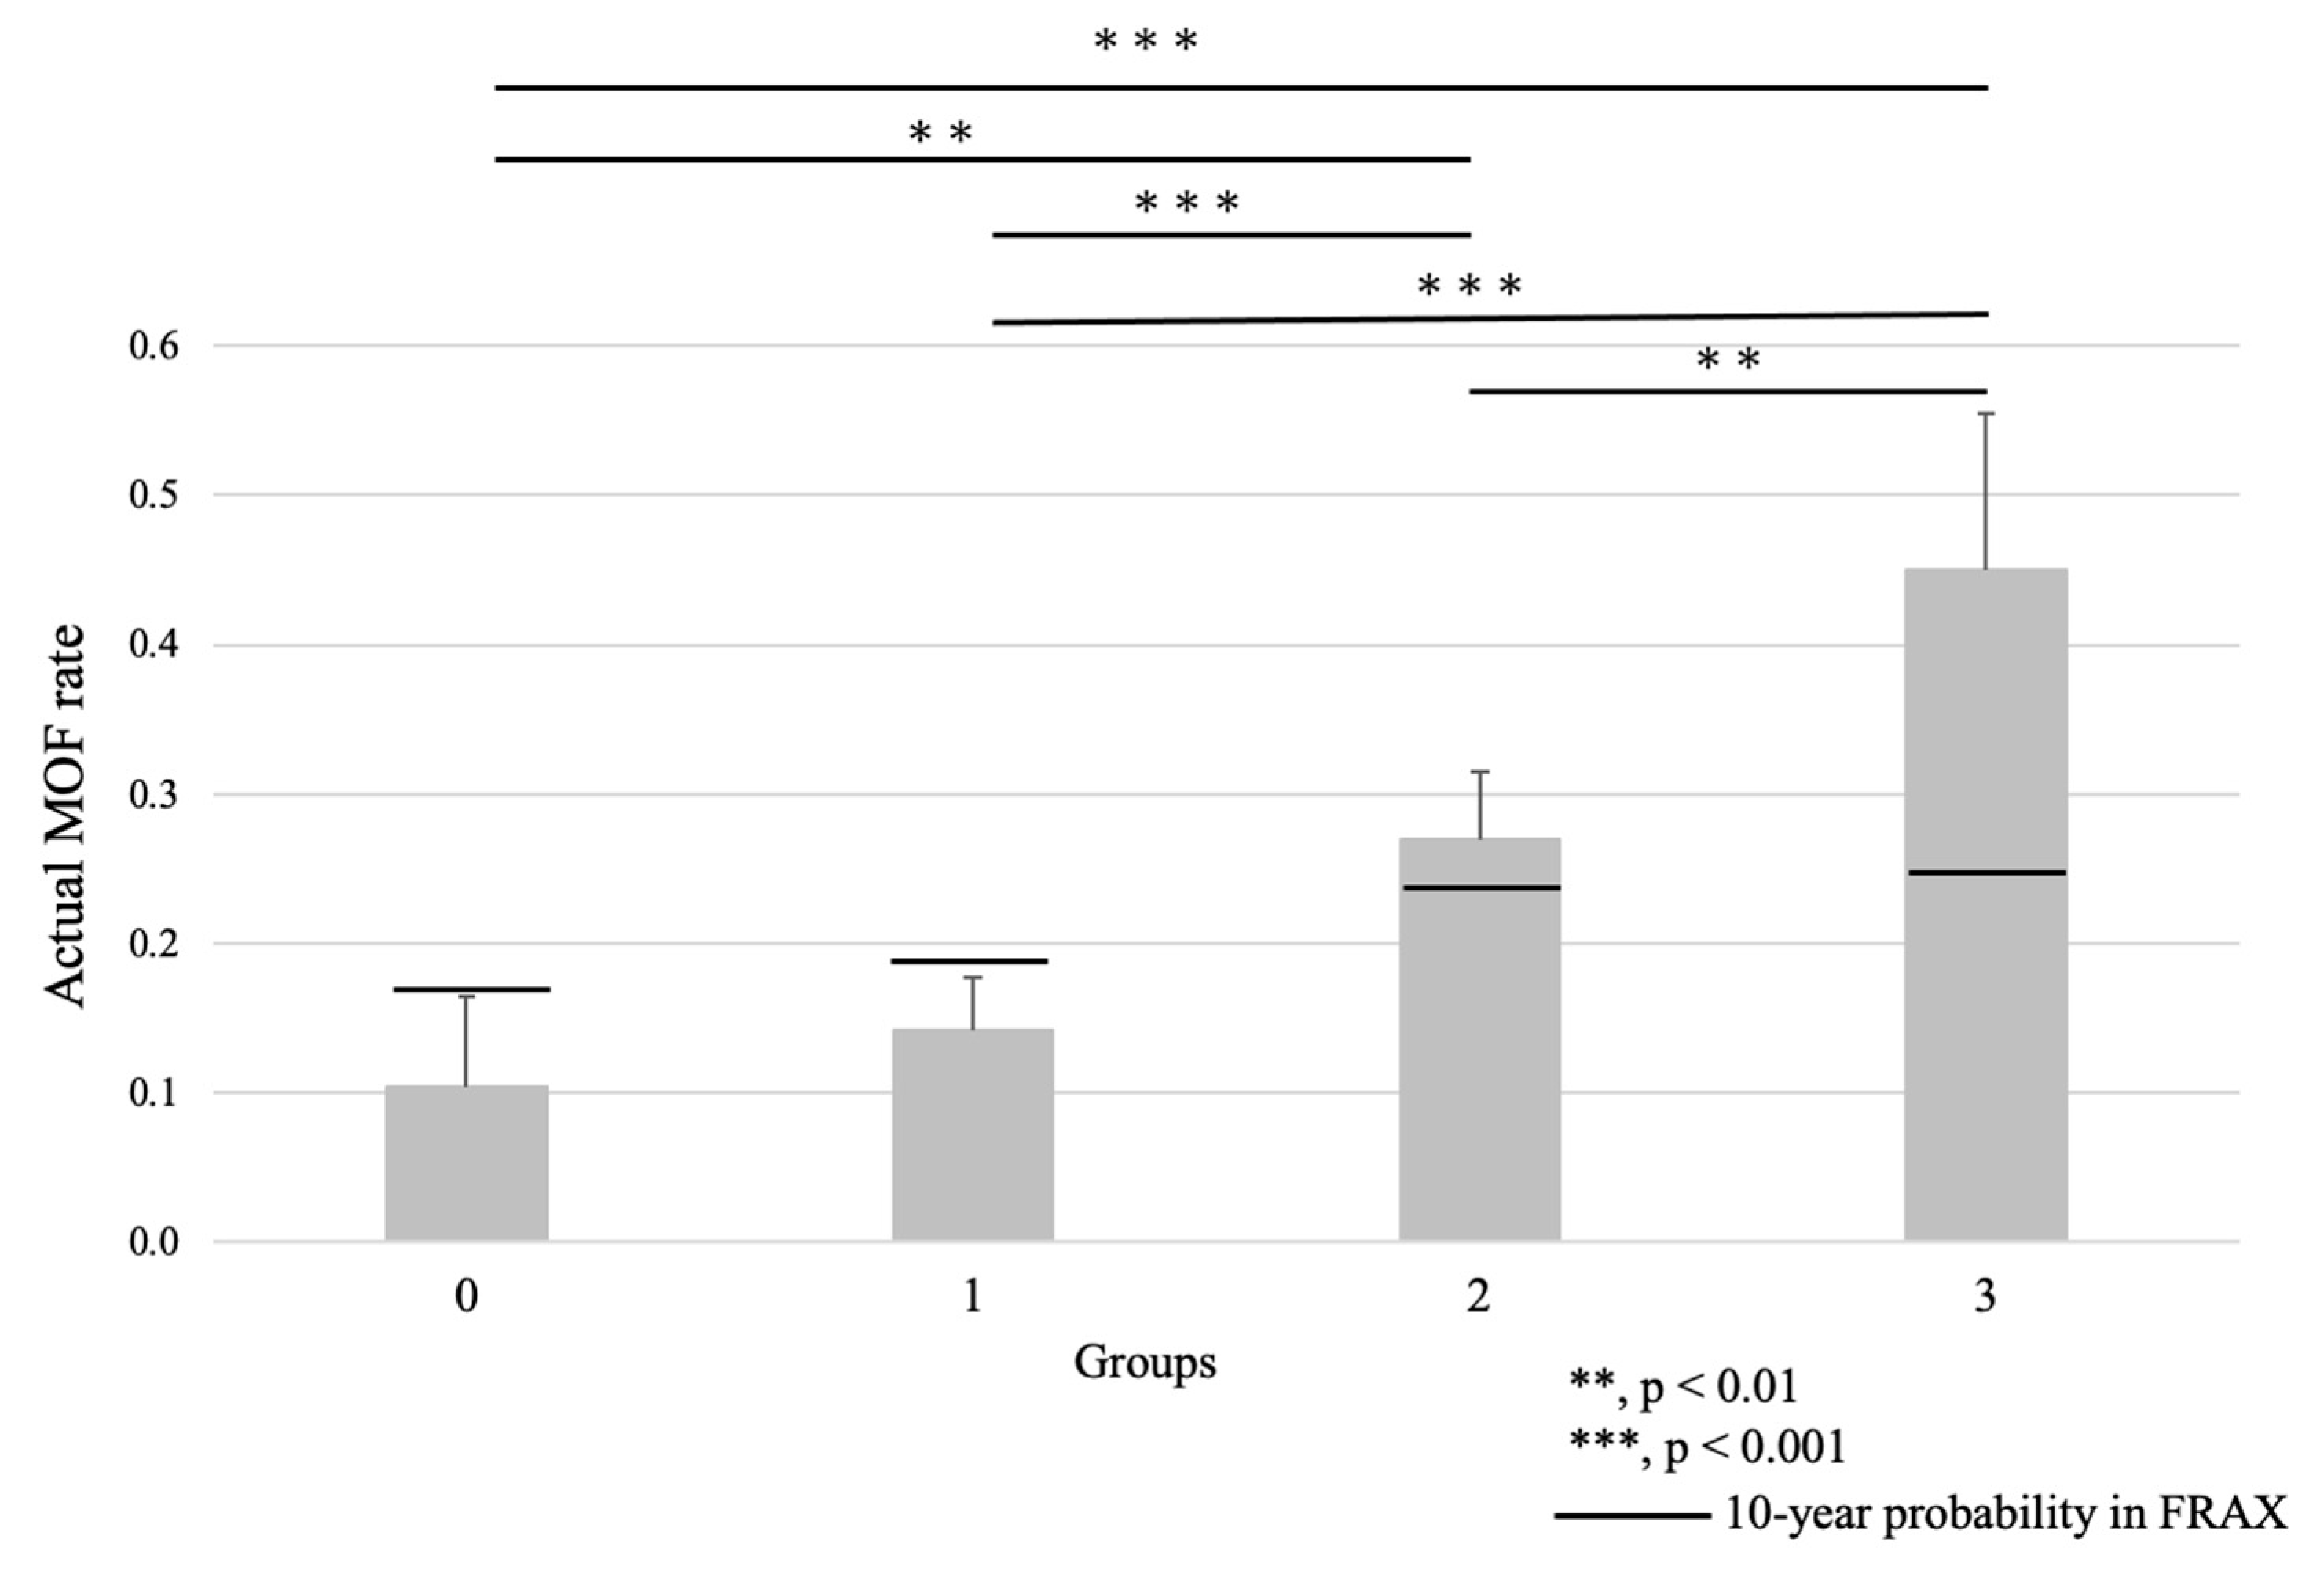
After categorizing by number of comorbidities, the actual MOF rates for Group 0 (nothing presented), Group 1 (one of LS-RD/Fall-ability/CI is present), Group 2 (two of LS-RD/Fall-ability/CI are present), and Group 3 (all LS-RD/Fall-ability/CI are present) were 10.3%, 14.1%, 26.9%, and 45.1%, respectively. There was no significant difference in MOF prevalence between Group 0 and Group 1; however, Group 0 had a significantly lower prevalence than Groups 2 and 3. Similarly, Group 1 had a significantly lower prevalence than Groups 2 and 3. The prevalence of MOF in Group 2 was significantly lower than in Group 3. The 10-year probability in Groups 0 and 1 surpassed the actual MOF rate. In contrast, for Groups 2 and 3, the 10-year probability was lower than the actual MOF rate, especially in Group 3, where the 10-year probability was about half of the actual rate (Figure 5).
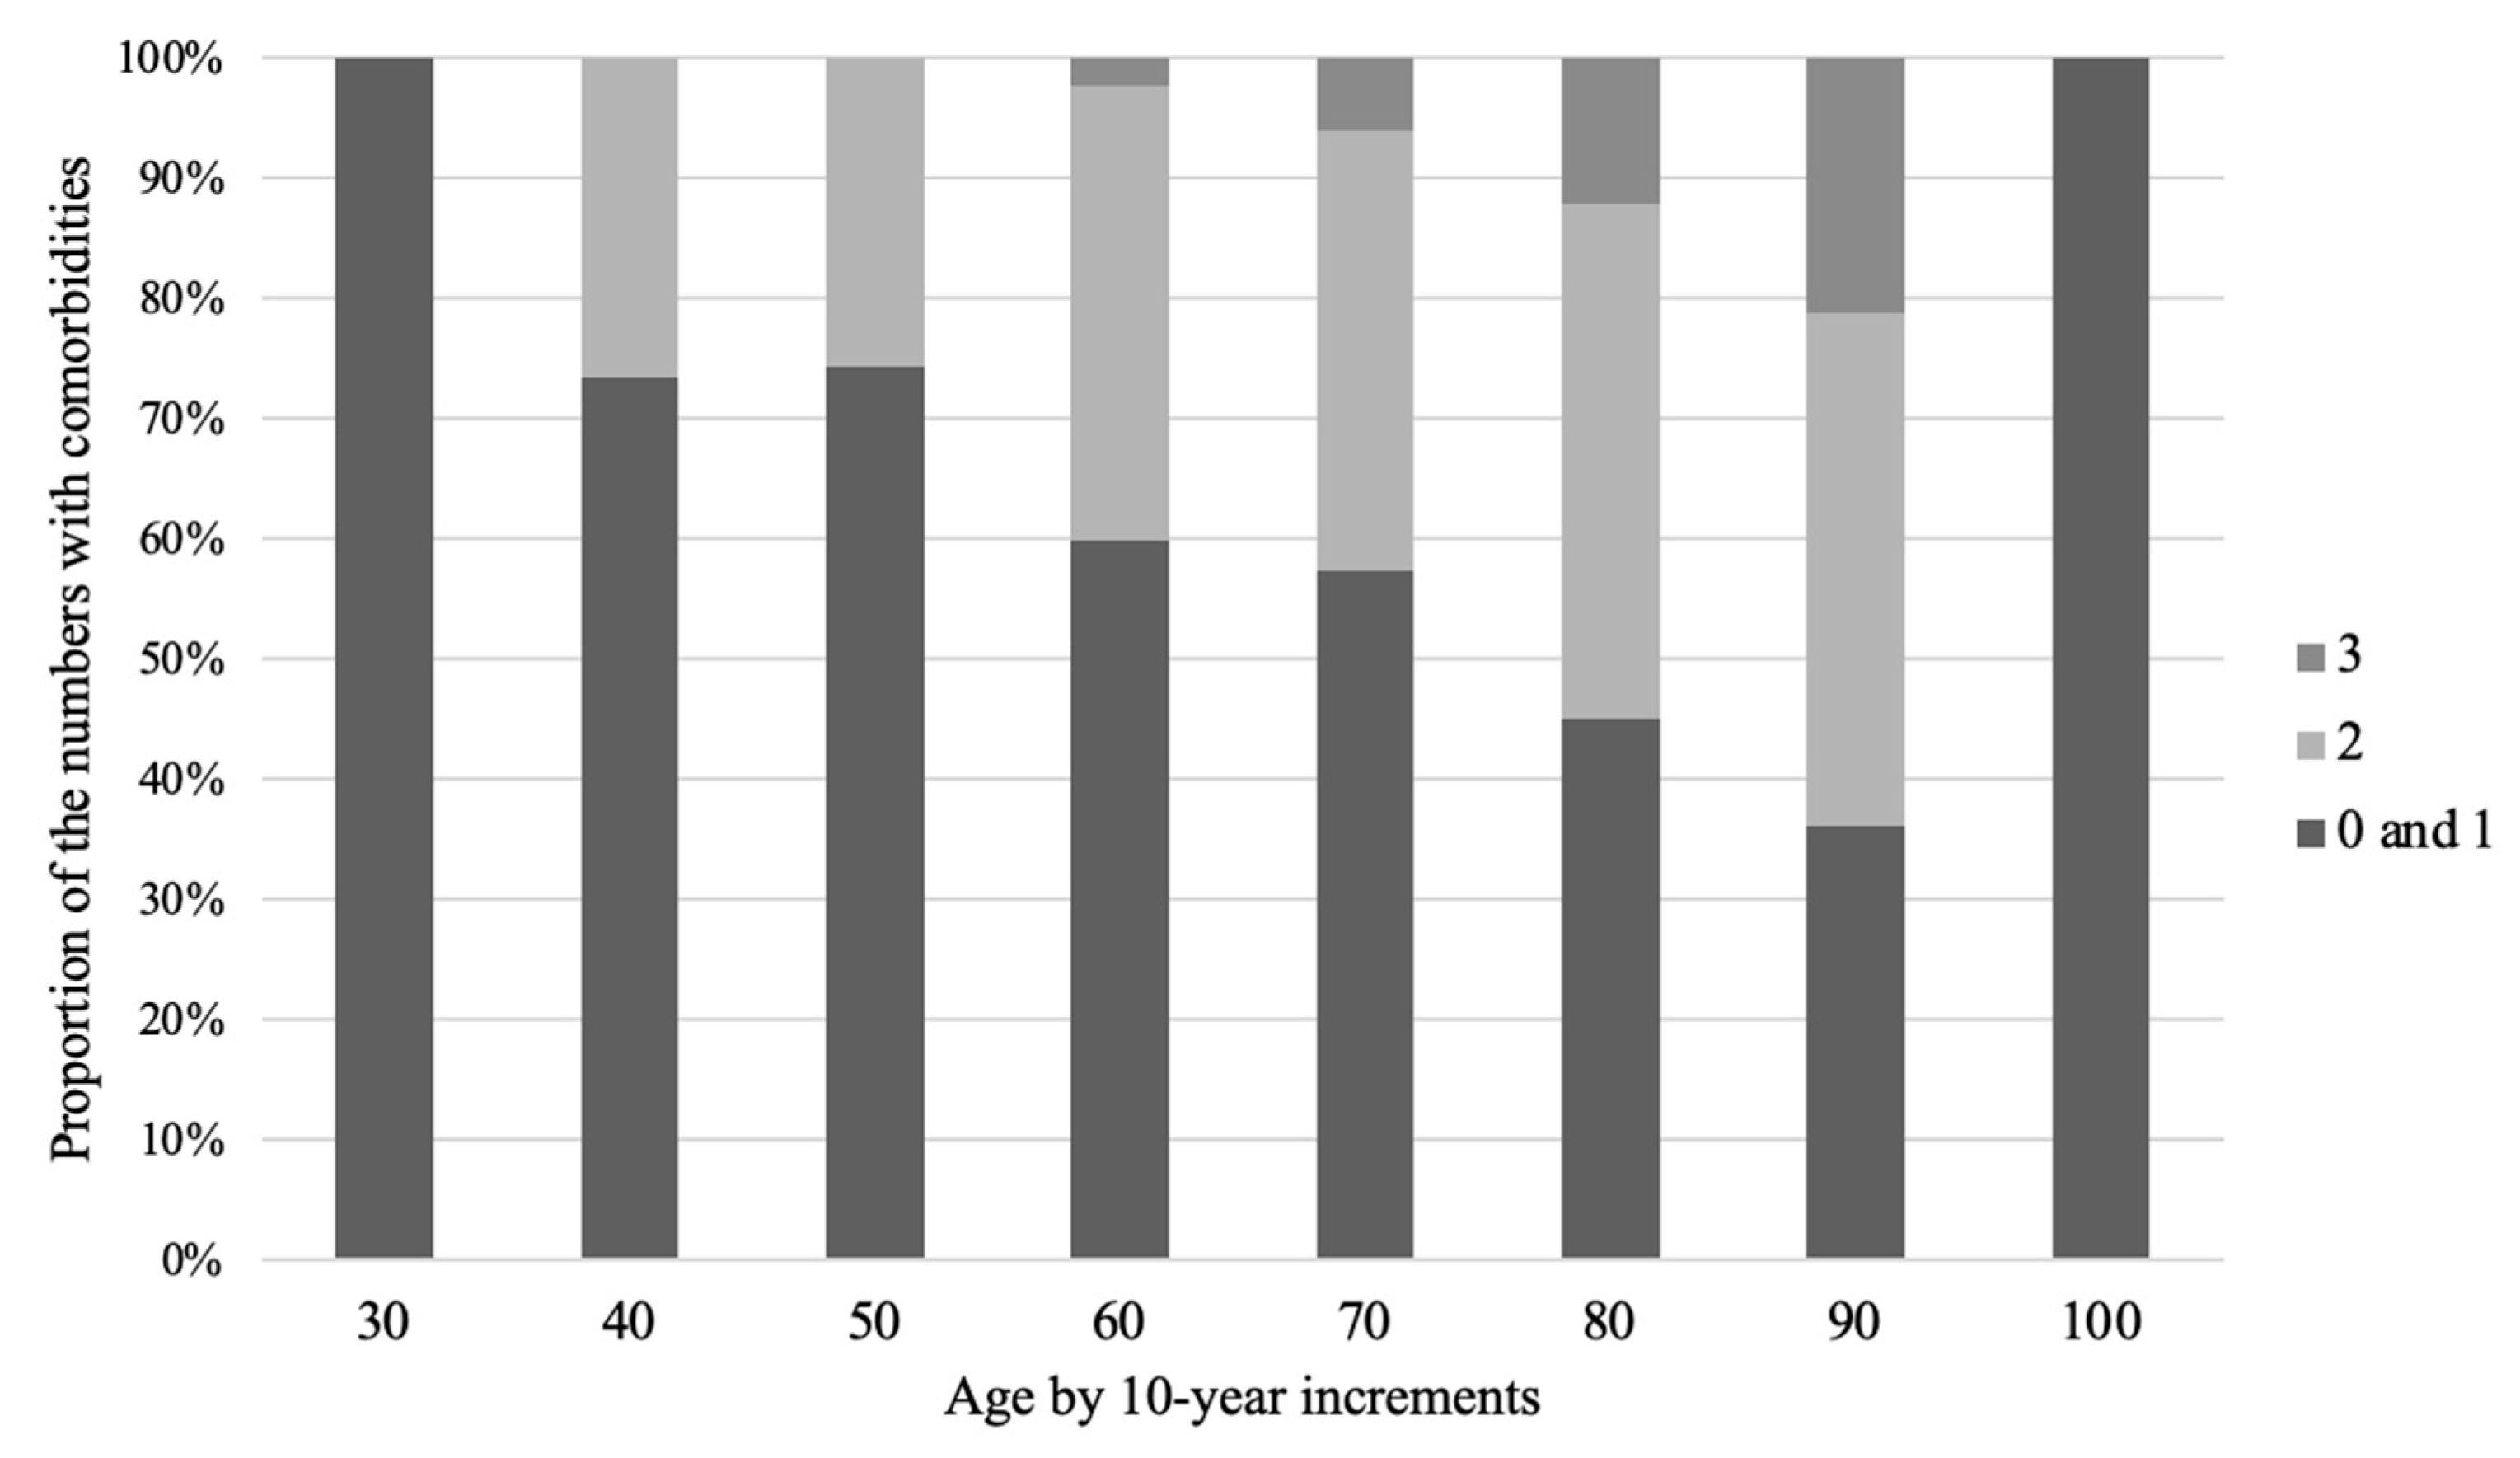
When examining the distribution of cases by age in 10-year intervals, the proportions in Groups 0 and 1 decrease as age increases, while Group 2 remains relatively stable across age groups, and Group 3 shows an increase as age progresses from the 60s (Figure 6).
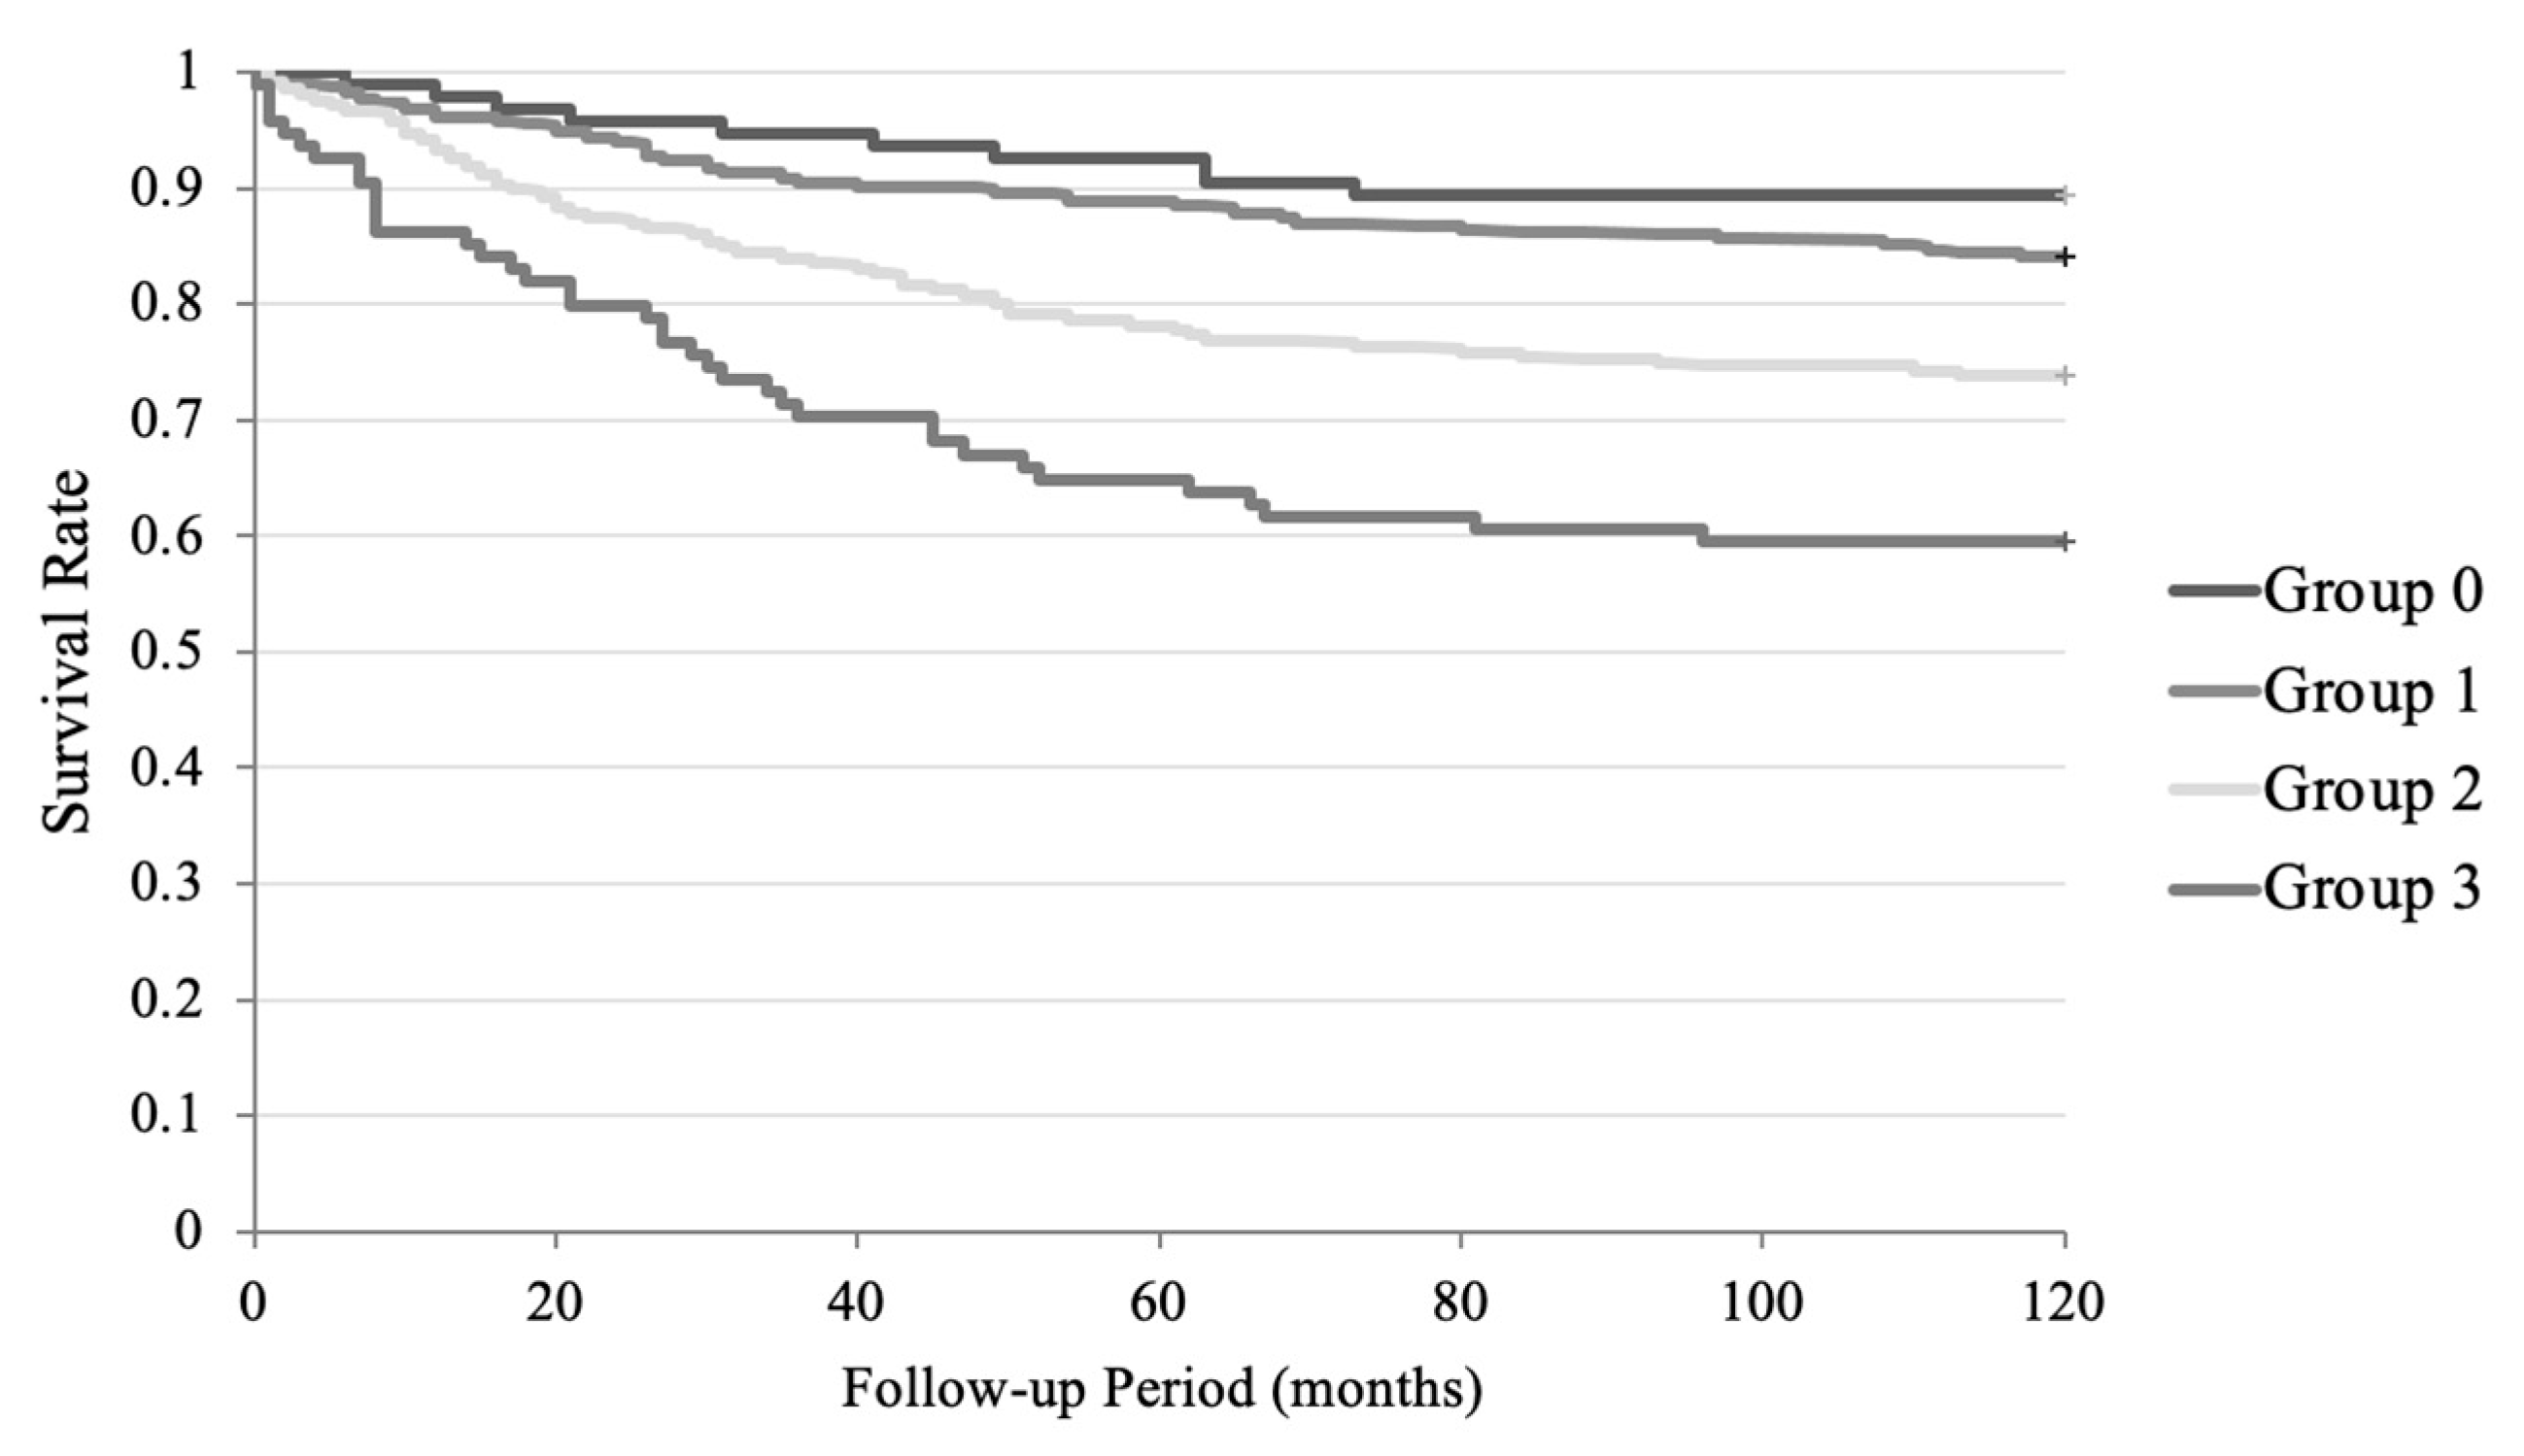
The Kaplan–Meier analysis showed that the hazard ratios in Group 2 and Group 3 compared to Group 0 were 2.88 (95% CI: 1.81~4.60) and 5.60 (95% CI: 2.98~10.56), respectively. When compared to Group 1, the hazard ratios were 2.06 (95% CI: 1.52~2.80) and 4.01 (95% CI: 2.37~6.78). The hazard ratio in Group 3 compared to Group 2 was 1.94 (95% CI: 1.14~3.30) (Figure 7).
Distribution within the subgroups, divided by the two categories, showed a stepwise increase in the MOF rate with the number of comorbidities from Q1 to Q3 (p < 0.001). In Q4, a stepwise increase is not observed; however, the highest rate appears in Group 3. Nonetheless, no stepwise increase is shown across Q1 to Q4, although a tendency for a stepwise increase is seen for Groups 2 and 3 from Q1 to Q3. Distributions are described in detail in Table 4.

4. Discussion

FRAX is a well-designed screening tool for osteoporotic fractures. The 10-year probabilities are calculated for each country based on statistical data specific to that country, due to significant regional differences in fracture risks. FRAX was launched in 2009 with eight countries, and it is now available in 34 languages and used in more than 64 countries [9]. Japanese medical practice has also used FRAX. Our study data were collected by calculating using the Japanese version of FRAX.
Some items in the questionnaire were unclear. For example, the parental history of hip fracture was zero, as the majority of patients did not recall it. We were thus unable to complete this item.
The actual rate of MOFs was similar to the 10-year probability rate provided by FRAX. The MOF incidence was approximately 21%, as indicated by the Kaplan–Meier survival curve shown in Figure 1. Since the actual MOF rate is binary data and the 10-year probability is continuous numerical data, the two parameters are fundamentally different; therefore, the significant difference observed in the Mann–Whitney U-test is reasonable. However, closer inspection revealed that, when patients were divided into 10-year interval age groups, those who are under 80 years old tended to have a higher actual MOF rate than the FRAX 10-year probability; conversely, for the groups older than 80 years, the actual MOF rate declined and was lower than the probability. This discrepancy likely results from a lack of assessment of LS-RDs, hyper fall-ability, and cognitive impairment, which interfere with bone metabolism, increase fracture risk, and elevate fall likelihood. These three comorbidities showed significantly higher prevalence in the MOF group compared to the non-MOF group, and groups with more of these comorbidities exhibited higher MOF prevalence. These findings agree that the presence of LS-RDs, Fall-ability, and CI may serve as high-risk factors for developing MOFs. At the same time, these results imply that these three risks are independent because the more of these risks present, the greater the increase in hazard ratio.
LS-RDs are evenly distributed across all age groups. The presence of LS-RD is a potential high-risk factor for osteoporotic fractures regardless of age. This even distribution may partly explain the MOF prevalence by age group, which has higher rates in the younger group, who are under 60 in age, and relatively lower rates in the older group when compared to the 10-year probability.
Fall-ability, indicated by MADS, joint contracture in the lower extremities, Disuse, and osteoarthritis in the lower extremity joints, is recognized as a significant risk factor for incident bone fragility fractures [42]. Fall-ability increases osteoporotic fracture risk mainly in patients with gait disturbances. These findings suggest that Fall-ability is more important in younger patients, particularly those under 60 with low risk, and that even low-risk patients should undergo tailored balance exercises or muscle training to help to prevent falls, as this could reduce the risk of fractures [43].
Fall-ability has been conceptually recognized as a risk factor for osteoporotic fractures, but it was hard to quantify [39] and was likely not considered by FRAX. In this study, OA, Contracture, Disuse, Parkinsonism, and MADS were viewed as possible risk factors. MADS is a disease concept introduced by the Japanese Orthopaedic Association in 2008, and it is diagnosed when 11 underlying diseases or medical histories align with biomedical test results that assess lower extremity muscle strength and gait ability. It was initially created to indicate an increased fall risk straightforwardly, and it is easy to speculate that MADS poses a risk for developing bone fragility fractures [44].
Cognitive impairment gradually increases with age. This pattern is also evident in the distribution of the number across the three comorbidities. Furthermore, the three groups experienced a significant increase in the actual rate of MOF. This suggests that cognitive impairment may contribute to the risk factors for incident MOF in the elderly [45].
The overall rate of actual MOFs was considered nearly equal to the 10-year probability. However, closer examination revealed that the actual MOF rate was higher in the low-probability groups, specifically Q1 and Q2, compared to the predicted probability based on FRAX. Conversely, it was lower in the Q4 group. As a result, the actual MOF rate in groups with fewer comorbidities, such as Groups 0 and 1, tended to be lower than the 10-year probability, while it was higher in Groups 2 and 3. These findings indicate that the 10-year probability calculated by FRAX often overestimates risk in low-risk groups and underestimates it in high-risk groups. This discrepancy likely results from the lack of risk weighting for comorbidities, particularly the failure to include comorbidities as risk factors. While such risk weights are likely incorporated into the formulas based on the list in the FRAX questionnaire, these risks are automatically included in age, as the 10-year probability increases with age. However, these risks regarding comorbidities are not calculated independently. Because these comorbidity risks vary among individuals, this leads to a mismatch between the computed probability and the actual MOF rate.
The study’s results indicated that the 10-year probability calculated using FRAX is underestimated in the low-risk group and overestimated in the high-risk group. This may be due to several factors not included in FRAX, such as LS-RD, Fall-ability, and anti-osteoporotic drug intervention. These factors are weighted more heavily than those listed in FRAX. Estimation mismatch has been noted in previous reports [46,47]. It is recommended that these items be incorporated into future versions of FRAX.
The limitations of the current study included its being a single-center study, the selection of a clinical-based population, and the absence of consideration of racial differences (the participants selected were Japanese), as well as having a relatively small sample size. However, even though the number of subjects was fewer than 1000, it was still possible to track the progress of over 900 individuals. Clarifying the importance and impact of different risk factors will be helpful for future mass screening and population-based research.

5. Conclusions

We conducted a comparison between the 10-year probability of MOF calculated with FRAX and the actual MOF prevalence in a Japanese real-world practice dataset. The prevalence was 203/931 = 21.8%, whereas the 10-year probability was 21.7%. These are very similar overall, but, when the real-world population was divided into subgroups based on age and comorbidities, discrepancies between the probability and actual prevalence appeared. The 10-year risk estimated with FRAX tends to be overestimated in patients without lifestyle-related diseases, fall risks, and cognitive impairment. Conversely, it is underestimated in patients with these comorbidities. These issues stem from the model’s failure to account for increased risks associated with lifestyle-related diseases, fall risk, and cognitive impairment, as well as neglecting the protective effects of anti-osteoporotic drugs.

Author Contributions

Conceptualization, I.Y.; Methodology, I.Y. and N.S.; Software, I.Y.; Validation, I.Y., T.C. and N.S.; Formal Analysis, I.Y.; Investigation, I.Y.; Resources, I.Y., T.C. and N.S.; Data Curation, I.Y.; Writing—Original Draft Preparation, I.Y.; Writing—Review & Editing, I.Y., T.C. and N.S.; Visualization, I.Y.; Supervision, T.C. and N.S.; Project Administration, I.Y.; Funding Acquisition, none. All authors have read and agreed to the published version of the manuscript.

Funding

This research did not receive any specific grant from funding agencies in the public, commercial, or not-for-profit sectors.

Institutional Review Board Statement

The study was conducted according to the guidelines of the Declaration of Helsinki, and approved by the Institutional Review Board (or Ethics Committee) of the Yoshii Hospital ethics committee (approval number: G-2023-3, approved on 14 October 2023).

Informed Consent Statement

Informed consent was obtained from all subjects involved in the study. Anonymity was ensured for all patients and families who participated in this study, and no names and/or addresses were issued that could help to identify these individuals.

Data Availability Statement

The datasets used and/or analyzed during the current study are available from the corresponding authors upon reasonable request.

Acknowledgments

The authors would like to thank Kaoru Kuwabara, Sayori Masuoka, Eri Morichika, and Aoi Yoshida for their dedicated data collection. No AI or AI-assisted configuration in writing was used in this manuscript.

Conflicts of Interest

The authors declare no conflicts of interest for this study.

References

  1. Curtis, E.M.; Moon, R.J.; Harvey, N.C.; Cooper, C. The impact of fragility fracture and approaches to osteoporosis risk assessment worldwide. Bone 2017, 104, 29–38. [Google Scholar] [CrossRef]
  2. Hernlund, E.; Svedbom, A.; Ivergård, M.; Compston, J.; Cooper, C.; Stenmark, J.; McCloskey, E.V.; Jönsson, B.; Kanis, J.A. Osteoporosis in the European Union: Medical management, epidemiology and economic burden. A report prepared in collaboration with the International Osteoporosis Foundation (IOF) and the European Federation of Pharmaceutical Industry Associations (EFPIA). Arch. Osteoporos. 2013, 8, 136. [Google Scholar] [CrossRef] [PubMed]
  3. Ballane, G.; Cauley, J.A.; Luckey, M.M.; El-Hajj Fuleihan, G. Worldwide prevalence and incidence of osteoporotic vertebral fractures. Osteoporos. Int. 2017, 28, 1531–1542. [Google Scholar] [CrossRef]
  4. Tamaki, J.; Fujimori, K.; Ikehara, S.; Kamiya, K.; Nakatoh, S.; Okimoto, N.; Ogawa, S.; Ishii, S.; Iki, M.; Working Group of Japan Osteoporosis Foundation. Estimates of hip fracture incidence in Japan using the National Health Insurance Claim Database in 2012–2015. Osteoporos. Int. 2019, 30, 975–983. [Google Scholar] [CrossRef]
  5. Tsukutani, Y.; Hagino, H.; Ito, Y.; Nagashima, H. Epidemiology of fragility fractures in Sakaiminato, Japan: Incidence, secular trends, and prognosis. Osteoporos. Int. 2015, 26, 2249–2255. [Google Scholar] [CrossRef]
  6. Iihara, N.; Ohara, E.; Bando, Y.; Yoshida, T.; Ohara, M.; Kirino, Y. Fragility Fractures in Older People in Japan Based on the National Health Insurance Claims Database. Biol. Pharm. Bull. 2019, 42, 778–785. [Google Scholar] [CrossRef]
  7. Hagino, H. Locomotive Syndrome and Osteoporosis—Importance of Bone Stroke Prevention—The Bone. 2017. Available online: https://www.jstage.jst.go.jp/article/jjrmc/58/1/58_58.59/_pdf (accessed on 10 January 2021).
  8. Kanis, J.A.; Oden, A.; Johansson, H.; Borgström, F.; Ström, O.; McCloskey, E. FRAX and its applications to clinical practice. Bone 2009, 44, 734–743. [Google Scholar] [CrossRef] [PubMed]
  9. Kanis, J.A.; Johansson, H.; Harvey, N.C.; McCloskey, E.V. A brief history of FRAX. Arch. Osteoporos. 2018, 13, 118. [Google Scholar] [CrossRef] [PubMed]
  10. De Laet, C.; Kanis, J.A.; Odén, A.; Johanson, H.; Johnell, O.; Delmas, P.; Eisman, J.A.; Kroger, H.; Fujiwara, S.; Garnero, P.; et al. Body mass index as a predictor of fracture risk: A meta-analysis. Osteoporos. Int. 2005, 16, 1330–1338. [Google Scholar] [CrossRef]
  11. Johnell, O.; Kanis, J.A.; Oden, A.; Johansson, H.; De Laet, C.; Delmas, P.; Eisman, J.A.; Fujiwara, S.; Kroger, H.; Mellstrom, D.; et al. Predictive value of BMD for hip and other fractures. J. Bone Miner. Res. 2005, 20, 1185–1194. [Google Scholar] [CrossRef]
  12. Kanis, J.A.; Johnell, O.; Oden, A.; Johansson, H.; De Laet, C.; Eisman, J.A.; Fujiwara, S.; Kroger, H.; McCloskey, E.V.; Mellstrom, D.; et al. Smoking and fracture risk: A meta-analysis. Osteoporos. Int. 2005, 16, 155–162. [Google Scholar] [CrossRef] [PubMed]
  13. Kanis, J.A.; Johansson, H.; Johnell, O.; Oden, A.; De Laet, C.; Eisman, J.A.; Pols, H.; Tenenhouse, A. Alcohol intake as a risk factor for fracture. Osteoporos. Int. 2005, 16, 737–742. [Google Scholar] [CrossRef] [PubMed]
  14. Kanis, J.A.; Johansson, H.; Oden, A.; Johnell, O.; de Laet, C.; Melton, L.J., III; Tenenhouse, A.; Reeve, J.; Silman, A.J.; Pols, H.A.; et al. A meta-analysis of prior corticosteroid use and fracture risk. J. Bone Miner. Res. 2004, 19, 893–899. [Google Scholar] [CrossRef]
  15. Kanis, J.A.; Johnell, O.; De Laet, C.; Johansson, H.; Oden, A.; Delmas, P.; Eisman, J.; Fujiwara, S.; Garnero, P.; Kroger, H.; et al. A meta-analysis of previous fracture and subsequent fracture risk. Bone 2004, 35, 375–382. [Google Scholar] [CrossRef]
  16. Kanis, J.A.; Johansson, H.; Oden, A.; Johnell, O.; De Laet, C.; Eisman, J.A.; McCloskey, E.V.; Mellstrom, D.; Melton, L.J., 3rd; Pols, H.A.; et al. A family history of fracture and fracture risk: A meta-analysis. Bone 2004, 35, 1029–1037. [Google Scholar] [CrossRef] [PubMed]
  17. Clinical Indications for Bone Mass Measurements. A report from the Scientific Advisory Board of the National Osteoporosis Foundation. J. Bone Miner. Res. 1989, 4 (Suppl. 2), 1–28. [Google Scholar] [CrossRef]
  18. Kanis, J.A.; Melton, L.J., 3rd; Christiansen, C.; Johnston, C.C.; Khaltaev, N. The diagnosis of osteoporosis. J. Bone Miner. Res. 1994, 9, 1137–1141. [Google Scholar] [CrossRef]
  19. Sugimoto, T.; Sato, M.; Dehle, F.C.; Brnabic, A.J.; Weston, A.; Burge, R. Lifestyle-Related Metabolic Disorders, Osteoporosis, and Fracture Risk in Asia: A Systematic Review. Value Health Reg. Issues 2016, 9, 49–56. [Google Scholar] [CrossRef]
  20. Pouresmaeili, F.; Kamalidehghan, B.; Kamarehei, M.; Goh, Y.M. A comprehensive overview on osteoporosis and its risk factors. Ther. Clin. Risk Manag. 2018, 14, 2029–2049. [Google Scholar] [CrossRef]
  21. Han, D.; Fan, Z.; Chen, Y.S.; Xue, Z.; Yang, Z.; Liu, D.; Zhou, R.; Yuan, H. Retrospective study: Risk assessment model for osteoporosis-a detailed exploration involving 4,552 Shanghai dwellers. PeerJ 2023, 11, e16017. [Google Scholar] [CrossRef]
  22. Hofbauer, L.C.; Brueck, C.C.; Singh, S.K.; Dobnig, H. Osteoporosis in patients with diabetes mellitus. J. Bone Miner. Res. 2007, 22, 1317–1328. [Google Scholar] [CrossRef]
  23. de Paula, F.J.A.; Horowitz, M.C.; Rosen, C.J. Novel insights into the relationship between diabetes and osteoporosis. Diabetes Metab. Res. Rev. 2010, 26, 622–630. [Google Scholar] [CrossRef] [PubMed]
  24. Kurra, S.; Siris, E. Diabetes and bone health: The relationship between diabetes and osteoporosis-associated fractures. Diabetes Metab. Res. Rev. 2011, 27, 430–435. [Google Scholar] [CrossRef]
  25. Biskobing, D.M. COPD and osteoporosis. Chest 2002, 121, 609–620. [Google Scholar] [CrossRef]
  26. Graat-Verboom, L.; Wouters, E.F.M.; Smeenk, F.W.J.M.; van den Borne, B.E.E.M.; Lunde, R.; Spruit, M.A. Current status of research on osteoporosis in COPD: A systematic review. Eur. Respir. J. 2009, 34, 209. [Google Scholar] [CrossRef]
  27. Inoue, D.; Watanabe, R.; Okazaki, R. COPD and osteoporosis: Links, risks, and treatment challenges. Int. J. Chronic Obstr. Pulm. Dis. 2016, 29, 637–648. [Google Scholar] [CrossRef] [PubMed]
  28. Kim, S.M.; Long, J.; Montez-Rath, M.; Leonard, M.; Chertow, G.M. Hip fracture in patients with non-dialysis-requiring chronic kidney disease. J. Bone Miner. Res. 2016, 31, 1803–1809. [Google Scholar] [CrossRef] [PubMed]
  29. Khairallah, P.; Nickolas, T.L. Management of Osteoporosis in CKD. Clin. J. Am. Soc. Nephrol. 2018, 13, 962–969. [Google Scholar] [CrossRef]
  30. Schwartz, A.V.; Vittinghoff, E.; Bauer, D.C.; Hillier, T.A.; Strotmeyer, E.S.; Ensrud, K.E.; Donadson, M.G.; Cauley, J.A.; Harris, T.B.; Koster, A.K.; et al. Association of BMD and FRAX score with risk of fracture in older adults with type 2 diabetes. JAMA 2011, 305, 2184–2192. [Google Scholar] [CrossRef]
  31. Szulc, P. Vascular calcification and fracture risk. Clin. Cases Miner. Bone Metab. 2015, 12, 139–141. [Google Scholar] [CrossRef]
  32. Szulc, P. Abdominal aortic calcification: A reappraisal of epidemiological and pathophysiological data. Bone 2016, 84, 25–37. [Google Scholar] [CrossRef] [PubMed]
  33. Lewis, J.R.; Eggermont, C.J.; Schousboe, J.T.; Lim, W.H.; Wong, G.; Khoo, B.; Sim, M.; Yu, M.X.; Ueland, T.; Bollersley, J.; et al. Association between abdominal aortic calcification, bone mineral density, and fracture in older women. J. Bone Miner. Res. 2019, 34, 2052–2060. [Google Scholar] [CrossRef]
  34. Saito, M.; Marumo, K. Collagen cross-links as a determinant of bone quality: A possible explanation for bone fragility in aging, osteoporosis, and diabetes mellitus. Osteoporos. Int. 2010, 21, 195–214. [Google Scholar] [CrossRef]
  35. Saito, M.; Marumo, K. Effecs of collagen crosslinking on bone material properties in health and disease. Calcif. Tissue Int. 2015, 97, 242–261. [Google Scholar] [CrossRef] [PubMed]
  36. Ishibashi, H. Fall risk and fracture. Locomotive syndrome and fall. Clin. Calcium 2013, 23, 669–677. (In Japanese) [Google Scholar]
  37. Kerschan-Schindl, K. Prevention and rehabilitation of osteoporosis. Wien. Med. Wochenschr. 2016, 166, 22–27. [Google Scholar] [CrossRef]
  38. Nilsson, M.; Eriksson, J.; Larsson, B.; Odén, A.; Johansson, H.; Lorentzon, M. Fall Risk Assessment Predicts Fall-Related Injury, Hip Fracture, and Head Injury in Older Adults. J. Am. Geriatr. Soc. 2016, 64, 2242–2250. [Google Scholar] [CrossRef]
  39. Vottis, C.T.; Mitsiokapa, E.; Igoumenou, V.G.; Megaloikonomos, P.D.; Galanopoulos, I.P.; Georgoudis, G.; KouLouvaris, P.; Papagelopoulos, P.J.; Mavrojenis, A.F. Fall Risk Assessment Metrics for Elderly Patients With Hip Fractures. Orthopedics 2018, 41, 142–156. [Google Scholar] [CrossRef] [PubMed]
  40. Genant, H.K.; Jergas, M.; Palermo, L.; Nevitt, M.; Valentin, R.S.; Black, D.; Cummings, S.R. Comparison of semiquantitative visual and quantitative morphometric assessment of prevalent and incident vertebral fractures in osteoporosis The Study of Osteoporotic Fractures Research Group. J. Bone Miner. Res. 1996, 11, 984–996. [Google Scholar] [CrossRef]
  41. FRAX® Fracture Risk Assessment Tool. 2008. Available online: https://www.sheffield.ac.uk/FRAX/tool.aspx?lang=jp (accessed on 5 May 2021).
  42. Yoshii, I.; Chijiwa, T.; Sawada, N.; Kokei, S. Musculoskeletal ambulation disability symptom complex as a risk factor of incident bone fragility fracture. Osteoporos. Sarcopenia 2021, 7, 115–120. [Google Scholar] [CrossRef]
  43. Kumar, S.; Smith, C.; Clifton-Bligh, R.J.; Beck, B.R.; Girgis, C.M. Exercise for Postmenopausal Bone Health—Can We Raise the Bar? Curr. Osteoporos. Rep. 2025, 23, 20. [Google Scholar] [CrossRef]
  44. Ito, H. Diagnosis of musculoskeletal ambulation disability symptom complex (MADS). Clin. Calcium 2008, 18, 1560–1565. (In Japanese) [Google Scholar] [PubMed]
  45. Shrestha, P.; Basida, B.; Elam, R.E.; Hajj, J.E.; Le, B.; Fink, H.A.; Bethel, M.; Tharrington, S.G.; Carbone, L.D. Disparities in the Diagnosis and Treatment of Osteoporosis in Persons with Cognitive Impairment and Dementia. Curr. Osteoporos. Rep. 2025, 23, 31. [Google Scholar] [CrossRef] [PubMed]
  46. Ensrud, K.E.; Schousboe, J.T.; Crandall, C.J.; Leslie, W.D.; Fink, H.A.; Cawthon, P.M.; Kado, D.M.; Lane, N.E.; Caulley, J.A.; Langsetmo, L. Hip Fracture Risk Assessment Tools for Adults Aged 80 Years and Older. JAMA Netw. Open 2024, 7, e2418612. [Google Scholar] [CrossRef] [PubMed]
  47. Jain, R.K.; Liu, J.Y.; Grant, R.W.; Haider, S.; Huang, E.S.; Laiteerapong, N.; Lipska, K.J.; Lo, J.C.; Moffet, H.H.; Parker, M.M.; et al. Biases in the performance of FRAX without BMD in predicting fracture risk in a multiethnic population with diabetes: The Diabetes and Aging Study. J. Bone Miner. Res. 2025, 40, 478–491. [Google Scholar] [CrossRef]
Figure 1. Kaplan–Meier survival curve of MOF in the follow-up period. The time-adjusted survival rate at 120 months was 21.8%.
Osteology 05 00028 g001
Figure 2. Ten-year probability of MOF by FRAX for each age class divided by 10-year intervals. Black bars represent the actual MOF rate in the corresponding group.
Osteology 05 00028 g002
Figure 3. Prevalence of comorbidities, such as LS-RDs, Fall-ability, and cognitive impairment for each age class divided by 10-year intervals.
Osteology 05 00028 g003
Figure 4. Ten-year probability of MOF calculated by FRAX for quarterly evenly divided groups. Black bars represent the actual MOF rate in the corresponding group.
Osteology 05 00028 g004
Figure 5. The actual MOF rate for the patient groups, which are divided by the number of comorbidities, such as LS-RDs, Fall-ability, and cognitive impairment. Black bars represent the 10-year probability of MOF calculated by FRAX in the corresponding group.
Osteology 05 00028 g005
Figure 6. Distribution of patients who are divided by the number of comorbidities, such as LS-RD, Fall-ability, and cognitive impairment, for each age class divided by a 10-year increment.
Osteology 05 00028 g006
Figure 7. Survival curve graph calculated with a Kaplan–Meier survival analysis for the patient group, which is divided by the number of comorbidities, such as LS-RD, Fall-ability, and cognitive impairment.
Osteology 05 00028 g007
Table 1. Patients’ demographic characteristics at baseline.
Cases931
sex (male:female, female%)131:802, 86.1%
age (mean, S.D.)
(30s, 40s, 50s, 60s, 70s, 80s, ≥90s,)
78.6, 10.7 (1, 15, 35, 124, 246, 387, 123)
follow-up period (mean, S.D.)49.1, 25.8
existing VF181 (19.4%)
existing HF31 (3.3%)
existing SF10 (1.1%)
existing WF11 (1.2%)
existing MOF223 (24.0%)
Tscore_LS (mean, S.D.)−2.29, 1.69
Tscore_FN (mean, S.D.)−2.05, 1.16
BMI22.5, 3.9
current smoking habit24 (2.7%)
alcohol habit13 (1.5%)
type 2 DM202 (21.7%)
hypertension468 (50.3%)
hyperlipidemia247 (26.5%)
chronic heart failure209 (22.4%)
COPD79 (8.5%)
CKD ≥ Stage 3a358 (38.5%)
insomnia197 (21.2%)
lifestyle-related diseases622 (66.9%)
MADS197 (21.2%)
osteoarthritis528 (56.7%)
contracture91 (9.8%)
Disuse65 (7.0%)
Parkinsonism25 (2.7%)
Fall-ability617 (66.3%)
cognitive disorder146 (15.7%)
RA284 (30.5%)
parental history of hip fracture0 (0%)
secondary osteoporosis0 (0%)
anti-osteoporotic drug administration574 (61.7%)
GCS administration168 (18.0%)
vitamin-D supplementation547 (58.8%)
Abbreviations: S.D., standard deviation; VF, vertebral body fracture; HF, hip fracture; SF, proximal humerus fracture; WF, wrist fracture; MOF, major osteoporotic fracture; LS, lumbar spine; FN, femoral neck; BMI, body mass index; DM, diabetes mellitus; COPD, chronic obstructive pulmonary diseases; CKD, chronic kidney disorder; MADS, musculoskeletal ambulation disability symptom complex; Fall-ability, hyper fall-ability; RA, rheumatoid arthritis; GCS, glucocorticoid steroid. Units: follow-up period, months.
Table 2. Comparison between the two groups at baseline.
VariableMOF Group (N = 203)Non-MOF Group (N = 728)p-Value
sex (male:female, female%)14:189, 93.1%115:613, 84.2%<0.01
age (mean, S.D.)78.6, 9.978.6, 10.90.88
Age by teens
(30s, 40s, 50s, 60s, 70s, 80s, ≥90)
0, 2, 8, 25, 58, 87, 231, 13, 27, 99, 188, 300, 1000.92
follow-up period (mean, S.D.)34.8, 28.7120, 0<0.001
existing VF57 (28.1%)124 (17.0%)<0.01
existing HF10 (4.9%)21 (2.9%)0.20
existing SF5 (2.5%)5 (0.7%)0.06
existing WF4 (2.0%)7 (1.0%)0.09
existing MOF70 (34.5%)153 (21.0%)<0.001
Tscore_LS (mean, S.D.)−2.59, 1.40−2.20, 1.75<0.05
Tscore_FN (mean, S.D.)−2.22, 1.05−2.01, 1.18<0.05
BMI21.3, 4.022.8, 3.80.07
current smoking habit8 (4.0%)17 (2.3%)0.15
alcohol habit2 (1.0%)12 (1.6%)0.31
type 2 DM53 (26.1%)149 (20.4%)0.09
hypertension128 (63.1%)340 (46.7%)<0.001
hyperlipidemia76 (37.4%)171 (23.5%)<0.001
chronic heart failure70 (34.5%)139 (19.1%)<0.001
COPD24 (11.8%)55 (7.6%)0.05
CKD ≥ Stage 3a65 (45.1%)137 (36.0%)0.05
insomnia57 (28.1%)140 (19.2%)<0.01
lifestyle-related diseases162 (79.8%)460 (63.2%)<0.001
MADS69 (40.0%)128 (17.6%)<0.001
osteoarthritis130 (64.0%)398 (54.7%)<0.05
contracture37 (18.2%)54 (7.4%)<0.001
Disuse27 (13.3%)38 (5.2%)<0.001
Parkinsonism9 (4.4%)16 (2.2%)0.08
Fall-ability161 (79.3%)456 (62.6%)<0.001
cognitive disorder52 (25.6%)94 (12.9%)<0.001
RA56 (27.6%)228 (31.3%)0.31
parental history of hip fracture0 (0%)0 (0%)N/A
secondary osteoporosis0 (0%)0 (0%)N/A
anti-osteoporotic drug administration63 (31.0%)149 (20.5%)<0.01
GCS administration45 (22.2%)123 (16.9%)0.08
vitamin-D supplementation122 (60.1%)425 (58.4%)0.66
estimated 10-year probability of MOF with FRAX 23.3, 13.920.4, 14.4<0.05
estimated 10-year probability of HF with FRAX11.2, 10.19.5, 10.4<0.05
Abbreviations: S.D., standard deviation; VF, vertebral body fracture; HF, hip fracture; SF, proximal humerus fracture; WF, wrist fracture; MOF, major osteoporotic fracture; LS, lumbar spine; FN, femoral neck; BMI, body mass index; DM, diabetes mellitus; COPD, chronic obstructive pulmonary diseases; CKD, chronic kidney disorder; MADS, musculoskeletal ambulation disability symptom complex; Fall-ability, hyper fall-ability; RA, rheumatoid arthritis; N/A, not applicated; GCS, glucocorticoid steroid. Units: follow-up period, months.
Table 3. Risk ratios in the variables using a Cox regression analysis.
VariableRisk Ratio (95% CI)p-Value
female gender2.21 (1.29~3.81)<0.01
older age1.00 (0.99~1.01)0.91
heavier body weight0.96 (0.92~0.99)<0.05
taller height0.97 (0.94~1.01)0.11
higher BMI0.90 (0.82~0.99)<0.05
existing MOF1.81 (1.36~2.42)<0.001
existing VF1.73 (1.27~2.35)<0.001
parental history of hip fracture
current smoking habit1.49 (0.73~3.02)0.27
GCS administration1.32 (0.95~1.84)0.10
presence of RA0.85 (0.63~1.16)0.31
secondary osteoporosis
alcohol habit0.63 (0.16~2.55)0.52
higher T-score in the proximal femur0.87 (0.78~0.96)<0.01
hypertension1.83 (1.38~2.44)<0.001
hyperlipidemia1.73 (1.30~2.30)<0.001
chronic heart failure2.00 (1.50~2.67)<0.001
insomnia1.55 (1.14~2.10)<0.01
lifestyle-related diseases2.13 (1.51~3.00)<0.001
MADS2.16 (1.62~2.89)<0.001
osteoarthritis1.41 (1.06~1.88)<0.05
contracture2.33 (1.63~3.33)<0.001
Disuse2.41 (1.61~3.62)<0.001
Fall-ability2.12 (1.51~2.97)<0.001
cognitive impairment2.10 (1.53~2.87)<0.001
Abbreviations: BMI, body mass index; MOF, major osteoporotic fracture; VF, vertebral body fracture; GCS, glucocorticoid steroids; RA, rheumatoid arthritis; MADS, musculoskeletal ambulation disability symptom complex; Fall-ability, hyper fall-ability.
Table 4. Distribution and the actual MOF rate in the subgroups classified by the two categories.
MOF NumberQ1Q2Q3Q4Total
number of presented comorbidities, such as lifestyle-related diseases, Fall-ability, and cognitive impairment0324110
1151721861
21326431294
34821538
Total35538926203
Total NumberQ1Q2Q3Q4Total
0292731794
11119912549384
2771048692359
31221322994
Total229251217234931
MOF RateQ1Q2Q3Q4Total
010.34%7.41%12.90%14.29%10.64%
113.51%17.17%16.80%16.33%15.89%
216.88%25.00%50.00%13.04%26.18%
333.33%38.10%65.63%17.24%40.43%
Total15.28%21.12%41.01%11.11%21.80%
Abbreviations: MOF, major osteoporotic fracture; Q1, the lowest quarter group in probability calculated by FRAX; Q2, the second lowest quarter group in probability calculated by FRAX; Q3, the second highest quarter group in probability calculated by FRAX; Q4, the highest quarter group in probability calculated by FRAX.
Disclaimer/Publisher’s Note: The statements, opinions and data contained in all publications are solely those of the individual author(s) and contributor(s) and not of MDPI and/or the editor(s). MDPI and/or the editor(s) disclaim responsibility for any injury to people or property resulting from any ideas, methods, instructions or products referred to in the content.