Article

Synthesis and Characterization of the Conjugated Peptide Lunatin-Folate

by
Amanda Neves de Souza
1,
Adriano Monteiro de Castro Pimenta
2,3 and
Rodrigo Moreira Verly
1,*
1
Departamento de Química, Faculdade de Ciências Exatas, Universidade Federal dos Vales do Jequitinhonha e Mucuri (UFVJM)—Campus JK, Diamantina 39100-000, MG, Brazil
2
Departamento de Bioquímica e Imunologia, Instituto de Ciências Biológicas, Universidade Federal de Minas Gerais, Belo Horizonte 31270-901, MG, Brazil
3
Segal Cancer Proteomics Centre, Lady Davis Institute for Medical Research, Jewish General Hospital, McGill University, Montreal, QC H3T 1E2, Canada
*
Author to whom correspondence should be addressed.
Organics 2025, 6(1), 8; https://doi.org/10.3390/org6010008
Submission received: 7 October 2024 / Revised: 9 January 2025 / Accepted: 7 February 2025 / Published: 11 February 2025

Abstract

:
Bioactive peptides are promising therapeutic agents due to their antimicrobial and anticancer activities, although their lack of selectivity often limits clinical applications. This study demonstrates the optimal synthetic route for conjugating folic acid (FA) with the bioactive peptide Lunatin-1, aiming to improve selectivity for neoplastic cells. The synthesis combines solid-phase peptide synthesis (SPPS) and Cu(I)-catalyzed cycloaddition to link folic acid to Lunatin-1 via a triazole ring. Using the model tripeptide FIG-NH2, key intermediates and the final product were characterized by high-performance liquid chromatography (HPLC), mass spectrometry (MALDI-ToF), Fourier-transform infrared spectroscopy (FTIR), and nuclear magnetic resonance (NMR). Reaction yields and purity were optimized with FIG-NH2, providing a reproducible synthesis pathway. Additionally, the results confirmed successful conjugation, with the FA-Trz-Luna product exhibiting molecular integrity and structural stability, as validated by spectral analyses. This study highlights a potential synthesis route for peptide-folate conjugates to be used as selective and multifunctional therapeutic agents, laying the groundwork for biological evaluations of their cytotoxicity and antimicrobial properties.

Graphical Abstract

1. Introduction

Many advances in medicine are associated with the discovery of new antibiotics and improvements in sanitation, which have expanded treatment options and reduced the incidence of infections caused by pathogenic microorganisms [1]. However, the proliferation of multi-resistant microorganisms has increasingly limited therapeutic treatments, making the study of new agents capable of combating these microorganisms essential [2]. The bioinformatics database on antibiotic resistance, CARD, contains about 3057 references of sequences whose genes and/or causes leading to resistance have been identified [3]. This number is alarming, as estimates suggest around 700,000 annual deaths caused by infections from multi-resistant microorganisms, surpassing the percentage caused by cancer [2].
Similarly, cancer therapy is also significantly affected by the development of drug resistance in neoplastic cells. The Cancer DR database shows that 148 anticancer drugs have been linked to resistance in 952 different neoplastic cell lines [4]. In this scenario, bioactive peptides have been widely studied for their antimicrobial and chemotherapeutic potential. These biomolecules are part of the innate defense mechanisms of a wide range of organisms and exhibit diverse physical and chemical properties [5]. Unlike antibiotics, which act on specific protein sites, antimicrobial peptides (AMPs) primarily target negatively charged cell membranes [6], altering membrane potential and permeability [7] and leading to cell lysis or facilitating internalization for intracellular targeting [8]. In addition, other mechanisms, such as intracellular process inhibitions and immune response modulations, have been described [9,10]. These mechanisms hinder the rapid development of resistance, making peptides even more promising [5,11,12].
However, many bioactive peptides also exhibit high cytotoxicity toward normal eukaryotic cells. To address this, peptide conjugates with existing therapeutic agents have been synthesized to achieve a synergistic effect, potentially allowing for lower doses and improved selectivity toward neoplastic cells [13,14,15]. Beyond improving selectivity, conjugation may also enhance the biological activities of peptides, including antimicrobial, anticancer, and antioxidant properties. For instance, studies have shown that conjugated peptides can exhibit improved antimicrobial activity by enhancing membrane interaction and disruption [5,16]. Similarly, anticancer efficacy may increase through targeted delivery and enhanced intracellular absorption [12,14]. Furthermore, conjugation with specific functional groups can boost antioxidant activity, protecting cells from oxidative stress, as previously described [15]. Thus, peptide conjugation holds significant promise for developing multifunctional therapeutic agents.
Folic acid is widely recognized as a targeting moiety due to the overexpression of folate receptors on the surface of various cancer cells [15]. In addition, folic acid has also been reported to facilitate interactions with cell membrane components, particularly by modulating lipid packing in phospholipid bilayers [17]. These combined effects make folic acid an ideal candidate for improving both the selectivity and efficacy of bioactive peptide conjugates. Given the biotechnological potential of peptides and the possibility of conjugation with other compounds, this study proposes the synthesis of a folic acid (FA) conjugate covalently linked to the bioactive peptide Lunatin-1, an antibacterial and anticancer peptide isolated from scorpion Hadruroides lunatus venom [14]. Lunatin-1 seems to interact with negatively charged cell membranes, altering membrane potential and permeability before being internalized for intracellular targeting. Therefore, conjugating folic acid to Lunatin-1 may enable selective targeting of neoplastic cells, potentially reducing side effects.
This study introduces an innovative method for conjugating bioactive peptides with folic acid, employing solid-phase peptide synthesis combined with a Cu(I)-catalyzed cycloaddition to create a triazole linkage. The resulting product is a peptide conjugate linked to folic acid through a triazole ring, which ensures precise control over the conjugation process and enhances the stability of the resulting compound. The use of model FIG-NH2, selected from the N-terminus of Lunatin-1, in preliminary reactions was proposed to optimize conditions and ensure the scalability of the method. Structural integrity, purity, and successful conjugation of the folate to the peptide was evaluated through a set of analytical techniques such as high-performance liquid chromatography (HPLC), Fourier-transform infrared spectroscopy (FTIR), mass spectrometry (MALDI-ToF), and nuclear magnetic resonance (NMR).

2. Materials and Methods

2.1. Materials

Solid-phase Peptide Synthesis: Fmoc-protected amino acids (Fmoc-Phe-OH, Fmoc-Ser(t-Bu)-OH, Fmoc-Thr(t-Bu)-OH, Fmoc-Leu-OH, Fmoc-Lys(Boc)-OH, Fmoc-Gly-OH, Fmoc-Ile-OH) (Sigma-Aldrich®, St. Louis, MO, USA). Rink Amide resin (0.79 mmol·g⁻1) (Novabiochem®, Darmstadt, Germany). N,N-Dimethylformamide (DMF) (Dinâmica®, Indaiatuba, São Paulo, Brazil), isopropyl alcohol (IPA) (Neon®, São Paulo, Brazil), dichloromethane (DCM) (Neon®, São Paulo, Brazil), and trifluoroacetic acid (TFA) (Merck® KGaA, Darmstadt, Germany). 4-methyl-piperidine, dicyclohexylcarbodiimide (DCC), 6-bromohexanoic acid, and sodium azide (Sigma-Aldrich®). 1-Hydroxybenzotriazole (HOBt) and N,N’-diisopropylcarbodiimide (DIC) (Sigma-Aldrich®). Folic acid modification reagents: Folic acid (Sigma-Aldrich®), Propargylamine (Sigma-Aldrich®), Copper(II) sulfate and sodium ascorbate (Sigma-Aldrich®).
Analytical and characterization tools: Deuterated dimethyl sulfoxide (DMSO-d₆) and deuterated water (D2O) (Sigma-Aldrich®, St. Louis, MO, USA). Reference standards 4,4-Dimethyl-4-silapentano-1-sulfonic acid (DSS) and Tetramethylsilane (TMS) (Sigma-Aldrich®, St. Louis, MO, USA), acetonitrile (Panreac®, Darmstadt, Germany). Laboratory equipment and supplies: Polypropylene syringes, vortex mixer (Analítica®, São Paulo, Brazil), heating block (Labnet Accublock®, Edison, NJ, USA), Spinlab® centrifuge (model SL-16RAV-4000), and Terroni Model LT 1000 lyophilizer (Terrroni®, São Carlos, São Paulo, Brazil).

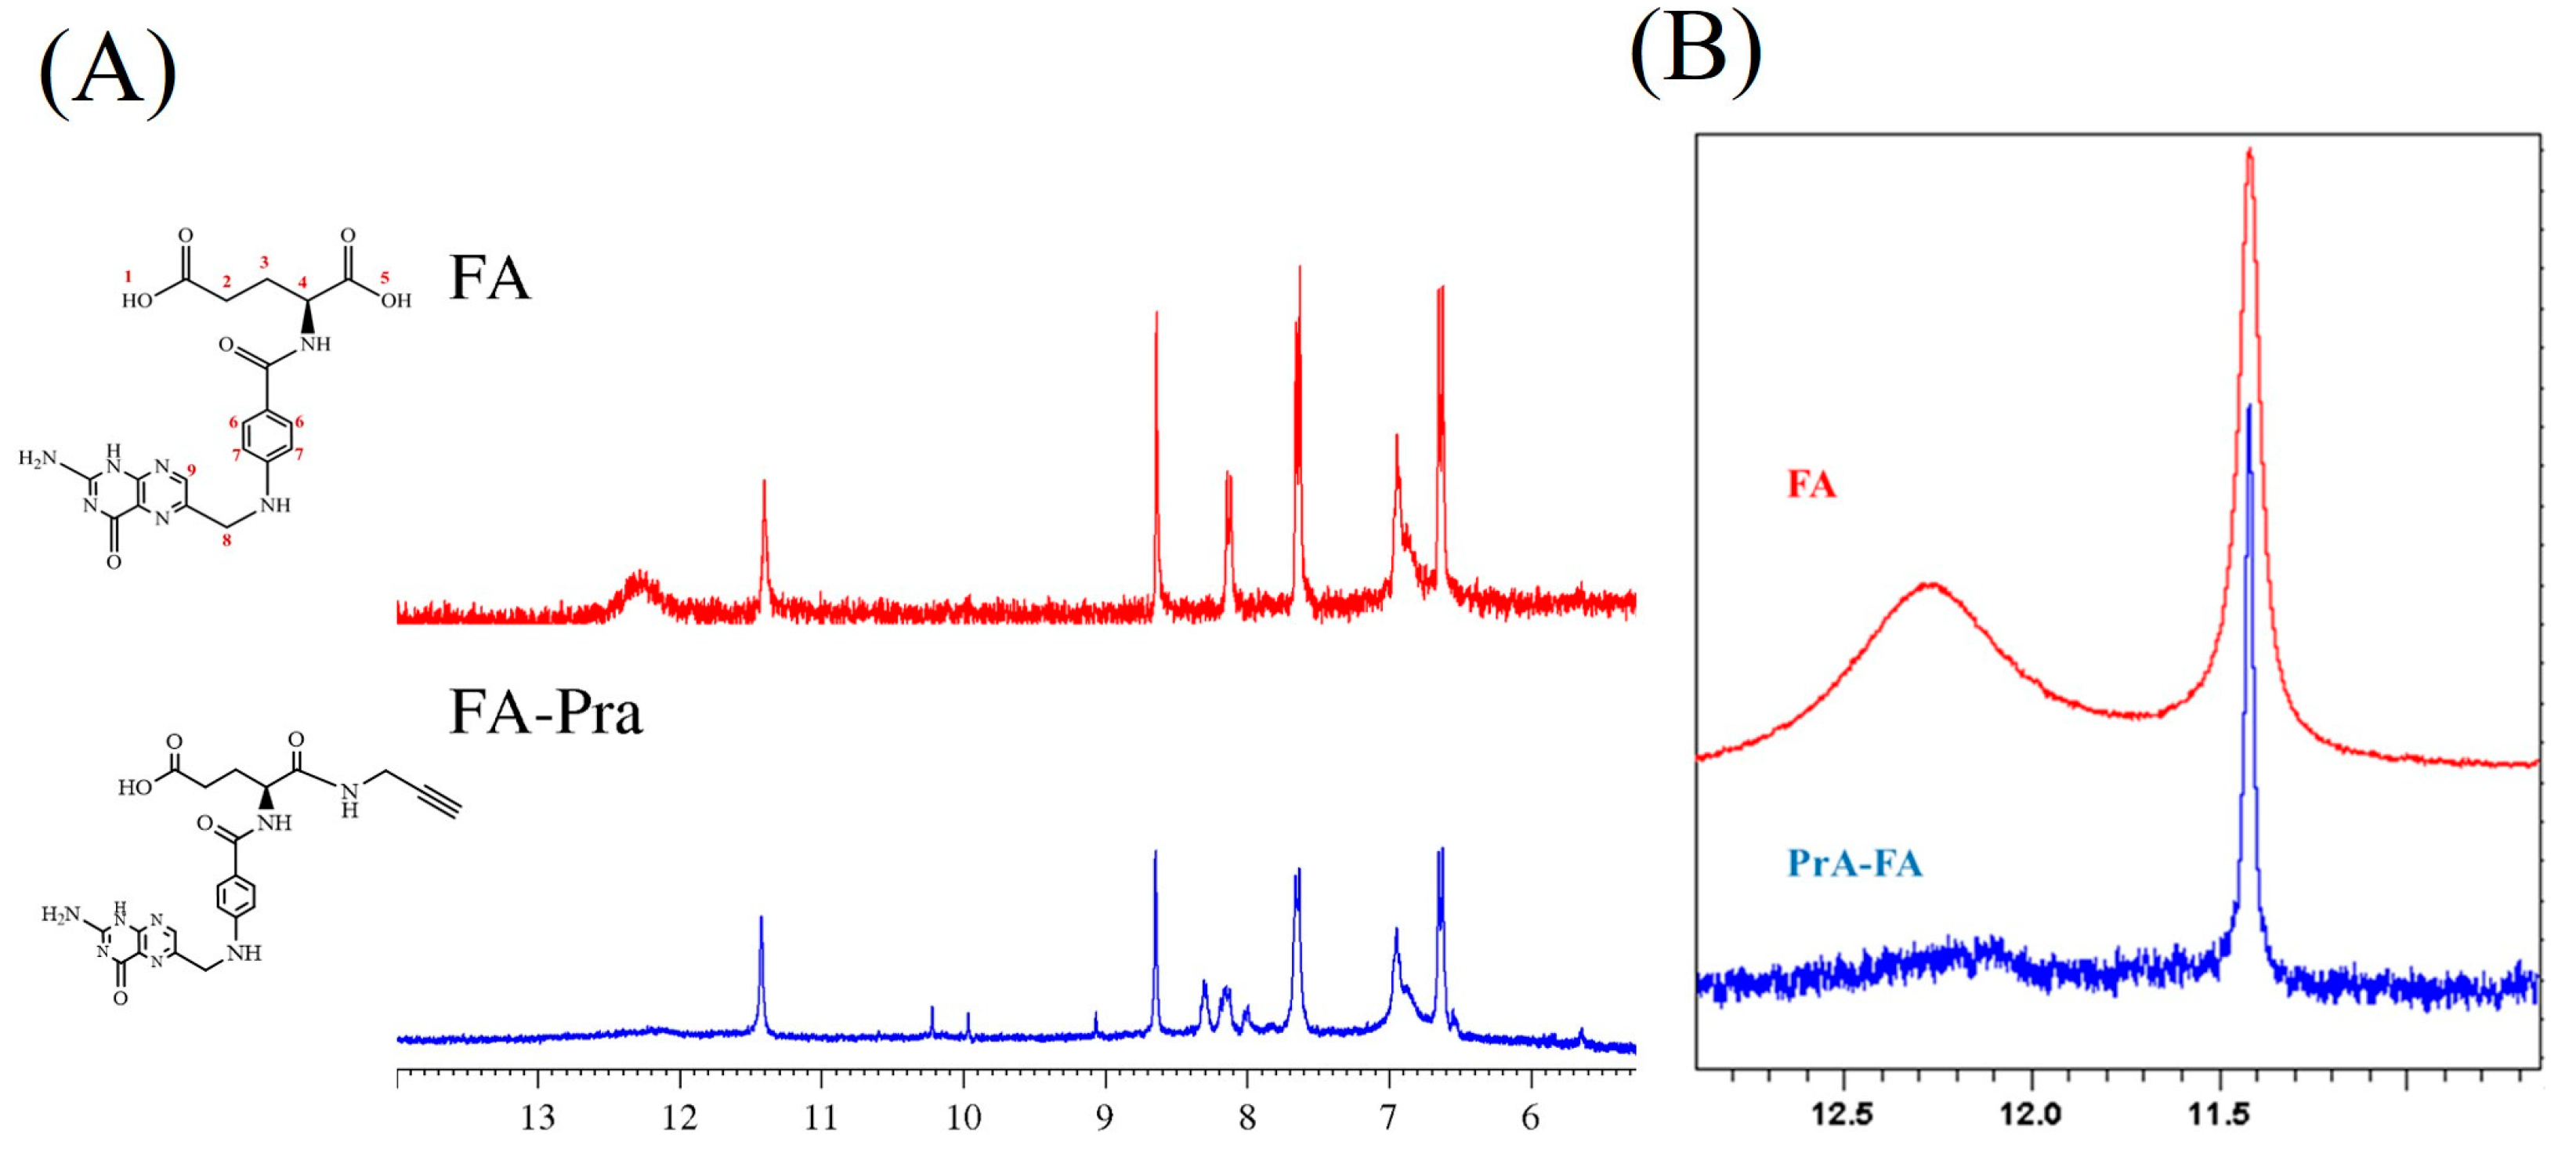
2.2. Synthesis of the Propargylated Derivative of Folic Acid

The procedure was adapted from the method described by Puvvada et al. (2015) [18], which consists of a solution-phase synthesis method under inert atmospheric conditions of nitrogen gas. First, 88.3 mg of folic acid (0.2 mmol) and 61.9 mg of dicyclohexylcarbodiimide (DCC) (0.3 mmol) were added to a three-necked flask and solubilized under mild heating (30 °C) in 2 mL of dimethyl sulfoxide. Then, 16.5 mg of propargylamine (0.3 mmol) was solubilized in 800 μL of DMSO and transferred to a 1 mL glass syringe, which was attached to the reaction flask. This solution was slowly dripped into the folic acid solution over the first 3 h. The setup of the reaction system is shown in Figure S1A. The reaction was stirred magnetically (300 rpm) for a total of 12 h. At the end of the reaction, the formation of dicyclohexylurea (DCU) from the DCC was removed by vacuum filtration (Figure S1B), and the alkyne derivative (yellow solid, Figure S1D) was precipitated by adding approximately 70 mL of cold diethyl ether (−18 °C) (Figure S1C).

2.3. Solid-Phase Peptide Synthesis of Lunatin-1 and Tripeptide FIG-NH2

Lunatin-1 (FIGGLLKTLTSFF-NH2) and the tripeptide FIG-NH2 were manually synthesized using the solid-phase peptide synthesis (SPPS), via the Fmoc (9-fluorenylmethyloxycarbonyl) strategy [19]. The following amino acid derivatives were used in the SPPS: Fmoc-Phe-OH; Fmoc-Ser(t-Bu)-OH; Fmoc-Thr(t-Bu)-OH; Fmoc-Leu-OH; Fmoc-Lys(t-Bu)-OH; Fmoc-Gly-OH; and Fmoc-Ile-OH. The Rink Amide resin (0.79 m) was used as solid support. The amount of resin used for both syntheses was calculated based on the expected yield of approximately 150 mg. The resin was transferred to a 5 mL polypropylene syringe with a polyurethane porous filter (Figure S1E) and washed with 2.5 mL of dichloromethane (DCM) under agitation for 15 min for solvation.
The next step consisted of alternating washes with about 2.5 mL of N,N-dimethylformamide (DMF) and isopropyl alcohol (IPA), repeated three times, followed by a final washing with 2.5 mL of DCM. The Fmoc group was removed from resin in a basic medium using 2.5 mL of a 30% (v/v) 4-methylpiperidine (PIPE) solution in DMF for 15 min under agitation. This step was repeated twice.
The coupling steps were carried out using a solution of 2.5 mL of previously distilled DMF containing the derivative amino acid (0.36 mmol), 1-hydroxybenzotriazole (HOBt, 0.36 mmol), and N,N’-diisopropylcarbodiimide (DIC, 0.36 mmol). To ensure amino acid activation, the solution was left to stand for about 10 min and then was drawn into the syringe containing resin under vortex agitation for two hours. After every coupling step, the resin was washed with DMF, IPA, and DCM, followed by the deprotection step of the Fmoc group in a PIPE/DMF solution (25%, v/v). The synthesis was monitored after each coupling and deprotection step using the Kaiser test [20] performed in a test tube containing a few grains of peptide-resin extracted from the resin, followed by the addition of a drop of 5% ninhydrin solution in ethanol, two drops of 80% phenol solution in ethanol, and a drop of KCN solution in pyridine. After manual shaking, the test tube was heated to 100 °C for approximately 5 min in a heating block. At the end of the coupling of all amino acid residues in each synthesis, the peptidyl-resin was submitted to the following steps of the synthetic route.

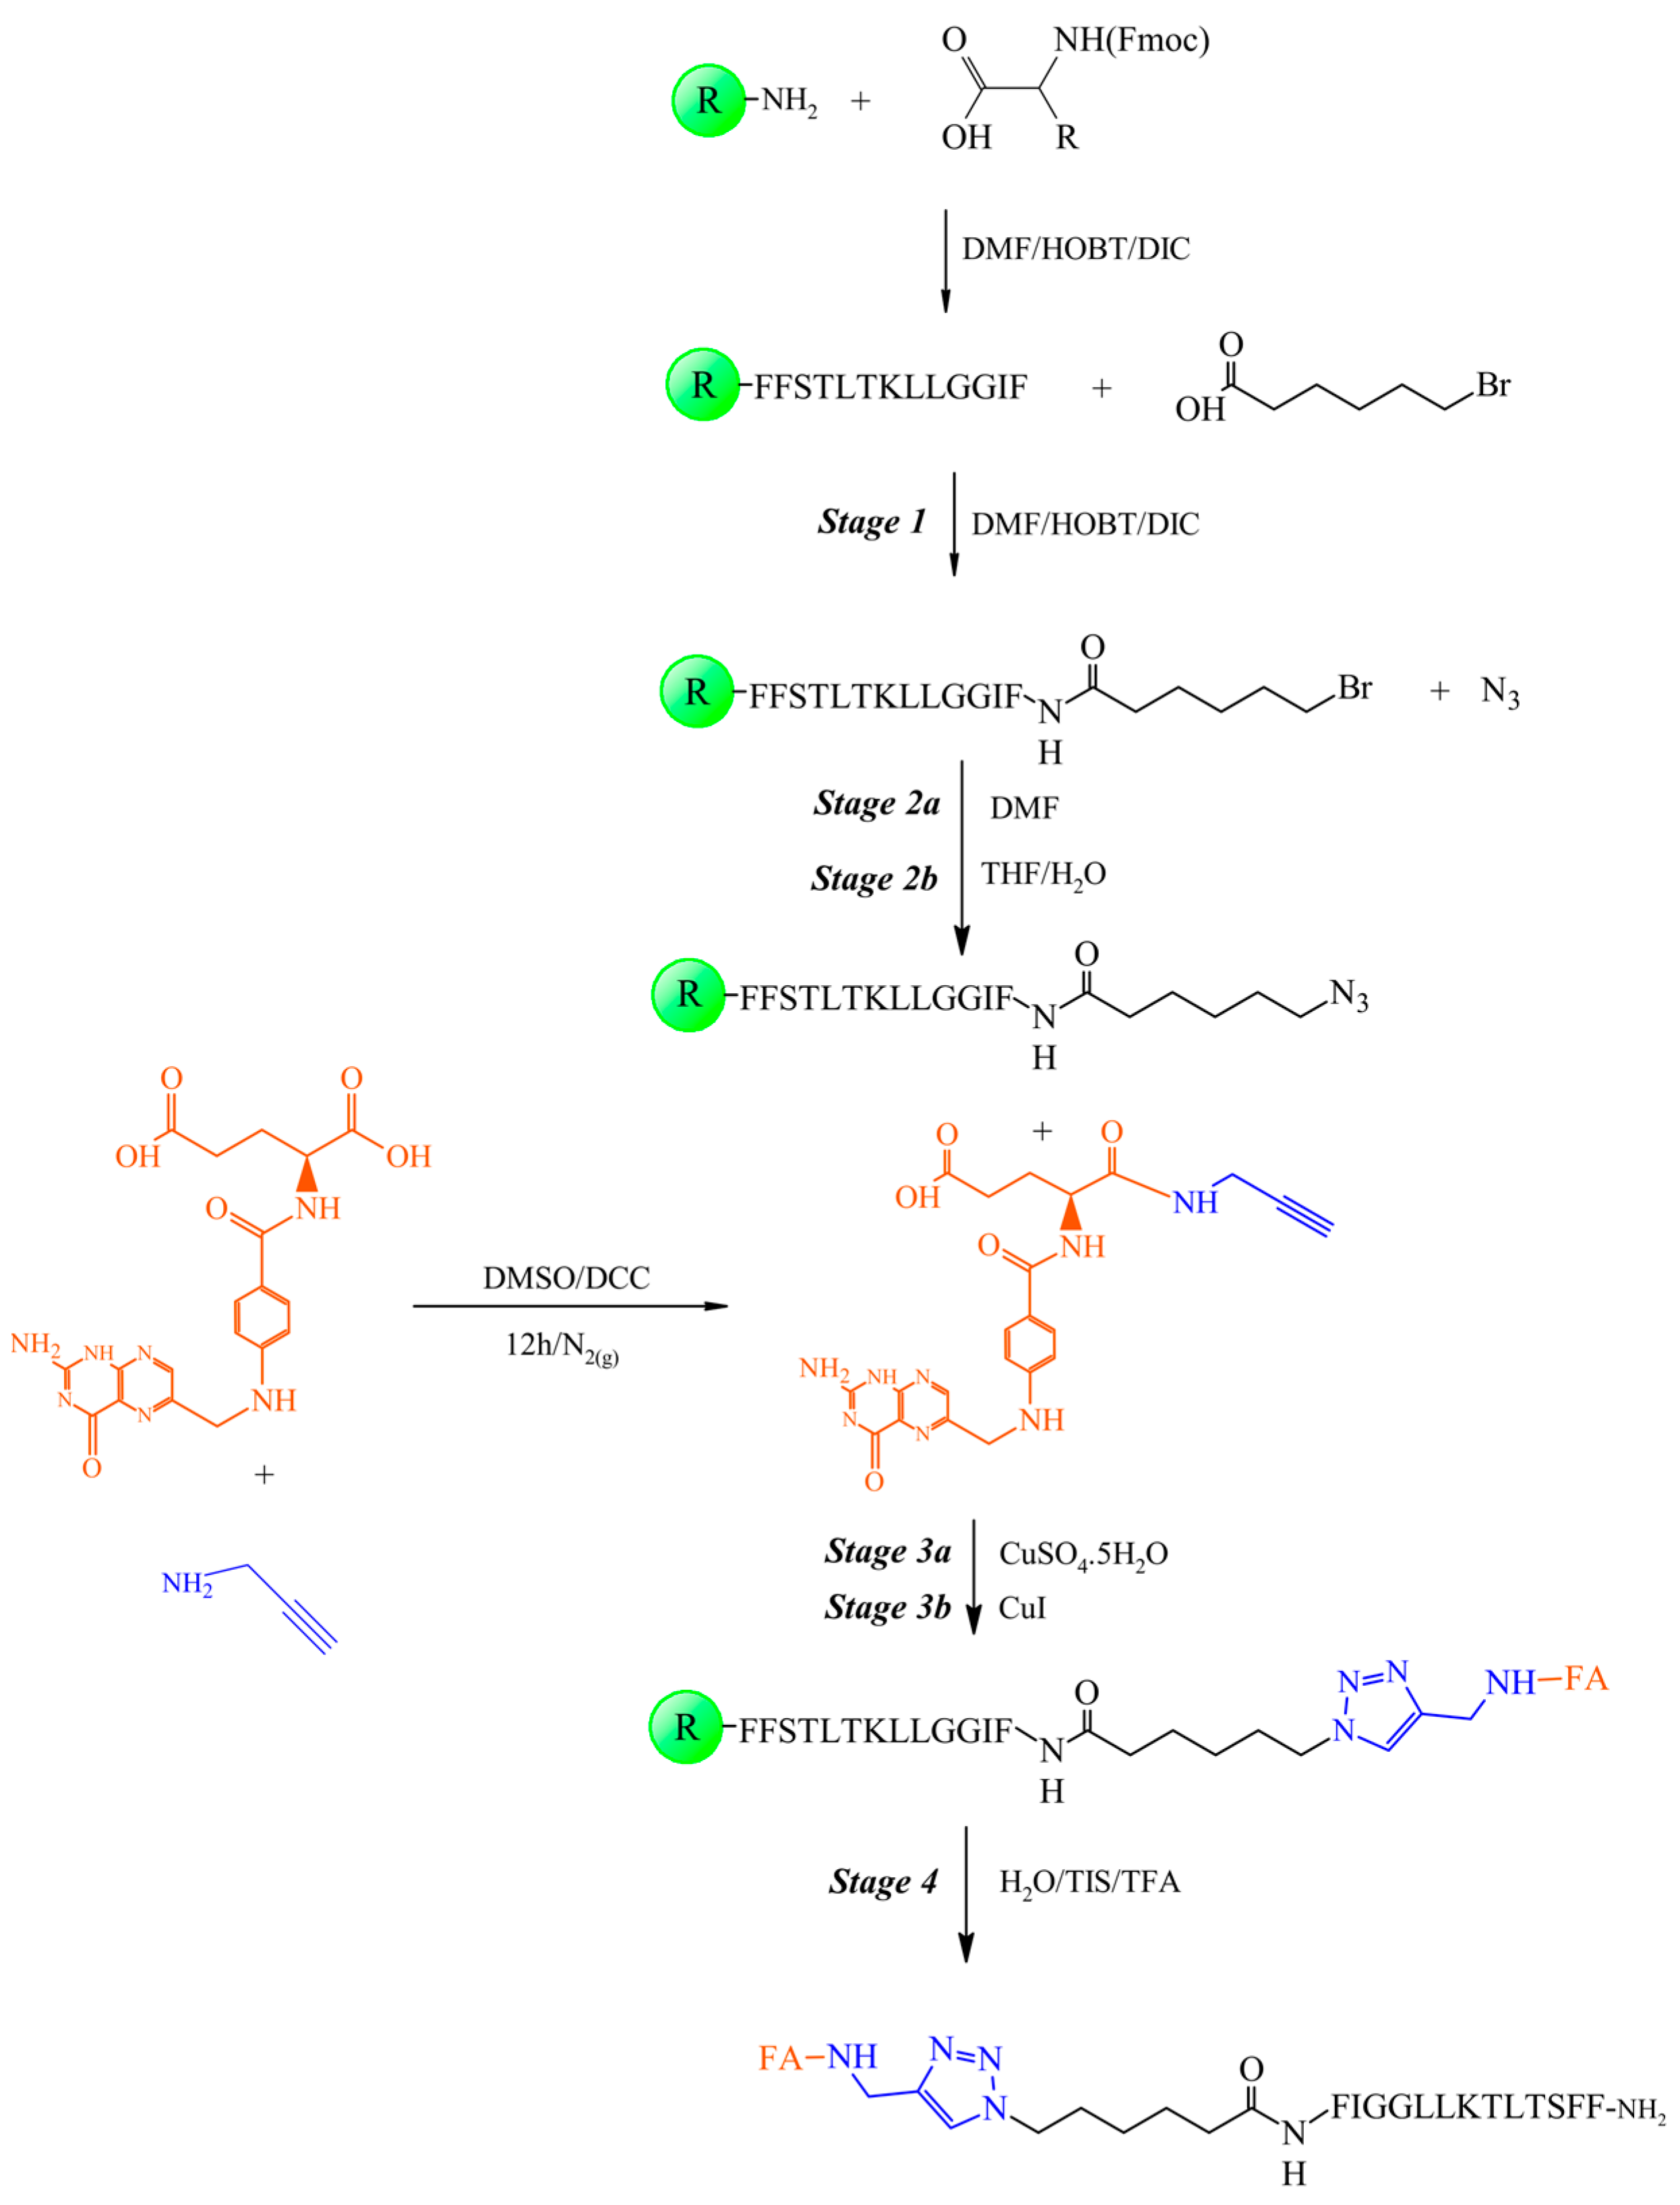
2.4. Synthesis of the Peptide-Folate Conjugate

2.4.1. Coupling of 6-Bromohexanoic Acid to the Peptidyl-Resin (Step 1)

The synthesis conditions used for this step were similar to those employed in the SPPS coupling steps. A solution of 2.5 mL of DMF containing 17.50 mg of 6-bromohexanoic acid (11.50 mmol), 13.69 mg of HOBt (0.36 mmol), and 14.04 μL of DIC (0.09 mmol) was prepared. The solution was then suctioned into the reaction syringe and stirred using a Vortex Mixer for 2 h. After this time, the bromohexamide-peptidyl resin was washed in three successive series with approximately 2.5 mL of DMF, IPA, and a final washing step with about 2.5 mL of DCM.

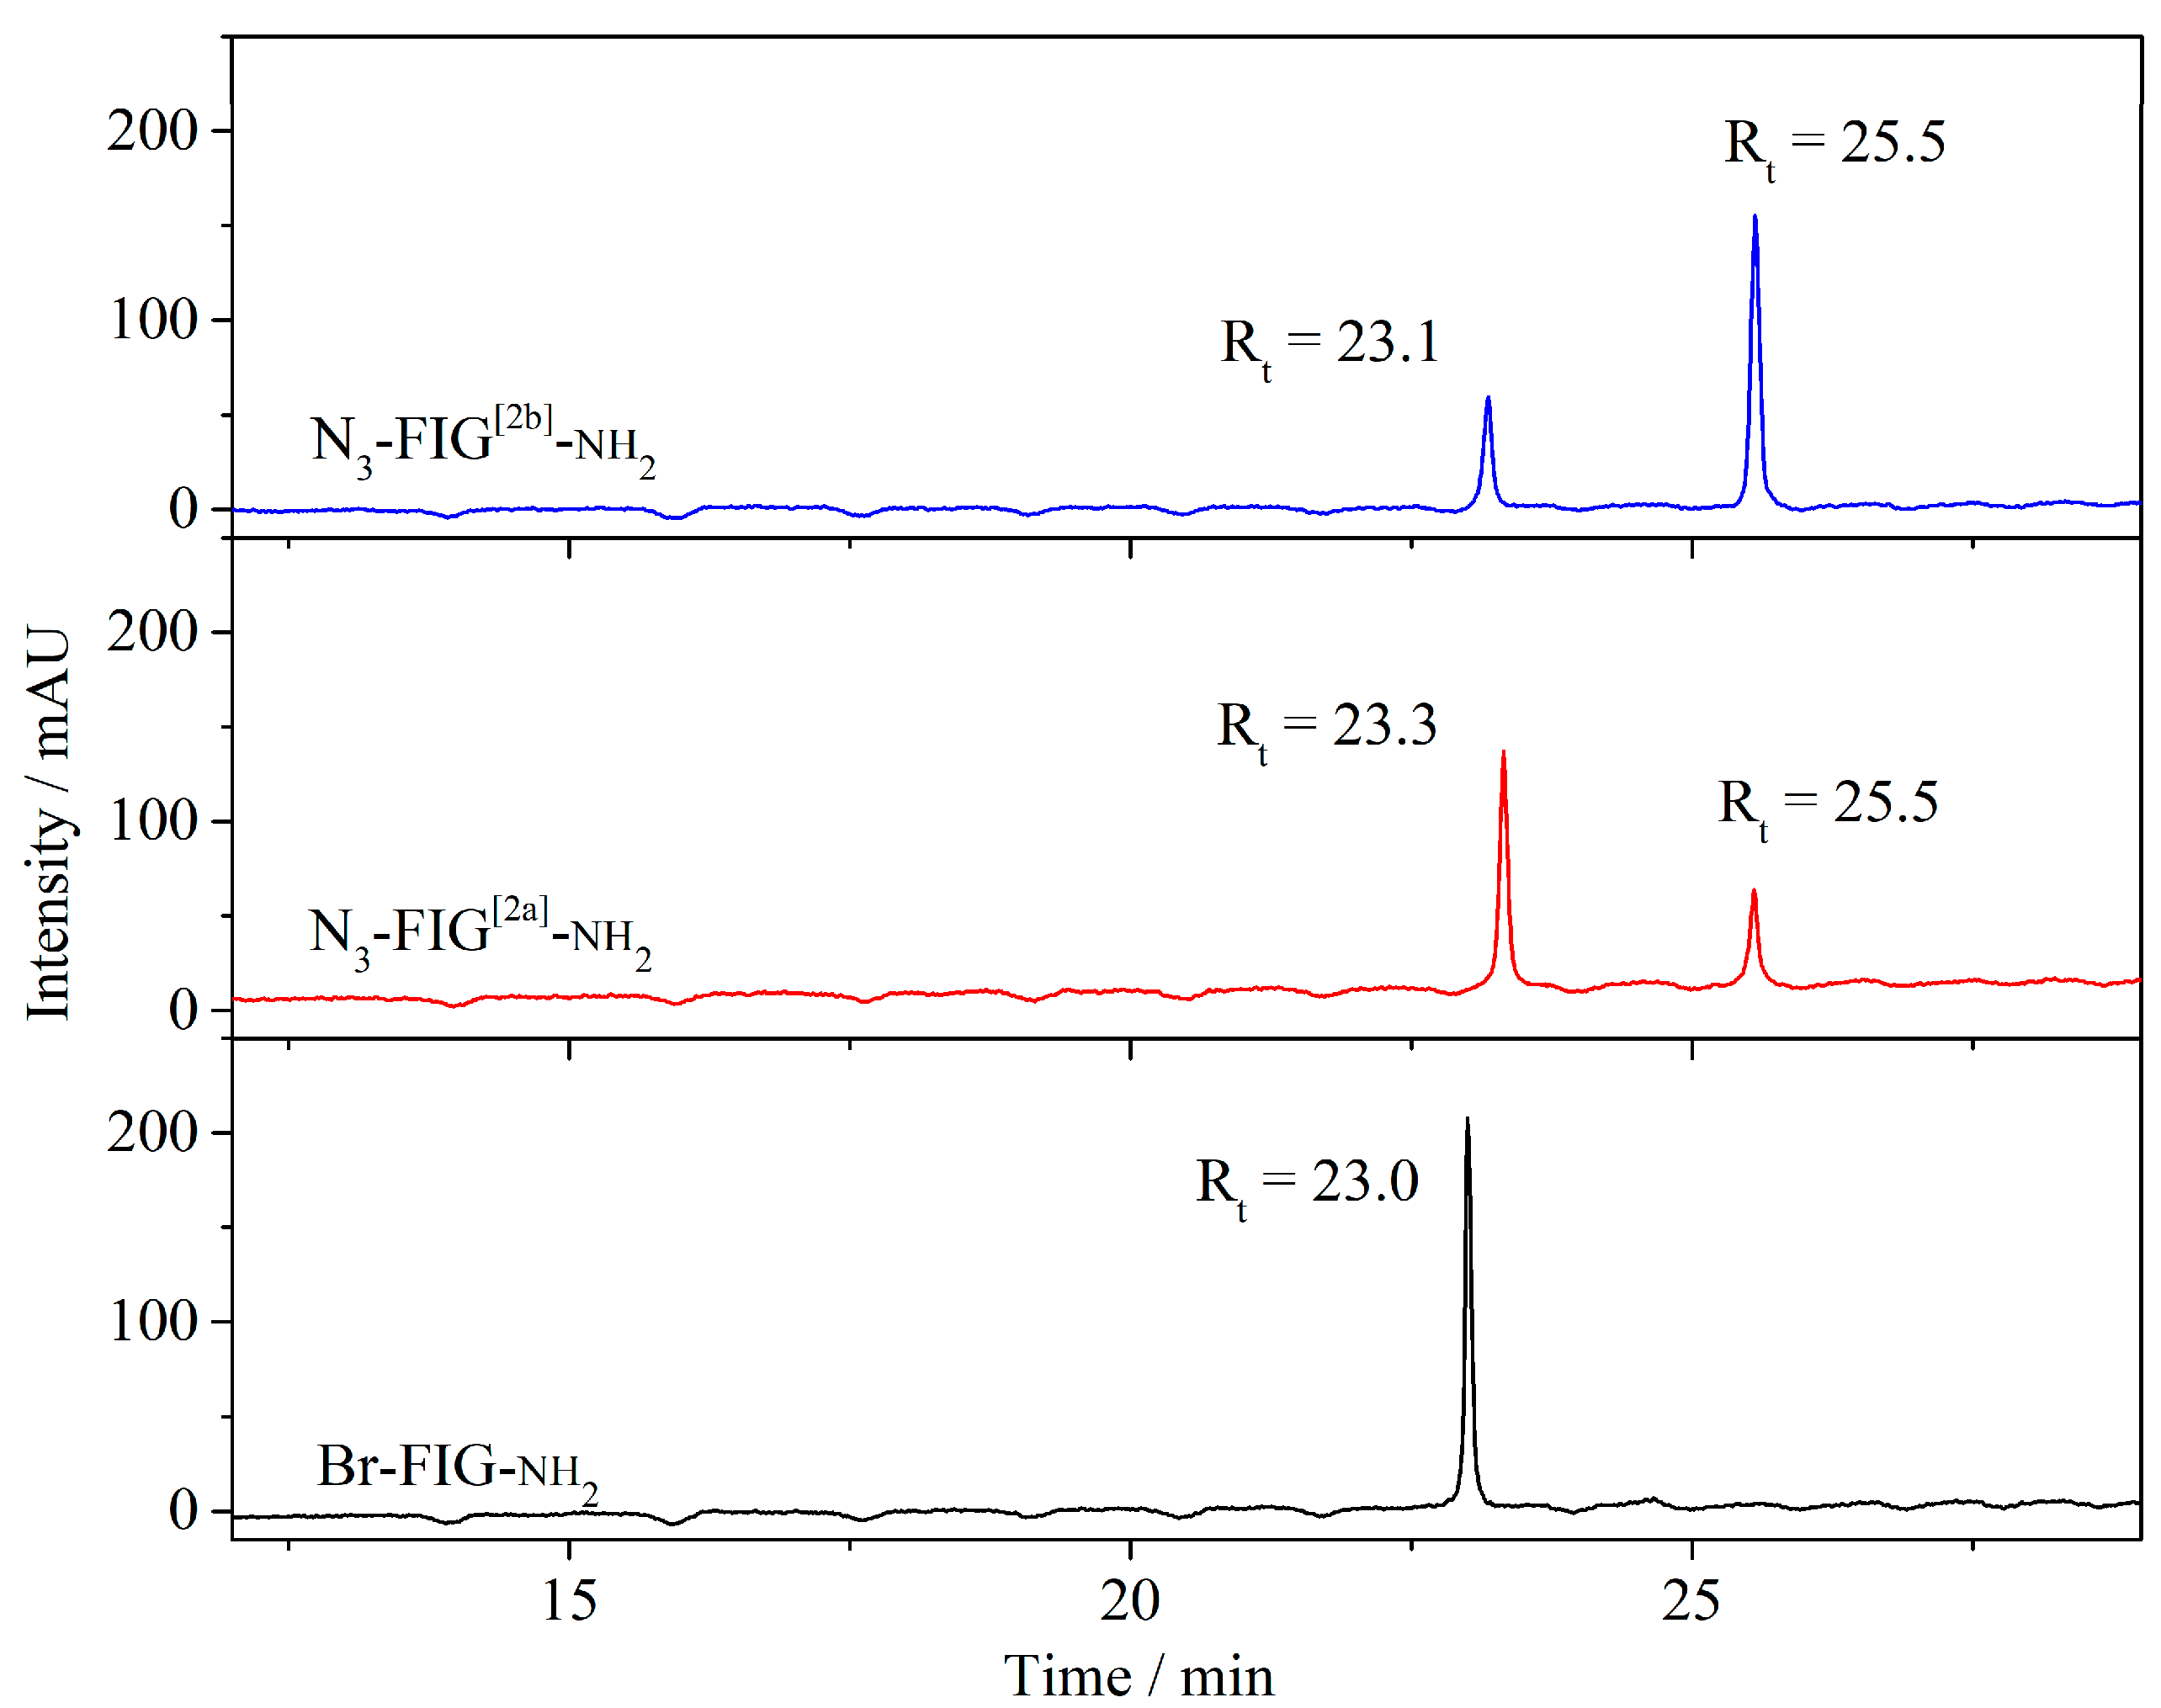
2.4.2. Substitution of Bromine with Azide in Bromohexamide-Peptidyl-Resin (Step 2)

Two methodologies were used to substitute bromine atoms with the azide group (N3) (step 2a and step 2b). Step 2a was adapted from the methodology proposed by [21], in which 2 mL of tetrahydrofuran (THF) solution in water (1:1, v/v) containing 31.5 mg of sodium azide (NaN3) (0.48 mmol) and 10 mg of bromohexamide-peptidyl resin (0.02 mmol) was used. The resin was transferred to a beaker, and the THF/H2O solution was added with sodium azide. The reaction was submitted to magnetic stirring (600 rpm) at 45 °C for 120 min. The final product was washed three times alternately with IPA and DCM. Step 2b, adapted from Coessens (2006) [22], consisted of a solution containing 2 mL of DMF and 9.5 mg of NaN3 (1.46 mmol), which was suctioned into a syringe containing 75 mg of bromohexamide-peptidyl resin (0.13 mmol) and stirred using a Vortex Mixer for 2 h. After this time, the bromohexamide-peptidyl resin was washed in three successive series with approximately 2.5 mL of DMF, IPA, and a final washing step with about 2.5 mL of DCM.

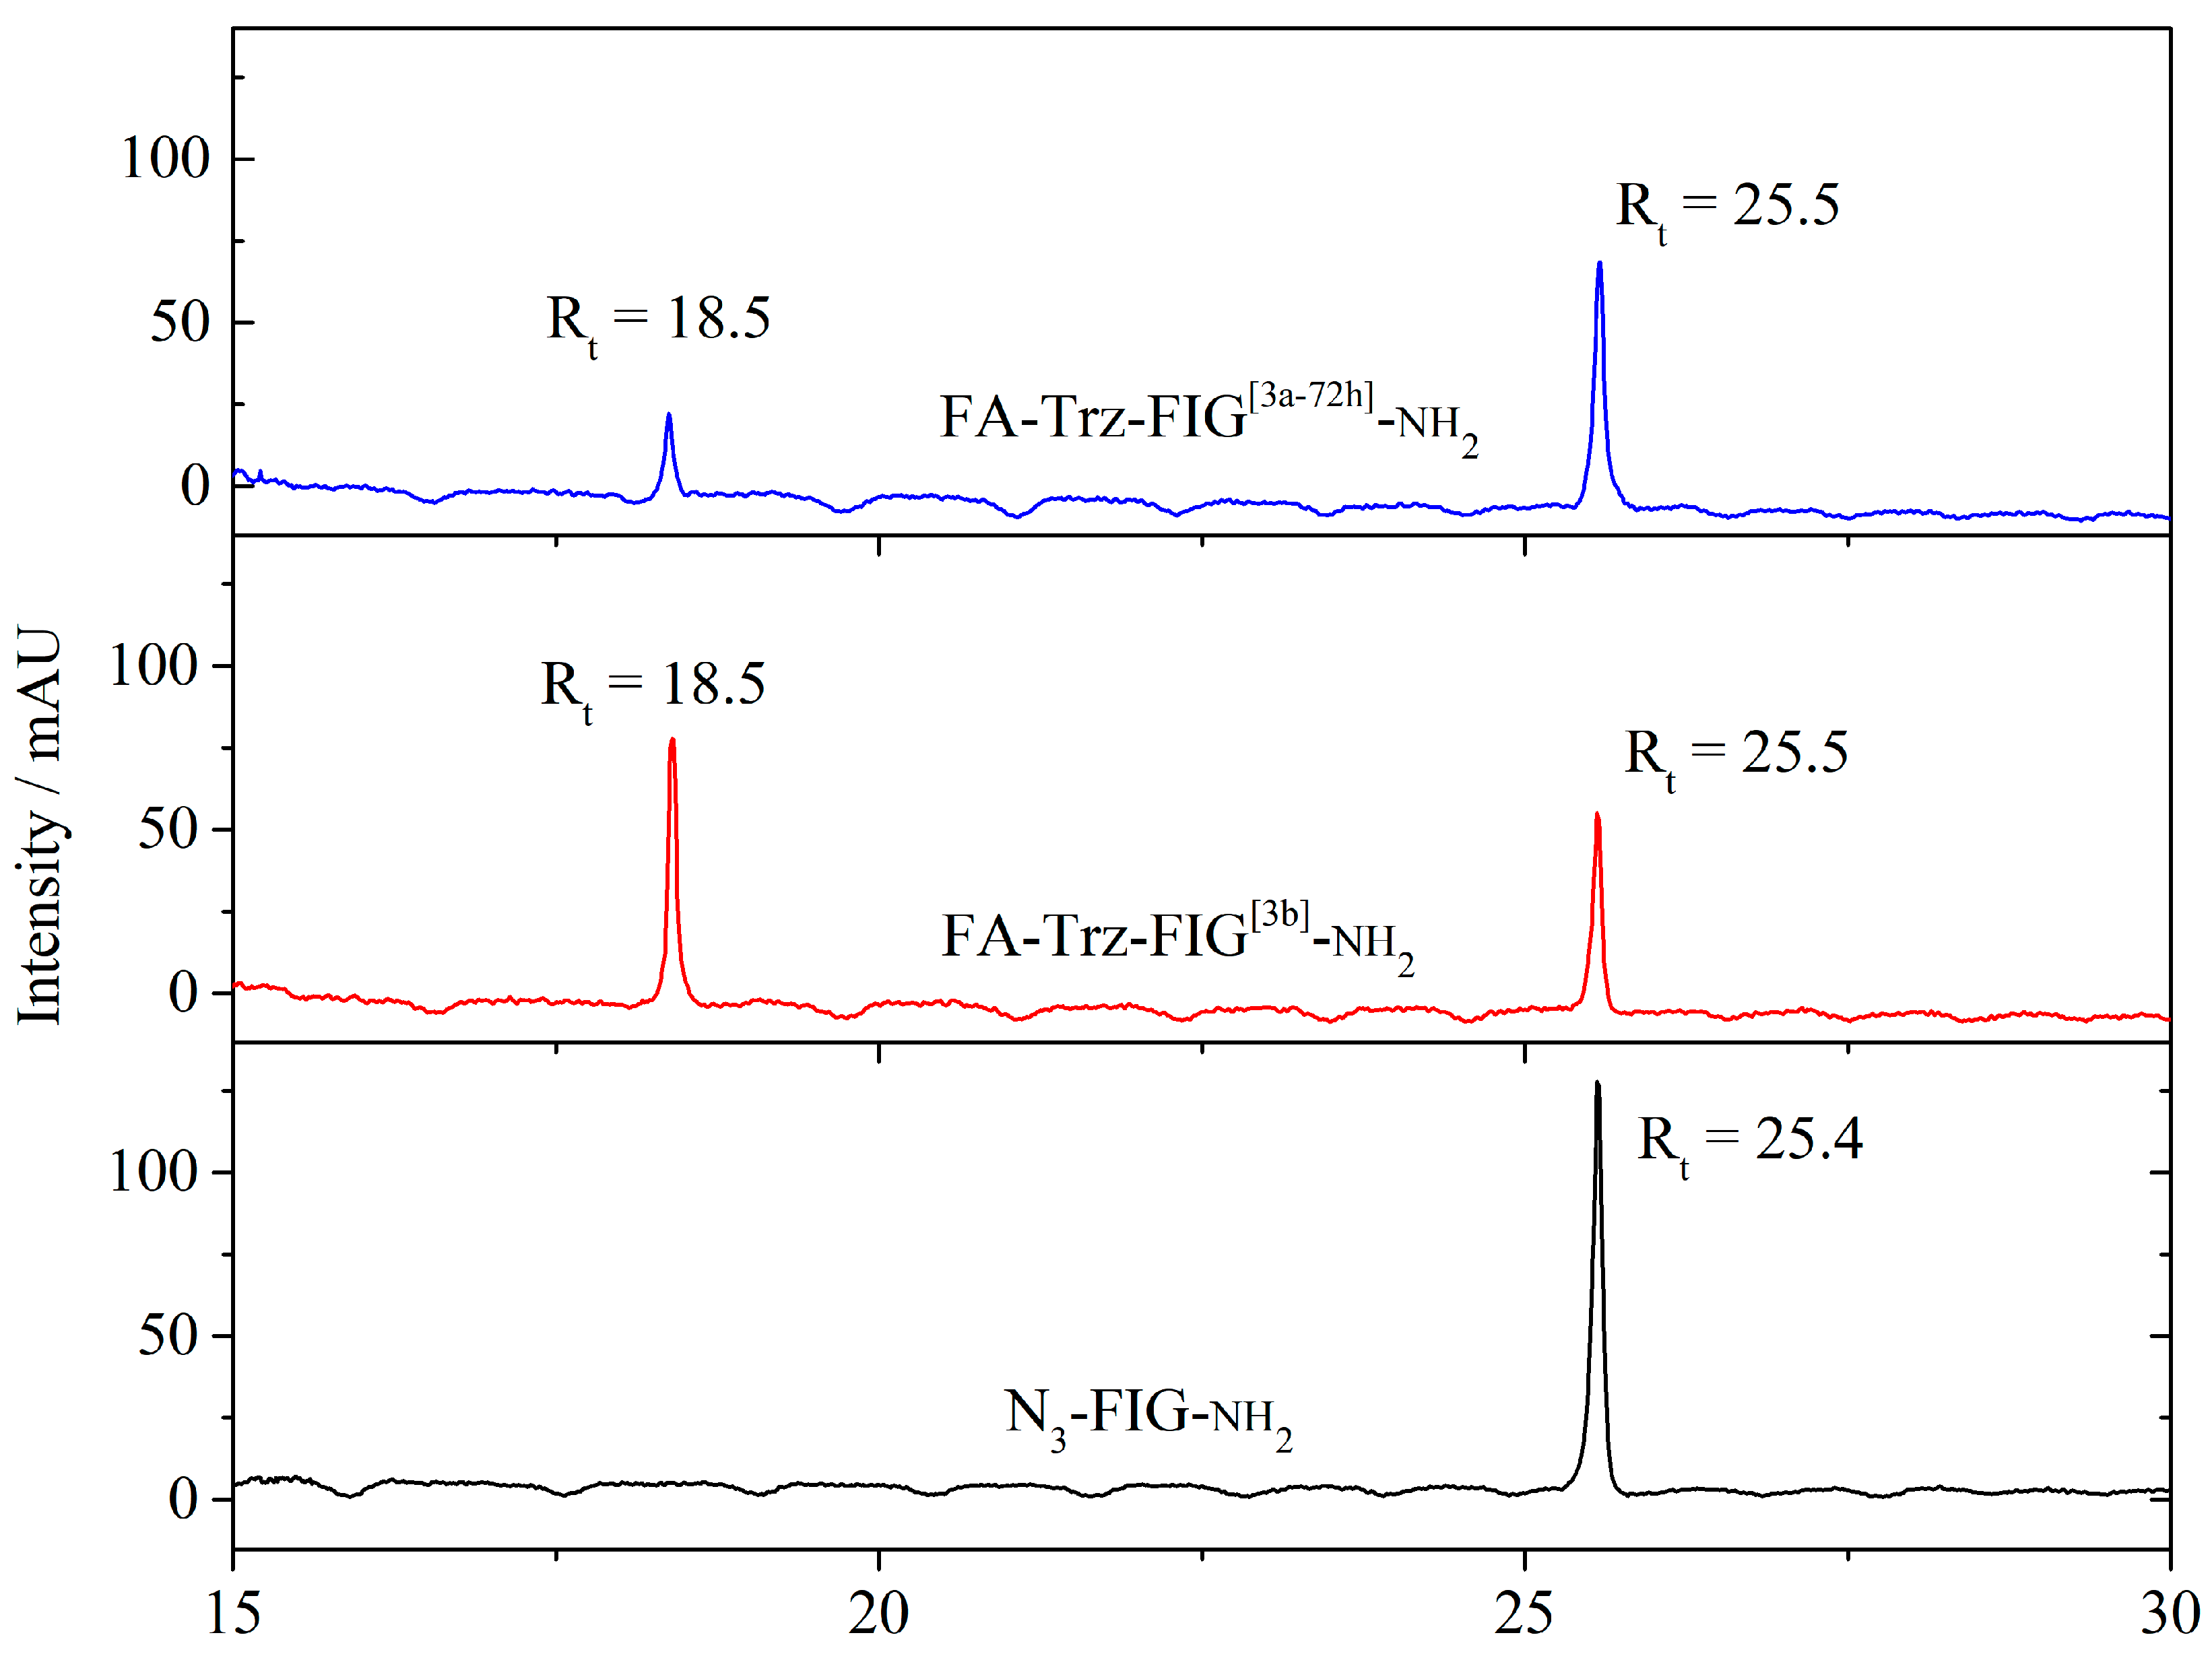
2.4.3. Obtaining Folate-Peptidyl-Resin (Step 3)

Step 3 consists of the copper-catalyzed cycloaddition reaction, carried out in two distinct pathways (Steps 3a and 3b). Step 3a was performed mixing three solutions: (i) 46.5 mg of the propargylated folic acid (FA-Pra) (0.097 mmol) dissolved in 500 μL of DMSO; (ii) 9.3 mg of Cu(II) sulphate (0.037 mmol) in 250 μL of deionized water, and (iii) 8.9 mg of sodium ascorbate (0.049 mmol) dissolved in 250 μL of deionized water. The solutions were suctioned into the reaction syringe containing the azide-hexamida-peptidyl-resin from step 2a in the following sequence: (i) FA-Pra, (ii) Cu(II) sulphate, and (iii) sodium ascorbate. The syringe was then protected from light, and the reaction occurred under stirring with a vortex mixer (400 rpm) using different reaction times: 6 h (FA-Trz-FIG6h), 24 h (FA-Trz-FIG24h), 48 h (FA-Trz-FIG48h), and 72 h (FA-Trz-FIG72h). After the reaction, the folate-peptidyl-resin derivative was subjected to eight washing steps with a 10% (w/v) ethylenediaminetetraacetic acid (EDTA) solution, two steps with IPA, and a final step with DCM. Different reaction times were also tested for this step.
Step 3b was prepared using a solution containing 28.56 mg of CuI (0.15 mmol) and 29.71 mg of sodium ascorbate (0.15 mmol) dissolved in DMF/4-methylpiperidine (8:2, v/v). The greenish-colored solution was suctioned into the syringe containing about 50 mg of azide-hexamida-peptidyl-resin from step 2b (0.03 mmol) and submitted for 5 h at room temperature under stirring with a vortex mixer (400 rpm). After the reaction, the folate-peptidyl-resin derivative was subjected to eight successive washing steps with a 10% (w/v) EDTA solution, two alternating washing steps with DMF and IPA, and a final washing step with DCM.

2.4.4. Cleavage Step of Folate-Peptidyl Resin

In a single cleavage step, the folate-peptidyl resin was removed from the resin, as well as the protective groups from the side chains of Fmoc-Ser (t-Bu)-OH, Fmoc-Thr (t-Bu)-OH, and Fmoc-Lys (t-Bu)-OH. For this step, a solution containing 2.5% (v/v) triisopropylsilane (TIS), 2.5% (v/v) deionized water, and 95% (v/v) trifluoroacetic acid (TFA) was drawn into the syringe containing the folate-peptidyl resin and submitted for 3 h at room temperature under stirring with a vortex mixer (400 rpm). The free folate-peptides were then precipitated by adding cooled diisopropyl ether (~−18 °C), placed in a centrifuge, and the product was dried with nitrogen. The samples were lyophilized.

2.5. Characterization of Intermediates and Products of the Synthesis

At the end of each synthesis step, a small aliquot of the respective peptidyl-resin was cleaved to characterize the intermediates. Subsequently, the cleaved samples were freeze-dried for characterization by high-performance liquid chromatography, mass spectrometry, infrared spectroscopy, and nuclear magnetic resonance. The samples characterized by these experiments and their respective abbreviations are presented in Table 1.
High-performance liquid chromatography (HPLC) was performed in reverse phase on a Varian® chromatograph (Varian, Inc. Corporate Headquarters, Palo Alto, CA, USA) model Pro Star 315 with an ultraviolet detector model Pro Star 335, using an analytical reverse-phase column Vydac® 218TP C18 (250 × 4.6 mm), and a 1 mL loop. The analyses were performed with a gradient of two eluents: deionized water containing 0.1% trifluoroacetic acid (TFA) as phase A and acetonitrile containing 0.08% TFA as phase B. Detection was performed using ultraviolet spectroscopy (UV) at 215 nm by injecting 50 μL of the crude sample at a concentration of 1 mg/mL, at a flow rate of 0.8 mL·min−1 for 40 min.

2.5.1. Mass Spectrometry

Mass spectrometry was conducted in a MALDI-ToF system in MS mode on the AutoFlex III (Bruker Daltonics, Billerica, MA, USA), operating in reflection mode and positive polarity. The analysis was performed by adding 0.5 μL of the sample diluted in deionized water on the AnchorChipTM 600/384 plate (Bruker Daltonics, Billerica, MA, USA), followed by 0.5 μL of the matrix α-cyano-4-hydroxycinnamic acid (α-CHCA). Precursor ion fragmentation was also performed using the MS/MS mode, and the spectra were sequenced using the PepSeq software version 3.3.

2.5.2. Fourier Transform Infrared Region Spectroscopy

An FT-IR Varian spectrometer, model 640-IR, (Varian, Inc., Palo Alto, CA, USA) equipped with an ATR device (Pike Technologies, model GladiATR, Madison, WI, USA) was employed to characterize each derivative from the synthesis steps. All spectra were recorded using a 4000 to 400 cm−1 absorption range, with 8 cm−1 resolution and 64 accumulations.

2.5.3. Nuclear Magnetic Resonance (NMR)

Nuclear Magnetic Resonance (NMR) experiments were conducted on a Bruker® Fourier 300 MHz spectrometer (Bruker Daltonics Inc., Billerica, MA, USA). One-dimensional spectra of 1H and 13C and two-dimensional homonuclear [1H,1H] TOCSY and heteronuclear [1H,13C] edited HSQC were acquired. For the assignment of each contour map signal, a representative scheme of spin systems for each hydrogen nucleus from Protein NMR was used, along with the chemical shift table from the Biological Magnetic Resonance Data Bank (http://bmrb.io/ref_info/csstats.php) (accessed on 16 January 2024).
The NMR spectra of the tripeptide FIG-NH2 were obtained from a solution of 50 mg·L−1 in deionized water containing 10% (v/v) D2O and 1% of 4,4-dimethyl-4-silapentano-1-sulfonic acid (DSS), used as an internal standard reference. Other intermediate products were characterized using solutions of derivatives Br-FIG (30 mmol·L−1 of Br-FIG-NH2; 35 mmol·L−1 of N3-FIG[2a]-NH2; FA (40 mmol·L−1) and FA-Pra (40 mmol·L−1)) containing 20 mg.L−1 in deuterated DMSO (DMSO-d₆) with 0.5% (v/v) tetramethylsilane (TMS) as the reference standard.
1H spectra were acquired using the zg30 pulse program for field homogenization (shimming) and to determine the irradiation frequency of the water signal (o1), employing 14 ppm spectra width, 8192 time domain (TD) points, and 512 scans. 13C spectra were acquired using zgpg 30 pulse program, 200 ppm spectra width, 8192 TD, and 1024 scans. Water signal suppression was performed by pre-saturation, using the zgcppr pulse program [23]. All one-dimensional 1H and 13C experiments were processed using Topspin 3.1 software—Bruker BioSpin® (Rheinstetten, Germany).
The parameters for the [1H,1H] TOCSY experiments were as follows: spectral width in both dimensions of 3002.27 Hz (10 ppm), the center of the window (o1) of 1200.78 Hz (4 ppm), TD of 4096 points in F2 and 322 in F1. The mlevph pulse program [24] and STATES-TPPI acquisition mode were used, with a relaxation delay (d1) of 1.5 ms, 84 scans, and a mixing time (d9) of 60 ms. The [1H,13C] edited HSQC experiments were acquired using the hsqcedgph pulse program. The spectral width was 3002.27 Hz (10 ppm) in F2 and 24413.35 Hz (323 ppm) in F1, with 1200.78 Hz (4 ppm) o1 in F2 and 9812.44 Hz (130 ppm) in F1. The TD was 1024 in F2 and 400 in F1, with 128 scans and a mixing time (d9) of 60 ms. The two-dimensional experiments were processed on a Linux platform running Fedora version 25, using the NMRPIPE® package, version 1.7 [25]. Spectrum assignments were made using NMRVIEWJ® software, version 9.2.0 [26].

3. Results and Discussion

The proposed synthesis strategy is outlined in Figure 1. The synthesis was planned in four stages, beginning with a preparatory reaction to synthesize the propargyl derivative. The tripeptide FIG-NH2 was designed based on the N-terminal sequence of Lunatin-1 to enable assay development for the synthesis pathway, facilitating structural characterization of the intermediates and final products obtained at each step, including the primary product, the peptide-folate conjugate. The optimal conditions were replicated for the synthesis of Lunatin-1-folate.

3.1. Synthesis of the Propargylated Folic Acid Derivative

After 12 h of reaction between activated folic acid propargylamine, the main product was precipitated after adding chilled ether (~−18 °C). The yellow solid was filtered and characterized using FTIR (Figure S2). Figure S2 shows the overlay of the FTIR spectra for FA, Pra, and FA-Pra. The spectrum of Pra is characterized by the presence of the strong C≡C-H bend between 700–600 cm−1, ≡C-H stretching in 3340–3250 cm−1 [27], and N-H stretching is observed around 3350 cm−1. The FA-Pra spectrum shows the corresponding ≡C-H stretching f the alkyne and a single broadband corresponding to the secondary N-H stretching, formed after Pra coupling [28]. However, the stretching band of C≡C around 2260–2100 cm−1 was not observed in either of the two spectra.
Therefore, further structural analyses for FA, Pra, and FA-Pra were performed using solution Nuclear Magnetic Resonance (NMR) spectroscopy. The 1H spectra of propargylamine (Figure S3) reveal the chemical shifts of the aminic hydrogen, methylene, and methine groups of propargylamine corresponding to signals at 3.42 ppm (d, J = 2.4 Hz, 2H), 2.26 ppm (t, J = 2.4 Hz, 2H), and 1.50 ppm (s, 1H), respectively.
The 1H NMR spectrum of folic acid was completely assigned and the chemical shifts attributed according to the numbering proposed in the chemical structure as shown in (Figure 2): H-1 at 11.40 ppm (s, 1H); H-2 at 2.32 ppm (t, J = 7.4 Hz, 2H); H-3 at 1.91 ppm (m, 2H); H-4 at 4.31 ppm (m, 1H); H-5 at 12.26 ppm (s, 1H); H-6 at 7.63 ppm (d, J = 8.5 Hz, 1H); H-7 at 6.61 ppm (d, J = 8.5 Hz, 1H); H-8 at 4.48 ppm (d, J = 5.5 Hz, 2H); and H-9 at 8.65 ppm (s, 1H).
The spectrum also shows two characteristic signals for the hydrogens of the carboxyl groups (11.40 and 12.26 ppm) of folic acid, indicating that they have significantly different chemical environments. While one carboxyl group has an alkyl group at the β position, the other has an amide group in the same position (H-5 at 12.26 ppm), creating distinct chemical environments. Consequently, a significant difference in acidity between the two groups is evident, as shown by the pKa values of 8.4 for H-1 at 11.40 ppm and 4.6 for H-5 at 12.26 ppm [29].
The one-dimensional 1H NMR spectrum of the FA-Pra synthesis product is presented in Figure 2B. Notably, the signal corresponding to the more acidic hydrogen (pKa ≈ 8.4) of the carboxyl group was suppressed. As expected, an activation and, consequently, a substitution preferably occurs in the carboxyl group-containing H-5 with the higher chemical shift [30]. Additionally, new 1H signals at 3.51 ppm and 2.50 ppm, corresponding to the –CH2 and –CH groups from the propargylamine, were promptly assigned. The complete attributions of the chemical shifts were: H-1 at 11.42 ppm (s, 1H); H-2 at 2.40 ppm (t, J = 7.7 Hz, 2H); H-3 at 1.71 ppm (m, 2H); H-4 at 4.32 ppm (m, 1H); H-6 at 3.49 ppm (s, 2H); H-7 at 2.50 ppm (s, 1H); H-8 at 7.64 ppm (d, J = 8.3 Hz, 1H); H-9 at 6.64 ppm (d, J = 8.3 Hz, 1H); H-10 at 4.47 ppm (d, J = 5.3 Hz, 2H); and H-11 at 8.63 ppm (s, 1H).

3.2. Synthesis and Characterization of the Peptide-Conjugates FA-Trz-FIG and FA-Trz-Luna

3.2.1. Synthesis of the Tripeptide FIG-NH2

At the end of the tripeptide FIG-NH2 synthesis, a small sample of the peptidyl-resin was cleaved for characterization. The remainder was kept on the resin for the following synthesis steps (Figure 1). A prominent peak was observed with a retention time (Rt) of 15.5 min (Figure S4) under analytical conditions in HPLC. The mass spectrum confirms the presence of the molecular ion [M+H]+ at m/z 335.40, in accordance with the theoretical monoisotopic mass of 335.40 Da for the protonated molecule.
Figure S5 shows the one-dimensional (1D) 1H NMR spectrum of the tripeptide FIG-NH2, revealing solved chemical shift signals with superposition only in the range of 1.0–0.5 ppm. Therefore, two-dimensional (2D) [1H,1H] TOCSY and [1H,13C] HSQC experiments were performed to enable a complete and unambiguous assignment of the 1H and 13C resonance signals of the tripeptide (Figure S6). Different regions of the [1H,1H] TOCSY contour plot for FIG-NH2 show intramolecular correlations of each amino acid residue. Figure S6A shows the common region of correlation between amide hydrogen (HN), alpha hydrogens (Hα), and side chain shifts (Hβ, Hδ, Hγ, etc.). The spin systems of the isoleucine (2.HN-Hα, 2.HN-Hβ, and 2.HN-Hδ), as well as from glycine residues (3.HN-Hα), could be clearly identified. However, no signals corresponding to the spin system of phenylalanine 1 (Phe-1) residue are observed in the amide hydrogen region. This might be related to the fast proton exchange between amino N-terminal and water, resulting in the absence of signal detection. Nevertheless, the correlation between the beta hydrogens (Hβ) and alpha hydrogens (Hα) of the Phe-1 residue was promptly identified in Figure S6B.
The edited [1H,13C] HSQC contour plot (Figure S6C) shows correlated 1JC,H spin-spin coupling for each residue. The HSQC contour plot was attributed based on the 1H chemical shifts from the [1H, 1H] TOCSY contour plot. The Hα-Cα correlation from the methylene group of Gly-3 was promptly identified due to its 3.7 ppm chemical shift negative phase, as well as the Hβ-Cβ correlation from the CH2 group of Phe-1. Aromatic ring correlations of Hδ-Cβ and Hε-Cε from the Phe-1 residue were also identified in the region around seven ppm. Hβ-Cβ in the positive phase confirms the presence of the isoleucine residue. Other identified correlations include the Hα-Cα, Hδ21- Cδ21, and Hγ11-Cγ11 of Ile-2 around 0.98 and 0.70 ppm.

3.2.2. Synthesis of the Bromo-Hexamide-Peptide-Resin (Step 1)

The first step in modifying the tripeptide involved bromo-hexanoic acid coupling to the amino group of the N-terminal phenylalanine residue. The chromatographic profile of Br-FIG-NH2 (Figure S7A) shows a single prominent peak at a retention time of 23.0 min, longer than that observed for FIG-NH2, suggesting a complete substitution in the N-terminal. The amino group substitution introducing the six-membered carbon chain increases the hydrophobicity of the tripeptide, extending its retention time [29]. The mass spectrum of Br-FIG-NH2 (Figure S7B) confirms the presence of the bromo derivative peptide through the molecular ion [M+H]+ at m/z 510.18, close to the theoretical monoisotopic mass of 510.18 Da for the protonated molecule.
FTIR spectroscopy was also used to evaluate the synthesis of Br-FIG-NH2 (Figure S8). The absorption bands highlighted correspond to the characteristic vibrations of the FIG-NH2 backbone, such as C=O, C-N, and N-H stretching. In both spectra, the N-H stretch of the primary amine and the amide groups are identified in the 3500–3300 cm−1 range, whereas N-H bending is observed around 1640–1560 cm−1 [31]. The N-H from amide vibrational mode was confirmed between 1640–1560 cm−1 [32]. The C=O stretching is identified at the 1650 cm−1 range, and the C=C stretching of the phenylalanine side chain at 1520 cm−1. However, when comparing the two spectra, the Br-FIG-NH2 spectrum shows a C-Br stretch band at 550 cm−1 [33], confirming the presence of the Br-FIG-NH2 product, previously characterized in the mass spectrum.
After the complete assignment of the 1H and 13C nuclei present in the primary structure of FIG-NH2 and 6-bromohexanoic acid, the structural analysis of the product from the coupling of 6-bromohexanoic acid to the N-terminal of the tripeptide was performed. Further structural characterization of Br-FIG-NH2 was achieved from two-dimensional NMR spectroscopy (Figure 3). The signals were attributed using the same strategy as used for FIG-NH2.
The [1H,1H] TOCSY contour plot (Figure 3A) shows a similar chemical shift of HN and Hα for Gly-3 in comparison with FIG-NH2. However, significant changes are noted in the intraresidual correlations of Phe-1 and Ile-2 after 6-bromohexanoic acid coupling. Interestingly, intraresidual HN-Hα and HN-Hβ correlation are noted even in the presence of water. This provides evidence that an amide bond was formed between 6-bromohexanoic acid and Phe residue, decreasing the nitrogen’s basicity. Signals from the methylene 1H of the aliphatic chain of 6-bromohexanoic acid are also noted (Figure 3B). These signals exhibit lower chemical shifts due to the minimal electronegativity difference between the atoms, indicating that these hydrogen nuclei are more shielded [34]. All methylene groups are identified in the HSQC contour plot, characterized by the 1H-13C correlations in inverse-phase signals, as highlighted in Figure 3C.

3.2.3. Synthesis of Azide-Hexamide-Peptidyl-Resin (Step 2)

This step involved the substitution of the bromine in bromo-hexamine-peptidyl-resin with azide (N3), carried out using two different methodologies. The product N3-FIG[2a]-NH2 was obtained from step 2a in the presence of THF/H2O (1:1, v/v) solution, and N3-FIG[2b]-NH2 from step 2b, using DMF as solvent. Figure 4 presents the chromatographic profiles and mass spectra of the synthesized products compared to the Br-FIG-NH2 substrate. In both steps, there is a peak in retention time at about 23 min, very close to the Rt of Br-FIG-NH2 (Figure 4). Additionally, another signal is noted at Rt 25.5 min for both steps 2a and 2b. However, the intensity is significantly higher for the sample from step 2b, confirming the higher yield (~75%) for the reaction carried out in DMF rather than in the absence of water (~25%) [35].
The mass spectrum of the product from step 2a shows the absence of molecular ions with m/z of 474.27 Da, corresponding to the theoretical monoisotopic mass of protonated N3-FIG[2a]-NH2. On the other hand, the presence of an [M+H]+ ion at m/z 474.94 confirms the formation of the expected N3-FIG[2b]-NH2 product from step 2b. A molecular ion correspondent to the Br-FIG[2b]-NH2 is also observed on 510.18 Da, showing that the substitution was incomplete.
As expected, due to the negligible amount of N3-FIG[2a]-NH2 detected by HPLC and mass spectrometry (Figure S9), characteristic bands of C-N stretching for the azide group (~1350 to 1000 cm−1) and N=N=N stretching around 2160–2120 cm−1 [36] were only identified in the spectrum of N3-FIG[2b]-NH2 (Figure S10). In addition, N=N stretching from the azide group around 2160–2120 cm−1 is also noted for N3-FIG[2b]-NH2, which is consistent with the mass spectrum results.
Figure 5 shows the superposition of different regions of the [1H,1H] TOCSY spectra of the N3-FIG-NH2 product from step 2b and Br-FIG-NH2. It is noted that the spin systems related to the HN of Phe-1, Ile-2, and Gly-3 residues (Figure 5A) showed negligible changes in chemical shifts. However, in Figure 5B, a chemical shift variation was observed for all hydrogen signals of the hex-4 group, especially Hε. When analyzing the HSQC spectrum (Figure 5C) of N3-FIG-NH2, a change in the Cε chemical shift of about 16 ppm compared to Br-FIG-NH2 confirms the formation of N3-FIG-NH2.

3.2.4. Synthesis of Folate-Peptidyl-Resin (Step 3)

Step 3 involves a copper(I)-catalyzed cycloaddition reaction between the azide-hexamide group of the peptidyl-resin and the terminal alkyne from FA-Pra derivative. The expected product is a 1,2,3-triazole disubstituted ring at positions 1 and 4. This step was also planned using two different strategies: (i) in situ reducing of Cu(II) to Cu(I) with the addition of ascorbic acid to the bulk reaction (Step 3a), and (ii) using Cu(I) salt in (Step 3b). The N3-FIG-NH2 product from step 2b was used for steps 3a and 3b to obtain the folate-peptide. Among the products obtained in step 3a from different reaction times, only FA-Trz-FIG[3a_72h]-NH2 showed evidence of obtention. Figure 6 shows the chromatographic profiles of the products FA-Trz-FIG[3a_72]-NH2 from step 3a and FA-Trz-FIG[3b]-NH2 from step 3b. Both chromatograms showed a prominent Rt peak at 25.5 min, close to the Rt corresponding to the N3-FIG-NH2 tripeptide. An additional peak at Rt 18.5 min can be observed in the chromatogram of both products, suggesting the formation of the folate-peptide. Notably, a higher reactional yield is reached from step 3b (~60%) compared to step 3a (~15%).
The mass spectra (Figure S11) of the products from step 3 confirm the synthesis of the FA-Trz-FIG-NH2 from both step 3a at 24 h and step 3b by the presence of the molecular ion [M+H]+ at m/z 952.45, which correspond to the theoretical monoisotopic mass of the protonated molecule of 952.45 Da. The presence of N3-FIG-NH2 in both spectra is also evident ([M+H]+ at m/z 474.94 Da), suggesting that the cycloaddition was not complete.
Figure 7A compares the IR spectra of FA-Trz-FIG[3a_72h]-NH2 and FA-Trz-FIG[3b]-NH2. Similar to N3-FIG-NH2, both folate-peptide derivatives exhibit azide N=N=N stretching around 2160–2120 cm−1 [36], consistent with the previous mass spectra, which show a significant remained amount of N3-FIG-NH2 substrate. However, the C-H stretching band, corresponding to the triazole in the region of 3188–3105 cm−1 is notable only in folate-peptide derivatives [37].
The products were characterized by 1H NMR (Figure 7B) in a one-dimensional experiment. FA-Trz-FIG[3b]-NH2 spectrum shows the presence of a signal corresponding to the triazole group identified in the region around a shift of 7.6–7.9 ppm [37].
The synthesis and characterization of the FA-Trz-FIG-NH2 were successfully completed through several key steps, with each intermediate and final product analyzed by FTIR, NMR, and MALDI mass spectrometry. The analyses provided valuable insight into the structure and purity of the conjugates, confirming that the conjugation was properly achieved. The FTIR spectra of the intermediates and final conjugate revealed distinct bands corresponding to the functional groups involved in the conjugation. This confirmed that the tripeptide and folic acid were covalently linked. Specifically, characteristic C-H stretching bands for the triazole group in the final product confirmed successful conjugation. In addition, the NMR spectra were crucial in confirming the structure of the conjugates. In particular, the presence of the folic acid and triazole ring protons, along with the peptide backbone signals, confirmed the conjugation at the molecular level. Results from the NMR analysis were consistent with the expected outcomes.

3.3. Synthesis and Characterization of the FA-Trz-Luna Conjugate

Synthesis and Characterization of the Derivatives and the FA-Trz-Luna Conjugate

Based on the synthesis results of FA-Trz-FIG-NH2, steps 1, 2b, and 3b were repeated for the Lunatin-1 peptidyl-resin. The chromatogram of Lunatin-1 (Figure S12) reveals a prominent peak at a retention time of 30.9 min. The presence of the molecular ion [M+H]+ with m/z 1442.87, equivalent to the theoretical monoisotopic mass of 1442.82 Da calculated for protonated Lunatin-1, confirms the peptide synthesis. The primary sequence was confirmed by MS/MS (Figure S13), from which most of the b and y series ions were identified. From the b series, it was possible to identify the ions corresponding to each amino acid residue in the sequence FIGGLLKTLTSFF-NH2.
Following the detailed structural characterization of all reaction steps, including regioselectivity using the FIG-NH2 derivative, the intermediate products (Br-Luna, N3-Luna, and FA-Trz-Luna) involved in the synthesis of the FA-Trz-Luna conjugate were characterized exclusively by high-resolution mass spectrometry (Figure 8). Increasingly accurate m/z of monoprotonated ions for the expected products from each reaction step were consistently observed. The spectrum in Figure 8A confirms the formation of the Br-Luna derivative, as the predominance of the molecular ion [M+H]+ with m/z equal to 1619.21 is observed. Also, Figure 8B shows the mass spectrum of the product from stage 2b of the conjugate synthesis, which confirms the formation of the N3-Luna product as identical in value to the theoretical molecular mass of the conjugated peptide. A less intense signal corresponding to Br-Luna can also be visualized in this same spectrum, demonstrating that the substitution was incomplete. Finally, the spectrum in Figure 8C confirms the synthesis of the FA-Trz-Luna conjugate by the presence of the predominant molecular ion [M+H]+ with m/z equal to 2060.0, a value that approaches the theoretical monoisotopic mass.

4. Conclusions

This study successfully demonstrated the synthesis and characterization of a novel peptide-folate conjugate, FA-Trz-Luna, which offers promising potential as a therapeutic agent with enhanced selectivity for neoplastic cells. By utilizing solid-phase peptide synthesis (SPPS) in combination with propargylated folic acid and copper(I)-catalyzed cycloaddition, we achieved a conjugated structure designed to improve the targeting of cancerous cells through folate receptors. The methodology involved synthesizing and characterizing Lunatin-1 and its N-terminal tripeptide FIG-NH2, followed by covalent conjugation to folic acid via a triazole linker. The FA-Trz-Luna conjugate, confirmed by mass spectrometry and NMR analysis, results from extensive optimization across multiple steps in the synthesis route. Notably, using different strategies for the azide substitution and the Cu(I)-catalyzed cycloaddition reaction enabled the development of a more efficient and reproducible synthesis pathway. The final product, FA-Trz-Luna, showed encouraging yields, indicating the successful conjugation process. The conjugated peptide Lunatin-folate offers a dual-functional platform, combining the antimicrobial and anti-cancer properties of Lunatin-1 with the targeting capability of folate. Future work will focus on evaluating the biological activities of FA-Trz-Luna, particularly its cytotoxicity against neoplastic cell lines and its antimicrobial properties. Additionally, scaling up the synthesis and exploring modifications to optimize its pharmacokinetic properties will be crucial for advancing this conjugate toward clinical applications.

Supplementary Materials

The following supporting information can be downloaded at: https://www.mdpi.com/article/10.3390/org6010008/s1. Figure S1—Images of the reaction systems used in liquid and solid-phase synthesis. (A) Reflux apparatus for FA-Pra synthesis, (B) vacuum filtration of DCU, (C) FA-Pra suspended in cold diethyl ether, (D) filtered FA-Pra and (E) resin, porous filter and syringe used in solid-phase synthesis; Figure S2—ATR-FTIR spectrum of the FA-Pra synthesis product; Figure S3—¹H NMR spectrum at 300 MHz of Pra (0.03 mmol·mL−¹) in CDCl₃ containing 0.5% (v/v) TMS. Figure S4—Chromatographic profile of the crude sample of the tripeptide FIG-NH2; Figure S5—¹H NMR spectrum at 300 MHz of the tripeptide FIG-NH2 (50 mmol·L−1) in water containing 10% (v/v) D2O and 1% (v/v) DSS; Figure S6—[1H,1H] TOCSY NMR spectrum at 300 MHz of Br-FIG-NH2 (30 mmol·L−1) in DMSO-d6 containing 0.5% (v/v) TMS. (A) Enlargement of the amide hydrogen region; (B) Enlargement of the side-chain hydrogen region. (C) [¹H,¹³C] HSQC NMR spectrum at 300 MHz of the tripeptide FIG-NH2 (50 mmol·L−1) in water containing 10% (v/v) D2O and 1% (v/v) DSS; Figure S7—(A) Chromatographic profile of the raw sample of the tripeptide Br-FIG-NH2. The analysis was performed using reversed-phase HPLC in a C18 Vydac 218TP column (4.6 mm × 250 mm, GraceTM) equilibrated with 0.1% aqueous TFA followed by a linear gradient of acetonitrile in 0.1% TFA of 0–100% acetonitrile for 0–30 min. The flow was 0.80 ml. min−1 and detection was at 214 nm. (B) Mass spectrum obtained by MALDI-ToF in MS mode of the crude sample of the tripeptide Br-FIG-NH2. [M+H]+ theor represents the theoretical mass/charge, and [M+H]+calc represents the calculated mass in g·mol¹; Figure S8—ATR-FTIR spectrum of the product Br-FIG-NH2 from step 1 and the tripeptide FIG-NH2; Figure S9—Mass spectrum obtained by MALDI-ToF in MS mode of the crude sample of the tripeptide N3-FIG[2a]-NH2; Figure S10—ATR-FTIR spectra of the products from step 2 and the Br-FIG-NH2 derivative; Figure S11—Mass spectrum obtained by MALDI-ToF in MS mode of the crude sample of the tripeptide (A) FA-Trz-FIG [3a-24h] and (B) FA-Trz-FIG[3b]; Figure S12—Chromatogram of Lunatin-1; Figure S13—MALDI-ToF mass spectrum in MS/MS mode of the [M+H]+ ion m/z 1442.87 Da corresponding to the Lunatin-1 peptide.

Author Contributions

Methodology, investigation, writing, A.N.d.S.; Conceptualization, writing—review and editing, R.M.V. and A.M.d.C.P. All authors have read and agreed to the published version of the manuscript.

Funding

FAPEMIG (Fundação de auxílio à Pesquisa do Estado de Minas Gerais) RED-00185-23, Conselho Nacional de Desenvolvimento Científico e Tecnológico (CNPq), CAPES (CAPES/COFECUB—processo 88887.879070/2023-00).

Data Availability Statement

Data are contained within the article and Supplementary Materials.

Acknowledgments

A.N.S. acknowledge grants from Conselho Nacional de Desenvolvimento Científico e Tecnológico (CNPq) and Coordenação de Aperfeiçoamento de Pessoal de Nível Superior (CAPES). We also thank the FAPEMIG (Fundação de auxílio à Pesquisa do Estado de Minas Gerais) and Rede Mineira de Peptídeos (Rede PEPBIO).

Conflicts of Interest

The authors declare no conflict of interest.

References

  1. Chokshi, A.; Sifri, Z.; Cennimo, D.; Horng, H. Global contributors to antibiotic resistance. J. Glob. Infect. Dis. 2019, 11, 36. [Google Scholar] [CrossRef] [PubMed]
  2. Ragheb, M.N.; Thomason, M.K.; Hsu, C.; Nugent, P.; Gage, J.; Samadpour, A.N.; Kariisa, A.; Merrikh, C.N.; Miller, S.I.; Sherman, D.R.; et al. Inhibiting the Evolution of Antibiotic Resistance. Mol. Cell 2019, 73, 157–165.e5. [Google Scholar] [CrossRef]
  3. Alcock, B.P.; Raphenya, A.R.; Lau, T.T.; Tsang, K.K.; Bouchard, M.; Edalatmand, A.; Huynh, W.; Nguyen, A.L.; Cheng, A.A.; Liu, S.; et al. CARD 2020: Antibiotic resistome surveillance with the comprehensive antibiotic resistance database. Nucleic Acids Res. 2019, 48, D517–D525. [Google Scholar] [CrossRef] [PubMed]
  4. Kumar, R.; Chaudhary, K.; Gupta, S.; Singh, H.; Kumar, S.; Gautam, A.; Kapoor, P.; Raghava, G.P. CancerDR: Cancer Drug Resistance Database. Sci. Rep. 2013, 3, 1445. [Google Scholar] [CrossRef] [PubMed]
  5. Koehbach, J.; Craik, D.J. The Vast Structural Diversity of Antimicrobial Peptides. Trends Pharmacol. Sci. 2019, 40, 517–528. [Google Scholar] [CrossRef]
  6. Avci, F.G.; Sariyar Akbulut, B.; Ozkirimli, E. Membrane Active Peptides and Their Biophysical Characterization. Biomolecules 2018, 8, 77. [Google Scholar] [CrossRef] [PubMed]
  7. Marquette, A.; Bechinger, B. Biophysical Investigations Elucidating the Mechanisms of Action of Antimicrobial Peptides and Their Synergism. Biomolecules 2018, 8, 18. [Google Scholar] [CrossRef] [PubMed]
  8. Henriques, S.T.; Melo, M.N.; Castanho, M.A.R.B. How to address CPP and AMP translocation? Methods to detect and quantify peptide internalization in vitro and in vivo (Review). Mol. Membr. Biol. 2007, 24, 173–184. [Google Scholar] [CrossRef] [PubMed]
  9. Ma, X.; Wang, Q.; Ren, K.; Xu, T.; Zhang, Z.; Xu, M.; Rao, Z.; Zhang, X. A Review of Antimicrobial Peptides: Structure, Mechanism of Action, and Molecular Optimization Strategies. Fermentation 2024, 10, 540. [Google Scholar] [CrossRef]
  10. Gagandeep, K.R.; Narasingappa, R.B.; Vyas, G.V. Unveiling mechanisms of antimicrobial peptide: Actions beyond the membranes disruption. Heliyon 2024, 10, e38079. [Google Scholar] [CrossRef]
  11. Gupta, S.D.; Halder, B.; Gomes, A.; Gomes, A. Bengalin initiates autophagic cell death through ERK–MAPK pathway following suppression of apoptosis in human leukemic U937 cells. Life Sci. 2013, 93, 271–276. [Google Scholar] [CrossRef] [PubMed]
  12. Felício, M.R.; Silva, O.N.; Gonçalves, S.; Santos, N.C.; Franco, O.L. Peptides with Dual Antimicrobial and Anticancer Activities. Front. Chem. 2017, 5, 5. [Google Scholar] [CrossRef]
  13. Junior, E.F.; Guimarães, C.F.; Franco, L.L.; Alves, R.J.; Kato, K.C.; Martins, H.R.; de Souza Filho, J.D.; Bemquerer, M.P.; Munhoz, V.H.; Resende, J.M.; et al. Glycotriazole-peptides derived from the peptide HSP1: Synergistic effect of triazole and saccharide rings on the antifungal activity. Amino Acids 2017, 49, 1389–1400. [Google Scholar] [CrossRef] [PubMed]
  14. Dai, Y.; Cai, X.; Bi, X.; Liu, C.; Yue, N.; Zhu, Y.; Zhou, J.; Fu, M.; Huang, W.; Qian, H. Synthesis and anti-cancer evaluation of folic acid-peptide- paclitaxel conjugates for addressing drug resistance. Eur. J. Med. Chem. 2019, 171, 104–115. [Google Scholar] [CrossRef]
  15. Chen, J.; Li, S.; Shen, Q. Folic acid and cell-penetrating peptide conjugated PLGA–PEG bifunctional nanoparticles for vincristine sulfate delivery. Eur. J. Pharm. Sci. 2012, 47, 430–443. [Google Scholar] [CrossRef]
  16. Silva, A.R.; Guimarães, M.S.; Rabelo, J.; Belén, L.H.; Perecin, C.J.; Farías, J.G.; Santos, J.H.; Rangel-Yagui, C.O. Recent advances in the design of antimicrobial peptide conjugates. J. Mater. Chem. B 2022, 10, 3587–3600. [Google Scholar] [CrossRef]
  17. de Sousa Gomes, K. Relação Estrutura-Atividade do Peptídeo Sintético Lunatina-1 e Seus Derivados na Citotoxicidade de Diferentes Linhagens Celulares. Ph.D. Thesis, Universidade Federal de Minas Gerais, Belo Horizonte, Brazil, 2018. [Google Scholar]
  18. Puvvada, N.; Rajput, S.; Kumar, B.P.; Sarkar, S.; Konar, S.; Brunt, K.R.; Rao, R.R.; Mazumdar, A.; Das, S.K.; Basu, R.; et al. Novel ZnO hollow-nanocarriers containing paclitaxel targeting folate-receptors in a malignant pH-microenvironment for effective monitoring and promoting breast tumor regression. Sci. Rep. 2015, 5, 11760. [Google Scholar] [CrossRef]
  19. Chan, W.; White, P. Fmoc Solid Phase Peptide Synthesis: A Practical Approach; OUP Oxford: Oxford, UK, 1999. [Google Scholar]
  20. Kaiser, E.; Colescott, R.L.; Bossinger, C.D.; Cook, P.I. Color test for detection of free terminal amino groups in the solid-phase synthesis of peptides. Anal. Biochem. 1970, 34, 595–598. [Google Scholar] [CrossRef]
  21. Torres, L.M.F.C. Síntese de Nanoestruturas de Alumina Contendo o Peptídeo Antimicrobiano BP100 para Aplicações Biotecnológicas. Ph.D. Thesis, Universidade Federal dos Vales do Jequitinhonha e Mucuri, Diamantina, Brazil, 2018. [Google Scholar]
  22. Coessens, V.; Matyjaszewski, K. End group transformation of polymers prepared by atrp, substitution to azides. J. Macromol. Sci. Part A 1999, 36, 667–679. [Google Scholar] [CrossRef]
  23. Ghaffar, K.; Hussein, W.; Khalil, Z.; Capon, R.; Skwarczynski, M.; Toth, I. Levofloxacin and Indolicidin for Combination Antimicrobial Therapy. Curr. Drug Deliv. 2015, 12, 108–114. [Google Scholar] [CrossRef] [PubMed]
  24. Bax, A.D.; Davis, D.G. MLEV-17-based two-dimensional homonuclear magnetization transfer spectroscopy. J. Magn. Reson. (1969) 1985, 65, 355–360. [Google Scholar] [CrossRef]
  25. Delaglio, F.; Grzesiek, S.; Vuister, G.; Zhu, G.; Pfeifer, J.; Bax, A. NMRPipe: A multidimensional spectral processing system based on UNIX pipes. J. Biomol. NMR 1995, 6, 277–293. [Google Scholar] [CrossRef] [PubMed]
  26. Johnson, B.A.; Blevins, R.A. NMR View: A computer program for the visualization and analysis of NMR data. J. Biomol. NMR 1994, 4, 603–614. [Google Scholar] [CrossRef]
  27. Dutta, S.; Hartkopf-Fröder, C.; Witte, K.; Brocke, R.; Mann, U. Molecular characterization of fossil palynomorphs by transmission micro-FTIR spectroscopy: Implications for hydrocarbon source evaluation. Int. J. Coal Geol. 2013, 115, 13–23. [Google Scholar] [CrossRef]
  28. Müller, C.; Reuter, S.; Wille, J.; Xanthopoulou, K.; Stefanik, D.; Grundmann, H.; Higgins, P.G.; Seifert, H. A global view on carbapenem-resistant Acinetobacter baumannii. mBio 2023, 14, e02260-23. [Google Scholar] [CrossRef]
  29. Wu, Z.; Li, X.; Hou, C.; Qian, Y. Solubility of Folic Acid in Water at pH Values between 0 and 7 at Temperatures (298.15, 303.15, and 313.15) K. J. Chem. Eng. Data 2010, 55, 3958–3961. [Google Scholar] [CrossRef]
  30. Nascimento, C. Ressonância Magnética Nuclear; BlucherLTDA: São Paulo, Brazil, 2018. [Google Scholar]
  31. Mirkin, N.G.; Krimm, S. Structural Dependence of NH Stretch Mode Frequency Shifts in Amide and Peptide Systems. J. Phys. Chem. A 2004, 108, 5438–5448. [Google Scholar] [CrossRef]
  32. Surewicz, W.K.; Mantsch, H.H.; Chapman, D. Determination of protein secondary structure by Fourier transform infrared spectroscopy: A critical assessment. Biochemistry 1993, 32, 389–394. [Google Scholar] [CrossRef] [PubMed]
  33. Bratu, I.; Grecu, R.; Constantinescu, R.; Iliescu, T. Molecular relaxation processes of 2-bromopropane in solutions from IR ν(C–Br) band shape analysis. Spectrochim. Acta A Mol. Biomol. Spectrosc. 1998, 54, 501–506. [Google Scholar] [CrossRef]
  34. Keeler, J. Understanding NMR Spectroscopy; Wiley: Chichester, UK, 2011. [Google Scholar]
  35. Li, K.; Xue, D. Estimation of Electronegativity Values of Elements in Different Valence States. J. Phys. Chem. A 2006, 110, 11332–11337. [Google Scholar] [CrossRef] [PubMed]
  36. Phelan, J.; Altharawi, A.; Chan, K.L.A. Tracking glycosylation in live cells using FTIR spectroscopy. Talanta 2020, 211, 120737. [Google Scholar] [CrossRef] [PubMed]
  37. Kaushik, C.P.; Kumar, K.; Singh, S.K.; Singh, D.; Saini, S. Synthesis and antimicrobial evaluation of 1,4-disubstituted 1,2,3-triazoles with aromatic ester functionality. Arab. J. Chem. 2016, 9, 865–871. [Google Scholar] [CrossRef]
Figure 1. Schematic representation of the synthetic route steps for obtaining the peptide-folate conjugate.
Organics 06 00008 g001
Figure 2. H NMR spectra (300 MHz) for (A) FA (40 mmol·L−1) shown in red and FA-Pra (20 mmol·L−1) shown in blue, both respectively in DMSO-d₆ containing 0.5% (v/v) TMS. (B) Expansion of the carboxyl hydrogen region of the 1H NMR spectra at 300 MHz of FA (40 mmol·L−1) and FA-Pra (40 mmol·L−1) in DMSO-d₆ containing 0.5% (v/v) TMS.
Organics 06 00008 g002
Figure 3. H,1H] TOCSY NMR spectrum at 300 MHz of Br-FIG (30 mmol·L−1) in DMSO-d6 containing 0.5% (v/v) TMS. (A) Enlargement of the amide hydrogen region; (B) Enlargement of the side-chain hydrogen region; (C) [1H,13C] HSQC NMR spectrum at 300 MHz of Br-FIG-NH2 (30 mmol·L−1) in DMSO-d₆ containing 0.5% (v/v) TMS.
Organics 06 00008 g003
Figure 4. Chromatographic profile of the crude samples of the tripeptides N3-FIG[2a]-NH2 and N3-FIG[2b]-NH2. The analysis was performed using reversed-phase HPLC in a C18 Vydac 218TP column (4.6 mm × 250 mm, GraceTM) equilibrated with 0.1% aqueous TFA followed by a linear gradient of acetonitrile in 0.1% TFA of 0–100% acetonitrile for 0–40 min. The flow was 0.80 mL·min−1 and detection was at 214 nm.
Organics 06 00008 g004
Figure 5. Superimposed [1H,1H] TOCSY spectrum of Br-FIG-NH2 (blue) (30 mmol·L−1) and N3-FIG[2a]-NH2 (purple) (35 mmol·L−1) in DMSO-d6. (A) Enlargement of the amide hydrogen region; (B) Enlargement of the side-chain region. (C) [1H,13C] HSQC NMR spectrum at 300 MHz of N3-FIG[2a]-NH2 (35 mmol·L−1) in DMSO-d6 containing 0.5% (v/v) TMS.
Organics 06 00008 g005
Figure 6. Chromatographic profile of the crude sample of the tripeptide FA-Trz-FIG[3a−72h]-NH2 and FA-Trz-FIG[3b]-NH2 and purified N3-FIG[2b]-NH2. The analysis was performed using reversed-phase HPLC in a C18 Vydac218TP column (4.6 mm × 250 mm, GraceTM) equilibrated with 0.1% aqueous TFA followed by a linear gradient of acetonitrile in 0.1% TFA of 0–100% acetonitrile for 0–30 min. The flow was 0.80 mL·min−1 and detection was at 214 nm.
Organics 06 00008 g006
Figure 7. Structural characterization of the FA-Trz-FIG derivatives. (A) Infrared spectrum of the peptide-folate conjugates FA-Trz-FIG[3a_24h]-NH2 and FA-Trz-FIG[3b]-NH2. (B) Enlargement of the amide hydrogen region of FA-Trz-FIG[3a_24h]-NH2 (0.04 mmol·mL−1) and FA-Trz-FIG[3b]-NH2 in DMSO-d6 containing 0.5% (v/v) TMS.
Organics 06 00008 g007
Figure 8. Mass spectrum obtained by MALDI-ToF of the crude peptide sample. (A) Br-Luna; (B) N3-Luna; (C) FA-Trz-Luna.
Organics 06 00008 g008
Table 1. Description and abbreviations of the characterized materials.
Reagents/PeptidylAcronyms
Folic AcidFA
PropargylaminePra
6-Bromohexanoic AcidBr-Ac
Propargylated Derivative of Folic AcidFA-Pra
PeptidesFIG-NH2/Luna
Stage 1Br-FIG-NH2/Br-Luna
Stage 2aN3-FIG [2a]-NH2
Stage 2bN3-FIG[2b]-NH2/N3-Luna
Stage 3aFA-Trz-FIG[3a_6h]-NH2
FA-Trz-FIG[3a_24h]-NH2
FA-Trz-FIG[3a_48h]-NH2
FA-Trz-FIG[3a_72h]-NH2
Stage 3bFA-Trz-FIG[3b]-NH2
Disclaimer/Publisher’s Note: The statements, opinions and data contained in all publications are solely those of the individual author(s) and contributor(s) and not of MDPI and/or the editor(s). MDPI and/or the editor(s) disclaim responsibility for any injury to people or property resulting from any ideas, methods, instructions or products referred to in the content.

