Article

DDoS Attacks Detection in SDN Through Network Traffic Feature Selection and Machine Learning Models

by
Edith Paola Estupiñán Cuesta
,
Juan Carlos Martínez Quintero
* and
Juan David Avilés Palma
Telecommunications Engineering Program, Faculty of Engineering, Universidad Militar Nueva Granada, Bogotá 110111, Colombia
*
Author to whom correspondence should be addressed.
Telecom 2025, 6(3), 69; https://doi.org/10.3390/telecom6030069
Submission received: 21 July 2025 / Revised: 10 September 2025 / Accepted: 15 September 2025 / Published: 19 September 2025

Abstract

This research presents a methodology for the detection of distributed denial-of-service (DDoS) attacks in software-defined networks (SDNs). An SDN was configured using the Mininet simulator, the Open Daylight controller, and a web server, which acted as the target to execute a DDoS attack on the HTTP protocol. The attack tools GoldenEye, Slowloris, HULK, Slowhttptest, and XerXes were used, and two datasets were built using the CICFlowMeter and NTLFlowLyzer flow and feature generation tools, with 424,922 and 731,589 flows, respectively, as well as two independent test datasets. These tools were used to compare their functionalities and efficiency in generating flows and features. Finally, the XGBoost and Random Forest models were evaluated with each dataset, with the objective of identifying the model that provides the best classification result in the detection of malicious traffic. For the XGBoost model, the accuracy results were 99.48% and 97.61%, while for the Random Forest model, better results were obtained with 99.97% and 99.99% using the CIC-Dataset and NTL-Dataset, respectively, in both cases. This allows determining that the Random Forest model outperformed XGBoost in classification, as it achieved the lowest false negative rate of 0.00001 using the NTL-Dataset.

1. Introduction

Software-defined networks (SDNs) represent a new approach in telecommunications network architecture, enhancing scalability, programmability, and the management of network services through virtualization. This model enables administrators to configure and manage the network in a centralized manner, facilitating adaptation to the increasing number of devices connected to the Internet, the advancement of the Internet of Things (IoT), and the growth of network traffic, all of which require greater productivity and optimization of the available network resources [1,2]. Therefore, SDNs have become a technology that provides innovative solutions that are key to meeting the massive demand for Internet use and complementing the development of cloud computing and IoT by incorporating its approach based on centralized and programmable network control, which decouples the control and data planes and provides greater efficiency in infrastructure management [3].
Since their inception, telecommunication networks have relied on static architectures composed of routers, switches, end devices, and security appliances, whose management is performed manually, making it a complex and error-prone process. To address this limitation, SDNs introduce the open standard protocol OpenFlow and the implementation of network controllers, which facilitate the automation and management of modern infrastructures such as data centers, wide area networks (SD-WAN), cloud networks, mobile networks, and IoT environments [4]. However, this centralized control model also introduces a single point of failure: the controller. As it is responsible for coordinating all switches, its availability and performance are critical for network operation. A distributed denial-of-service (DDoS) attack targeting either the network or the controller itself can exhaust its computing and communication resources, thereby compromising the availability of the entire infrastructure.
In this scenario, the early detection of anomalous traffic becomes a priority. Traditional methods based on static rules or signatures are insufficient against the continuous evolution of attacks, paving the way for approaches based on machine learning [5]. By analyzing statistical features of network flows, these models can identify patterns that distinguish benign traffic from malicious traffic and adapt to variations in attack intensity and strategy. Thus, the integration of classifiers into the SDN control plane offers a practical mitigation strategy, as it enables anticipating and responding to DDoS attacks before the controller collapses, thereby strengthening network resilience [6].
In this context, numerous studies have explored the application of machine learning and deep learning for attack detection in traditional networks. In [7,8,9,10], several solutions were proposed to mitigate denial-of-service (DoS), distributed denial-of-service (DDoS), and low-rate DDoS (LR-DDoS) attacks. For instance, ref. [11] implemented a convolutional neural network (CNN) to detect DoS attacks in conventional networks, achieving an accuracy of 98% and 99% in multiclass and binary classification, respectively. Similarly, ref. [12] employed an echo state network (ESN), based on recurrent neural networks, to detect DDoS attacks in IoT, reaching an accuracy above 99%. While deep learning methods have proven effective, machine learning approaches remain more common due to their efficiency and lower resource consumption when processing large volumes of data. In [13], models such as XGBoost, MLP, and Random Forest, combined with feature selection methods like particle swarm optimization (PSO), were employed to enhance detection performance in DoS attacks on IoT.
On the other hand, recent studies have leveraged public datasets such as InSDN, KDD, and, particularly, CICDDoS, developed by the Canadian Institute for Cybersecurity. This dataset includes benign traffic and DDoS attack traffic in 13 variants and multiple versions. Its 2019 edition has become a benchmark in the cybersecurity field and was employed in [14] to evaluate multiple machine learning algorithms, including XGB, KNN, RF, SVM, and ADA [15,16]. However, studies such as [17,18] emphasize the importance of developing detection approaches tailored specifically to SDNs. These works highlight that in the few cases where custom datasets are built, there is often a lack of clarity regarding their generation process, and they are not openly published, limiting reproducibility and applicability. Moreover, ref. [18] concludes that most proposals rely on public datasets with features designed for traditional networks, reducing their effectiveness in SDN environments.
Unlike prior work, the present research develops a dataset specifically tailored for an SDN environment and compares the feature extraction tools CICFlowMeter [19] and NTLFlowLyzer [20]. Their attributes are analyzed along with their impact on the number of flows generated, conversion time, and identification of the most relevant features in each dataset, with the aim of assessing their implementation in machine learning models. This comparison has not been previously addressed and constitutes a novel contribution, as it provides valuable input for future research seeking to develop customized detection solutions based on updated datasets and the analysis of traffic patterns inherent to SDNs.
Additionally, classification models built from relevant features enable the advancement toward intelligent monitoring and anomaly response systems within SDNs, thereby strengthening dynamic defense in scalable networks. These applications include early attack detection, automated mitigation policy enforcement, and more efficient management of control resources through applications integrated into controllers.
Finally, this study is structured into five sections. The first section introduces the motivation and contributions of this research. The second section presents methodological development. The third section describes the results obtained and their discussion. The final section presents the conclusions of this study, followed by the references.

2. Methodology

Figure 1 shows the methodology used in the development of this research. Five phases are defined. Initially, a review of the background and articles related to DDoS attack detection approaches in SDNs was conducted. Secondly, the simulation scenario of the software-defined network was designed using Mininet, the ODL controller, 3 switches, 9 hosts, and a web server. In Phase 3, the attack generation process and the construction of the datasets were carried out using the CICFlowMeter and NTLFlowLyzer tools. In Phase 4, the Random Forest and XGBoost machine learning models were trained and tested. Finally, the corresponding analysis of the results for DDoS attack detection was performed.

2.1. Phase 1: Background

2.1.1. Theoretical Framework—SDNs and DDoS

The SDN architecture is mainly composed of three decoupled layers: the application layer, the control layer, and the data layer. Additionally, there are the northbound and southbound interfaces, which enable communication between layers, allowing the programmability and management of forwarding rules and network devices [21]. However, the programmability and centralization of the SDN architecture introduce new vulnerabilities and make it susceptible to DDoS attacks by exposing a single point of failure, as all the network logic and control are isolated.
On the other hand, distributed denial-of-service (DDoS) attacks represent the main threat to the centralization of the controller, as they affect the entire SDN network since all devices depend on the controllers to make forwarding decisions. Furthermore, communication between the control and data planes, through interfaces such as Open Flow, can be exploited using techniques like packet-in flooding, generating congestion or resource exhaustion in both the switch and the controller. Finally, the lack of adequate storage in switches and controllers, combined with the absence of security standards for the northbound and southbound interfaces, creates vulnerabilities that can be leveraged by DDoS attacks targeting any plane of the SDN architecture [22]. These vulnerabilities have been the focus of many SDN research efforts, such as the study conducted in [22], which analyzes SDN security by examining the impact of the architecture, threat vectors, and types of attacks that exploit vulnerabilities and misconfigurations in SDNs, affecting different layers within its architecture. Among the various threats to SDNs, DDoS attacks stand out due to their impact on the performance and availability of devices and networks under attack. Their main characteristic is their distributed nature, meaning the attack is launched from multiple sources to overwhelm a target, as illustrated in Figure 2. These attacks may target a specific service or device. In SDNs, such attacks can exploit both the data plane, causing saturation, and the control plane, directly compromising the SDN controller [23].
Figure 3 presents a classification of different types of DDoS attacks, grouped into three main categories according to their target and execution technique: volumetric attacks, resource exhaustion attacks, and application-layer attacks. Volumetric attacks saturate the network bandwidth with large volumes of traffic, such as ICMP floods or UDP floods, and amplification techniques like Smurf attacks. Resource exhaustion attacks include exploit protocol or system vulnerabilities, such as malformed packets or TCP connection exhaustion. Finally, application-layer attacks target specific services such as DNS, HTTP, or SIP in order to affect the availability of critical applications.
Consequently, to apply a DDoS attack detection approach in any of its categories, it is essential to perform data extraction and transformation to ensure the data is fully processable by a deep learning or machine learning model. Several tools exist for flow generation and feature extraction, such as Pcap2Flow, Joy Cisco, and Wireshark/tshark, which differ in purpose, number of extracted features, and conversion time.
CICFlowMeter and NTLFlowLyzer, in contrast, are more comprehensive tools for extracting useful features and statistics, making them well-suited for generating data to train machine learning models for anomaly detection. Both tools process packet capture (PCAP) files and convert them into flows in comma-separated values (CSV) format. Each flow, that is, each row of the dataset, represents the information of a group of packets in logical communication. CICFlowMeter generates unidirectional flows, whereas NTLFlowLyzer additionally supports the analysis and extraction of bidirectional flows [20].
Figure 4 shows an example of the conversion from PCAP files to CSV performed by the CICFlowMeter and NTLFlowLyzer tools. The blue box displays a fragment of a PCAP file, which contains detailed records of individual packets captured on a network. Each row represents a packet, with information such as capture time, source and destination IP addresses, protocol, and involved ports. For example, the packets highlighted in red and yellow correspond to different communications involving various protocols and ports. These packets are grouped and processed by tools to form network flows.
On the right, in the green box, the result of this processing is shown: a CSV file where each row represents an aggregated network flow that summarizes multiple packets belonging to the same logical communication. The rows in the green box correspond to the highlighted packets in the PCAP file, now condensed into flows with information such as IP addresses, source and destination ports, protocols, and timestamps. This transformation enables the generation of more structured and manageable data, consisting of statistical features useful for training artificial intelligence models in tasks such as classification and anomaly detection.
On the other hand, although these tools transform the information into a format that is optimal for machine learning models, it is necessary to carry out a feature selection process, as not all inputs are useful, and reducing the feature space improves model performance. Feature selection makes it possible to identify and select the most relevant variables from a dataset to train a model, with the goal of eliminating redundant, irrelevant, or uninformative attributes. This process enhances model accuracy, reduces training time, and helps prevent overfitting.
Feature selection processes are performed using decision trees, which are predictive models that can be applied to both classification and regression tasks. Figure 5 illustrates the tree structure, where each internal node represents a question or condition based on a feature from the dataset, each branch represents a possible outcome or set of values, and the leaf nodes represent the final classifications [26].
The Random Forest model is an ensemble model that improves the performance of individual decision trees by building multiple decision trees and combining their predictions. In contrast, the Extreme Gradient Boosting (XGBoost) model is also an ensemble model, but it is based on boosting. Instead of constructing independent trees like Random Forest or Extra Trees, XGBoost builds trees sequentially, with each new tree correcting the errors of the previous one [27].

2.1.2. Literature Review

Table 1 presents several studies related to this research and identifies key variables such as the controller used, attack tools employed, machine learning and/or deep learning models implemented, dataset used, and finally the number of features considered, which corresponds to the number of columns or inputs used to train the artificial intelligence model in each case.
Table 1 highlights the use of the RYU controller in [7,10,31,32,34,36] and the ONOS controller in [17,28,29,30,35]; as well as the use of HTTP attack tools such as Slowhttptest and HULK. Additionally, among the algorithms implemented in [17,28,29,30,31,34,35,36], there is broad adoption of machine learning models, with Random Forest and SVM being among the most used. Deep learning models also stand out, as in [10], where a one-dimensional convolutional neural network (1D-CNN) for sequential data was applied; in [32], where convolutional neural networks (CNNs) were used; and in [33] where a hybrid deep learning solution was implemented. Regarding the use of public datasets, frequent use of InSDN, CICDDoS2017, CICDDoS2018, and CICDDoS2019 is noted across all studies, except in [10], where monitoring was performed within the RYU controller; in [17], where an application was configured within the ONOS controller; and in [35], where the Snort intrusion detection system (IDS) was used to create the dataset.
Table 2 analyzes previous studies that identify features such as the controller used, attack type, extraction tools, and the construction of separate training and testing datasets. This made it possible to identify key differences, such as the use of two flow extraction tools and an independent test dataset to evaluate the model’s generalization with new data and to observe the advantages of the datasets and the behavior of the models in each case.
Table 2 highlights the use of controllers such as ONOS, RYU, and POX; in this study, the ODL controller was used, representing an alternative to the approaches reported in previous research. In addition, two custom datasets were independently constructed: one for model training and another for testing. This strategy allows the evaluation of model performance on previously unseen data, which is essential to prevent overfitting, that is, when a model learns the specific patterns of the training set too well and loses its ability to generalize to new data. By separating the datasets, evaluation bias is minimized, and the generalization capability of the models is enhanced.
The datasets were generated using two feature extraction tools: CICFlowMeter [17] and NTLFlowLyzer [18], the latter representing a novel alternative for flow extraction, as it is significantly more adaptable for creating behavioral profiles, extracts a larger number of features, and facilitates the creation of more comprehensive and representative datasets for various network activities. The combined use of both tools aims to explore alternatives to traditional and outdated public datasets and to generate more realistic and relevant features for DDoS attack detection. This study provides a valuable resource for future research in SDN security aimed at developing more customized and effective DDoS attack detection solutions through the analysis of traffic feature statistics and behavioral patterns. Furthermore, the use of flow extraction tools such as NTLFlowLyzer opens up the possibility of integrating its functionalities into programmable controllers such as ONOS using compatible languages, in this case Python (version 3), which would facilitate the development of more automated and adaptive mitigation systems.

2.2. Phase 2: Scenario Design

For this research, a linear topology was defined as shown in Figure 6, using the Mininet emulator, three switches, and an Open Daylight controller to simulate the DDoS attack. In addition, the topology included nine end devices and an Apache web server as the attack target, which was subjected to attacks using five tools: GoldenEye, Slowloris, Slowhttptest, HULK, and XerXes. An Apache web server was configured on switch S1, serving as the attack target in the simulation scenario. Table 3 presents the hardware and software tools used in the simulation environment. Furthermore, Figure 6 illustrates the complete simulation scenario.
Although the linear topology used in this study exhibits low latency when employing the ODL controller, as reported in [37] this scenario does not reflect the complexity of data center architectures or large-scale networks. The implementation of broader scenarios in a virtual simulation environment increases computational resource demands. While Mininet is a widely adopted tool for SDN emulation, it presents inherent limitations due to its simplified representation of real network behaviors and its direct dependence on the host machine’s capacity [38,39]. Considering these constraints, the simulation architecture was delimited to a linear topology in accordance with the scope of the research project.
Furthermore, the OpenDayLight controller was selected for its ease of implementation and performance. Studies such as [37] report that ODL and ONOS achieve a latency of 0.4 ms in linear topologies, while RYU exhibits similar values. Complementarily, ref. [38] records for ODL a bandwidth of 62.09 Gb/s and a jitter of 0.0055 ms, outperforming controllers such as ONOS, POX, RYU, and HyperFlow. These results demonstrate that ODL provides competitive and consistent performance compared to other widely used alternatives.

Attack Execution

For the execution of the attacks, the tools Slowloris, SlowHTTPTest, HULK, GoldenEye, and XerXes were employed, configured with parameters aimed at reproducing the distinctive characteristics of a distributed DDoS attack carried out through botnets. These parameters include multiple slow and concurrent connections from different sources, persistence in connections to keep them open for the longest possible time (Slow DoS effect), and variation in traffic transmission intervals, which emulates the distribution and coordination of a network of compromised nodes. Likewise, the attack instances generate flows with homogeneous patterns, analogous to those produced by “bots” in a real Botnet [6,40].
In [41], the use of SlowHTTPTest is documented for simulating a multi-target denial-of-service attack, configured with a maximum of 10,000 concurrent connections (-c 10,000), a transmission interval of 100 s (-i 100), and 200 persistent connections, faithfully replicating the dynamics of a distributed attack typical of Botnets.
Once the characteristic patterns of a DDoS attack were identified, new experimental attack tests were conducted in which the parameters of speed, size, and frequency were varied for the attack tools: HULK, Slowloris, Slowhttptest, GoldenEye, and XerXes, with the purpose of determining the necessary parameters to execute a successful attack and to build a dataset with different scenarios. Table 4 summarizes the attack scenarios along with their respective execution parameters. For the Slowhttptest tool, a conceptual breakdown of the different parameters used for the execution of the attack is presented below:
  • -c 500: Specifies the number of concurrent connections.
  • -H: Sets the test mode to slow headers.
  • -i 10: Interval time in seconds between HTTP headers sent.
  • -r 100: Number of connections attempted per second.
  • -t GET: Type of HTTP request.
  • -u: URL or IP address of the target server.
  • -x 10: Timeout in seconds before closing open connections.
  • -p 5: Time interval in seconds between response packets.
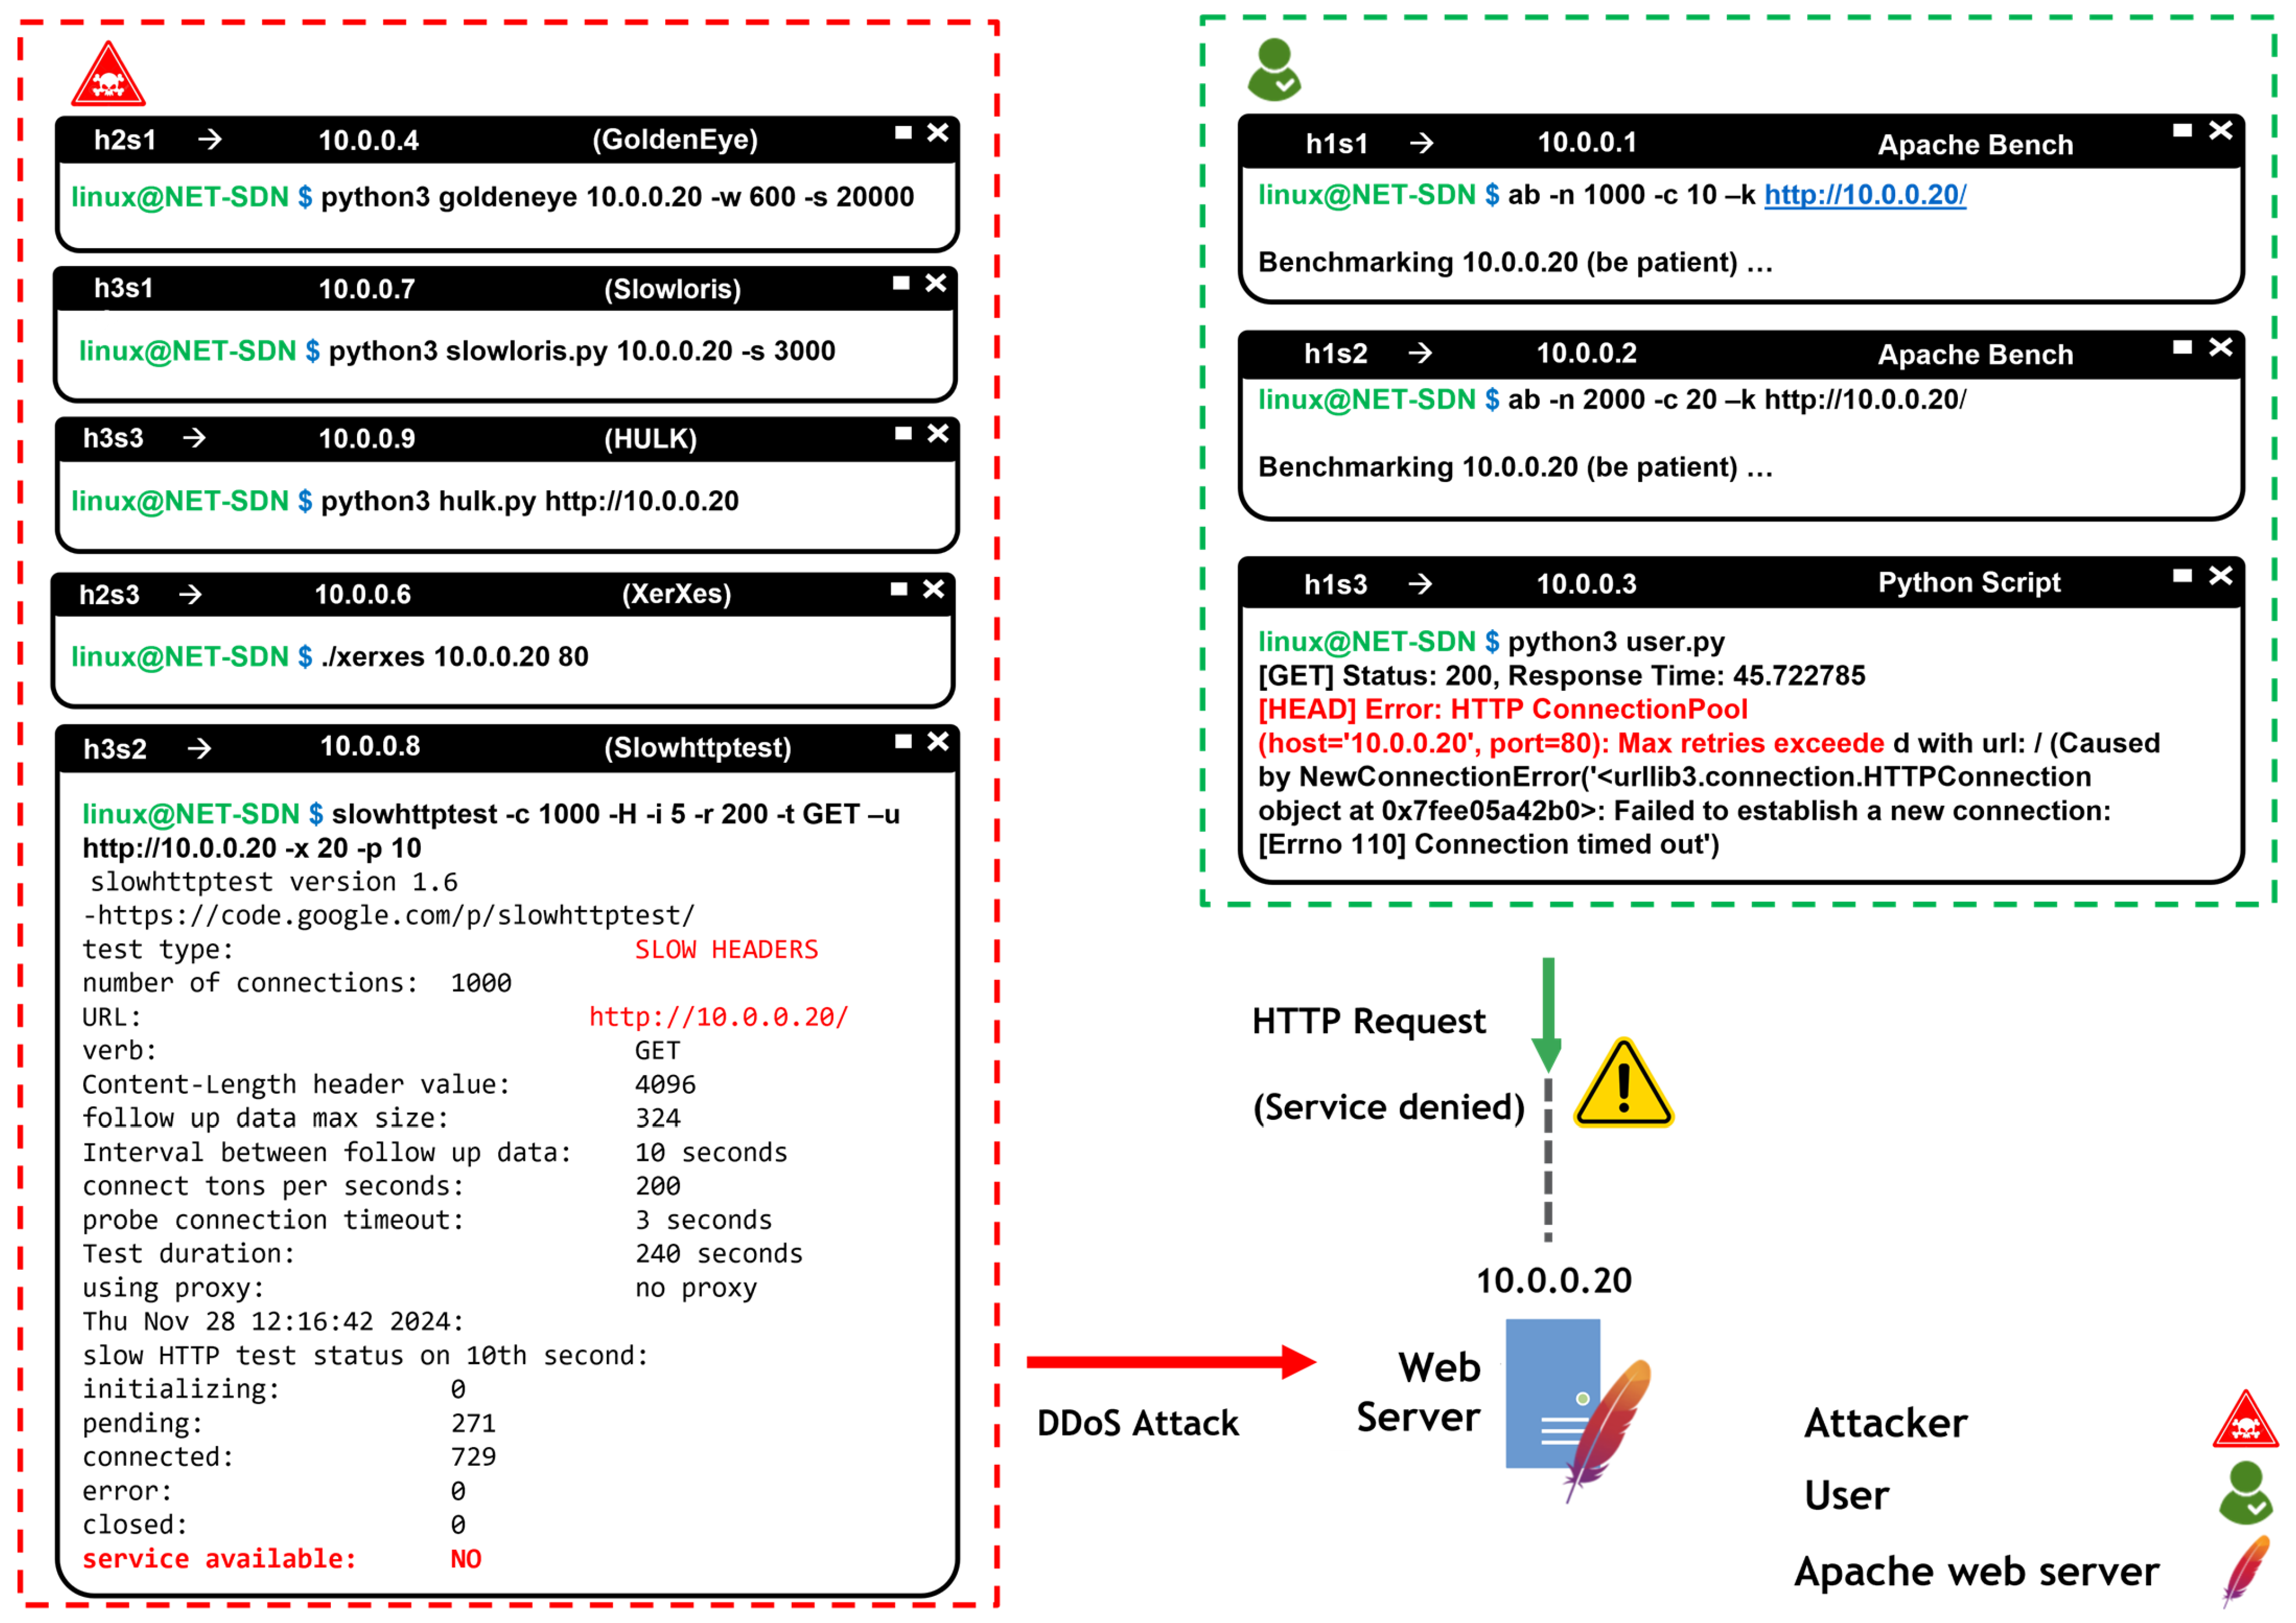
To carry out the attack on the web server, the following tools were used: Slowloris, SlowHTTP, HULK, GoldenEye, and XerXes. The devices configured as users were identified as h1s1 (IP 10.0.0.1), h1s2 (IP 10.0.0.2), and h1s3 (IP 10.0.0.3). On the other hand, the six remaining devices acted as attackers: h2s1 (IP 10.0.0.4), h2s2 (IP 10.0.0.5), h2s3 (IP 10.0.0.6), h3s1 (IP 10.0.0.7), h3s2 (IP 10.0.0.8), and h3s3 (IP 10.0.0.9). To capture both malicious and normal traffic, the Tcpdump tool was configured on the nat0-eth0 interface between the web server and switch S1. Figure 7 shows the execution of the attack, with a total duration of 4200 s. The results corresponding to the attacking devices, which simultaneously launched the DDoS attack against the web server (IP 10.0.0.20), are highlighted in red. The results of the HTTP requests sent to the web server without obtaining a response due to service saturation caused by the attack are highlighted in green.
On the other hand, the ApacheBench (ab) command-line tool was used to generate legitimate traffic by sending HTTP requests to the web server. Additionally, a Python program was implemented to automate the execution of HTTP requests from the simulated nodes in Mininet. It is worth noting that the “normal” traffic in this environment is restricted exclusively to these two sources, which does not accurately reproduce the background noise characteristic of real networks, where IoT devices, real-time video transmissions, messaging applications, and microservices with heterogeneous traffic patterns coexist.
The use of these two tools responds to the limitations of the simulation environment: (i) Mininet runs on a virtual machine with limited resources; (ii) each host corresponds to a user-space process isolated through network namespaces rather than an independent physical device; and (iii) the opening of xterm terminals for the nodes essentially represents subprocesses controlled by the same kernel. Consequently, ApacheBench and a Python script were employed as a simplified approximation of legitimate traffic, with the understanding that this constitutes a limitation of the study, which should be addressed in future work through the incorporation of more complex and diversified traffic generators.

2.3. Phase 3. Dataset Construction

Considering the scenarios presented in Table 4, the training dataset was created over seven consecutive days. Each day, traffic capture was conducted for 1200 s, divided into 600 s of normal traffic and 600 s of malicious traffic. Although the procedure was repeated daily throughout the week, the captures were not performed continuously. Instead, some configuration parameters of the attack tools were modified each day to introduce variability into the collected data. Capture times are summarized in Table 5.
The capture process lasted a total of 8400 s, equivalent to 2 h and 20 min. This procedure was carried out using the Tcpdump tool to capture network traffic in PCAP packet format. It is worth noting that in terms of PCAP file size, a 10 min traffic capture typically exceeds 8 GB of storage, which imposes significant processing overhead and time requirements when extracting flows from a single file. Figure 8 illustrates the capture and conversion process in a more generalized manner, showing that each day a 10 min traffic capture is performed for each class, followed by flow extraction using CICFlowMeter and NTLFlowLyzer.
To train machine learning models, it is necessary to transform PCAP files into a format that these models can process such as CSV. For this reason, flow and feature generation tools CICFlowMeter version 2 and NTLFlowLyzer were used which convert network packet traffic into flows. These tools were selected due to their free availability and their capability to generate flows and features which is useful for comparing the number of extracted attributes and their impact on the classification process. Although other tools like Pcap2Flow, Joy Cisco, and Wireshark tshark exist, this research evaluated only CICFlowMeter, one of the most widely used tools in research, and NTLFlowLyzer, a more recent tool that allows greater customization in its configuration.Developing a custom tool was not chosen because the project scope focused on attack detection using machine learning models and additionally on comparing flow generation processes for dataset construction. To this end, CICFlowMeter and NTLFlowLyzer were used to evaluate model performance using features extracted with different tools.
Table 6 presents the characteristics of each tool, where the most relevant configuration parameters of CICFlowMeter and NTLFlowLyzer are compared. The corresponding files used to define their parameters are identified (Constants.py in CICFlowMeter and Config.json in NTLFlowLyzer). Regarding flow inactivity timeout, CICFlowMeter employs 240 s, whereas NTLFlowLyzer was configured with the standard value of 300 s. In terms of expired flow collection (garbage collection), CICFlowMeter performs it every 1000 packets, in contrast to NTLFlowLyzer, which executes it less frequently, every 10,000 packets. Another differentiating aspect is concurrency: CICFlowMeter operates on a single thread, while NTLFlowLyzer was configured with 8 threads, as it is designed to leverage parallelism (multiple processors) [18]. Finally, both tools share the approach of generating bidirectional flows; however, NTLFlowLyzer does so separately in each direction.
Using the tools described in Table 6, two datasets were generated with the maximum number of available features: 82 columns in CICFlowMeter and 347 in NTLFlowLyzer. The resulting datasets contain 424,920 flows in CICFlowMeter and 731,580 in NTLFlowLyzer. Although both tools processed the same number of traffic files, the difference in the number of flows is due to the way each handles directionality and flow generation. CICFlowMeter separates the traffic of a connection into two unidirectional flows (forward and backward), while NTLFlowLyzer consolidates both directions into a single bidirectional flow. However, NTLFlowLyzer applies more detailed criteria for flow creation, which results in a higher number of flows overall.Unlike CICFlowMeter, NTLFlowLyzer offers greater flexibility in terms of resource consumption, as it allows configuring parameters such as the number of execution threads and memory storage thresholds, which directly impact CPU and RAM usage according to the system’s needs and capabilities. In practice, it is recommended to have at least 4 GB of RAM and 6 processors to ensure adequate performance during large-scale feature extraction.
In summary, the observed disparity originates from the design and configuration differences in each tool. Table 7 shows the distribution of flows generated per capture day.
For the test dataset, one day of capture was allocated, during which all the previously mentioned attack tools were used. The capture times were organized similarly, with 600 s of malicious traffic and 600 s of normal traffic. On the second day, a re-sampling was conducted by applying a more aggressive parameter variation with the GoldenEye tool, and malicious traffic of the HTTP flood type was included, generated by a tool not used during training, such as Scapy, which allows varying the payload. In total, the test dataset contains 126,715 and 203,675 flows for CICFlowMeter and NTLFlowLyzer, respectively. The purpose of constructing a test dataset different from the training dataset is to evaluate the model in a realistic manner and ensure that the model does not overfit the training data, allowing it to generalize and identify different types of attacks [36].
Table 8 presents the conversion times classified by tool and traffic class. Each day, two PCAP files were generated, one for attack traffic and one for normal traffic. Subsequently, each flow extraction tool was used with both captures to perform the conversion and determine the time taken by each tool to extract the features. These times vary depending on the class and the attack tool used.
On average, the NTLFlowLyzer tool takes longer than CICFlowMeter to convert packets into flows and extract features, with a total difference of approximately 7880 s. However, this increased processing time does not constitute a disadvantage for DDoS attack detection, as it does not affect the quality of the generated data nor the performance of the trained machine learning models. This difference is mentioned solely to provide a comparison between both tools in terms of efficiency and performance.
It is important to highlight that the times reported in Table 8 correspond to offline processing performed during the feature extraction stage. Since the scope of this project is limited to an offline attack detection analysis, it is not possible to estimate the real-time detection performance of the models evaluated in this study, as the times presented in Table 8 refer exclusively to the extraction process, thereby excluding data capture and decision-making times in a real environment.

Model Selection and Training

To improve the performance of the machine learning models, reduce dataset size, and prioritize the most relevant information, a feature selection process was carried out. In the first stage, tests were conducted using ReliefF and Mutual Information as reduction methods; however, both presented limitations when used in Google Colab, such as slow execution and high RAM consumption. In particular, the Mutual Information method removed relevant features, which negatively affected model performance.
Based on this, ExtraTreesClassifier was implemented as the feature selector. This method proved to be more efficient in terms of faster execution and more effective RAM usage, allowing for a more practical approach when working with large volumes of data. The main objective of this procedure is to identify and retain the most relevant features, thereby achieving lower resource consumption, faster training speed, and a significant reduction in dataset dimensionality.
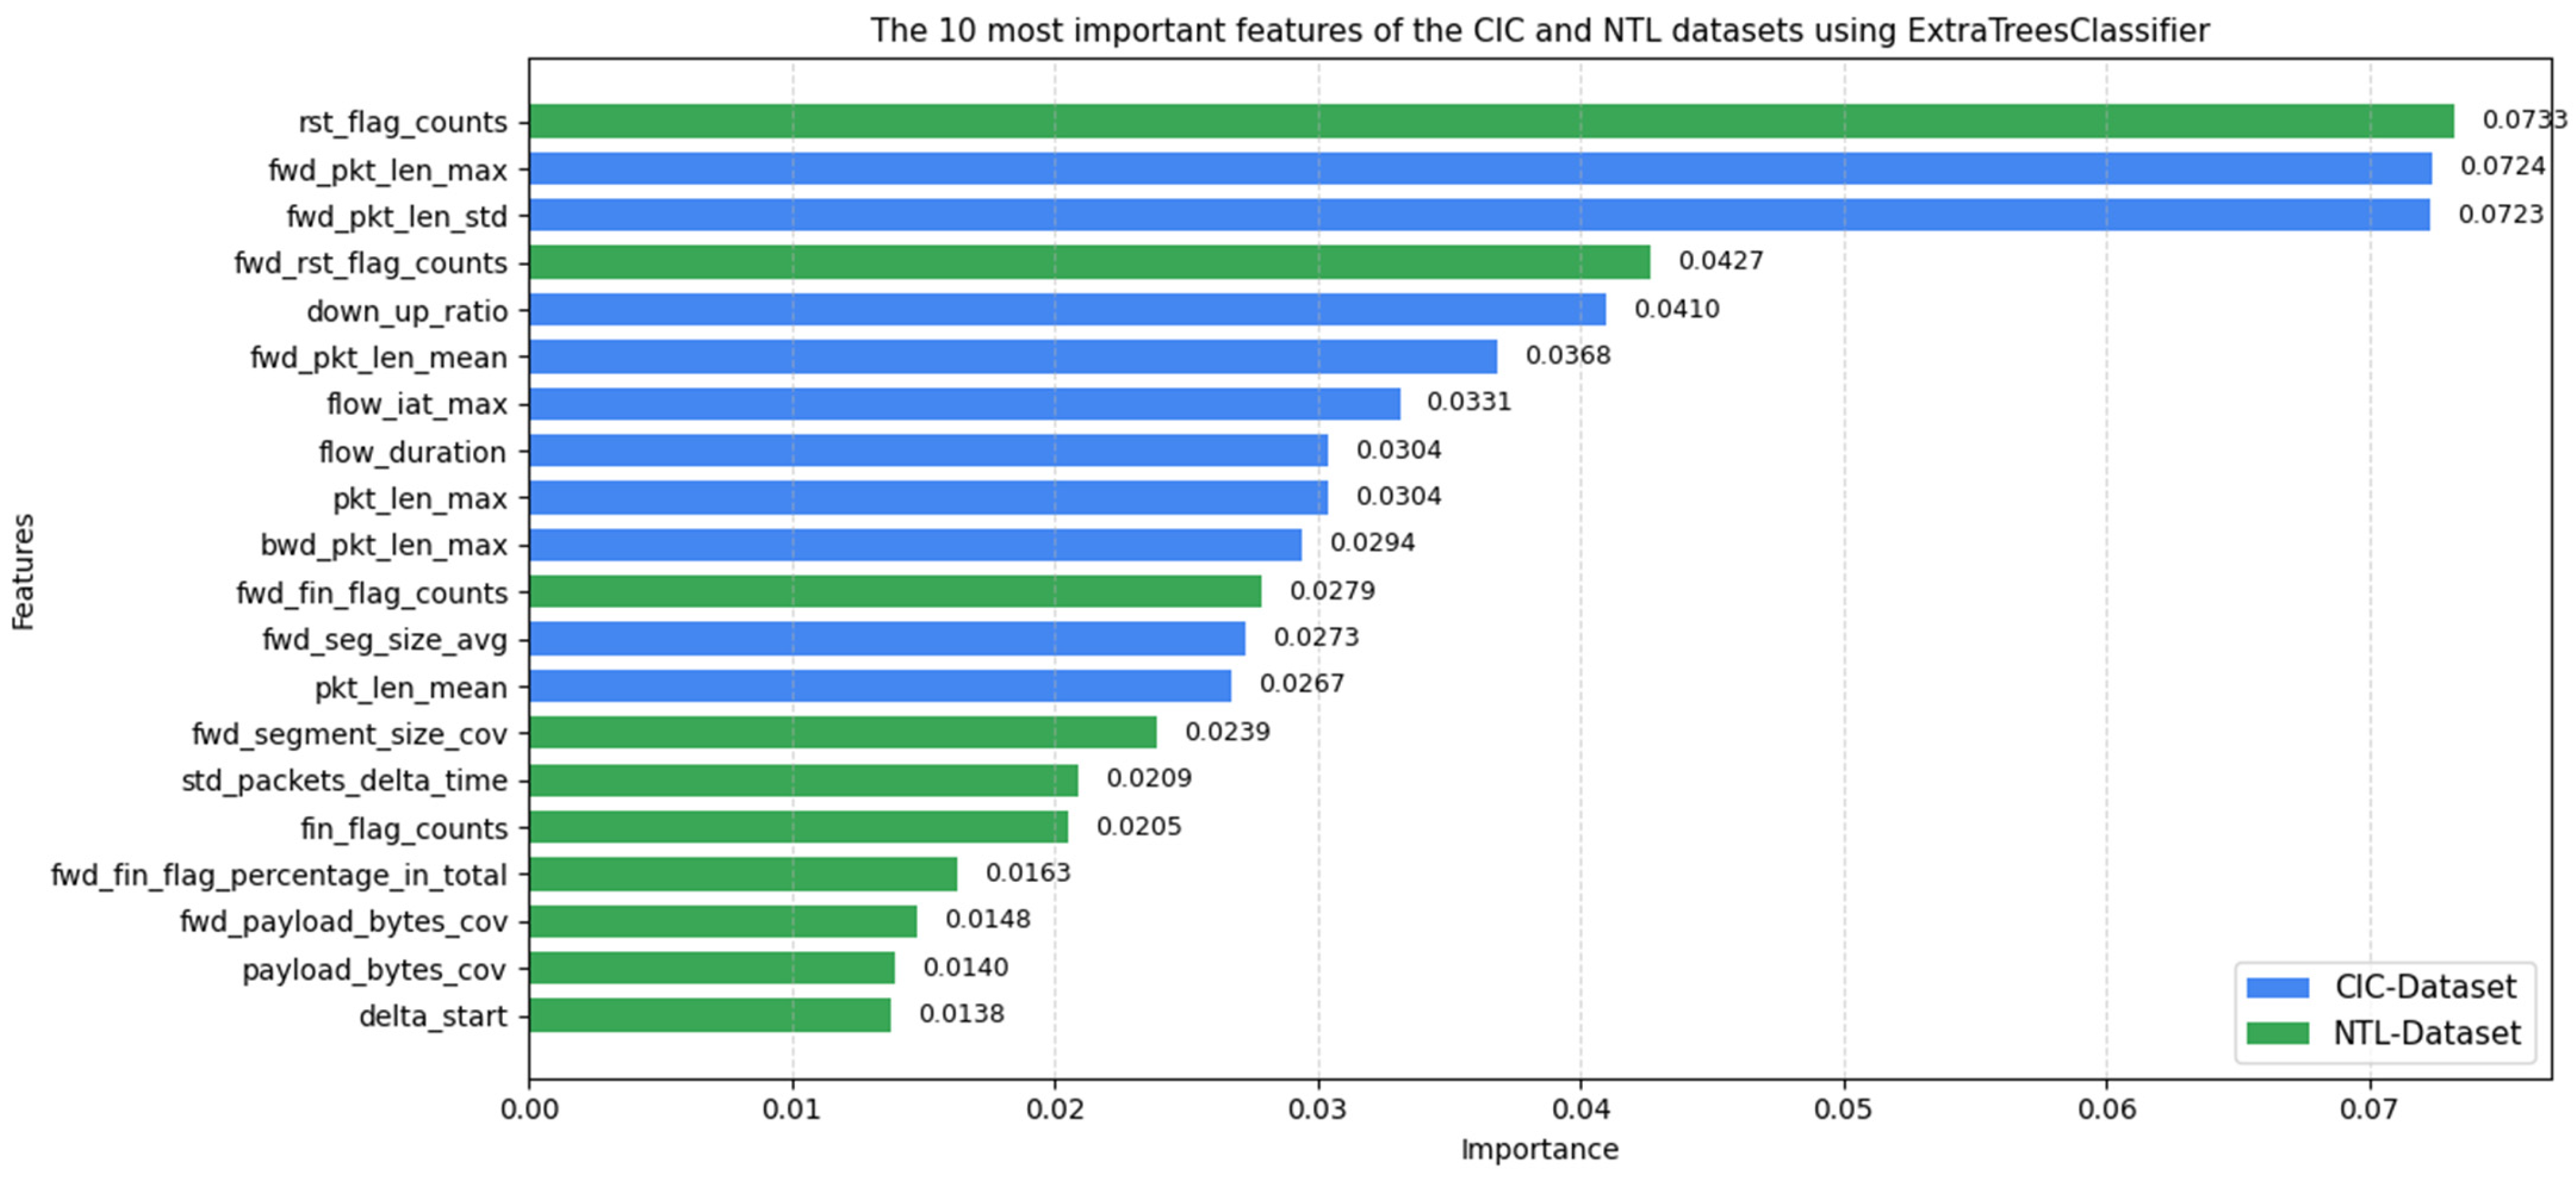
Additionally, sensitivity tests were conducted with different numbers of features to identify the minimum required to guarantee optimal performance. The results showed that a reduction to 30 features was sufficient to maintain good model performance. Likewise, the use of ExtraTreesClassifier enabled an appropriate balance between computational efficiency and the quality of malicious traffic detection. Figure 9 presents the graph of the 10 most important features for each dataset using ExtraTreesClassifier.
Before analyzing the results of Figure 9, it should be noted that a prior evaluation and selection of features was carried out for each attack tool with the purpose of determining their behavior and the impact they have on the overall results. The feature analysis made it possible to identify distinctive patterns across different application-layer denial-of-service attacks. Slowloris is characterized by irregular intervals in transmissions and prolonged idle times in return traffic, reflecting incomplete connections persistently maintained.
GoldenEye, in turn, combines large-sized HTTP requests with variable idle periods, which gives it a hybrid nature between volumetric bursts and strategic pauses. Slowhttptest exhibits long and highly variable inter-arrival times of packets, associated with the fragmented and slow transmission of requests that force the server to keep resources allocated. HULK is distinguished by the high frequency of packets with the RST flag and the use of massive requests with large maximum sizes, generating instability in connections and overloading application processing. Finally, XerXes presents high variability in packet size and a large volume of requests with significant payloads, producing a chaotic and asymmetric flow aimed at exhausting the server’s capacity.
In the global feature-importance analysis, that is, using the complete datasets, it was identified that the attacks display distinctive patterns depending on the dataset employed. In the case of the CIC-Dataset, the most relevant metrics were fwd_pkt_len_max, fwd_pkt_len_std, and fwd_pkt_len_mean, which reflect the magnitude, variability, and average size of packets sent from the client to the server. These attributes allow the characterization of volumetric-type attacks, such as GoldenEye, HULK, and XerXes, whose behavior is based on sending HTTP requests with large and fluctuating payloads that generate a sustained increase in application resource consumption.
On the other hand, in the NTL-Dataset, the most prominent features were rst_flag_counts, fwd_pkt_len_max, and down_up_ratio. The first evidence is the high frequency of packets with the RST flag, representative of attacks that cause abrupt connection terminations and resource saturation, such as HULK. The second, in agreement with the CIC-Dataset, confirms the relevance of large packets in the characterization of volumetric attacks. Finally, the third highlights the asymmetry between downstream and upstream traffic, typical of attacks in which the client massively sends requests without a proportional response from the server, as occurs in XerXes. Taken together, these results show that while the CIC-Dataset emphasizes attributes associated with packet structure and variability, the NTL-Dataset highlights indicators of connection instability and traffic flow imbalance, providing a complementary perspective on the behavior of application-layer denial-of-service attacks.
On the other hand, the selection of the machine learning model, various algorithms were evaluated considering several key criteria such as efficiency in handling large volumes of data, training time, model size, generalization capability on unseen data, and classification performance. Table 9 presents the results of this comparison among the models: Random Forest, SVM, KNN, and XGBoost. Ultimately, Random Forest and XGBoost were selected as the most suitable for this research due to their balance between computational efficiency and classification performance.
Both models demonstrate good generalization, indicating their ability to adapt well to new data. In terms of efficiency, XGBoost stood out with the lowest prediction time recorded at 0.00800 s, making it ideal for environments that require rapid responses. However, this model has the largest storage size at 230.5 KB, which is offset by its scalability with large datasets. On the other hand, the Random Forest model offers a balance between performance and resource consumption. Its training time is 0.8365 s, and its prediction time is 0.0147 s. Lastly, its disk size is 160.2 KB.
Table 10 presents the parameters used in the machine learning models. Configuring these parameters is necessary to enhance generalization, reduce overfitting, and improve the stability and efficiency of the models when working with large datasets. Additionally, a disparity can be observed where XGBoost requires much more detailed parameter tuning compared to Random Forest. It is important to highlight that the two models cannot be configured with the same parameters because XGBoost is based on sequential boosting with optimization, whereas Random Forest employs parallel bagging with random sampling.
On the other hand, in order to ensure that the evaluated models exhibit generalization capability and to prevent the results from depending on an arbitrary dataset split, k-fold cross-validation was implemented. In this procedure, the training set was divided into k partitions of equal size, training the model on k–1 of them and validating on the remaining one. In this work, KFold with 5 partitions (k = 5) was employed, shuffling the data in each repetition and setting a reproducibility seed (random_state = 42). The same procedure was applied to both datasets (CIC and NTL) and to the XGBoost and Random Forest models.
Additionally, given that both datasets present a class imbalance, a class weighting scheme was incorporated to mitigate the model’s bias toward the majority class. For this purpose, the compute_class_weight function from scikit-learn was employed, with the parameter class_weight = “balanced”. This technique adjusts the weight of each class inversely proportional to its frequency, so that the loss function penalizes more heavily the errors committed on the minority class.
Taken together, the combination of k-fold cross-validation and class weighting enabled a more reliable and balanced estimation of model performance, minimizing the risk of overfitting and addressing the imbalanced nature of the data.

3. Results

The training of the XGBoost and Random Forest models with the CIC-Dataset and NTL-Dataset was conducted using 100 decision trees, a random_state parameter set to 42 for reproducibility and utilizing all processors with the n_jobs parameter set to −1. This ensured the same computational capabilities and training parameters were applied to each model across both datasets. Additionally, each dataset contains 30 features with the highest importance scores, as previously mentioned. Table 11 presents the equations used to evaluate the models’ performance with the metrics accuracy (1), precision (2), recall (3), F1-score (4), and false negative rate (5).
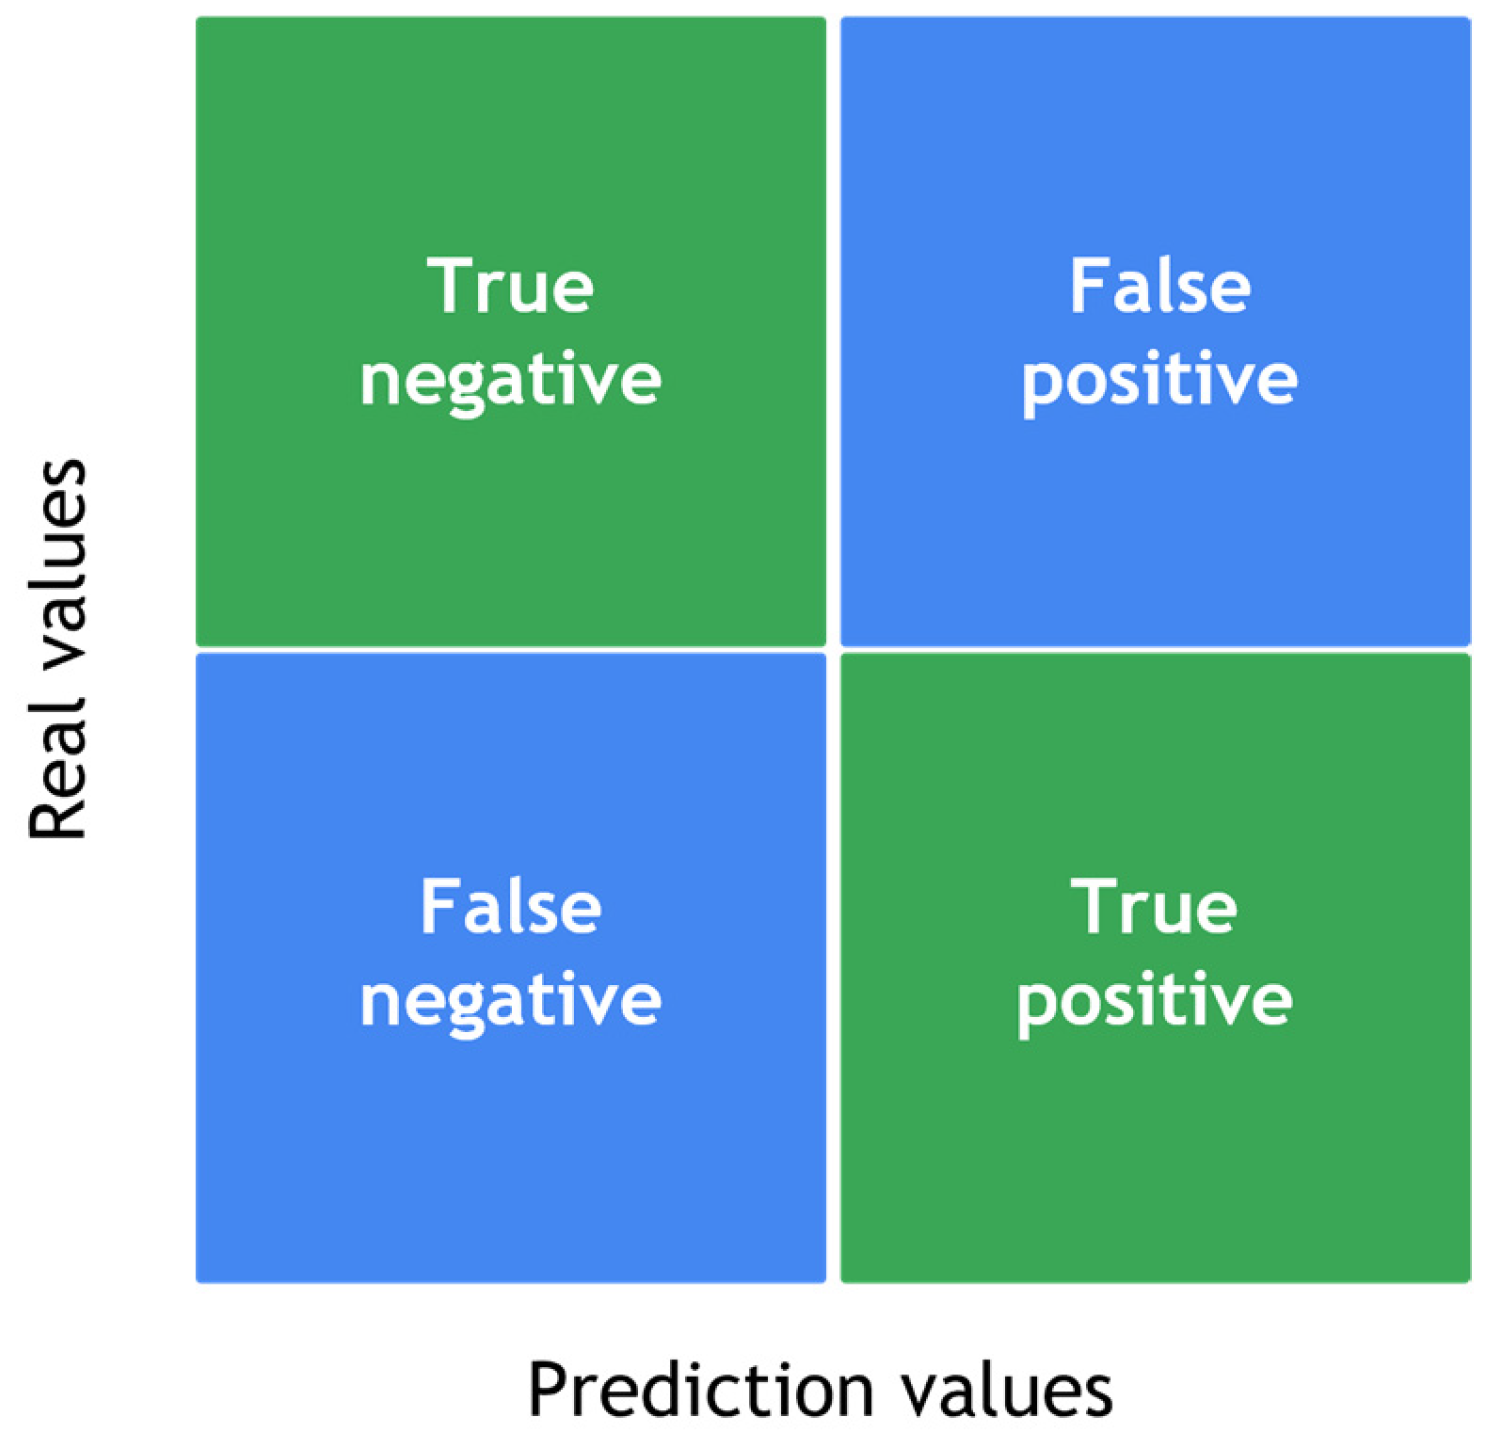
Figure 10 shows a representative example of a confusion matrix used in this research for evaluation purposes. As a result of the training, four confusion matrices were obtained to demonstrate the performance of the Random Forest and XGBoost models. Each model has two confusion matrices, as each was trained and evaluated with the CIC-Dataset and NTL-Dataset. The results are presented in Figure 11 and Figure 12.
Table 12 summarizes the evaluation results obtained for each attack tool considered in the two datasets used, CIC-Dataset and NTL-Dataset, with the XGBoost model. For each scenario, the fundamental metrics derived from the confusion matrices are reported: true positives (TP), true negatives (TN), false positives (FP), and false negatives (FN). Based on these metrics, performance indicators were calculated, including accuracy (1), precision (2), recall (3), F1-score (4), and FNR (5).
The results presented in Table 12 reveal significant differences in the behavior of the models with respect to the False Negative Rate (FNR), a metric that represents the proportion of undetected attacks and, consequently, the associated risk to the network.
One noteworthy aspect is the occurrence of cases where the reported FNR equals 0, which implies that the model successfully detected 100% of the attacks. Although such an outcome may be interpreted as an ideal performance, it should also be considered with caution, since in real-world scenarios it is highly unlikely to achieve perfect and sustained detection. This behavior may be attributed to high separability between classes in certain types of attacks, such as XerXes or GoldenEye in the NTL-Dataset, but it may also reflect dataset limitations or the lack of sufficient variability in the test scenarios, thereby reducing the challenge for the model.
Conversely, higher FNR values were observed in specific attacks such as Slowhttptest and GoldenEye within the CIC-Dataset, indicating that the model’s effectiveness is not uniform and largely depends on the nature of the attack. In particular, volumetric or low-rate attacks tend to generate traffic patterns that are difficult to discriminate against, thus increasing the likelihood of misclassifying some malicious flows as benign.
Table 13 presents the evaluation results obtained for each attack tool using the Random Forest model.
The results presented in Table 13 show an overall behavior and values close to zero, which is favorable for the detection of different types of attacks. However, a more detailed examination reveals aspects that warrant critical analysis, particularly concerning FNR values equal to zero.
First, perfect metrics (FNR = 0), as observed for GoldenEye in the NTL-Dataset, must be interpreted with caution. Although such values suggest that all attacks were detected without false negatives, in practice it is uncommon for a classification model to achieve perfect detection in complex and variable attacks. These results may reflect a bias in data distribution or an intrinsic ease in identifying strongly marked patterns within this specific type of attack. Therefore, an FNR equal to zero should not be regarded as conclusive evidence of robustness but rather as an indicator requiring further validation with more diverse datasets or real traffic scenarios.
Second, higher FNR values were identified in attacks such as Slowhttptest (CIC-Dataset, 0.0049; NTL-Dataset, 0.0015) and XerXes (CIC-Dataset, 0.0134; NTL-Dataset, 0.0228). Although the percentages remain low, these results demonstrate that the model faces greater difficulty in properly discriminating against certain traffic patterns, particularly in less volumetric or more subtle attacks. This highlights that the model’s effectiveness is not homogeneous and largely depends on the specific characteristics of each attack.
Finally, although the overall accuracy and F1-Score achieved outstanding values in most scenarios, the FNR analysis suggests that the strength of Random Forest is not absolute. The fact that some attacks are detected almost perfectly while others exhibit false negatives indicates that the model may be overfitting to certain recurrent patterns in the training data and may not necessarily generalize with equal effectiveness across all cases.
In summary, while Random Forest achieved competitive and, in some instances, seemingly perfect results, a critical analysis of the FNR suggests that such values should be interpreted with caution. It is recommended to complement these experiments with additional datasets, stricter validation techniques, and more heterogeneous traffic scenarios to confirm the true robustness of the model against real-world attacks.
Figure 11a, the results of the XGBoost model using the CIC-Dataset are shown, with 75,836 attack flows correctly classified and 40 misclassifications; in contrast, the model correctly classified 50,221 normal flows with 618 errors. In Figure 11b, the results of the XGBoost model using the NTL-Dataset are presented, where 97,584 attack flows were correctly classified with 5 misclassifications; meanwhile, the model correctly classified 106,037 normal flows with 49 misclassifications.
Figure 12a presents the results of the Random Forest model trained with the CIC-Dataset, where 75,828 attack flows were correctly classified with 48 misclassifications; in contrast, the model correctly classified 50,402 normal flows with 437 errors. Figure 12b shows the results of the Random Forest model using the NTL-Dataset, correctly classifying 97,588 attack flows with only 1 misclassification; meanwhile, the model correctly classified 106,084 normal flows with 2 errors.
Table 14 presents the performance results of each of the models evaluated. These results were obtained using the equations previously introduced in Table 11. The Random Forest model trained with the NTL-Dataset achieved the best performance, with an accuracy of 99.99% and the lowest false negative rate, reaching a value of 0.00001.
The performance results of the two models presented in Table 14 show values above 99% across all metrics, fulfilling the objective of effectively detecting both normal and malicious traffic. These results demonstrate highly competitive performance, where variations depend on both the dataset employed and the machine learning model implemented. Feature selection remains a decisive factor, as it directly influences the ability of the models to discriminate attack patterns from legitimate traffic, along with the cross-validation methods and class weighting applied prior to training.
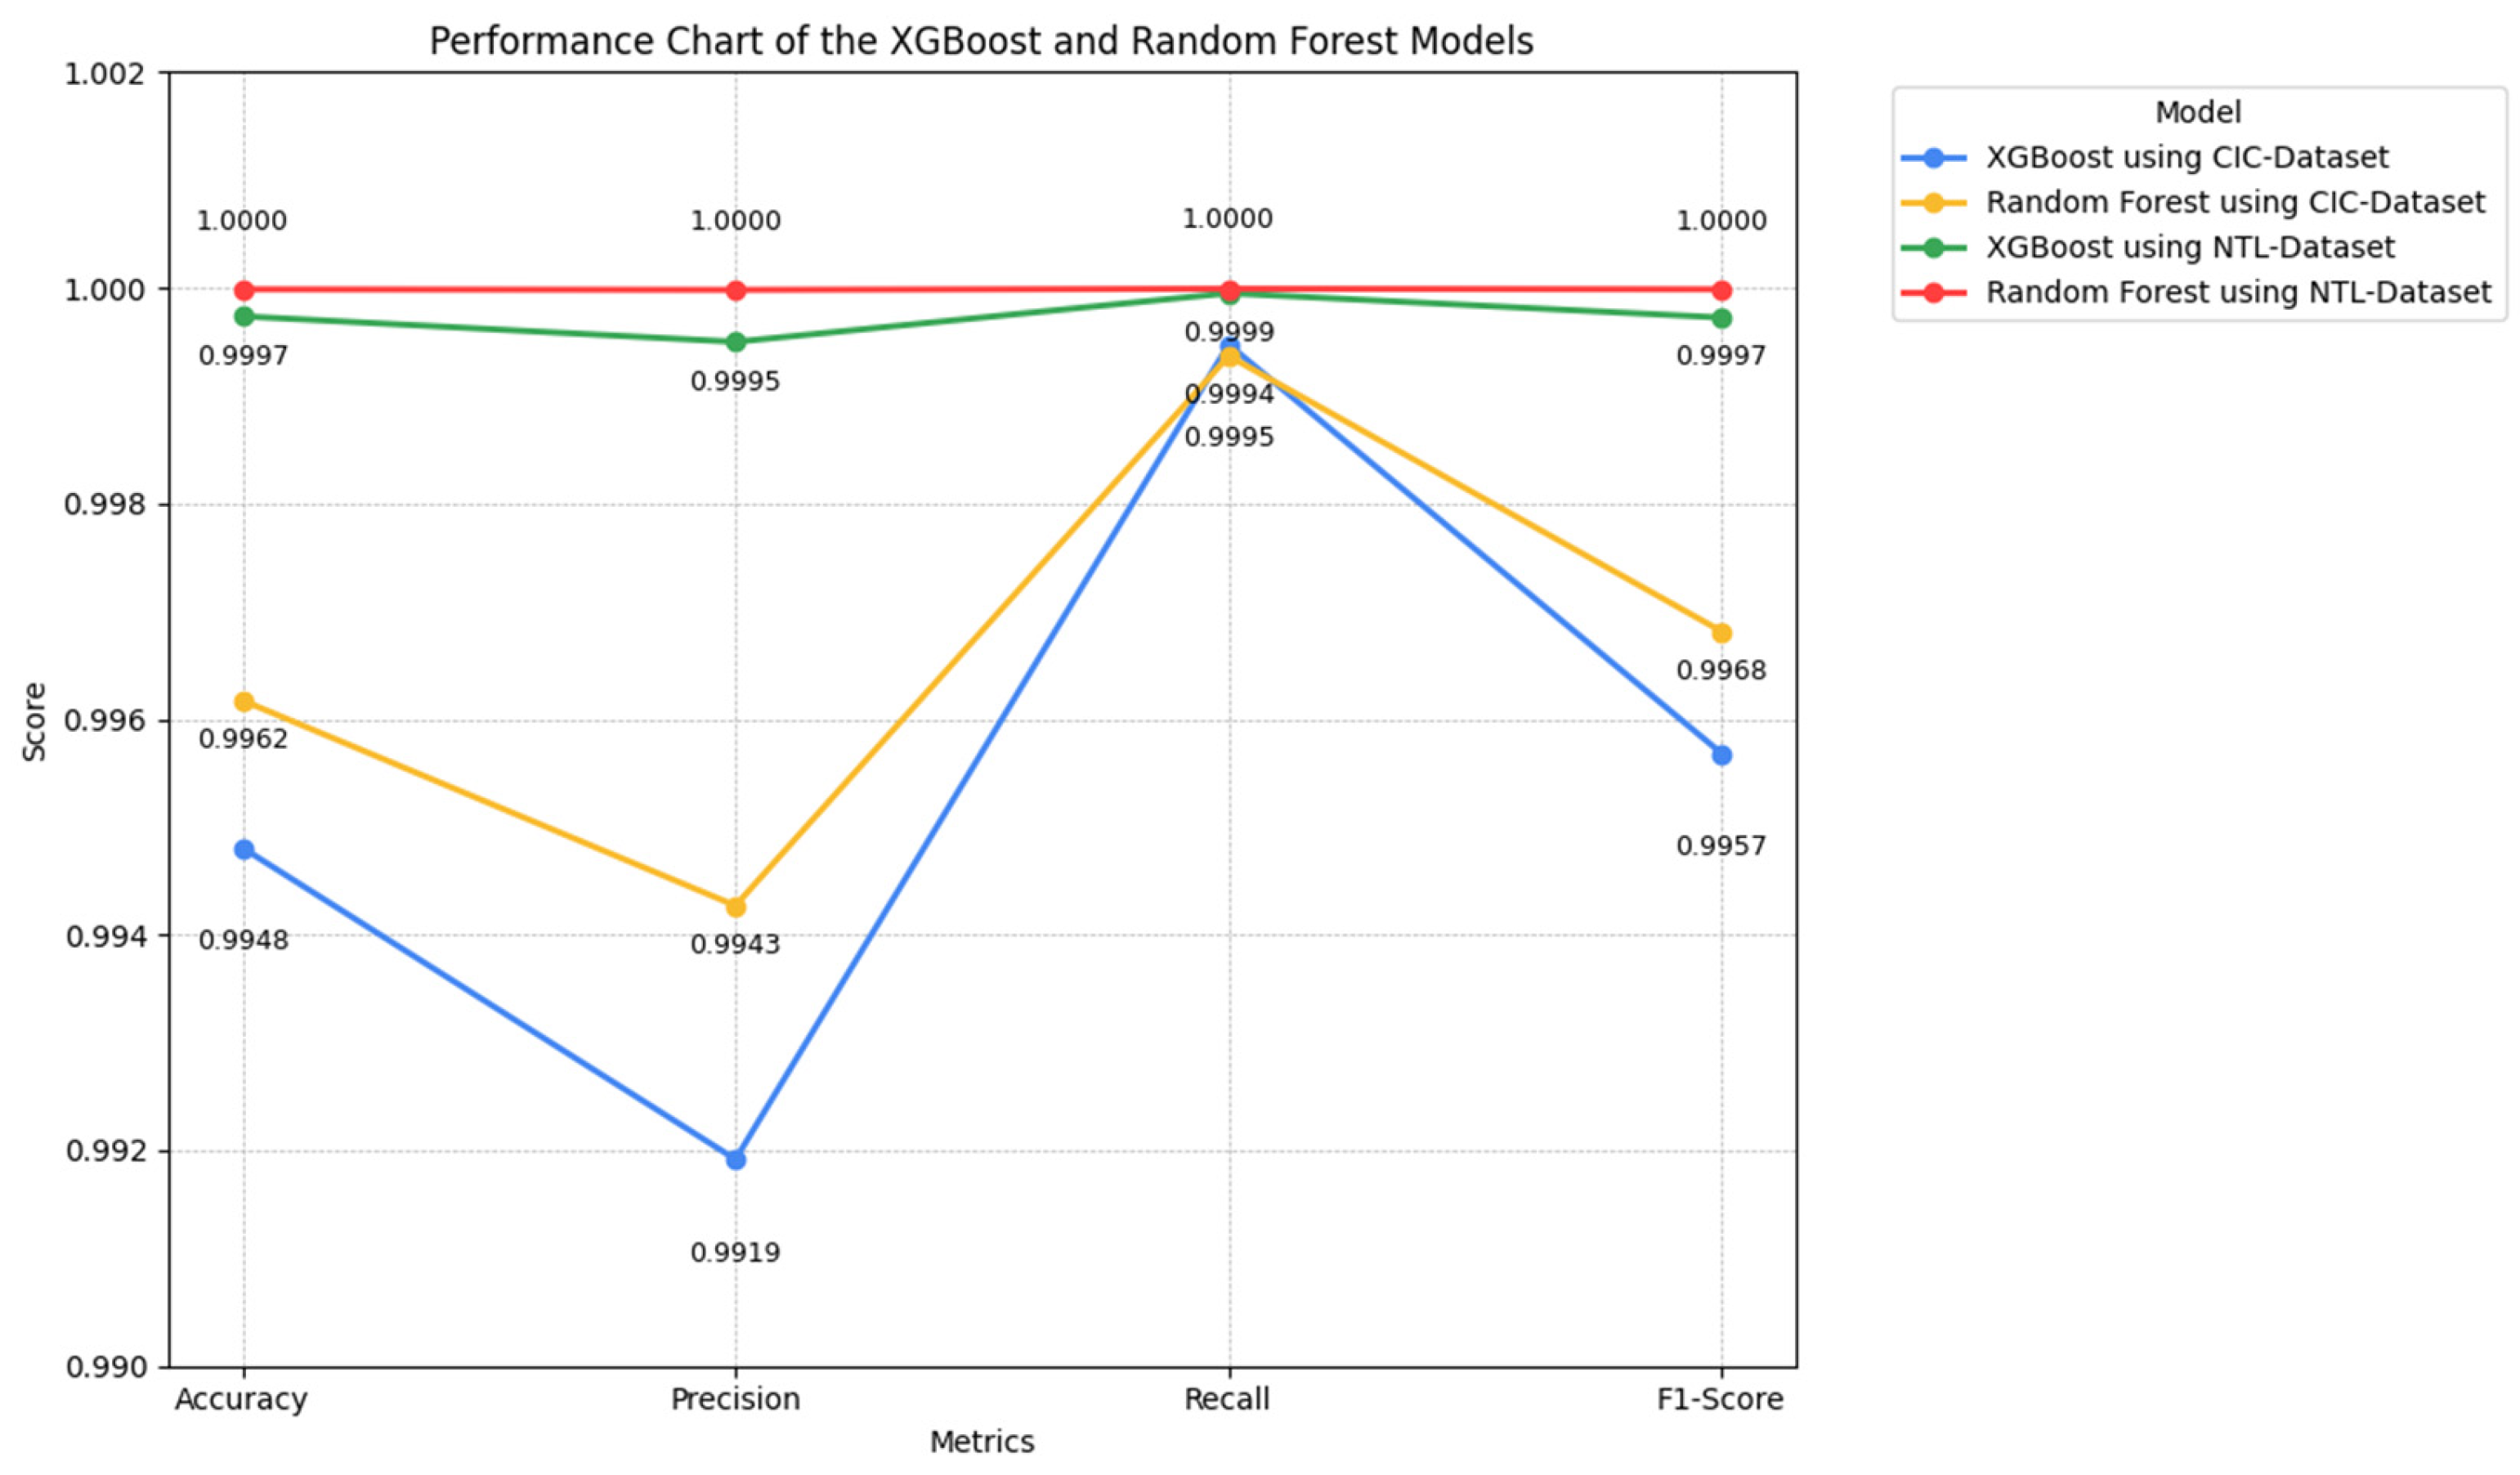
Regarding model performance, Random Forest achieves the best overall results, particularly with the NTL-Dataset, reaching an accuracy of 99.99%, a precision of 99.99%, and an almost null false negative rate (FNR = 0.00001). This behavior is critical for the correct classification of traffic, as it minimizes the probability of an attack going undetected. For its part, XGBoost also exhibits outstanding performance, achieving values close to those of Random Forest. With the NTL-Dataset, it reaches an accuracy of 99.97%, accompanied by an equally low false negative rate (FNR = 0.00005). Although slightly lower than Random Forest in this scenario, it remains highly competitive and above 99% in all evaluated metrics. Figure 13 illustrates the results of the metrics using a line chart.
A noteworthy aspect is the consistency of both models in the CIC-Dataset, where the metrics range between 99.19% and 99.94% for XGBoost, and between 99.42% and 99.93% for Random Forest. This confirms that, regardless of the dataset, both algorithms deliver robust and reliable performance for the detection of application-layer denial-of-service attacks.
The low FNR values achieved by both models represent a crucial aspect, as they reflect the ability to detect virtually all attacks without misclassifying them as legitimate traffic. However, FNR values this low may raise concerns of potential model overfitting, particularly when results exceed 99.9% in accuracy and recall.
To address this concern, additional stress tests were carried out by introducing malicious traffic not included in the training set, thereby creating an independent test dataset. This traffic included attack variants with altered parameters, new temporal sequences, and different request volumes compared to those used in training. The results confirmed that the models, and particularly Random Forest, maintained stable performance with low FNR values, thus validating that the observed behavior does not correspond to excessive fitting but rather to a genuine capacity for generalization against previously unseen attacks.
This finding supports the reliability of the proposed approach, ensuring that the model not only learns specific patterns from the datasets employed but is also capable of adapting to realistic scenarios where the nature of the attacks may vary significantly.

4. Conclusions

Software-Defined Networking (SDN) enables centralized management, flexibility, scalability, and automation of network infrastructure. However, its centralized architecture also introduces a single point of failure and makes it vulnerable to Distributed Denial of Service (DDoS) attacks that threaten availability. Detecting such attacks accurately is therefore critical to ensuring the security and resilience of SDN environments. This study shows that combining customized datasets with machine learning models can enhance SDN protection against DDoS threats.
The use of CICFlowMeter and NTLFlowLyzer facilitated the extraction of flow-based features such as packet size, transfer rate, and inter-arrival times, which revealed clear anomalous patterns. CICFlowMeter proved efficient in flow conversion and emphasized packet structure and volumetric indicators, while NTLFlowLyzer provided additional statistical features that highlighted traffic asymmetry and instability. Together, they offered complementary perspectives that improved the robustness of feature selection.
Regarding model efficiency, XGBoost required less memory and achieved faster training due to its boosting and regularization process. However, Random Forest outperformed XGBoost in detection accuracy. As shown in Table 14, Random Forest achieved the best results, particularly with the NTL-Dataset, where it reached 99.99% accuracy and an almost null false negative rate (FRN = 0.00001). XGBoost also achieved competitive performance, with 99.97% accuracy and low false negatives (FRN = 0.00005). These results highlight that while XGBoost is more efficient, Random Forest provides greater reliability in minimizing false negatives, which is critical to avoiding misclassification of malicious traffic.
Experiments were conducted in a controlled environment with HTTP flood attacks, which enabled precise evaluations but did not fully capture real-world complexity. The robustness of the models against evolving or zero-day attacks was not explicitly addressed, though modified attack patterns were introduced in the independent test set to increase evaluation difficulty. Additionally, public benchmarks such as CICDDoS2019 were not considered, as differences in feature definitions could compromise comparability. Future research should address this gap by benchmarking against compatible datasets. Finally, the scope was restricted to application-layer HTTP floods; expanding to volumetric UDP/ICMP floods or OpenFlow packet-in floods is necessary to strengthen generalization.
In summary, this research provides a detailed comparison of CICFlowMeter and NTLFlowLyzer under the same controlled conditions, offering evidence of their complementary strengths in feature extraction. Beyond presenting highly competitive detection results, this work also serves as a practical, replicable guide for building customized datasets and validating detection models under realistic conditions.

Author Contributions

Conceptualization, E.P.E.C. and J.D.A.P.; Formal analysis, J.C.M.Q., E.P.E.C. and J.D.A.P.; Investigation, J.C.M.Q., E.P.E.C. and J.D.A.P.; Methodology, J.D.A.P. Writing—original draft, J.D.A.P.; Writing—review and editing, J.C.M.Q. and E.P.E.C. All authors have read and agreed to the published version of the manuscript.

Funding

This product is funded by the “Universidad Militar Nueva Granada-Vicerrectoría de Investigaciones”.

Informed Consent Statement

Not applicable.

Data Availability Statement

The data presented in this study are available in DDoS_Detection_SDN at https://github.com/JuanD4vy/DDoS_Detection_SDN.git. These data were derived from the following resources available in the public domain: https://github.com/ahlashkari/NTLFlowLyzer.git and https://github.com/UNBCIC/CICFlowMeter.git (all accessed on 3 September 2025).

Acknowledgments

Product derived from the MAXWELL research seedbed of the GISSIC research group. Universidad Militar Nueva Granada. Year 2025.

Conflicts of Interest

The authors declare no conflicts of interest.

References

  1. Mageswari, R.U.; N, Z.A.K.; M, G.A.M.; S, J.N.K. Addressing Security Challenges in Industry 4.0: AVA-MA Approach for Strengthening SDN-IoT Network Security. Comput. Secur. 2024, 144, 103907. [Google Scholar] [CrossRef]
  2. Eghbali, Z.; Lighvan, M.Z. A Hierarchical Approach for Accelerating IoT Data Management Process Based on SDN Principles. J. Netw. Comput. Appl. 2021, 181, 103027. [Google Scholar] [CrossRef]
  3. Islam, M.T.; Islam, N.; Refat, M. Al Node to Node Performance Evaluation through RYU SDN Controller. Wirel. Pers. Commun. 2020, 112, 555–570. [Google Scholar] [CrossRef]
  4. Khorsandroo, S.; Sánchez, A.G.; Tosun, A.S.; Arco, J.M.; Doriguzzi-Corin, R. Hybrid SDN Evolution: A Comprehensive Survey of the State-of-the-Art. Comput. Netw. 2021, 192, 107981. [Google Scholar] [CrossRef]
  5. Ali, O.M.A.; Hamaamin, R.A.; Youns, B.J.; Kareem, S.W. Innovative Machine Learning Strategies for DDoS Detection: A Review. UHD J. Sci. Technol. 2024, 8, 38–49. [Google Scholar] [CrossRef]
  6. Inchara, S.; Keerthana, D.; Babu, K.N.R.M.; Mabel, J.P. Detection and Mitigation of Slow DoS Attacks Using Machine Learning. In Recent Advances in Industry 4.0 Technologies, Proceedings of the AIP Conference Proceedings, Karaikal, India, 14–16 September 2022; American Institute of Physics Inc.: College Park, MD, USA, 2023; Volume 2917. [Google Scholar]
  7. Alashhab, A.A.; Zahid, M.S.; Isyaku, B.; Elnour, A.A.; Nagmeldin, W.; Abdelmaboud, A.; Abdullah, T.A.A.; Maiwada, U.D. Enhancing DDoS Attack Detection and Mitigation in SDN Using an Ensemble Online Machine Learning Model. IEEE Access 2024, 12, 51630–51649. [Google Scholar] [CrossRef]
  8. Ahuja, N.; Mukhopadhyay, D.; Singal, G. DDoS Attack Traffic Classification in SDN Using Deep Learning. Pers. Ubiquitous Comput. 2024, 28, 417–429. [Google Scholar] [CrossRef]
  9. Alghoson, E.S.; Abbass, O. Detecting Distributed Denial of Service Attacks Using Machine Learning Models. Int. J. Adv. Comput. Sci. Appl. 2021, 12, 0121277. [Google Scholar] [CrossRef]
  10. Al-Dunainawi, Y.; Al-Kaseem, B.R.; Al-Raweshidy, H.S. Optimized Artificial Intelligence Model for DDoS Detection in SDN Environment. IEEE Access 2023, 11, 106733–106748. [Google Scholar] [CrossRef]
  11. Akhtar, M.S.; Feng, T. Deep Learning-Based Framework for the Detection of Cyberattack Using Feature Engineering. Secur. Commun. Netw. 2021, 2021, 6129210. [Google Scholar] [CrossRef]
  12. Srinivasa Rao, G.; Santosh Kumar Patra, P.; Narayana, V.A.; Raji Reddy, A.; Vibhav Reddy, G.N.V.; Eshwar, D. DDoSNet: Detection and Prediction of DDoS Attacks from Realistic Multidimensional Dataset in IoT Network Environment. Egypt. Inform. J. 2024, 27, 100526. [Google Scholar] [CrossRef]
  13. Alabdulatif, A.; Thilakarathne, N.N.; Aashiq, M. Machine Learning Enabled Novel Real-Time IoT Targeted DoS/DDoS Cyber Attack Detection System. Comput. Mater. Contin. 2024, 80, 3655–3683. [Google Scholar] [CrossRef]
  14. Halladay, J.; Cullen, D.; Briner, N.; Warren, J.; Fye, K.; Basnet, R.; Bergen, J.; Doleck, T. Detection and Characterization of DDoS Attacks Using Time-Based Features. IEEE Access 2022, 10, 49794–49807. [Google Scholar] [CrossRef]
  15. Gebrye, H.; Wang, Y.; Li, F. Traffic Data Extraction and Labeling for Machine Learning Based Attack Detection in IoT Networks. Int. J. Mach. Learn. Cybern. 2023, 14, 2317–2332. [Google Scholar] [CrossRef]
  16. Hossain, M.A.; Islam, M.S. Enhancing DDoS Attack Detection with Hybrid Feature Selection and Ensemble-Based Classifier: A Promising Solution for Robust Cybersecurity. Meas. Sens. 2024, 32, 101037. [Google Scholar] [CrossRef]
  17. Aslam, N.; Srivastava, S.; Gore, M.M. DDoS SourceTracer: An Intelligent Application for DDoS Attack Mitigation in SDN. Comput. Electr. Eng. 2024, 117, 109282. [Google Scholar] [CrossRef]
  18. Wabi, A.A.; Idris, I.; Olaniyi, O.M.; Ojeniyi, J.A. DDOS Attack Detection in SDN: Method of Attacks, Detection Techniques, Challenges and Research Gaps. Comput. Secur. 2024, 139, 103652. [Google Scholar] [CrossRef]
  19. Sharafaldin, I.; Lashkari, A.H.; Hakak, S.; Ghorbani, A.A. Developing Realistic Distributed Denial of Service (DDoS) Attack Dataset and Taxonomy. In Proceedings of the International Carnahan Conference on Security Technology, Chennai, India, 1–3 October 2019. [Google Scholar]
  20. Shafi, M.M.; Lashkari, A.H.; Roudsari, A.H. NTLFlowLyzer: Towards Generating an Intrusion Detection Dataset and Intruders Behavior Profiling through Network and Transport Layers Traffic Analysis and Pattern Extraction. Comput. Secur. 2025, 148, 104160. [Google Scholar] [CrossRef]
  21. Gupta, N.; Maashi, M.S.; Tanwar, S.; Badotra, S.; Aljebreen, M.; Bharany, S. A Comparative Study of Software Defined Networking Controllers Using Mininet. Electronics 2022, 11, 2715. [Google Scholar] [CrossRef]
  22. Correa Chica, J.C.; Imbachi, J.C.; Botero Vega, J.F. Security in SDN: A Comprehensive Survey. J. Netw. Comput. Appl. 2020, 159, 102595. [Google Scholar] [CrossRef]
  23. Hirsi, A.; Audah, L.; Salh, A.; Alhartomi, M.A.; Ahmed, S. Detecting DDoS Threats Using Supervised Machine Learning for Traffic Classification in Software Defined Networking. IEEE Access 2024, 12, 166675–166702. [Google Scholar] [CrossRef]
  24. Kabdjou, J.; Shinomiya, N. Improving Quality of Service and HTTPS DDoS Detection in MEC Environment with a Cyber Deception-Based Architecture. IEEE Access 2024, 12, 23490–23503. [Google Scholar] [CrossRef]
  25. Dhahir, Z.S. A Hybrid Approach for Efficient DDoS Detection in Network Traffic Using CBLOF-Based Feature Engineering and XGBoost. J. Future Artif. Intell. Technol. 2024, 1, 174–190. [Google Scholar] [CrossRef]
  26. Coscia, A.; Dentamaro, V.; Galantucci, S.; Maci, A.; Pirlo, G. Automatic Decision Tree-Based NIDPS Ruleset Generation for DoS/DDoS Attacks. J. Inf. Secur. Appl. 2024, 82, 103736. [Google Scholar] [CrossRef]
  27. Butt, H.A.; Al Harthy, K.S.; Shah, M.A.; Hussain, M.; Amin, R.; Rehman, M.U. Enhanced DDoS Detection Using Advanced Machine Learning and Ensemble Techniques in Software Defined Networking. Comput. Mater. Contin. 2024, 81, 3003–3031. [Google Scholar] [CrossRef]
  28. Perez-Diaz, J.A.; Valdovinos, I.A.; Choo, K.K.R.; Zhu, D. A Flexible SDN-Based Architecture for Identifying and Mitigating Low-Rate DDoS Attacks Using Machine Learning. IEEE Access 2020, 8, 155859–155872. [Google Scholar] [CrossRef]
  29. Yungaicela-Naula, N.M.; Vargas-Rosales, C.; Perez-Diaz, J.A. SDN-Based Architecture for Transport and Application Layer DDoS Attack Detection by Using Machine and Deep Learning. IEEE Access 2021, 9, 108495–108512. [Google Scholar] [CrossRef]
  30. Aslam, N.; Srivastava, S.; Gore, M.M. ONOS DDoS Defender: A Comparative Analysis of Existing DDoS Attack Datasets Using Ensemble Approach. Wirel. Pers. Commun. 2023, 133, 1805–1827. [Google Scholar] [CrossRef]
  31. Liu, Z.; Wang, Y.; Feng, F.; Liu, Y.; Li, Z.; Shan, Y. A DDoS Detection Method Based on Feature Engineering and Machine Learning in Software-Defined Networks. Sensors 2023, 23, 6176. [Google Scholar] [CrossRef]
  32. Elubeyd, H.; Yiltas-Kaplan, D. Hybrid Deep Learning Approach for Automatic DoS/DDoS Attacks Detection in Software-Defined Networks. Appl. Sci. 2023, 13, 3828. [Google Scholar] [CrossRef]
  33. Najar, A.A.; Manohar Naik, S. Cyber-Secure SDN: A CNN-Based Approach for Efficient Detection and Mitigation of DDoS Attacks. Comput. Secur. 2024, 139, 103716. [Google Scholar] [CrossRef]
  34. Garba, U.H.; Toosi, A.N.; Pasha, M.F.; Khan, S. SDN-Based Detection and Mitigation of DDoS Attacks on Smart Homes. Comput. Commun. 2024, 221, 29–41. [Google Scholar] [CrossRef]
  35. Singh, A.; Kaur, H.; Kaur, N. A Novel DDoS Detection and Mitigation Technique Using Hybrid Machine Learning Model and Redirect Illegitimate Traffic in SDN Network. Clust. Comput. 2024, 27, 3537–3557. [Google Scholar] [CrossRef]
  36. Han, D.; Li, H.; Fu, X.; Zhou, S. Traffic Feature Selection and Distributed Denial of Service Attack Detection in Software-Defined Networks Based on Machine Learning. Sensors 2024, 24, 4344. [Google Scholar] [CrossRef] [PubMed]
  37. Ali, U. Performance Comparison of SDN Controllers in Different Network Topologies. Res. Sq. 2024. [Google Scholar] [CrossRef]
  38. Sheikh, M.N.A.; Hwang, I.S.; Raza, M.S.; Ab-Rahman, M.S. A Qualitative and Comparative Performance Assessment of Logically Centralized SDN Controllers via Mininet Emulator. Computers 2024, 13, 85. [Google Scholar] [CrossRef]
  39. Wazirali, R.; Ahmad, R.; Alhiyari, S. Sdn-Openflow Topology Discovery: An Overview of Performance Issues. Appl. Sci. 2021, 11, 6999. [Google Scholar] [CrossRef]
  40. Dini, P.; Elhanashi, A.; Begni, A.; Saponara, S.; Zheng, Q.; Gasmi, K. Overview on Intrusion Detection Systems Design Exploiting Machine Learning for Networking Cybersecurity. Appl. Sci. 2023, 13, 7507. [Google Scholar] [CrossRef]
  41. Paramaputra, A.P.; Suranegara, G.M.; Setyowati, E. Mitigation of Multi Target Denial of Service (dos) Attacks Using Wazuh Active Response. J. Comput. Netw. Archit. High. Perform. Comput. 2025, 7, 483–493. [Google Scholar] [CrossRef]
Figure 1. Research methodology.
Telecom 06 00069 g001
Figure 2. Distributed Denial-of-Service (DDoS) Attack.
Telecom 06 00069 g002
Figure 3. Categories of DDoS attacks [18,23,24,25].
Telecom 06 00069 g003
Figure 4. Process of transforming PCAP-format packets into CSV-format flows for traffic analysis [20].
Telecom 06 00069 g004
Figure 5. Schematic of the operation of an ensemble model based on multiple decision trees. The green and blue nodes denote two different classes.
Telecom 06 00069 g005
Figure 6. SDN Topology used in the simulation.
Telecom 06 00069 g006
Figure 7. Simulation Scenario of a DDoS Attack Launched from Multiple Attacking Host Terminals.
Telecom 06 00069 g007
Figure 8. Dataset construction process.
Telecom 06 00069 g008
Figure 9. Feature Importance Analysis: Top 10 Most Significant Features in CIC-Dataset and NTL-Dataset.
Telecom 06 00069 g009
Figure 10. Confusion Matrix Structure.
Telecom 06 00069 g010
Figure 11. XGBoost Model Evaluation: (a) Confusion matrix for the evaluation of the XGBoost model trained with the CIC-Dataset; (b) Confusion matrix for the evaluation of the XGBoost model trained with the NTL-Dataset.
Telecom 06 00069 g011
Figure 12. Random Forest Model Evaluation: (a) Confusion matrix for the evaluation of the Random Forest model trained with the CIC-Dataset; (b) Confusion matrix for the evaluation of the Random Forest model trained with the NTL-Dataset.
Telecom 06 00069 g012
Figure 13. Performance Results for the XGBoost and Random Forest Models.
Telecom 06 00069 g013
Table 1. Studies related to SDNs and DDoS.
Ref.YearControllerAttack ToolsMachine Learning/Deep Learning ModelDataset
Used

Features
[28]2020ONOSSlowloris, SlowHTTP, RUDY, HULKJ48, RF, REP Tree, MLP, SVMCICDDoS201744
[29]2021ONOSHping3, SlowHTTP, DrDNSLSTM, GRU, MLP, RF, KNNCICDDoS2017
CICDDoS2019
50
[30]2023ONOSHping3, Mausezahn, HULKMPL, RF, XGBoost, AdaBoostCICDDoS2017
CICDDoS2018
CICDDoS2019
48
[31]2023RYUHping3RF, SVM, XGBoost, KNN
Decision Tree
CICDDoS201826
[10]2023RYUHping3, Iperf1D-CNNRYU Monitoring
(Generated)
14
[32]2024RYUIperf, Hping3, ScapyCNN, GRU, DNNCICDDoS2017
CICDDoS2019
88
[17]2024ONOSHping3, Mausezahn, HULK, TorshammerMPL, RF, KNN, SVM, XGBoostDDoS
SourceTracer app.
22
[33]2024POXHping3, ScapyLSTM, DNN, GRU, BRS+CNNCICDDoS201966
[34]2024RYUHping3, XerXesKNN, SVM,
Decision Tree
UNSW-NB15, CICDDoS201829
[35]2024ONOSHping3, XerXesSVM-RFSnort,
Wireshark
12
[36]2024RYUHping3DT, SVM, RF, LRInSDN
CICDDoS2017
CICDDoS2018
77
[7]2024RYUHping3, Scapy, IperfBernoulliNB, PA, SDG, MLP,
Ensemble
CICDDoS201922
Table 2. Comparative Analysis of DDoS Attack Detection Approaches in SDNs. The symbol ✓ indicates the feature is present; x indicates the feature is absent.
Ref.Controller
Used
Attack Application Layer Using Extraction Tool Own DatasetIndependent Test Dataset
Features
Highest
Accuracy
Obtained (%)
[28]ONOSxxx4495.0
[29]ONOSxxx5099.8
[30]ONOSxxx4899.9
[31]RYUxxx2699.1
[10]RYUxxx1499.9
[32]RYUxxx8899.8
[17]ONOSxx2299.2
[33]POXxxxx6699.9
[34]RYUxxx2999.5
[35]ONOSxx1299.1
[36]RYUxxxx7799.9
[7]RYUxxx2299.2
Table 3. Features of Hardware and Software Tools for Simulation.
Hardware Specifications Used (Virtual Machine)
ComponentTechnical Features
RAM8 GB
Storage80 GB
Processors6
Software tools
ToolVersionSimulation Objective
Operating SystemUbuntu 20.04 LSTBase environment for simulation
Mininet2.3.1SDN simulation
Open Daylight Controller 0.3.0 LithiumCentralized controller in SDN
Web ServerApache 2.4.41Provides legitimate HTTP service
Slowloris0.2.6Malicious traffic generation using partial HTTP connections
Slowhttptest1.6Persistent attack generation
GoldenEye2.1Multiple HTTP connection attack generation
HULK5.0Flood HTTP traffic generation
XerXes1.0Flood type attack generation
Tcpdump4.9.3Network traffic monitoring and capture
Table 4. Attack Scenarios.
ScenarioTool Parameters Description
Low
Intensity
SlowhttptestSlowhttptest-c 500-H-i 10-r 100-t GET http://10.0.0.20-x 10-p 5Sends 500 connections with 10 s intervals and GET requests.
SlowhttptestSlowhttptest-c 1000 -H-i 15-r 200-t GET http://10.0.0.20-x 20 -p 10Sends 1000 connections with 15 s intervals and GET requests.
SlowlorisPython3 slowloris.py 10.0.0.20 -s 9000Launches an attack that opens 9000 partial HTTP connections and keeps them open.
Medium
Intensity
SlowlorisPython3 slowloris.py 10.0.0.20 -s 80,000Launches an attack that opens 80,000 partial HTTP connections and keeps them open
HULKPython3 hulk.py http://10.0.0.20Launches an attack involving the massive sending of dynamic HTTP requests.
High
Intensity
XerXes./xerxes 10.0.0.20 80Network layer attack sending massive traffic to port 80.
GoldenEyePython3 goldeneye 10.0.0.20 w 600 -s 3000HTTP attack with 600 threads and 2000 open sockets
Table 5. Capture times for the training dataset.
DayNormal Traffic Capture (s)Attack Traffic Capture (s)
1–7600600
Total42004200
Table 6. Characteristics of Flow Extraction Tools. The symbol ✓ indicates the feature is present; x indicates the feature is absent.
Characteristics
FeaturesCICFlowMeterNTLFlowLyzer
DeveloperCanadian Institute for Cybersecurity (CIC), University of New Brunswick, CanadaBehavioral Cybersecurity Center (BCCC), York University, Canada
Base Language JavaPython
Input Format pcappcap
Output Format csvcsv
Label Selectionx
Customizablex
Maximum Number of Columns82346
Configuration
FeaturesCICFlowMeterNTLFlowLyzer
Configuration fileConstants.pyConfig.json
Activity timeout (s)240300
Expiration sweeps (garbage collection)100010,000
Concurrence (number of threads)18
DirectionalityUnidirectionalBidirectional
Table 7. Daily Record of the Number of Flows Generated by Each Tool.
DayCICFlowMeterNTLFlowLyzerAttack ToolsParameter Variation
AttackNormalAttackNormal
1938127,917951260,126SlowlorisParameter-s (number of sockets varied between 5000 and 80,000), -t (without timeout).
265,59222,28285,66745,962HULKParameter–requests (1000–5000 requests per connection)
316,28222,05424,29746,134SlowHTTPParameter-p (attack profile: 0–2), -i (interval between data packets: 1–5 s), and -r (connections per second: 500–8000).
468,03417,390110,94836,388GoldenEyeParameter-w (workers varied between 200 and 600) and -s (number of sockets varied between 100 and 20,000).
5884630,221886164,401XerXesParameter-c (concurrent connections varied between 100 and 400) and -p (packets per second varied between 500 and 1500).
6880127,390882755,888SlowlorisParameter-s (number of sockets varied between 3000 and 10,000)
776,56624,164120,61655,962HULKParameter–requests (5000–20,000 requests per connection)
Total253,502171,418368,728362,861
Table 8. Packet-to-Flow conversion times for each tool in seconds using CICFlowMeter and NTLFlowLyzer.
DayCICFlowMeterNTLFlowLyzerAttack Tools
Attack
Flows (s)
Normal
Flows (s)
Attack
Flows (s)
Normal
Flows (s)
11748903961432Slowloris
299188424031565HULK
32506936911244SlowHTTP
4153539226721249GoldenEye
595710687311156XerXes
612812302331217Slowloris
79498803108804HULK
Average712.00862.431462.001238.14
Total49846037102348667
Table 9. Machine Learning Model Selection. Random Forest and XGBoost models were selected.
ParametersRandom
Forest
SVMKNNXGBoost
Training time (s)0.83650.00930.01450.5838
Prediction Time (s)0.01470.01470.03780.0080
Size (KB)160.24.79.9230.5
Good Generalizationx
Anomaly Detection x
Scalability with large datasets xx
Table 10. Parameters Used to Train the XGBoost and Random Forest Machine Learning Models. N/A: Not applicable.
ParameterXGBoost ValuesRandom Forest Values
n_estimators100100
learning_rate0.05N/A
max_depth66
subsample0.8N/A
col_sample_bytree0.8N/A
gamma1N/A
reg_alpha0.1N/A
reg_lambda1N/A
tree_method“hist”N/A
booster“gbtree”N/A
random_state4242
n_jobs−1−1
Table 11. Equations of the Selected Metrics for Evaluating XGBoost and Random Forest Models.
MetricFormula
Accuracy T P + T N T P + T N + F P + F N   (1)
Precision T P T P + F P   (2)
Recall T P T P + F N (3)
F1-score 2 × P r e c i s i o n × R e c a l l P r e c i s i o n + R e c a l l (4)
False negative rate F N T P + F N (5)
Table 12. Evaluation results of each attack tool using the XGBoost model.
MetricCIC-DatasetNTL-Dataset
SlowlorisHULKSlowhttptestGoldenEyeXerXesSlowlorisHULKSlowhttptestGoldenEyeXerXes
TP400550,02149,72515,4353944400974,70048,36427,1923897
TN46,08230,18555,09322,02317,39099,90859,69062,59023,59636,388
FP36436214312154711181122,5370
FN0214764281513600
Accuracy (%)99.2799.9599.6599.7499.9899.9796.6098.2769.26100
Precision (%)91.6699.9299.5799.7999.9499.6294.0696.3954.68100
Recall (%)10099.9999.7099.5899.9499.8099.9799.71100100
F1-Score (%)95.6599.9699.7399.6999.9499.7196.9398.0270.70100
FNR00.000040.00290.00410.00050.00190.00020.002800
Table 13. Evaluation results of each attack tool using the Random Forest model.
MetricCIC-DatasetNTL-Dataset
SlowlorisHULKSlowhttptestGoldenEyeXerXesSlowlorisHULKSlowhttptestGoldenEyeXerXes
TP400550,02249,62315,4963893401674,70048,42327,1923808
TN46,08329,85955,09222,02717,38599,92064,39663,39046,12936,388
FP36336221527735101140
FN0124935311577089
Accuracy (%)99.2899.5499.5599.9299.7199.9999.9899.0399.9999.77
Precision (%)91.6899.2899.9699.8299.8299.9299.9997.9599.98100
Recall (%)10099.9999.5099.9898.6599.9799.9799.8410097.77
F1-Score (%)95.6699.6399.5399.9099.2399.9599.9898.8899.9998.84
FNR00.000020.00490.00010.01340.00240.00020.001500.0228
Table 14. Evaluation Results of XGBoost and Random Forest Models Using CIC-Dataset and NTL-Dataset.
MetricXGBoostRandom Forest
CICNTLCICNTL
Accuracy (%)99.4899.9799.6199.99
Precision (%)99.1999.9499.4299.99
Recall (%)99.9499.9999.9399.99
F1-score (%)99.5699.9799.6899.99
FRN0.00050.000050.00060.00001
Disclaimer/Publisher’s Note: The statements, opinions and data contained in all publications are solely those of the individual author(s) and contributor(s) and not of MDPI and/or the editor(s). MDPI and/or the editor(s) disclaim responsibility for any injury to people or property resulting from any ideas, methods, instructions or products referred to in the content.