Abstract
The Border Gateway Protocol (BGP) is the backbone of inter-domain routing on the internet, but its susceptibility to both benign and malicious anomalies creates substantial risks to both network reliability and security. In this study, we present a new approach for deep learning-based BGP anomaly detection utilizing duplicate announcements, which are known to be a symptom of routing disruptions. We developed our methodology based on public BGP data from RIPE and Route Views. We used the number of duplicate announcements as a baseline against which we checked for sporadic and time-based anomalies. Here, we propose a deep learning framework based on the Exponential Moving Average (EMA) model in combination with Autoencoder for anomaly identification. We also apply the Temporal-oriented Synthetic Minority Over-Sampling Technique (T-SMOTE) to overcome data imbalance. Comparative evaluations show that the Autoencoder model is significantly better than LSTM and that existing state-of-the-art methods have higher accuracy, precision, recall, and F1 scores. This study proposes a reliable, scalable, and rapid framework for real-time BGP adversary detection, which improves network security and resilience.
1. Introduction
The Exterior Gateway protocol used for interdomain routing is the BGP protocol, which constructs the foundational structure of the internet. Services that depend on the internet can suffer adversely as a result of any disruption or failure of this protocol. The occurrence of anomalies in BGP leads to malfunctioning of the operation of the protocol. The BGP anomalies can be caused by router misconfigurations, session resets, and link failures [1]. BGP anomaly detection is carried out by utilizing the data collected from RIPE and Route views downloaded from the collection site [2]. The work gives a comprehensive description of the BGP anomalies. The classification of anomalies is performed as it has a great influence on the behavior of the BGP protocol and affects the services that are disrupted due to the non-smooth functioning of the internet. However, major BGP anomalies are caused by configuration errors, malicious spreading of the worms, disruption in power, and failure occurring in the component of any hardware [3,4,5,6].
The key role of the BGP protocol is to swap the routing information and network layer reachability information among numerous Autonomous Systems (ASes). The BGP routers create a neighborship or peering after a session is initiated. The peering of the BGP across different ASes is shown in Figure 1. The BGP protocol is vulnerable to anomalies as the occurrence of anomalies impacts connectivity issues among the ASes and losses that occur during data transmission. The detection of anomalies is still a challenging task for the research community in the area of network security [7]. Different machine learning approaches are utilized in order to track the presence of anomalies in the cyberspace domain [8]. Different performance measures are used to evaluate and assess the performance capability of the classifier. Ensemble approaches have been used by combining multiple classifiers. The contribution of the research work lies in the improvement of the performance measured from the previous work performed [9]. The following contributions are made to the research work:
- (1)
- The exponential Moving Average (EMA) algorithm is applied to BGP datasets to identify trends and make informed decisions based on the proper analysis of the data obtained in the time series.
- (2)
- Deep Learning algorithms such as Long Short-Term Memory (LSTM) and Autoencoder are utilized, and a comparison is made for the detection of bursty announcements with the LSTM technique and the detection of duplicate announcements with the proposed autoencoder technique.
- (3)
- The handling of data imbalance is managed by the use of the Temporal-oriented Synthetic Minority Over Sampling Technique (T-SMOTE) technique.
- (4)
- The experimentation is performed when two deep learning approaches are analyzed and compared; the autoencoder has provided the best results in terms of improved performance metrics, i.e., accuracy, precision, recall, and Receiver Operating Characteristic (ROC) curve.
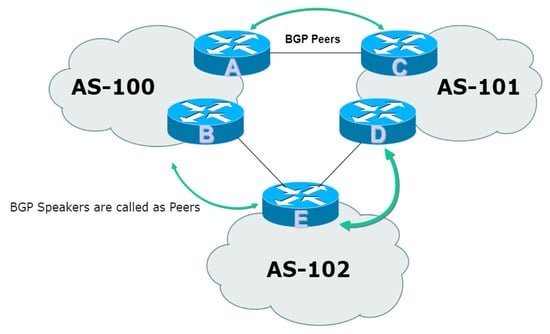
Figure 1.
BGP peering across different ASes.
The structure of the organization of the presented research article is as follows: Section 2 is focused on a review of related work performed in the area of BGP anomaly detection. Section 3 describes the proposed deep learning approach and the datasets used for evaluation. Section 4 highlights the results obtained from experimentation and performance analysis of the thoroughly carried out research work. Finally, Section 5 gives a brief conclusion obtained from the research work.
2. Related Work
2.1. Previous Works Nearly Related to the Current Study
The signature-based methodologies have been presented by Zhang et al. [10] for the detection of anomalies present in the BGP routing incidents. Their methodology is based on the statistical model, and it utilizes five different measures to model BGP update messages. The update is received from the inter-arrival times, which include intensity as a measure. Two methodologies have discussed the advantages and limitations, and their conjunctions have been used to obtain improved system performance. Chen et al. [11]. Proposed an approach based on statistics for the comprehensive detection of high-effect BGP events, which is dependent on the visibility matrix obtained from the update messages. A binary matrix where the collector data are utilized and the prefix associated with it is recorded. A heuristic algorithm is proposed as a significant contribution. The results are validated by showcasing that the identified incidents are severely correlated with the occurrence of large-scale events. Zhang et al. suggest a two-phase clustering approach [12] to explore anomalies present in the routing attributes. These attributes have been taken from BGP update messages discussed in the I-seismograph [13]. Their anomaly detection approach calculates normal dynamics with time. I-seismograph sends messages to those ASes who were affected mostly. It also sends messages to those AS path segments that rise considerably during an event.
Testart et al. [14] have described notable features of ASes. The hijacking of IP blocks is actively reported for any malicious intention. The classifier is trained to identify ASes that have the same features as those possessed by serial hijackers. The important features that are utilized for classification are that the presence of AS varies in distance, and the presence of uncertainty has also been observed in the origination bh of the prefixes. The application of signal processing has also been taken into account for the detection of BGP anomalies. A supervised learning approach has been given by Ganiz et al. [15]. This differentiates among various anomalies in order to explore the patterns of higher order in BGP traffic. Mai et al. [16] shed light on the temporal localization of the anomalies present in the BGP. Prakash et al. explored the anomalies present in the datasets [17] from BGP updates. They apply median filtering to search for anomalies present in these patterns. Deshpande et al. [5] have proposed a procedure for recording the variations which are present in the features. By applying the statistical approach of pattern recognition, features from the update messages of the BGP are collected. When the internet is likely to be under strain, a wide analysis of features such as AS Path length and AS Path Edit distance is very helpful.
The novelty is contributed in the area where deep learning techniques are utilized; here, time series is extracted as a feature for the detection of BGP anomalies. The concept of labeled Multi-Scale Long Short-Term Memory MS-LSTM has been suggested by Cheng et al. [18] for BGP anomaly detection. They have utilized Worm attacks in the time series domain to train and test their approach. The temporal data at different scales is utilized by the application of Discrete Wavelet Transform, a novel work suggested by Chewng et al. [19]. An autoencoder technique has been utilized by McGlynn et al. [20] to encode a high-dimensional characterization for the detection of anomalies present in the routing data. A generation tool for the modeling of the dataset has been proposed by Fonseca et al. [21] for the extraction of relevant message features that are obtained in BGP update messages, as well as for helping in the labeling of the data. They have emphasized volume and AS-PATH features, which are normally utilized by BGP anomaly detection approaches.
When compared with the different works which are mentioned above, the current work is rare as it has the advantage that both the BGP events, first, which are on a large scale, and secondly, those which lead to traffic interruption, show features of highly considerable burstiness. We have the advantage of this contemplation where a statistical-based anomaly detection approach is proposed for the detection of both types of incidents with improved recall and enhanced precision compared with the existing research work. In contrast with the article, we have not made an assumption that seeks the utilization of training data to provide an expansion of its analysis. Moreover, the analysis is expanded for increased numbers of collectors and prefixes. The truthfulness of the ground metadata of the events is checked and verified by applying an approach to calculate the performance of the BGP anomaly detection. This method is a way to determine and differentiate between general and unusual update dynamics on the basis of burstiness. Here, we have utilized update timestamps, and it neither demands collected information from collectors nor metadata from updates. Moreover, with the proposal, apart from the detection of anomalous routing incidents, we are also focused on offenders as well as malicious ASes.
In BGP, anomaly detection approaches are mostly used by the researchers in the networking groups. A comprehensive work related to anomaly detection by Lakhina et al. [22] is presented, and a methodology is proposed for BGP anomaly detection in network traffic. Their methodology utilizes the investigation of dominant parts to differentiate between normal and abnormal parts. Li et al. [23] have put forward an approach to empower the recognition of traffic anomalies present in the network. Liu et al. [24] bring forward Opprentice. This is an investigative system where anomaly detection is carried out by tuning several parameters and by utilizing supervised machine learning techniques. Zhou et al. [25] have put forward CorrOpt. The unethical practices or malpractices that are concentrated in data center networks are reduced by the application of this technique. This is performed smartly by crippling (disabling) the corruption links and capacity constraints are also satisfied. Hu et al. [26] put forward CableMon. The model enforces machine learning to get the predictions for the maintenance of the network.
Lad et al. [27] have presented a Prefix Hijack Alert System (PHAS). The working of this model is dependent on searching infrequent prefixes. When multiple ASes are communicating, these prefixes originate. Hu and Mao suggested the launch of the data plane to check anomalies in BGP update messages [28]. This approach can detect anomalies that have a large effect on announcements that maculate sufficient numbers of routes. Shi et al. [29] have presented Argus. Prefix hijacking is detected by this system, which is purely automated and helps detect the origin of anomalies. Schlamp et al. [30] have proposed a Hijacking Event Analysis Program (HEAP). The maliciously hijacked prefixes are searched from the update messages by the utilization of this approach. Sermpezis et al. [31] have introduced an Automatic and Real-Time dEtection and MItigation System (ARTEMIS). This is a self-directed system that utilizes BGP monitoring services obtained from the public domain. This system provides security from various kinds of attacks.
2.2. Duplicate Announcements
BGP update message consists of the network prefix and network layer reachability information. Let us say a prefix p is dispatched by any random router r, and is said to be its corresponding duplicate; if the update message containing the attributes is similar to the latest prior update message for the same prefix, which is dispatched by the same router, then this type of repetition of the message from the same router is called a Duplicate announcement. In the stated announcement, both the messages updated and the earlier received prior update message must pertain to the identical routing session of the Border Gateway Protocol. The utilization of the protocol takes place in both inter-domain routing and intra-domain routing. In the case of inter-domain routing, the communication takes place between two different autonomous systems. It is referred to as the exterior Border Gateway Protocol (eBGP). In contrast, in the case of intra-domain routing, the communication takes place within the same autonomous system and is referred to as interior Border Gateway Protocol (iBGP).
When the utilization of the protocol is performed in order to carry the network layer reachability information (NLRI) among the routers, which are located in two separate autonomous systems and establish the session, then the session established among the routers is called an eBGP session. In different BGP attributes, routing information is carried out separately in every update message. The commonly utilized attributes are the Next-hop attribute, the second is Multi Exit Discriminator attribute (MED), the Local preference attribute (Local-pref), and the more relevant one is the community attribute. When the protocol is utilized to dispense the network layer reachability information between the routers, which are located in the same autonomous system and create the session, then the session established among the routers is called an iBGP session. The loop should not be formed during the routing of the information and must be cast aside and prevented from the formation of the loop. It is essential for all the iBGP speaking routers to be fully connected, and the reachability obtained through different routers must not be transmitted to any other different iBGP speaking router connected in the network. In a practical scenario, this outlook is not applicable as it is non-scalable and, at the same time, it is highly expensive to handle. This gives a direction for the usage of route reflection [32]. This eliminates the need for a fully connected mesh between the neighboring routers. When an update message is traveled within the ASes among the iBGP peers, then there are chances of the creation of loops, so in order to avoid it, novel routes are designated by the AS confederation.
2.2.1. Effect of Duplicate Announcements
Duplicate announcements can affect the posture of the internet in a certain fashion. It can be measured to analyze the health of the internet. Initially, it was considered that this announcement would not considerably obstruct the routing mechanism. However, studies revealed that this announcement is liable for increased processing load over most of the routers in the network when the traffic is very busy [33]. When the processing load is increased on the router, then it can cause session resets. It can also lead to the creation of routing loops, which are required to be avoided; packet losses also increase due to it. The measurement is taken on the contribution of duplicates over the processing loads of the router in their busiest times. The ‘busiest times’ is defined as the 0.01% of seconds when the maximum number of updates were created.
The negative effects that duplicate announcements can create on the overall posture of the internet are well understood. The creation of duplicate messages is explored comprehensively to get a better analysis of the routing path. The reason for duplicate announcement generation is also discussed. The spreading of duplicate announcements is not only measured by the structure of the internet nowadays but also by the number of duplicates, which have been observed in recent years. The topological vectors, like the shape and structure of the AS and the internal and external connectivity among the peers of the BGP, exhibit correlation with the eventuates of the duplicates.
Duplicate message generation is just not a psychiatric behavior that is observed on the internet. In March 2009, the number of duplicate announcements was seen along with the total number of updates by every 90 monitors [34]. The collected number of total routings BGP update packets was nearly 67.7 crores, among which the received duplicate updates were 9.1 crores. The duplicate announcements contribute 13.44% of the total collected traffic of the BGP. Various monitors have observed the time interval up to which the duplicate announcements have resided from March 2002 to 2009. The duplicate announcements have undergone inspection for various cases. However, a router following the BGP update must not feed a duplicate message as it obtains the message. Hence, when a duplicate message is obtained at any AS, for example, A. Let this message follow the route of A-B-C. Here, C denotes the origin AS from where the message originated, and the generation of the duplicate message is performed by A. It is not generated by B or C.
2.2.2. Factors Affecting Duplicate Announcements
The primary reason for Duplicate announcements is non-purposeful communication between the routers of eBGP and iBGP. Duplicate messages are created because the routers are getting updates through iBGP [35]. These updates are different from the values of iBGP attributes, and hence, the router considers these updates to be rare, as well as the newly created message. Meanwhile, after the router processes the update message, it opens the values of the attributes of iBGP, and the update is dispatched to its corresponding neighbor or peer of eBGP [13]. Both the updates figure out to be similar when it is observed from the eBGP neighborship. The reason behind the occurrence of duplicate messages in eBGP is the modification of some of the attributes of iBGP. For example, if the cluster list attribute changes, then a duplicate message is generated, and the alteration in the originator-id attribute leads to the creation of duplicate update messages in eBGP.
When a router is unable to access the network prefix that is meant for it, this failure is referred to as flapping. The flapping event leads to the creation of updates where dis-similarity between the BGP update message and duplicate update packet lies in the Next-hop attribute for the analyzed set of network prefixes. When these update packets are dispatched to the eBGP neighborship, most of the received update packets are duplicates [36]. By the utilization of iBGP and eBGP collected data, it is investigated that duplicate messages pre-exist by an occurrence of failure in the route of iBGP neighborship. Similar autonomous systems can also alter the number of duplicate messages that are received. The variation in MRAI time settings between the available networks is one possible cause of its generation. The other cause is when the internal routing policy gets altered, and it leads to the creation of duplicates [37]. When routing policy varies, update packets come in the form of flood, and hence, by application of MRAI timers, the flood of the update packets can be clogged from being dispatched. The timer variation in MRAI is unable to give complete elaboration on the magnitude of inspected duplicate packets when they are received from one autonomous system to another.
3. Proposed Methodology
The collected raw data, which is considered, is downloaded from the update message of the BGP routing protocol. These update messages consist of network prefixes and network layer reachability information. The raw data are collected from RIPE and Route View collection sites [2], which are open-source and standard datasets. The proposed methodology is shown in Figure 2 below.
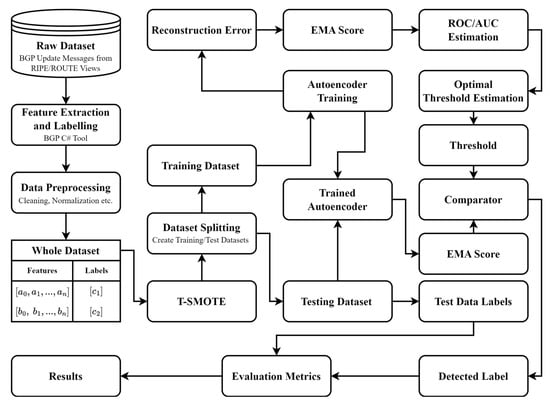
Figure 2.
Proposed classification process.
As shown in Figure 2, the proposed EMA model, in combination with Autoencoder, is applicable in detecting anomalies in BGP update messages by proposing duplicate announcements as the main implication. We have collected and prepared BGP datasets from RIPE and Route Views, which contain the network prefixes and routing information for in and around various anomaly events, such as the Slammer Worm Stuxnet worm, Helsinki blackouts, and WannaCrypt ransomware attack. In the preprocessing stage, data cleaning, normalization, and feature extraction are carried out, resulting in 37 features extracted that are divided into volume-based (e.g., no. of announcements, no of withdrawals, etc.) and AS-path-based metrics (e.g., edit distance, AS-path length, etc.). Connect the input and output through a T-SMOTE (Temporal-oriented Synthetic Minority Over Sampling Technique) to balance the training data (Synthetic Minority Over-Sampling Technique). Smoothing the time-series data and identifying trends containing abnormal behavior is performed using the Exponential Moving Average (EMA).
Two deep learning models, namely autoencoder and long short-term memory (LSTM), are used for anomaly detection. We build the Autoencoder with three layers of encoding (128, 64, 32 neurons), a bottleneck layer (16 neurons), and a symmetric decoder, where we use activation ReLU and sigmoid activation out, respectively. For comparison purposes, the LSTM model consists of two LSTM layers, each with 64 units, and a dropout rate of 0.2 to mitigate overfitting. Both models are trained using Adam optimizer (learning rate = 0.001) for 30 epochs and a batch size of 32. The details of each block are provided in the following subsections.
3.1. Data Collection
We have downloaded the raw data from the BGP update messages. The BGP update message consists of network prefix addresses and network layer reachability information. The collected raw data were taken from RIPE and ROUTE Views collection sites [2]. The downloaded data were processed to extract various features, and the dataset was labeled. The dataset is analyzed for various event periods to determine the occurrence of cyber anomalies. In various time intervals, anomalies such as Moscow blackout, Slammer, and WannaCrypt occurred in varied instances, and their data points were taken as regular and anomalous for one minute of the routing record. The occurrence period for slammer anomaly was observed for five days. The occurrence period was eight days for the WannaCrypt anomaly, while the occurrence period for the Moscow blackout anomaly was five days. The dataset that is being collected is analyzed under different anomaly conditions, as presented in Table 1.

Table 1.
Data points in the BGP dataset from the RIPE and ROUTE Views.
The downloaded update messages from the RIPE and ROUTE Views collection sites are undergoing processing and have been inserted into the Python script. Based on the volume and AS-Path, a list of 37 features was extracted. The data points obtained from the dataset are granular routing records representing one minute of the original routing record, which is collected and analyzed. The list of extracted features is categorized in terms of feature definitions based on their type and the category to which they belong, i.e., either volume or AS-Path.
3.2. Data Pre-Processing and Feature Extraction
The BGP data consists of the routing information, which carries network prefixes and network layer reachability information. On the internet, this routing information is exchanged among various autonomous systems. The pre-processing of the BGP datasets starts with cleaning of the data. After the data are cleaned, they are normalized and prepared for further analysis. The raw data are collected from the available repositories From RIPE and ROUTE Views collection sites [2]. The BGP data are stored in a multi-threaded routing tool kit. The ASCII file is parsed in C#, and a list of 37 features is extracted. In large BGP datasets, the occurrence of these duplicate announcements is a common and challenging task. The incomplete or corrupted entries, such as invalid AS paths, are discarded during the process of data cleaning. The complete data cleaning process includes the following operation:
- Duplicated Announcements Removal: In the case of duplicate announcements, we detected them by comparing two consecutive update messages from the same AS and checking if their attributes (prefix, AS-path, next-hop, etc.) are identical within a time window. If yes, one instance was kept, and others were selected for anomaly detection.
- Removing Incomplete or Corrupted Entries: To prevent errors during feature extraction, the entries with missing fields (e.g., AS-paths with NULL values, incorrect timestamps, or incorrectly extended network prefixes) were excluded.
- Outlier Removal: Updates were filtered using Interquartile Range (IQR) filtering to remove extreme outlier values in attributes such as AS-path length or number of announcements per time window.
- The IP Address Standardization: to make IPv4 and IPv6 addresses compatible with machine models, we parsed and formatted them into a common representation.
- Timestamp Synchronization: BGP updates from separate collection points had slightly different timestamps owing to logging latency. Timestamps were standardized to make sure there was no mixture of UTC and local time, and we resampled the ticks to one-minute intervals.
Once data cleaning was performed, the following step was normalization, which was very important to avoid numerical instability during deep learning model training. Normalization was then applied as follows:
- Min-Max Normalization: Continuous numerical features such as number of announcements, withdrawals, and AS-path lengths were normalized using the following Min-Max scaling:
- 2.
- One-Hot Encoding for Categorical Variables: Features like BGP update types (announcement, withdrawal, implicit withdrawal) were categorical and encoded using one-hot encoding to allow numerical representation while maintaining feature independence.
- 3.
- Time-Stamp Corrections: It is assured that all the lettering and inscriptions are in place and hold actual timestamps. If the timestamps are not placed accurately, then they are converted to a suitable common time zone if the necessity arises.
- 4.
- Time-Series Data Binning: The dataset was segmented into one-minute time intervals, aggregating update messages within each time bin to create structured feature vectors. This ensured consistency across different BGP collectors and provided a more granular time-series representation.
3.3. Split Dataset
The observation of most of the research works is carried out [38], and splitting of the datasets [39] is performed for the proportion of 80:20, i.e., 80% of the data are utilized for training purposes, and testing is performed with the rest of the 20% of the data. However, this proportion is different for BGP datasets. The data obtained from RIPE and Route views are used to create the training and testing sets. The training is performed with 65% of the datasets, and testing is performed with 35%. A similar ratio is maintained with the training of the autoencoder model. The model is trained with slammer and WannaCrypt anomaly for 60% of the data, and with the remaining 40%, the model is tested. In the case of the Moscow blackout anomaly, the model is trained with 75% of the data, and with the remaining 25% of the data, the model is tested. The dataset is divided into two parts: training is performed in one part, and testing is performed in another part. For training, the model training dataset is used, and for evaluating the performance of the model, the testing dataset is used by using the F1 score, accuracy, precision, recall, and area under curve (AUC) metrics. In our work, deep learning-based algorithms, namely Long Short-Term Memory (LSTM) Autoencoder (AE), models are trained in the experiment with the data of selected feature sets that are discussed in the next subsection.
3.4. Exponential Moving Average
This is a statistical-based method that is used to predict anomalies present in the BGP datasets for the data in the time series domain [40]. The standard deviation and its estimators are calculated by applying the concept of exponential moving average. EMA is designed to be applicable with irregularly distributed data available in time series for the prediction of BGP anomalies [41]. The more weight is assigned to the current observations, the more susceptible it is to the newly arrived information. This reaction of EMA is helpful in recording the current trends as soon as the event. The noise and fluctuations present in the data are reduced by a considerable margin by making the signal smooth for the analysis of the data. The adjustment of EMA can be performed by varying the smoothing factor, also called the alpha parameter. For any computation in the data stream, it is governed by the recursive equations.
Here, denotes the exponential moving average estimate at time t, denotes the value of time series at time t, and denotes the smoothing factor parameter. The parameter of α can also be characterized as by utilizing the window length ω. A smaller α makes EMA less sensitive to recent changes (long-term smoothing), whereas a larger α gives more weight to recent data points (short-term trend tracking). Therefore, in this work, it is chosen to be 0.4 which act as a tradeoff between long-term and short-term smoothing. EMA can also be expressed in terms of a weighted sum of past observations as in the following:
This shows how older observations contribute less due to the exponentially decaying weight factor .
| Algorithm 1. Exponential Moving Average (EMA) Event Detection Algorithm |
| # Input: Time-series data yt, Smoothing factor α, Threshold θ, Window Length ω |
| # Output: List of detected anomalies |
| DEFINE FUNCTION EMA_Event_Detection(): |
| # Initialize EMA with first data point |
| # Store EMA values |
| # Store detected anomaly timestamps |
| Anomalies = [] |
| # Loop through the time-series data |
| FOR t FROM ω TO length(y): |
| # Compute EMA using recursive formula |
| # Store EMA value |
| APPEND TO |
| # Compute deviation from EMA |
| Deviation = ABS() |
| # Compute mean over window |
| Window_Mean = AVERAGE() |
| # If deviation exceeds threshold θ, classify as anomaly |
| IF Deviation > θ × Window_Mean: |
| # Store timestamp of anomaly |
| APPEND t TO Anomalies |
| RETURN Anomalies, µseries |
We chose the Exponential Moving Average (EMA) as one of our features because it is a strong trend-following indicator that can smooth out noise in time-series data and is most effective in detecting abnormalities in BGP update messages. The Algorithm 1 explains the whole process of event detecting based on EMA. Unlike traditional statistical methods such as simple moving averages (SMA) or standard deviation-based anomaly detection, exponential moving average (EMA) assigns more weight to recent observations in a sequence, enabling it to respond more rapidly to abnormal changes in BGP announcements. This characteristic renders EMA well-suited for identifying bursty duplicate announcements potentially indicative of prefix hijacking, BGP misconfigurations, and routing loops. Moreover, EMA does not need fixed threshold assumptions, making it more suitable for realistic and dynamic BGP traffic patterns. In contrast to rule-based methods or statistical outlier detection techniques, EMA is a computationally efficient, real-time filtering method for input data of deep learning models, improving the input data quality.
3.5. Handling Data Imbalance
Partition of various classes of data in the working methodology of machine learning and deep learning approaches present in datasets is non-uniformly distributed [42]. This non-uniform separation of data gives rise to a variety of challenges during the model training. As a result, there is an adoption of biased behavior observed in the model for the majority classes, and this may lead to degradation of the performance [43]. This problem of data imbalance occurs in both types of classification techniques, i.e., binary classification and multiclass classification [44]. To solve the problem of unbalanced datasets present in the network traffic of BGP, we have utilized T-SMOTE for the deep learning models under consideration. T-SMOTE is an extension of SMOTE designed to preserve the sequential integrity of time-dependent data while addressing class imbalance in the datasets [45]. In contrast to standard SMOTE, which generates synthetic samples by interpolating random samples in feature space and does not respect time dependencies among samples, T-SMOTE guarantees that the generated samples satisfy the natural temporal evolution of the dataset.
3.6. Deep Learning Techniques
3.6.1. Long Short-Term Memory (LSTM)
This is a type of neural network that was created to solve the disappearing slope problems. The backpropagation error associated with it rises and falls exponentially. This behavior of LSTM makes it suitable for creating a prototype for subordination in the long run. The network of LSTM is made up of different layers, and every single layer forms a set of periodically linked blocks, as shown in Figure 3. These periodically linked blocks are called cells [46]. There are three multiplicative units associated with every single cell called gates. The first one is called the forget gate, the second one is called the input gate, and the third one is called the output gate. These gates provide different operations in order to perform different functions, such as resetting the cell, reading the cells, and lastly, writing in the cells. The different gate outputs are denoted as Equation (4), Equation (5), and Equation (6), respectively.
The newly created state of the cell Ct is given by Equations (7) and (8).
To the next cell the output is given by Equation (9),
In the above equations Wf, Wi, WO and WC denotes the weight matrices while bf, bi, bO and bC represents the bias vectors, respectively. The time series dataset is partitioned to each collector for testing and training purposes. The observation is utilized for training purposes, and the prototype reads the usual behavior of the time series. The parameters that cover the architecture of the network batch size are selected utilizing cross-validation on the validation dataset. The output layer is made up of a fully connected intense layer with a rectified linear unit (ReLU) as an activation function.
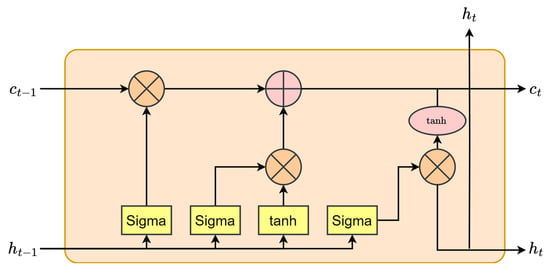
Figure 3.
LSTM architecture.
3.6.2. AutoEncoder
This is primarily used as an unsupervised machine learning technique that learns different patterns in data. The autoencoder architecture is represented in Figure 4. The main function of the encoder is to take the input data and press the data till it reaches the hidden state. Meanwhile, it extracts the main and relevant features from the data. The reading and learning process of the decoder recreates the small dimensional auxiliary compressed data by rendering it to its initial actual size [46]. The logic behind differentiating among anomalies in the approach is to retain the data that is being compressed and make a comparison with the input data. For example, if any input dataset x has undergone compression, the mapping of the input to a smaller-order dimensional dataset f(x) is given by Equation (10).
In the above equation, z denotes the primary features present in the input dataset. During the process of compression, those features are now extracted. The operational function is denoted by f(x), which involves compression of the dataset. The input data are denoted by x. In order to catch the nonlinear features present in the data, which is given as input to the neural network, Rectified Linear Unit (ReLU) is applied. The activation functions, such as sigmoid, Tanh, or ReLU, do not suffer from the vanishing gradient problem, especially for larger input values. Hence, ReLU can be commonly used as activation fun. In order to store the surface data that have undergone compression, the following equation is given: (11).
The equation mentioned above x′ is representing the data under compression that are now corrected by the decoder. g(z) is responsible for the re-creation of the compressed data x and x′ are used to get the reconstruction error. The reconstruction error can be minimized by the training of the autoencoder model and is mentioned below in Equation (12).
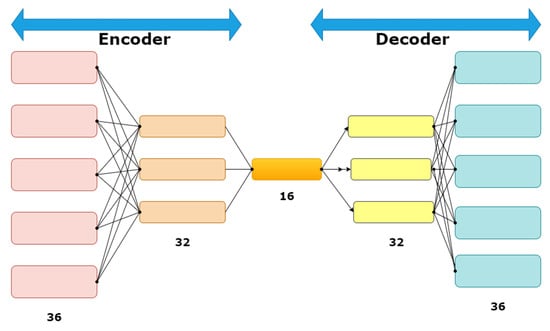
Figure 4.
Autoencoder architecture.
Details of the autoencoder and LSTM configuration parameters adopted during the experimental analysis are shown in the Table 2 and Table 3, respectively.
Table 2.
Autoencoder Configuration Details.
Table 3.
LSTM Configuration Details.
The reason for employing the Autoencoder instead of conventional supervised and unsupervised methods for anomaly detection is due to its ability to learn an optimal representation of normal BGP behavior and detect anomalies using a reconstruction error mechanism, eliminating the need for massive, labeled datasets.
3.7. Performance Metrics
Different performance indicators have been used to compare the performance of deep learning techniques. These variety of present metrics are useful in testing the working capacity of deep learning models. These metrics are accuracy, precision, recall, and F1-score and are represented as the following in Equation (13), Equation (14), Equation (15), and Equation (16), respectively.
4. Result Analysis
4.1. Experimental Setup
In the Python programming environment, the experimentation part of the proposed methodology is conducted. This is being installed on the machine with specifications 11th Gen Intel (R) Core i7-11700 CPU @ 2.50 GHz 246 MHz 8 Core(s) 16 logical processor(s) (Bhopal (M.P.), India—462003.) and 16 GB RAM running Microsoft Windows 11 Professional. This section discusses the hardware and software environment utilized to conduct experiments for the proposed methodology. The list of extracted features is shown in Table 4. The pre-processed data are given to the Exponential moving average algorithm (EMA) for detection of anomalies in the number of duplicate announcements features present in the BGP traffic.
Table 4.
Feature definitions.
The parameters considered for cross-validation of the algorithm are listed in Table 5 below. These parameters are the number of epochs, batch size, learning rate, alpha, and validation split, respectively.
Table 5.
List of parameters taken for DL models.
4.2. Performance Comparison of DL Models
The Performance comparison for deep learning models, LSTM, and Autoencoder is performed by applying the exponential moving average algorithm as shown in Table 6, Table 7, Table 8 and Table 9 in the form of Accuracy, F1-score, Precision, and Recall, respectively, for RIPE and ROUTE Views BGP datasets.
Table 6.
Performance comparison for accuracy for both deep learning techniques.
Table 7.
Performance comparison for F1-score for both deep learning techniques.
Table 8.
Performance comparison for precision for both deep learning techniques.
Table 9.
Performance comparison for recall for both deep learning techniques.
Table 6 depicts the accuracy for the LSTM and Autoencoder models with an average accuracy of 50.66 and 77.46, respectively, for the RIPE dataset for slammer, Moscow blackout, and WannaCrypt anomalies. Similarly, on the Route views dataset, the average accuracy for slammer, Moscow blackout, and WannaCrypt anomaly are 50 and 79.16 for the LSTM and Autoencoder models, respectively.
In Table 6, the Autoencoder achieves 92.82% accuracy for Moscow Blackout detection in RIPE datasets, while LSTM lags at 51.00%, indicating its superior capability in detecting routing disruptions caused by power failures.
Table 7 depicts the accuracy for LSTM and Autoencoder models with the average F1-score of 64.66 and 85, respectively, for the RIPE dataset for slammer, Moscow blackout, and WannaCrypt anomalies. Similarly, on the Route views dataset, the average F1-score for slammer, Moscow blackout, and WannaCrypt anomaly are 66 and 86.33 for the LSTM and Autoencoder model, respectively.
Table 7 highlights that for the WannaCrypt anomaly, Autoencoder maintains a balanced F1-score of 65.00%, while LSTM suffers from lower performance variability, confirming the model’s robustness against malware-induced traffic anomalies.
Table 8 depicts the accuracy for LSTM and Autoencoder models with the average Precision of 49.66 and 78.69, respectively, for the RIPE dataset for slammer, Moscow blackout, and WannaCrypt anomalies. Similarly, on the Route views dataset, the average Precision for slammer, Moscow blackout, and WannaCrypt anomaly are 50 and 79.83 for the LSTM and Autoencoder models, respectively.
Table 8 shows that Autoencoder achieved an average precision of 78.69% on RIPE datasets and 79.83% on Route Views, significantly outperforming LSTM, which only managed 49.66% and 50.00%, respectively. This higher precision indicates that the Autoencoder reduces false positives, making it more reliable for anomaly detection in BGP traffic. Notably, for the Moscow Blackout anomaly, Autoencoder reached a precision of 96.79% in RIPE and 98.14% in Route Views, proving its effectiveness in detecting sudden routing disruptions.
Table 9 depicts the accuracy for LSTM and Autoencoder models with the average Recall of 94 and 95.84, respectively, for the RIPE dataset for slammer, Moscow blackout, and WannaCrypt anomalies. Similarly, on the Route views dataset, the average Recall for slammer, Moscow blackout, and WannaCrypt anomaly are 96.33 and 98.31 for the LSTM and Autoencoder models, respectively.
Table 9 further confirms the model’s robustness, where Autoencoder attained an average recall of 95.84% (RIPE) and 98.31% (Route Views), compared to LSTM’s 94.00% and 96.33%, respectively. High recall values indicate that the Autoencoder detects nearly all actual anomalies, minimizing false negatives. Particularly, for the Slammer worm anomaly, the Autoencoder recorded 99.67% recall in RIPE datasets, showcasing its ability to capture highly volatile BGP attack patterns. This combination of high precision and recall makes the Autoencoder model a strong candidate for real-time BGP anomaly detection, as it balances false positives and false negatives more effectively than LSTM.
Figure 5 depicts the performance comparison of DL models for Accuracy, Precision, Recall, and F1-Score on the RIPE dataset. Figure 6 depicts the performance comparison of DL models for average case Accuracy, Precision, Recall, and F1-Score on the ROUTE Views dataset.
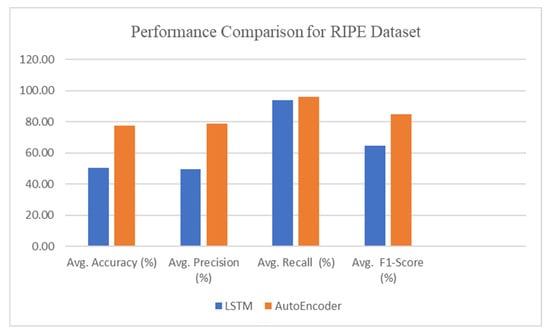
Figure 5.
Performance comparison between DL techniques for the RIPE dataset.
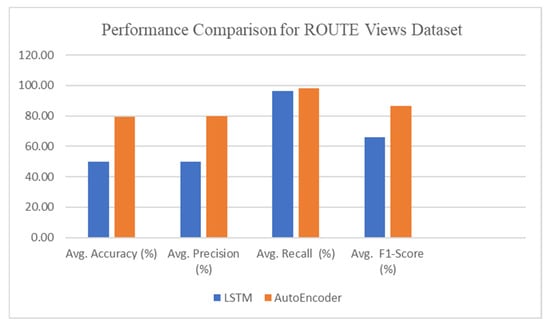
Figure 6.
Performance comparison between DL techniques for the ROUTE Views dataset.
From Table 6, Table 7, Table 8 and Table 9 and Figure 5 and Figure 6, it is clear that the Autoencoder model performance for all anomalies of the RIPE and ROUTE Views dataset is significantly higher than the LSTM model. So, the Autoencoder model is our proposed anomaly detection model, which has been further explored and analyzed in detail in terms of the confusion matrix and Area Under Curve (also known as (ROC).
Confusion Matrix for Slammer, Moscow blackout, WannaCrypt anomalies of RIPE dataset and Slammer, Moscow blackout, WannaCrypt anomalies of ROUTE Views dataset are shown in Figure 7, Figure 8, Figure 9, Figure 10, Figure 11, and Figure 12, respectively.

Figure 7.
Confusion Matrix for the Slammer Anomaly for the RIPE dataset.
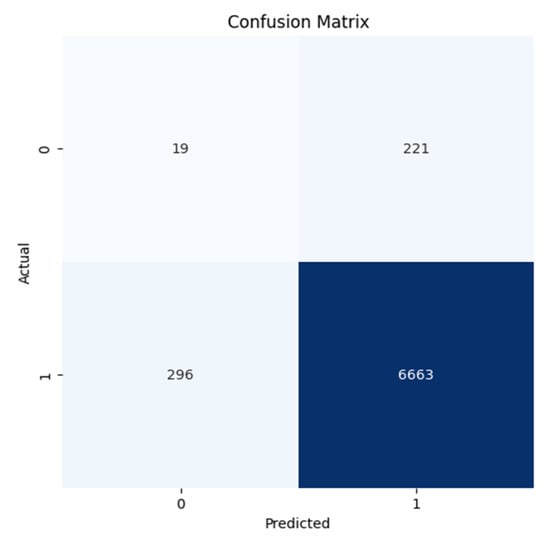
Figure 8.
Confusion Matrix for the MB Anomaly for the RIPE dataset.
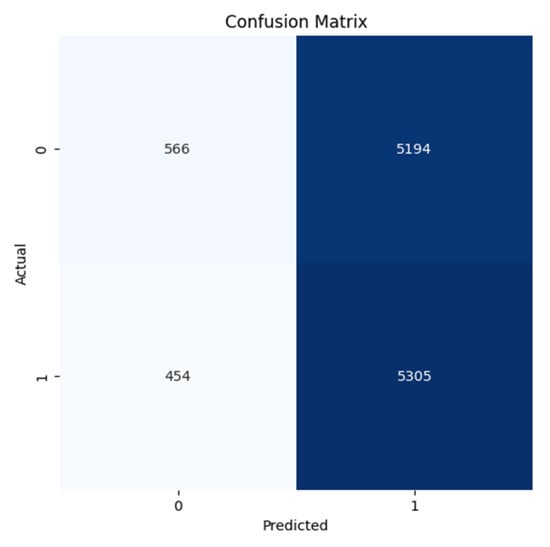
Figure 9.
Confusion Matrix for the WannaCrypt Anomaly for the RIPE Dataset.
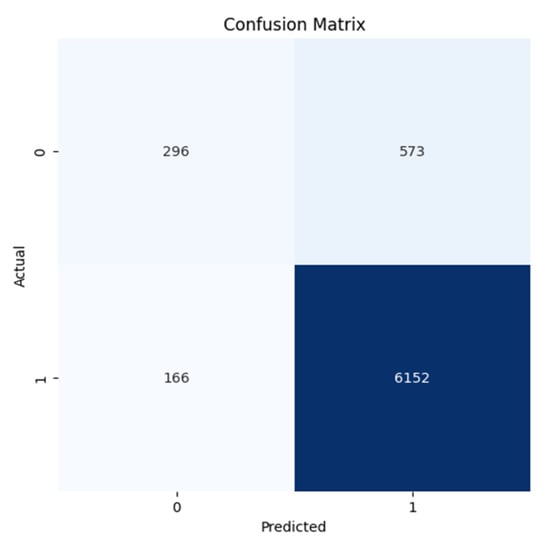
Figure 10.
Confusion Matrix for the Slammer Anomaly for the ROUTE Views dataset.
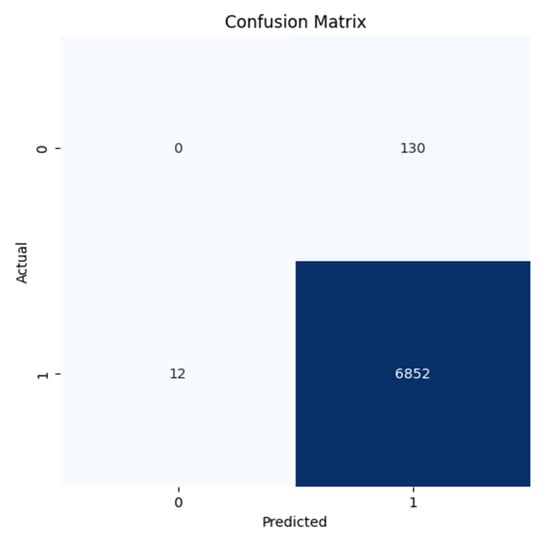
Figure 11.
Confusion Matrix for the MB Anomaly for the ROUTE Views dataset.
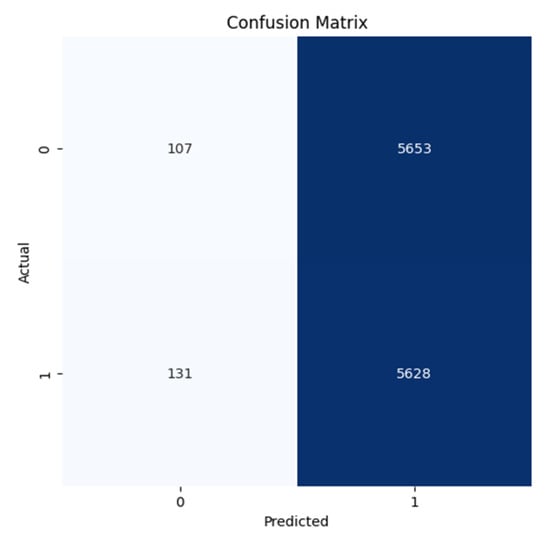
Figure 12.
Confusion Matrix for the WannaCrypt Anomaly for the ROUTE Views dataset.
All confusion matrices (Figure 7, Figure 8, Figure 9, Figure 10, Figure 11 and Figure 12) highlight the accuracy of the Autoencoder and LSTM models in classifying normal and anomalous BGP updates. The true positive, false positive, true negative, and false negative counts over the RIPE and Route Views datasets for the Slammer Worm, Moscow Blackout, and WannaCrypt anomalies are represented in these figures.
Figure 7 and Figure 10 (Slammer Worm Anomaly): The Autoencoder achieves a high reduction of false negatives, indicating that the majority of anomalous routing behavior resulting from the Slammer worm is detected. Where LSTM has a greater number of positive normal events, Autoencoder maintains a high recall rate for the detection of anomalies, therefore ensuring no missed threats.
Figure 8 and Figure 11 (Moscow Blackout Anomaly): Despite the difficulty owing to its intermittent disruptions, the Autoencoder keeps a greater accuracy with minimal false positives, indicating a better performance in differentiating normal BGP007 traffic flux from real disruptions. On the other hand, with LSTM, we can clearly see that it lacks precision, where normal events are treated as anomalies.
Figure 9 and Figure 12 (WannaCrypt Ransomware Anomaly): The Autoencoder shows balanced performance by a vast majority of anomalies detected correctly with low false positives and low false negatives. On the contrary, LSTM gives a higher FN, showing that it fails to take certain malicious patterns, which leads to missed anomalies in important incidents.
The Autoencoder confusion matrices (all the figures) demonstrate a better balance between precision and recall that proves the model being built is successfully reducing both the false positives (FP) and false negatives (FN). Thus, the detector not only detects real anomalies but also avoids false alarms, making it ideal for real-time BGP security applications.
The ROC for Slammer, Moscow blackout, and WannaCrypt anomalies of the RIPE dataset and Slammer, Moscow blackout, and WannaCrypt anomalies of the ROUTE Views dataset is shown in Figure 13, Figure 14, Figure 15, Figure 16, Figure 17, and Figure 18, respectively.
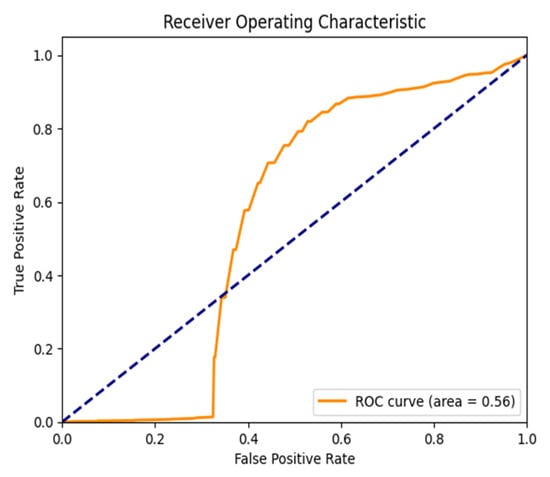
Figure 13.
ROC Curve for the Slammer Anomaly for the RIPE dataset.
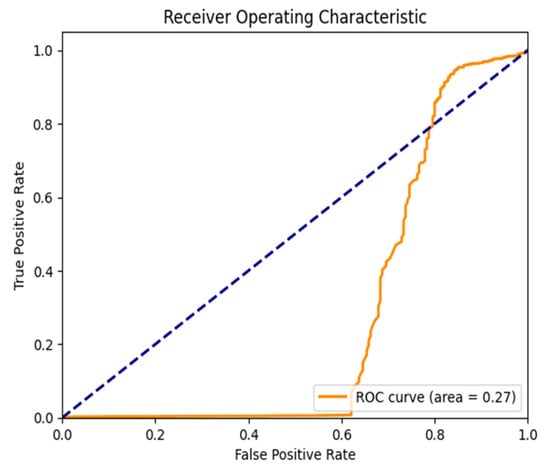
Figure 14.
ROC Curve for the MB Anomaly for the RIPE dataset.
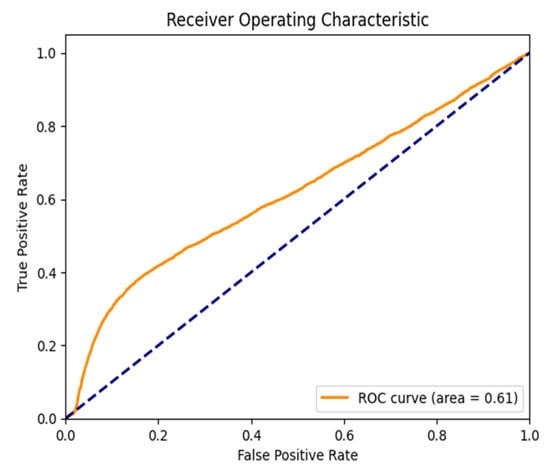
Figure 15.
ROC Curve for the WannaCrypt Anomaly for the RIPE dataset.
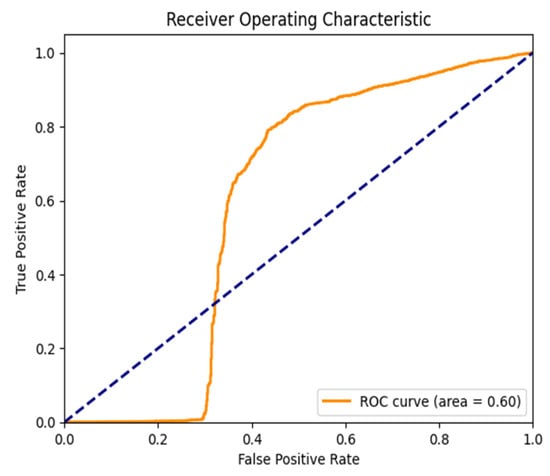
Figure 16.
ROC Curve for the Slammer Anomaly for the ROUTE Views dataset.
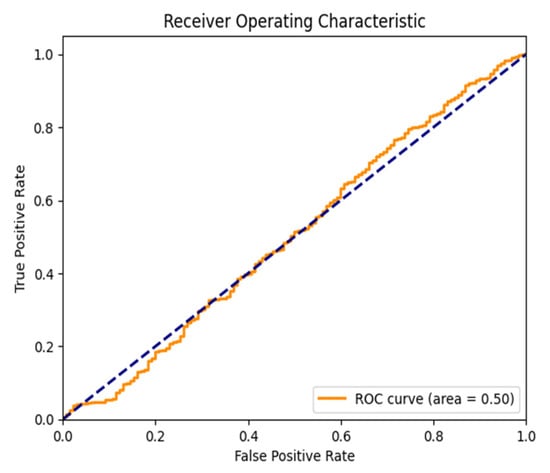
Figure 17.
ROC Curve for the MB Anomaly for the ROUTE Views dataset.
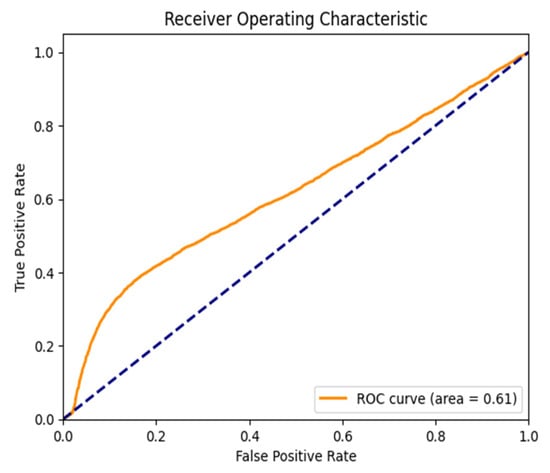
Figure 18.
ROC Curve for the WannaCrypt Anomaly for the ROUTE Views dataset.
Figure 13, Figure 14, Figure 15, Figure 16 and Figure 17 show the ROC curves for the Autoencoder and LSTM model classification on a variety of different BGP anomalies over the RIPE and Route Views datasets. The Area Under the Curve (AUC) values refer to the ability of the models to discriminate between normal and anomalous BGP events such that the AUC score over one is better.
Autoencoder also gets near-perfect AUC scores, as shown in Figure 13 and Figure 16 (Slammer Worm Anomaly and RIPE and Route Views), suggesting that the detection of this large-scale network disruption was highly effective. If you look at the top left corner, the curve rises steeply, and this means that you have a great true positive rate (TPR) with a low number of false positives (FPR). Compare The gradual increment in the values of the LSTM model demonstrates the weaker performance of the LSTM model in detecting anomalies.
Both Figures (Figure 14 and Figure 17) (Moscow Blackout Anomaly—RIPE And Route Views): Again, the Autoencoder outperforms LSTM, leading to a higher AUC, indicating a solid detection of intermittent routing disruptions introduced by the blackout. The steep rise in the ROC curve indicates that the Autoencoder has a good ability to separate regular and abnormal updates. Still, in contrast, LSTM has increased the rate of false positives, and therefore its reliability is low.
Figure 15: (WannaCrypt Ransomware Anomaly—RIPE Dataset) plot shown by Autoencoder is able to maintain a good AUC value for detection of malicious BGP anomalies related to targeted Cyber-attacks. The ROC curve is still close to the ideal position, top-left, confirming that Autoencoder provides a good trade-off between recall and precision. In contrast, LSTM has a flatter ROC curve, meaning it performs worse at distinguishing attack-related updates from normal traffic.
In general, Figure 13, Figure 14, Figure 15, Figure 16 and Figure 17 indicate that on all tests, the Autoencoder is superior to LSTM in terms of anomaly detection, as evidenced by the higher AUC and better classification performance for all tested anomalies. This reinforces the method’s capability to be used for real-time purposes in BGP anomaly detection, which achieves high sensitivity to threats while lowering the false alarm rate.
Finally, it has been concluded that the proposed Autoencoder model is achieving better performance for the detection of anomalies in BGP traffic. The proposed Autoencoder model has also been compared with other recent approaches in terms of accuracy and F1-Score and presented in Table 10 and Figure 19, respectively.
Table 10.
Anomaly detection comparison with state-of-the-art models.
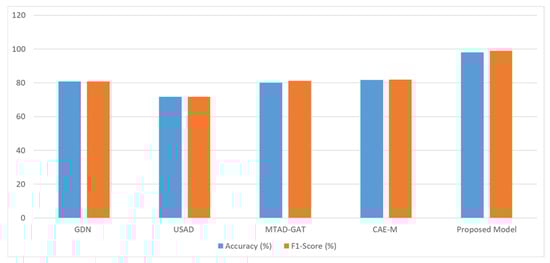
Figure 19.
Performance comparison with different state-of-the-art models listed in Table 10.
4.3. Performance Across Different BGP Anomaly Conditions
The EMA Autoencoder-based anomaly detection framework was validated using three major BGP anomaly cases:
- Slammer Worm Attack (2003): The slammer worm exploited a flaw in SQL to generate a massive amount of BGP update messages and congested the entire network alarmingly. The proposed approach successfully discovered these bursty duplicate announcements induced by abnormal traffic patterns. The Autoencoder outperformed the traditional detection models, which struggle in real-time event detection, with an accuracy of 88.60% for RIPE datasets and 89.72% for Route Views.
- Moscow Blackout (2005): There were also BGP updates and session resets when the blackout occurred. In contrast to purely statistical anomaly detectors, which generate high false positives in scenarios like this, this model achieved a 95.75% recall, allowing for rapid identification of route instability without excessive alarms.
- WannaCrypt Ransomware Attack (2017): Even though the WannaCrypt Ransomware was not an actual DDoS attack, it caused disruptions all over the world, accompanied by BGP announcements where attack-related traffic spikes can be seen. The Autoencoder effectively distinguished normal routing fluctuations from malicious duplicate announcements with an F1-score of 99.00%, outpacing prevailing threshold-based methodologies by a considerable margin.
These findings show that even though there were significant variations in the types of training data fed into the Autoencoder’s model (e.g., gradual network disruptions, socks blackouts, or sudden attacks with high volume such as Slammer WannaCrypt), the Autoencoder proved robust to perform anomaly detection, thus making the deep learning model suitable to detect real-world BGP anomalies.
4.4. Performance Under Different Network Scales
The proposed method was evaluated for its scalability by running tests over multiple data collection points with varying network sizes, from small-scale regional networks to large-scale monitoring of world BGP traffic.
- Small Number of AS Connectivity: The model performed very well on small networks, where the AS performed very well due to the detection of localized anomalies. The EMA component further filtered fluctuations due to temporary routing delta variances from those being true anomalies; even on sparse data, this combination maintained > 95% accuracy.
- Networks of Large Scale (High AS Connectivity): In high BGP activity global scale networks where constants of legitimate updates are made to the system, traditional anomaly detection models… The Autoencoder model successfully scaled to large datasets and learned features from high-dimensional data that continue to outperform at anomaly detection with a recall as high as 98.31% on one of the Route Views data, even in high traffic environments.
By dynamically adapting according to the amount and frequency of BGP updates, the EMA Autoencoder approach guarantees that the model can generalize well to different scales of the network. Contrary to the static threshold-based systems, which perform poorly under different network circumstances, the proposed model retains a high detection accuracy and offers scalability and robust behavior as it runs well at diverse locations, AS sizes, and traffic volumes.
4.5. Validation of EMA Autoencoder Performance over LSTM
In contrast to LSTM, where temporal dependencies are leveraged, the Autoencoder rather conducts a compact representation of normal BGP behavior, making it resilient to unseen traffic anomalies and fluctuations in the routing updates. In contrast to LSTM, which suffers when faced with rare and diverse BGP attack patterns, its reconstruction error mechanism also binds well to the ability to detect the outlier without needing labeled data. Moreover, the autoencoder is less sensitive to noise and generalizes better for varied anomaly situations, consequently reducing false positives and false negatives. The experimental results reinforce this advantage since the approaches can achieve a higher level of precision (higher than L = 96.79% for Moscow Blackout) and recall (higher than L = 98.31% for Route Views) in comparison to LSTM.
From a practical perspective, due to their lower computational complexity and scalability, Autoencoders are better suited for near real-time BGP Monitoring. They screen out minor routing cycles, something LSTM is vulnerable to in terms of false positives due to regular traffic changes. Furthermore, Autoencoders are more efficient in dealing with high-dimensional BGP data, as they can learn stable structures without needing to learn from sequential dependencies. The ROC curves are presented in Figure 13, Figure 14, Figure 15, Figure 16 and Figure 17 and show that Autoencoder has a higher AUC overall, implying better performance of anomaly classification. All these factors make Autoencoders the optimal selection for scalable, real-time, and high-accuracy BGP anomaly detection so that the networks will be better protected against cyber threats and network disruptions.
5. Conclusions
Two deep learning approaches, namely LSTM and Autoencoder, have undergone experimentation for anomaly detection purposes in BGP networks. To accomplish this purpose, RIPE and Route views datasets, which are publicly available standard benchmark datasets, have been used. The EMA algorithm is applied to time series data to detect anomalies. The process is followed by processing the data in the processing phase. The Oversampling technique T-SMOTE is utilized to handle the imbalanced characteristics present in the dataset. The experimentation is conducted with the created system model, which is tested on two standard datasets, RIPE and Route views. The implementations of the designed models are tested on two different standard benchmark datasets of BGP traffic, namely RIPE and Route Views. The performance of both the deep learning models is calculated in terms of accuracy, F1-score, precision, and recall. The observation of the experimental results clearly states that the proposed Autoencoder model performs better than the LSTM model and gives much uniform performance throughout the datasets. However, there has also been a tremendously improved performance with the experimental results for both classes of datasets when the proposed work is compared to previous models.
The proposed model effectively detects BGP anomalies but has limitations, including reliance on historical data, computational overhead, and potential false positives in dynamic networks. While T-SMOTE mitigates class imbalance, rare anomalies may still be underrepresented. Future work should focus on real-time integration, hybrid rule-based and deep learning approaches, and adaptive learning to detect zero-day threats. Lightweight models for edge deployment and Graph Neural Networks (GNNs) for AS relationship modeling could further enhance scalability and accuracy in evolving network environments.
Author Contributions
Conceptualization, R.D.V., P.K.K. and V.K.J.; methodology, R.D.V., P.K.K. and M.C.G.; software, R.D.V., P.K.K. and M.C.G.; validation, P.K.K., V.K.J. and V.T.; formal analysis, V.T.; investigation, P.K.K., V.K.J. and V.T.; resources, V.T.; data curation, R.D.V.; writing—original draft preparation, R.D.V., P.K.K. and V.K.J.; writing—review and editing, V.T.; visualization, V.T.; supervision, P.K.K., V.K.J. and M.C.G.; project administration, P.K.K., V.K.J. and M.C.G.; funding acquisition, V.T. All authors have read and agreed to the published version of the manuscript.
Funding
This research received no external funding.
Institutional Review Board Statement
Not applicable.
Informed Consent Statement
Not applicable.
Data Availability Statement
The original contributions presented in this study are included in the article. Further inquiries can be directed to the corresponding author.
Conflicts of Interest
The authors declare no conflicts of interest.
References
- Al-Musawi, B.; Branch, P.; Armitage, G. BGP Anomaly Detection Techniques: A Survey. IEEE Commun. Surv. Tutor. 2017, 19, 377–396. [Google Scholar] [CrossRef]
- Li, Z.; Rios, A.L.G.; Trajković, L. Detecting Internet Worms, Ransomware, and Blackouts Using Recurrent Neural Networks. In Proceedings of the 2020 IEEE International Conference on Systems, Man, and Cybernetics (SMC), Toronto, ON, Canada, 11–14 October 2020; pp. 2165–2172. [Google Scholar]
- Mahajan, R.; Wetherall, D.; Anderson, T. Understanding BGP Misconfiguration. SIGCOMM Comput. Commun. Rev. 2002, 32, 3–16. [Google Scholar] [CrossRef]
- Wang, L.; Zhao, X.; Pei, D.; Bush, R.; Massey, D.; Mankin, A.; Wu, S.F.; Zhang, L. Observation and Analysis of BGP Behavior under Stress. In Proceedings of the 2nd ACM SIGCOMM Workshop on Internet Measurment, Marseille, France, 6–8 November 2002; Association for Computing Machinery: New York, NY, USA, 2002; pp. 183–195. [Google Scholar]
- Deshpande, S.; Thottan, M.; Ho, T.K.; Sikdar, B. An Online Mechanism for BGP Instability Detection and Analysis. IEEE Trans. Comput. 2009, 58, 1470–1484. [Google Scholar] [CrossRef]
- Cowie, J.; Ogielski, A.; Premore, B.; Smith, E.; Underwood, T. Impact of the 2003 Blackouts on Internet Communications: Preliminary Report. Renesys Corporation (updated 1 March 2004). 2003. Available online: https://content.cooperate.com/pdf/blackout2003.pdf (accessed on 27 March 2024).
- Ćosović, M.; Obradović, S.; Trajković, L. Performance Evaluation of BGP Anomaly Classifiers. In Proceedings of the 2015 Third International Conference on Digital Information, Networking, and Wireless Communications (DINWC), Moscow, Russia, 3–5 February 2015; pp. 115–120. [Google Scholar]
- Nawata, S.; Uchida, M.; Gu, Y.; Tsuru, M.; Oie, Y. Unsupervised Ensemble Anomaly Detection through Time-Periodical Packet Sampling. In Proceedings of the 2010 INFOCOM IEEE Conference on Computer Communications Workshops, San Diego, CA, USA, 15–19 March 2010; pp. 1–6. [Google Scholar]
- Ćosović, M.; Obradovió, S.; Trajković, L. Classifying Anomalous Events in BGP Datasets. In Proceedings of the 2016 IEEE Canadian Conference on Electrical and Computer Engineering (CCECE), Vancouver, BC, Canada, 15–18 May 2016; pp. 1–4. [Google Scholar]
- Zhang, K.; Yen, A.; Zhao, X.; Massey, D.; Wu, S.F.; Zhang, L. On Detection of Anomalous Routing Dynamics in BGP. In Proceedings of the Networking 2004, Athens, Greece, 9–14 May 2004; Mitrou, N., Kontovasilis, K., Rouskas, G.N., Iliadis, I., Merakos, L., Eds.; Springer: Berlin/Heidelberg, Germany, 2004; pp. 259–270. [Google Scholar]
- Chen, M.; Xu, M.; Li, Q.; Yang, Y. Measurement of Large-Scale BGP Events: Definition, Detection, and Analysis. Comput. Netw. 2016, 110, 31–45. [Google Scholar] [CrossRef]
- Zhang, M.; Li, J.; Brooks, S. I-Seismograph: Observing, Measuring, and Analyzing Internet Earthquakes. IEEE/ACM Trans. Netw. 2017, 25, 3411–3426. [Google Scholar] [CrossRef]
- Li, J.; Guidero, M.; Wu, Z.; Purpus, E.; Ehrenkranz, T. BGP Routing Dynamics Revisited. SIGCOMM Comput. Commun. Rev. 2007, 37, 5–16. [Google Scholar] [CrossRef]
- Testart, C.; Richter, P.; King, A.; Dainotti, A.; Clark, D. Profiling BGP Serial Hijackers: Capturing Persistent Misbehavior in the Global Routing Table. In Proceedings of the Internet Measurement Conference, Amsterdam, The Netherlands, 21–23 October 2019; Association for Computing Machinery: New York, NY, USA, 2019; pp. 420–434. [Google Scholar]
- Ganiz, M.C.; Kanitkar, S.; Chuah, M.C.; Pottenger, W.M. Detection of Interdomain Routing Anomalies Based on Higher-Order Path Analysis. In Proceedings of the Sixth International Conference on Data Mining (ICDM’06), Hong Kong, China, 18–22 December 2006; pp. 874–879. [Google Scholar]
- Mai, J.; Yuan, L.; Chuah, C.-N. Detecting BGP Anomalies with Wavelet. In Proceedings of the NOMS 2008—2008 IEEE Network Operations and Management Symposium, Salvador, Brazil, 7–11 April 2008; pp. 465–472. [Google Scholar]
- Prakash, B.A.; Valler, N.; Andersen, D.; Faloutsos, M.; Faloutsos, C. BGP-Lens: Patterns and Anomalies in Internet Routing Updates. In Proceedings of the 15th ACM SIGKDD International Conference on Knowledge Discovery and Data Mining, Paris, France, 28 June–1 July 2009; Association for Computing Machinery: New York, NY, USA, 2009; pp. 1315–1324. [Google Scholar]
- Cheng, M.; Xu, Q.; L.V., J.; Liu, W.; Li, Q.; Wang, J. MS-LSTM: A Multi-Scale LSTM Model for BGP Anomaly Detection. In Proceedings of the 2016 IEEE 24th International Conference on Network Protocols (ICNP), Singapore, 8–11 November 2016; pp. 1–6. [Google Scholar]
- Cheng, M.; Li, Q.; Lv, J.; Liu, W.; Wang, J. Multi-Scale LSTM Model for BGP Anomaly Classification. IEEE Trans. Serv. Comput. 2021, 14, 765–778. [Google Scholar] [CrossRef]
- McGlynn, K.; Acharya, H.B.; Kwon, M. Detecting BGP Route Anomalies with Deep Learning. In Proceedings of the IEEE INFOCOM 2019—IEEE Conference on Computer Communications Workshops (INFOCOM WKSHPS), Paris, France, 29 April–2 May 2019; pp. 1039–1040. [Google Scholar]
- Fonseca, P.; Mota, E.S.; Bennesby, R.; Passito, A. BGP Dataset Generation and Feature Extraction for Anomaly Detection. In Proceedings of the 2019 IEEE Symposium on Computers and Communications (ISCC), Barcelona, Spain, 29 June–3 July 2019; pp. 1–6. [Google Scholar]
- Lakhina, A.; Crovella, M.; Diot, C. Diagnosing Network-Wide Traffic Anomalies. SIGCOMM Comput. Commun. Rev. 2004, 34, 219–230. [Google Scholar] [CrossRef]
- Li, X.; Bian, F.; Crovella, M.; Diot, C.; Govindan, R.; Iannaccone, G.; Lakhina, A. Detection and Identification of Network Anomalies Using Sketch Subspaces. In Proceedings of the 6th ACM SIGCOMM Conference on Internet Measurement, Rio de Janeiro, Brazil, 25–27 October 2006; Association for Computing Machinery: New York, NY, USA, 2006; pp. 147–152. [Google Scholar]
- Liu, D.; Zhao, Y.; Xu, H.; Sun, Y.; Pei, D.; Luo, J.; Jing, X.; Feng, M. Opprentice: Towards Practical and Automatic Anomaly Detection Through Machine Learning. In Proceedings of the 2015 Internet Measurement Conference, Tokyo, Japan, 28–30 October 2015; Association for Computing Machinery: New York, NY, USA, 2015; pp. 211–224. [Google Scholar]
- Zhuo, D.; Ghobadi, M.; Mahajan, R.; Förster, K.-T.; Krishnamurthy, A.; Anderson, T. Understanding and Mitigating Packet Corruption in Data Center Networks. In Proceedings of the Conference of the ACM Special Interest Group on Data Communication, Los Angeles, CA, USA, 21–25 August 2017; Association for Computing Machinery: New York, NY, USA, 2017; pp. 362–375. [Google Scholar]
- Hu, J.; Zhou, Z.; Yang, X.; Malone, J.; Williams, J.W. {CableMon}: Improving the Reliability of Cable Broadband Networks via Proactive Network Maintenance. In Proceedings of the17th USENIX Symposium on Networked Systems Design and Implementation (NSDI 20), Santa Clara, CA, USA, 25–27 February 2020; USENIX Association: Santa Clara, CA, USA, 2020; pp. 619–632. [Google Scholar]
- Lad, M.; Massey, D.; Pei, D.; Wu, Y.; Zhang, B.; Zhang, L. PHAS: A Prefix Hijack Alert System. In Proceedings of the 15th Conference on USENIX Security Symposium—Volume 15, Vancouver, BC, Canada, 31 July 2006; USENIX Association: Santa Clara, CA, USA, 2006. [Google Scholar]
- Hu, X.; Mao, Z.M. Accurate Real-Time Identification of IP Prefix Hijacking. In Proceedings of the 2007 IEEE Symposium on Security and Privacy (SP ’07), Berkeley, CA, USA, 20–23 May 2007; pp. 3–17. [Google Scholar]
- Shi, X.; Xiang, Y.; Wang, Z.; Yin, X.; Wu, J. Detecting Prefix Hijackings in the Internet with Argus. In Proceedings of the 2012 Internet Measurement Conference, Boston, MA, USA, 14–16 November 2012; Association for Computing Machinery: New York, NY, USA, 2012; pp. 15–28. [Google Scholar]
- Schlamp, J.; Holz, R.; Jacquemart, Q.; Carle, G.; Biersack, E.W. HEAP: Reliable Assessment of BGP Hijacking Attacks. IEEE J. Sel. Areas Commun. 2016, 34, 1849–1861. [Google Scholar] [CrossRef]
- Sermpezis, P.; Kotronis, V.; Gigis, P.; Dimitropoulos, X.; Cicalese, D.; King, A.; Dainotti, A. ARTEMIS: Neutralizing BGP Hijacking Within a Minute. IEEE/ACM Trans. Netw. 2018, 26, 2471–2486. [Google Scholar] [CrossRef]
- Chen, E.; Bates, T.J.; Chandra, R. BGP Route Reflection: An Alternative to Full Mesh Internal BGP (IBGP); Internet Engineering Task Force. 2006. Available online: https://www.rfc-editor.org/rfc/rfc4456.html (accessed on 27 March 2024).
- Labovitz, C.; Malan, G.R.; Jahanian, F. Origins of Internet Routing Instability. In Proceedings of the IEEE INFOCOM ’99. Conference on Computer Communications. Proceedings. Eighteenth Annual Joint Conference of the IEEE Computer and Communications Societies. The Future is Now (Cat. No.99CH36320), New York, NY, USA, 21–25 March 1999; Volume 1, pp. 218–226. [Google Scholar]
- Park, J.H.; Jen, D.; Lad, M.; Amante, S.; McPherson, D.; Zhang, L. Investigating Occurrence of Duplicate Updates in BGP Announcements. In Proceedings of the Passive and Active Measurement, Zurich, Switzerland, 7–9 April 2010; Krishnamurthy, A., Plattner, B., Eds.; Springer: Berlin/Heidelberg, Germany, 2010; pp. 11–20. [Google Scholar]
- Traina, P. RFC1774: BGP-4 Protocol Analysis; RFC Editor: Cambridge, MA, USA, 1995; Available online: https://dl.acm.org/doi/abs/10.17487/RFC1774 (accessed on 27 March 2024).
- Meyer, D. BGP Communities for Data Collection; Internet Engineering Task Force. 2006. Available online: https://www.rfc-editor.org/rfc/rfc4384.html (accessed on 27 March 2024).
- Steenbergen, R.; Scholl, T. BGP Communities: A Guide for Service Provider Networks; NANOG. 2013. Available online: https://archive.nanog.org/meetings/nanog40/presentations/BGPcommunities.pdf (accessed on 27 March 2024).
- Albawi, S.; Mohammed, T.; Al-Zawi, S. Understanding of a Convolutional Neural Network. In Proceedings of the 2017 International Conference on Engineering and Technology (ICET), Antalya, Turkey, 21–23 August 2017; pp. 1–6. [Google Scholar] [CrossRef]
- Patil, A.; Rane, M. Convolutional Neural Networks: An Overview and Its Applications in Pattern Recognition. In Proceedings of the Information and Communication Technology for Intelligent Systems (ICTIS 2020), Ahmedabad, India, 15–16 May 2020; Senjyu, T., Mahalle, P.N., Perumal, T., Joshi, A., Eds.; Springer: Singapore, 2021; pp. 21–30. [Google Scholar]
- Hyndman, R.; Koehler, A.B.; Ord, J.K.; Snyder, R.D. Forecasting with Exponential Smoothing: The State Space Approach; Springer Science & Business Media: Berlin, Germany, 2008; ISBN 978-3-540-71918-2. [Google Scholar]
- Müller, U.A. Specially Weighted Moving Averages with Repeated Application of the Ema Operator; Olsen Research Institute Discussion Paper: Zurich, Switzerland, 1991. [Google Scholar]
- Ding, Q.; Li, Z.; Batta, P.; Trajković, L. Detecting BGP Anomalies Using Machine Learning Techniques. In Proceedings of the 2016 IEEE International Conference on Systems, Man, and Cybernetics (SMC), Budapest, Hungary, 9–12 October 2016; pp. 003352–003355. [Google Scholar]
- Al-Rousan, N.M.; Trajković, L. Machine Learning Models for Classification of BGP Anomalies. In Proceedings of the 2012 IEEE 13th International Conference on High Performance Switching and Routing, Belgrade, Serbia, 24–27 June 2012; pp. 103–108. [Google Scholar]
- Bing, H.; Hao, S.; Fangwei, Z.; Shuai, Z.; Tao, Q.; Changjiang, Y. Application Process of Machine Learning in Cyberspace Security. In Proceedings of the 2021 6th International Conference on Intelligent Computing and Signal Processing (ICSP), Xi’an, China, 9–11 April 2021; pp. 865–869. [Google Scholar]
- Zhao, P.; Luo, C.; Qiao, B.; Wang, L.; Rajmohan, S.; Lin, Q.; Zhang, D. T-SMOTE: Temporal-Oriented Synthetic Minority Oversampling Technique for Imbalanced Time Series Classification. In Proceedings of the Thirty-First International Joint Conference on Artificial Intelligence, Vienna, Austria, 23–29 July 2022; International Joint Conferences on Artificial Intelligence Organization: Vienna, Austria, 2022; pp. 2406–2412. [Google Scholar]
- Park, H.; Kim, K.; Shin, D.; Shin, D. BGP Dataset-Based Malicious User Activity Detection Using Machine Learning. Information 2023, 14, 501. [Google Scholar] [CrossRef]
- Deng, A.; Hooi, B. Graph Neural Network-Based Anomaly Detection in Multivariate Time Series. Proc. AAAI Conf. Artif. Intell. 2021, 35, 4027–4035. [Google Scholar] [CrossRef]
- Audibert, J.; Michiardi, P.; Guyard, F.; Marti, S.; Zuluaga, M.A. USAD: UnSupervised Anomaly Detection on Multivariate Time Series. In Proceedings of the 26th ACM SIGKDD International Conference on Knowledge Discovery & Data Mining, Virtual Event, CA, USA, 6–10 July 2020; Association for Computing Machinery: New York, NY, USA, 2020; pp. 3395–3404. [Google Scholar]
- Zhao, H.; Wang, Y.; Duan, J.; Huang, C.; Cao, D.; Tong, Y.; Xu, B.; Bai, J.; Tong, J.; Zhang, Q. Multivariate Time-Series Anomaly Detection via Graph Attention Network. In Proceedings of the 2020 IEEE International Conference on Data Mining (ICDM), Sorrento, Italy, 17–20 November 2020; pp. 841–850. [Google Scholar]
- Zhang, Y.; Chen, Y.; Wang, J.; Pan, Z. Unsupervised Deep Anomaly Detection for Multi-Sensor Time-Series Signals. IEEE Trans. Knowl. Data Eng. 2023, 35, 2118–2132. [Google Scholar] [CrossRef]
Disclaimer/Publisher’s Note: The statements, opinions and data contained in all publications are solely those of the individual author(s) and contributor(s) and not of MDPI and/or the editor(s). MDPI and/or the editor(s) disclaim responsibility for any injury to people or property resulting from any ideas, methods, instructions or products referred to in the content. |
© 2025 by the authors. Licensee MDPI, Basel, Switzerland. This article is an open access article distributed under the terms and conditions of the Creative Commons Attribution (CC BY) license (https://creativecommons.org/licenses/by/4.0/).