Article

Numerical Analysis on Impact of Membrane Thickness and Temperature on Characteristics of Biogas Dry Reforming Membrane Reactor Using Pd/Cu Membrane and Ni/Cr Catalyst

1
Division of Mechanical Engineering, Mie University, Tsu 514-8507, Japan
2
School of Electrical and Mechanical Engineering, the University of Adelaide, Adelaide, SA 5005, Australia
*
Author to whom correspondence should be addressed.
Fuels 2025, 6(2), 25; https://doi.org/10.3390/fuels6020025
Submission received: 2 January 2025 / Revised: 27 January 2025 / Accepted: 31 March 2025 / Published: 3 April 2025

Abstract

:
The purpose of this study is to reveal the characteristics of a Pd/Cu membrane and Ni/Cr catalyst adopted in a biogas dry reforming (BDR) membrane reactor by the numerical simulation procedure. The commercial software COMSOL Multiphysics ver. 6.2 was adopted in the numerical simulation. COMSOL is one type of commercial software that can solve multiphysics phenomena, i.e., chemical reaction, fluid dynamics, heat transfer, etc. The impact of the initial reaction temperature and the thickness of the Pd/Cu membrane on the performance of the BDR membrane reactor using an Ni/Cr catalyst is also investigated. The initial reaction temperatures adopted were 400 °C, 500 °C, and 600 °C, and the thicknesses of the Pd/Cu membrane were varied at 20 μm, 40 μm, and 60 μm. It was discovered that when the initial reaction temperature was raised, the molar concentration of H2 increased while the molar concentrations of CH4 and CO2 decreased. Because the penetration resistance of the Pd/Cu membrane decreased with the decrease in the thickness of the Pd/Cu membrane, the molar concentrations of H2 remaining in the Pd/Cu membrane and sweep chamber rose with the decrease in the thickness of the Pd/Cu membrane.

1. Introduction

Green H2 is one promising procedure to generate a clean energy source in order to solve the global warming issue. There are many technologies to produce green H2, e.g., H2O electrolysis and the biogas dry reforming (BDR) membrane reactor using various catalysts. The Pt1/(Co, Ni) (OH)2 single-atom catalyst with single Pt atoms exhibited very superior H2 evolution reaction activity to Pt1/Co(OH)2/C, Pt1/Ni(OH)2/C, Pt1/C, and the commercial 20 wt.% Pt/C during H2O dissociation [1]. In addition, Pd12Ru3/Ni(OH)2/C exhibited remarkably decreased H2 evolution reactions (16.1 mV @ 10 mA/cm2) as compared with the commercial 20 wt.% Pt/C (26.0 mV @ 10 mA/cm2) during alkaline H2O electrolysis [2]. Moreover, Pt/rGNP exhibited better catalytic behavior (10.6 mV @ 100 mA/cm2) for the H2 evolution reaction compared to the as-prepared M/rGNP catalyst, which was smaller compared to that of the commercial 20 wt.% Pt/C (66.5 mV) [3]. However, the present study pays attention to biogas dry reforming (BDR) as technology to produce green H2. Biogas is a type of fuel that consists of CH4 (55–75 vol.%) and CO2 (25–45 vol.%) [4], which can be used as feedback for the BDR reactor. Biogas can be produced from fermentation after the action of anaerobic microorganisms on raw materials such as garbage, livestock excretion, and sewage sludge. In total, 1.46 EJ of biogas was produced in the world in 2020, which was five times as large as the amount of gas produced in 2000 [5]. Consequently, it might be expected that the amount of produced biogas will increase more in the future.
Biogas can be provided as one type of fuel supplied for gas engines and micro gas turbines [6]. However, the power output is naturally lower compared with using natural gas as fuel since its heating value is lower due to including CO2. This study has suggested a combination system that consists of a BDR reactor combined with a solid oxide fuel cell (SOFC) to solve this problem [7]. CO, which is a by-product from BDR, could be used as fuel for the SOFC. The total energy conversion efficiency is therefore larger than some of the actual power generation systems, such as gas engines and micro gas turbines, since the SOFC can be a co-generation system.
There have been many reported studies on BDR recently [8,9,10,11,12,13,14,15]. The R&D of catalysts is one method to improve the performance of BDR. From a literature survey, this study can claim that Ni-based catalysts were examined for BDR [8,9,10,11,12,13,14,15]. Ni/Ce/Al was developed and performed a CH4 conversion of 65–79% and a CO2 conversion of 77–86% at 750 °C [8]. La/Ni/SBA-16 exhibited a CH4 conversion of 86% and the CO2 conversion of 92% at 700 °C [9]. The CH4 conversion and the CO2 conversion increased with the rise in the reaction temperature from 600 °C to 700 °C. Ni/CeO2/Al2O3 performed a CH4 conversion of approximately 100% and a CO2 conversion of approximately 100% at 800 °C [10]. Ni/γ-Al2O3 exhibited a CH4 conversion of 90% and a CO2 conversion of 50% at 800 °C [11]. Ni/CeZrO2 performed a CH4 conversion of approximately 40% as well as a CO2 conversion of approximately 55% at 800 °C [12]. The CH4 conversion and the CO2 conversion increased with the rise in the reaction temperature from 500 °C to 800 °C. Ni/Al2O3 exhibited a CH4 conversion of approximately 70% and a CO2 conversion of approximately 70% at 700 °C [13]. Ni/La/Ti performed a CH4 conversion of approximately 100% and a CO2 conversion of approximately 100% at 800 °C [14]. The CH4 conversion and the CO2 conversion increased from 600 °C to 800 °C, from approximately 78% to 100% and from approximately 55% to 100%, respectively. The thermogravimetric analysis for Ni/Cao/Al2O3 was investigated, which clarified the effect of heating rate on the H2 production rate considering some chemical reaction schemes [15]. In the case of increasing the heating rate from 5 K/min to 20 K/min, the maximum H2 production rate rose from 7 × 10⁻⁵ mol/s to 1 × 10⁻⁴ mol/s.
Though some Ni-based catalysts were examined, the Ni/Cr catalyst has not been examined sufficiently, excluding some previous studies [7,16].
Moreover, it can be said that it is important to operate at a lower temperature in order to enhance the thermal energy efficiency of BDR, because BDR is an endothermic reaction. It can be thought that a membrane reactor is an effective device to facilitate this purpose since the H2 production rate of BDR is improved by supplying the non-equilibrium state due to H2 separation from the reaction site of the catalyst [7]. Pd is known as a material of the H2 separation membrane [17]. The permeation of H2 from a high-partial-pressure region to a low-partial-pressure region occurs via the following steps: (a) the dissociative adsorption of H2 on the interface between the gas and metal; (b) sorption of the atomic H2 into the bulk metal; (c) diffusion of atomic H2 by means of the bulk metal membrane; (d) recombination of atomic H2 to form H2 molecules at the interface between the gas and metal permeate; (e) desorption of molecular H2 [17]. Since the cost of pure H2 is expensive, some Pd alloys are considered a materials of H2 separation membranes. Though several Pd alloy membranes, e.g., Pd/Ag and Pd/Au, are commercialized and used for research, the cost of Pd/Cu is relatively lower than the cost of Pd/Ag, Pd/Au, and pure Pd. We think that cost is an important factor for applying the proposed system to the industry in the near future. Therefore, this study selects Pd/Cu as the H2 separation membrane. It is reported that Pd/Cu was used for the H2 separation membrane in the previous study [18]. Commercial catalysts such as Al2O3, Cr2O3, CrO3, and CuO were used for a water gas shift reaction (WGS) in the previous study. The increase in the conversion rate increased with the steam/carbon ratio from 1 to 3 and became smooth from 4 to 5. The membrane reactor with a Pd/Cu membrane and Ni/Cu catalyst was experimentally investigated by the previous study carried out by the authors of this study [8]. Though a numerical study on BDR with an Ni/Cr catalyst in a rectangular reactor was carried out by the authors of this study [16], this study did not conduct a numerical study to clarify the characteristics of BDR in the membrane reactor with a Pd/Cu membrane and Ni/Cu catalyst.
Therefore, the aim of this study is to reveal the characteristics of BDR in a membrane reactor with a Pd/Cu membrane and Ni/Cr catalyst by numerical simulation. The present study conducts a numerical simulation using the commercial software COMSOL Multiphysics ver. 6.2. Because there are many previous studies conducted by COMSOL Multiphysics for the purpose of the numerical simulation of BDR [19,20,21,22], this study has adopted COMSOL Multiphysics for the numerical simulation in this study. The impact of the initial reaction temperature and the thickness of the Pd/Cu membrane on the performance of BDR in the membrane reactor using a Pd/Cu membrane and Ni/Cr catalyst is also investigated. The initial reaction temperature is varied at 400 °C, 500 °C, and 600 °C. The thickness of the Pd/Cu membrane is varied at 20 μm, 40 μm, and 60 μm. A 2D model that simulates the membrane reactor used in the authors’ previous studies [7] is adopted in order to shorten the calculation time, though the actual experimental reactor is 3D. The molar ratio of CH4:CO2 is set to 1.5:1, simulating a biogas in the present study. To investigate the initial reaction temperature and the thickness of the Pd/Cu membrane on the reaction characteristics of BDR, as well as the other reactions, the following chemical reactions can be considered [8,10,12]:
<Dry reforming reaction (DR)>
CH4 + CO2 → 2H2 + 2CO + 247 kJ/mol
<Steam reforming reaction (SR)>
CH4 + H2O → CO + 3H2 + 206 kJ/mol
<Reverse water gas shift reaction (RWGS)>
CO2 + H2 → CO + H2O + 41 kJ/mol
<Methanation reaction (MR)>
CO2 + 4H2 → CH4 + 2H2O − 165.0 kJ/mol
<Methane decomposition reaction (MDR)>
CH4 → C + 2H2 + 74 kJ/mol
<Boudouard reaction (BD)>
2CO → C + CO2 − 172 kJ/mol

2. Numerical Simulation Procedure of BDR Membrane Reactor Using Pd/Cu Membrane and Ni/Cr Catalyst

2.1. A Mathematical Formation

COMSOL Multiphysics ver. 6.2, which is a commercial multiphysics software, allows users to customize many partial differential formulas and combine them to realize direct coupled multiphysics field analysis very easily [23]. COMSOL Muitiphysics involves the following governing formulas.
The formulas for mass conservation in porous material can be described as follows:
u = κ μ p + ρ g D
ρ u = Q m
ρ κ μ p = Q m
where u is the velocity vector [m/s], κ is the permeability [m2], μ indicates the viscosity [Pa∙s], ρ indicates the density [kg/m3], g is the gravitational acceleration [m2/s], D is the height [m], and Qm is the mass source term [kg/(m3∙s)].
The formula for momentum conservation in porous material can be defined by the Brinkmann equation, as follows:
ρ ε p u u ε p = p + 1 ε p μ u + u T 2 3 μ u I κ 1 μ + Q m ε p 2 u + F
where εp indicates the porosity [-], I indicates the unit vector [-], and F is the force vector [kg/(m3∙s)].
The formula of mass transfer in porous material can be defined by the Maxell–Stefan equation, as follows:
ρ ω i u ρ ω i k = 1 n ε p 3 2 D i k ~ x k + x k ω k p p ε p 3 2 D i T T T = R i , t o t
where ωi and ωk are the mass ratios of chemicals i and k, respectively [-], D ˜ i k indicates Fick’s diffusion coefficient of effective multicomponents [m2/s], D i T indicates the thermal diffusion coefficient [kg/(m·s)], and R i , t o t indicates the reaction rate of chemical species [mol/(m3·s)].
The formulas of heat transfer in porous material can be defined as follows:
ρ f C p , f u T + q = Q + Q p + Q v d
q = k e f f T
where f indicates the physical quantity of the fluid [-], Cp indicates the constant-pressure specific heat [J/(kg·K)], q indicates the thermal flux vector [W/m2], Q indicates the thermal source [W/m3], Qp indicates the thermal source caused by pressure loss [W/m3], Qvd indicates the thermal source due to viscosity dissipation [W/m3], and keff indicates the effective thermal conductivity [W/(m·K)].
Since there are a lot of previous studies conducted by means of COMSOL Multiphysics for numerical simulation on BDR and they report the reaction characteristics and heat and mass transfer [21,22,23], this study has selected COMSOL Multiphysics for the numerical simulation.

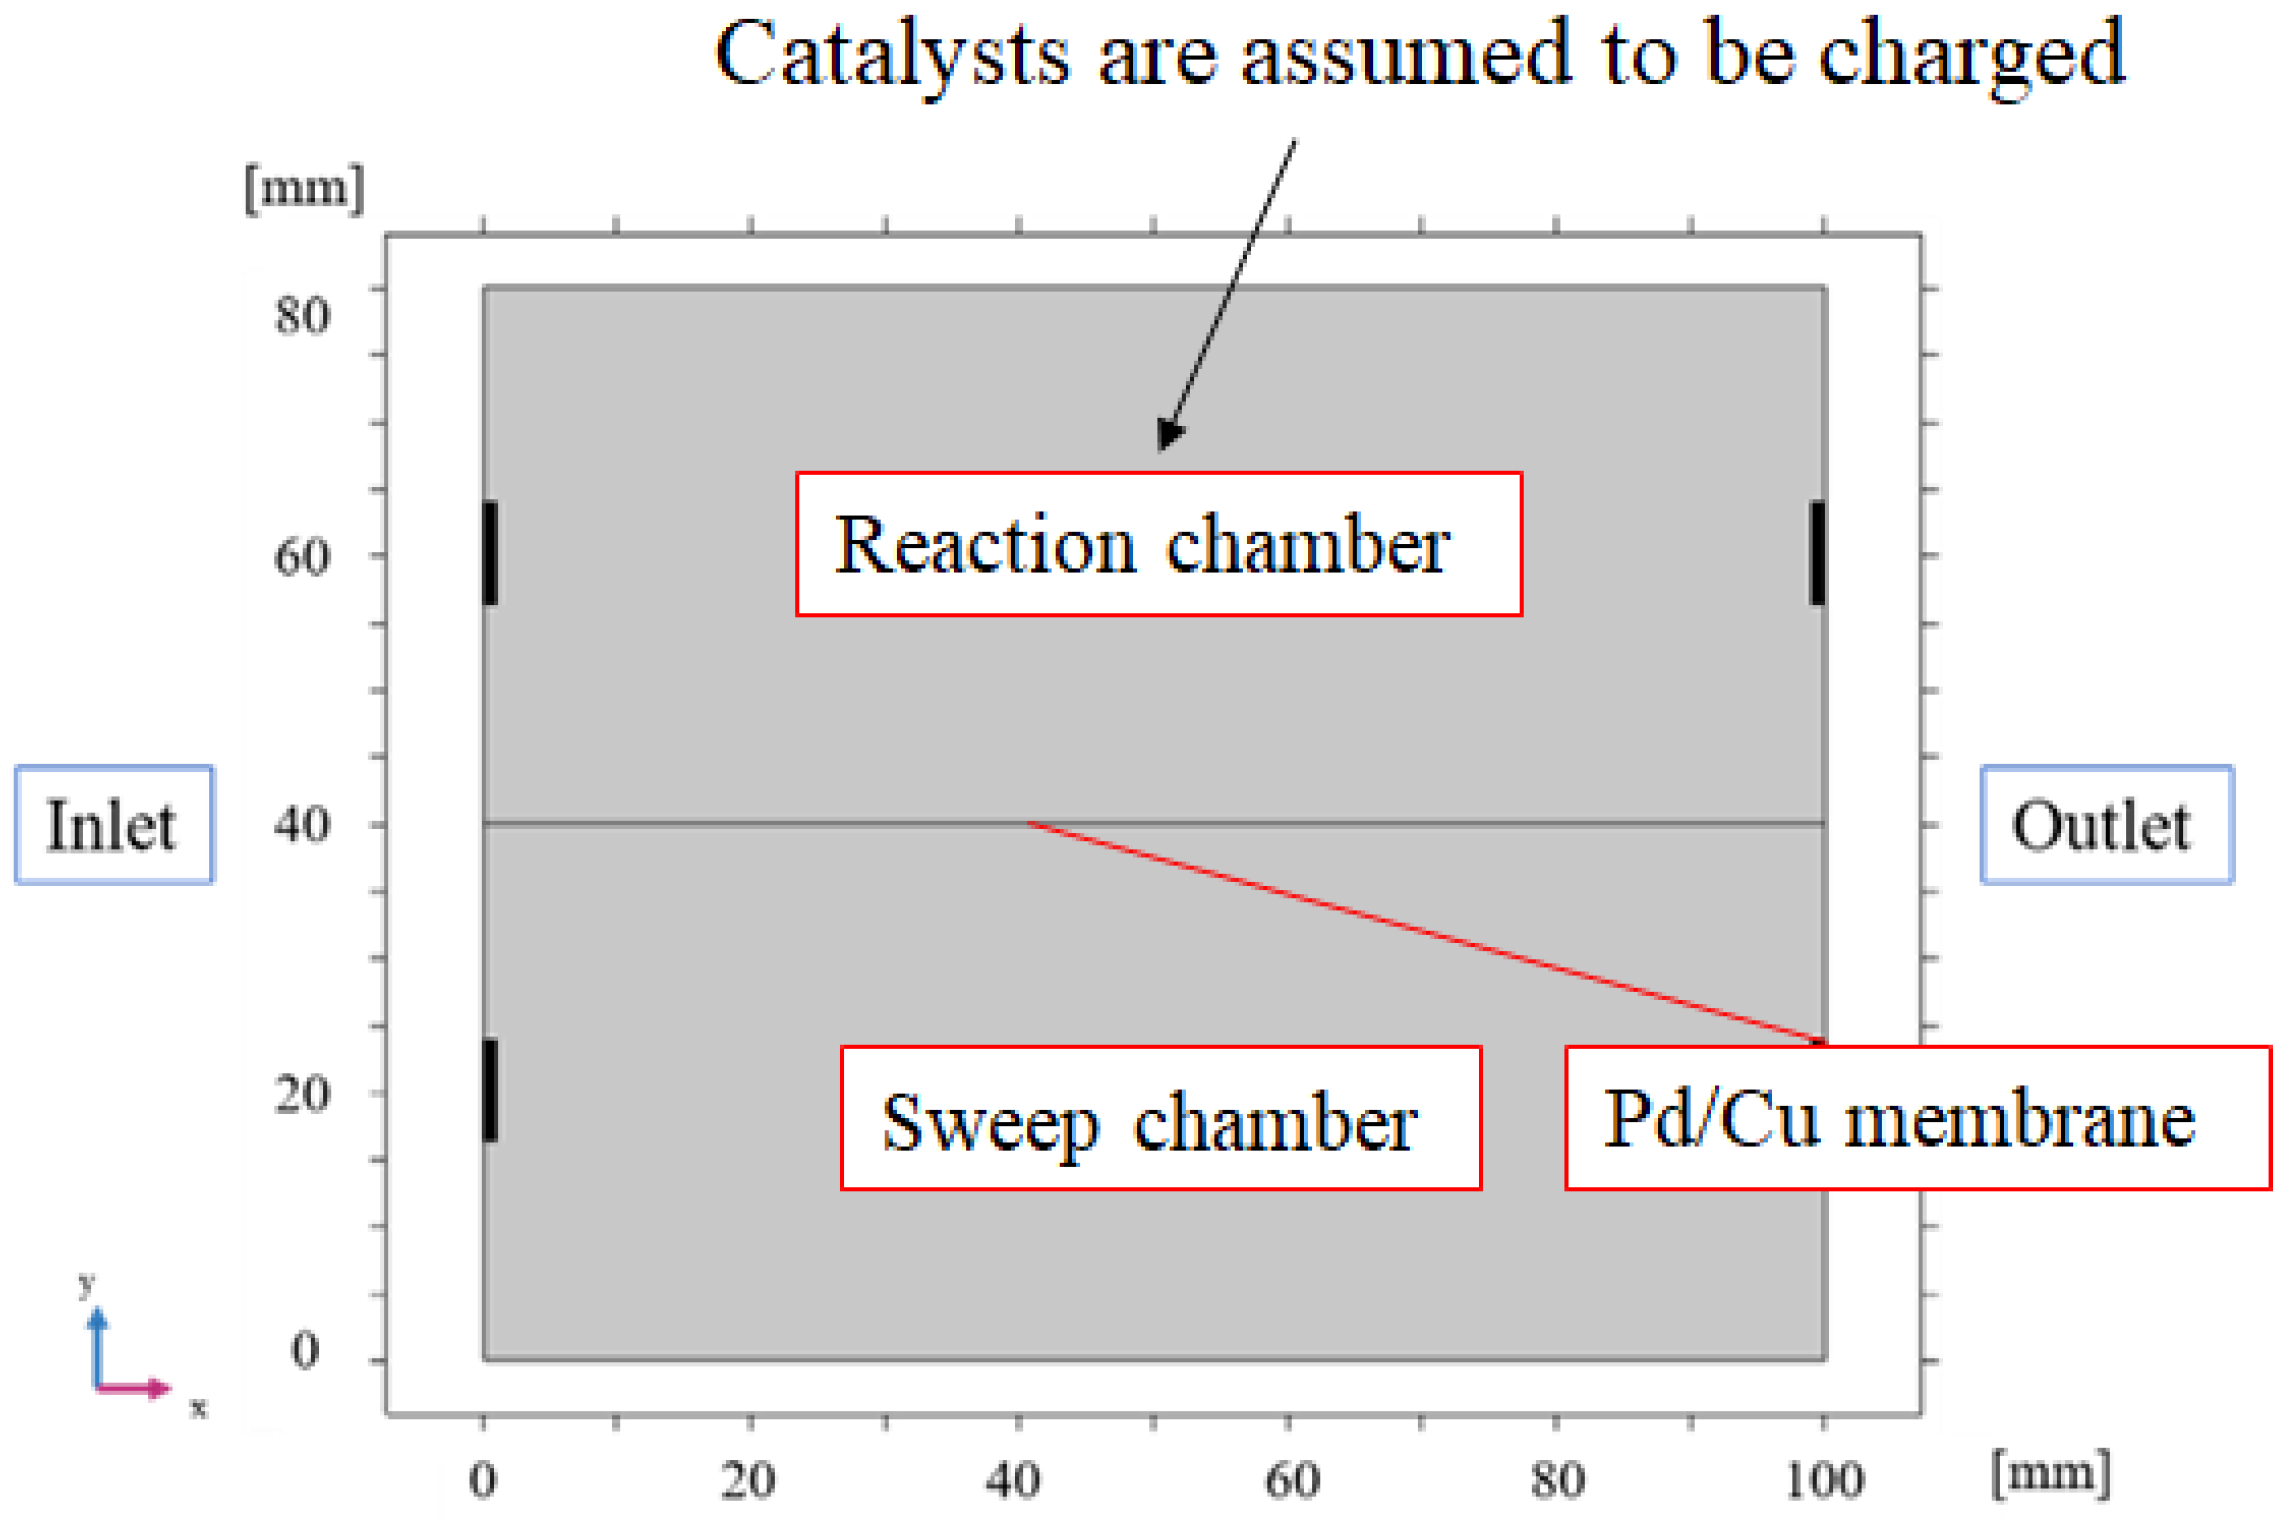
2.2. 2D Numerical Simulation Model of BDR Membrane Reactor

Figure 1 shows the schematic drawing of the 2D model. The dimensions of the reaction chamber and sweep chamber are 40 mm × 100 mm. The inlet and the outlet of the reaction chamber and sweep chamber are set in a 2D model. The length of the inlet and outlet of the reaction chamber and sweep chamber is 6 mm in Figure 1. Regarding the sweep gas flowing into the sweep chamber, Ar is adopted in this study. This study selected Ar as the sweep gas because it is an inactive gas. Ar is a popular gas to adopt as a sweep gas in the previous studies on biogas dry reforming membrane reactor [19,24,25,26]. Additionally, the previous experimental studies conducted by the authors [7,27] selected Ar as the sweep gas. The reason why Ar was selected as the sweep gas is because it is easy to detect air leaks when using Ar in experimental studies [7,27]. To fit the numerical simulation condition with that in the experimental studies conducted by the authors [7,27], we have set Ar as the sweep gas. The Pd/Cu membrane used for H2 separation is located between the reaction chamber and the sweep chamber. The thicknesses of the Pd/Cu membrane were varied at 20 μm, 40 μm, and 60 μm, which was the same as the authors’ previous experimental works [28,29]. This study carried out a stationary numerical simulation.

2.3. Kinetic Model of BDR

We considered the reaction scheme exhibited by Equations (1)–(6) to conduct the numerical simulation. Reaction rates of these formulas can be defined as follows [30,31,32]:
<Dry reforming reaction (DR)>
r 1 = k 1 K C O 2 , 1 K C H 4 , 1 P C O 2 P C H 4 1 + K C O 2 , 1 P C O 2 + K C H 4 , 1 P C H 4 2 1 P C O P H 2 2 K 1 P C O 2 P C H 4
where k 1 = 1290 × 5000 e 102065 R T , K C O 2 , 1 = 2.64 × 10 2 e 37641 R T , K C H 4 , 1 = 2.63 × 10 2 e 40684 R T , K 1 = e 34.011 e 258598 R T .
<Reverse water gas shift reaction (RWGS)>
r 2 = k 2 P C O 2 1 P C O P H 2 O K 2 P C O 2 P H 2
where k 2 = 9.28 × 10 3 e 73105 R T , K 2 = 68.78 e 37500 R T .
<Steam reforming reaction (SR)>
r 3 = k 3 P H 2 2.5 P C H 4 P H 2 O P C O P H 2 3 K 3 1 + P H 2 O K H 2 O , 2 P H 2 + K C O , 2 P C O + K H 2 , 2 P H 2 + K C H 4 , 2 P C H 4 2
where k 2 = 2.636 × 10 12 e 240100 R T , K 2 = 1.198 × 10 17 e 26830 R T , K C O 2 , 2 = 8.23 × 10 5 e 70650 R T , K C H 4 , 2 = 6.65 × 10 4 e 38280 R T , K H 2 , 2 = 6.12 × 10 9 e 82900 R T , K H 2 O , 2 = 1.77 × 10 5 e 88680 R T .
<Methanation reaction (MR)>
r 4 = k 4 P H 2 3.5 P C H 4 P H 2 O 2 P C O 2 P H 2 4 K 4 1 + P H 2 O K H 2 O , 4 P H 2 + K C O , 4 P C O + K H 2 , 4 P H 2 + K C H 4 , 4 P C H 4 2
where k 4 = 6.364 × 10 11 e 24390 R T , K 4 = 2.117 × 10 15 e 22430 R T , K C H 4 , 4 = 6.65 × 10 4 e 38280 R T , K C O , 4 = 8.23 × 10 5 e 70650 R T , K H 2 , 4 = 6.12 × 10 9 e 82900 R T , K H 2 O , 4 = 1.77 × 10 5 e 88680 R T .
<Methane decomposition reaction (MDR)>
r 5 = k 5 K C H 4 , 5 P C H 4 P H 2 2 K 5 1 + K C H 4 , 5 P C H 4 + P H 2 1.5 K H 2 , 5 2
where k 5 = 6.95 × 10 3 e 58983 R T , K 5 = 2.95 × 10 5 e 84440 R T , K C H 4 , 5 = 0.21 e 567 R T , K H 2 , 5 = 5.18 × 10 7 e 133210 R T .
<Boudouard reaction (BD)>
r 6 = k 6 K C O , 6 K C O 2 , 6 P C O K 6 P C O 2 P C O 1 + K C O , 6 P C O + 1 K C O , 6 K C O 2 , 6 P C O 2 P C O 2
where k 6 = 1.34 × 10 15 e 243835 R T , K 6 = 1.9393 × 10 9 e 168527 R T , K C O 2 , 6 = 2.81 × 10 7 e 104085 R T , K C O , 6 = 7.34 × 10 6 e 100395 R T . Additionally, r n indicates the kinetic rate (where n = 1, 2, 3, 4, 5, 6) [mol/(kg·s)], k n indicates the kinetic constant (where n = 1, 2, 3, 4, 5, 6) [mol/(kg·s)], P i indicates the particle pressure of chemical species i [Pa], K n indicates the equilibrium constant (where n = 1, 2, 3, 4, 5, 6) [-], and K i indicates the absorption equilibrium constants of chemical species i [-].

2.4. Parameters and Conditions of Numerical Simulation

The molar ratio of CH4:CO2 was set at 1.5:1 in this study, simulating a biogas. The initial reaction temperatures were varied at 400 °C, 500 °C, and 600 °C. This study assumed that Ni/Cr alloy metal was the catalyst adopted for the previous experimental works [7,27]. The weight ratio of Cr to the whole weight of Ni/Cr alloy metal was 20 wt.%. This study calculated the porosity, permeability, constant-pressure specific heat, and thermal conductivity of Ni/Cr alloy catalysts according to the weight ratio of Cr. The porosity (εp) was set at 0.95. The thicknesses of the Pd/Cu membrane were varied at 20 μm, 40 μm, and 60 μm. Table 1 shows the physical properties and parameters adopted for the numerical simulation in the present study.
The following assumptions were set in this study:
(i)
The catalyst was assumed to be a porous material. The porosity, permeability, constant-pressure specific heat, thermal conductivity, and isotropy were set to be constant.
(ii)
The wall temperature was set to be isothermal.
(iii)
The gas was set to be a Newton fluid and treated to be an ideal gas.
(iv)
The wall of the reactor, except for the inlet and outlet, was set to be no-slip.
(v)
The pressure of the outlet was set to be atmospheric pressure (gauge pressure: 0 Pa).
(vi)
The temperature of the inflow gas was the same as the initial reaction temperature.
(vii)
The produced carbon was assumed to be a gas.
As for (vii), solid carbon is generated according to Equations (5) and (6) generally. However, COMSOL Multiphysics utilized by the present study cannot treat a solid carbon and a gaseous carbon. Consequently, we considered assumption (vii).

2.5. Evaluation Factor for Reaction Characteristics in the Present Study

The evaluation factors defined in this study are as follows:
CH 4   conversion = C C H 4 , i n C C H 4 , o u t C C H 4 , i n × 100   [ % ]
where C C H 4 , i n indicates the molar concentration of CH4 at the inlet [mol] and C C H 4 , o u t indicates the molar concentration of CH4 at the outlet [mol].
CO 2   conversion = C C O 2 , i n C C O 2 , o u t C C O 2 , i n × 100   [ % ]
where C C O 2 , i n indicates the molar concentration of CO2 at the inlet [mol] and C C O 2 , o u t indicates the molar concentration of CO2 at the outlet [mol].
H 2   yield = 1 2 C H 2 , o u t C C H 4 , i n × 100   [ % ]
where C H 2 , o u t indicates the molar concentration of H2 at the outlet [mol].
H 2   selectivity = C H 2 , o u t C H 2 , o u t + C C O , o u t × 100   [ % ]
where C C O , o u t indicates the molar concentration of CO at the outlet [mol].
CO   selectivity = C C O , o u t C H 2 , o u t + C C O , o u t × 100   [ % ]

3. Results and Discussion

3.1. Comparison of the Distriburtion of Pressure Along X-Direction Among Different Initial Reaction Temperatures and Thicknesses of Pd/Cu Membranes

Figure 2 shows the comparison of the distribution of pressure along the x-direction in the reaction chamber (y = 62 mm), Pd/Cu membrane (y = 40 mm), and sweep chamber (y = 20 mm) with the change in the initial reaction temperature. In this figure, the thickness of the Pd/Cu membrane is 20 μm.
It is seen from Figure 2 that the pressure in the reaction chamber as well as the Pd/Cu membrane decreases along the x-direction. This is due to the permeation resistance of the porous catalyst and Pd/Cu membrane. Additionally, we can know that the pressure in the reaction chamber and Pd/Cu membrane rises with the rise in the initial reaction temperature. It is thought from the state equation, i.e., pV = nRT, that pressure rises with the increase in the temperature. Moreover, the difference in the initial pressure (at x = 0 mm) among the different initial temperatures is provided by the rise in pressure because of the volume change caused by the change in the initial reaction temperature. It can be thought from the state equation, i.e., pV = nRT, that the pressure increases with the rise in temperature. Moreover, the pressures near the inlet and the outlet changes rapidly, especially for those in the sweep chamber. Since the length of the inlet and outlet of the reaction chamber and sweep chamber is 6 mm, which is shorter than the height of the reaction chamber and sweep chamber of 40 mm, the large pressure change occurs due to the change in cross-sectional area for the gas flow.
Figure 3 shows the comparison of the distribution of pressure along the x-direction in the reaction chamber (y = 62 mm), Pd/Cu membrane (y = 40 mm), and sweep chamber (y = 20 mm) with varying thickness of the Pd/Cu membrane. In Figure 3, the results obtained at the initial reaction temperature of 600 °C are shown. It is seen from Figure 3 that the pressure in the reaction chamber and Pd/Cu membrane decreases along the x-direction. This is due to the permeation resistance of the porous catalyst and Pd/Cu membrane. According to Figure 3, the pressure in the Pd/Cu membrane is higher with the decrease in the thickness of the Pd/Cu membrane, though the influence of the thickness of the Pd/Cu membrane on the pressure in the reaction chamber and sweep chamber is very small. Since the permeation resistance decreases with the decrease in the thickness of the Pd/Cu membrane, the pressure in the Pd/Cu membrane is higher. In Figure 3, the initial reaction temperature was set at 600 °C, which was the same temperature as in the reaction chamber and sweep chamber. Since the initial temperature was the same in the different experiment with various thicknesses of Pd/Cu membranes, we could consider that the change in pressure in the reaction chamber and sweep chamber was small. Regarding the pressure drop across the Pd/Cu membrane, it reduced with the decrease in the thickness of the Pd/Cu membrane because of the reduction in the permeation resistance of the Pd/Cu membrane.

3.2. Comparison of Gas Concentrations Along X-Direction Among Different Initial Reaction Temperatures and Thicknesses of Pd/Cu Membranes

Figure 4 displays the comparison of the distribution of gas concentrations along the-direction in the reaction chamber (y = 62 mm) among different initial reaction temperatures. The thickness of the Pd/Cu membrane is 20 μm in this figure. From Figure 4, it is clear that the molar concentrations of CH4 and CO2 decrease with the increase in the initial reaction temperature, while the molar concentrations of H2, CO, H2O, and C rise with the rise in the initial reaction temperature. From the present study, the reaction rates of the considered reactions can be shown by the Arrhenius type as displayed in Equations (14)–(19). Consequently, the amounts of products, i.e., H2, CO, H2O, and C, increased with the rise in the initial reaction temperature. Moreover, Equation (1) is an endothermic reaction, meaning it can be thought that the molar concentrations of CH4 and CO2 decrease and those of H2 and CO rise with the rise in the initial reaction temperature. Regarding the formation of H2O and C, it is thought that Equations (3)–(6) might occur. The formation of H2O and C were observed by the authors’ previous experimental study [28]. After the experiments, carbon was observed as shown in Figure 5 [27]. On the other hand, the formation of H2O was confirmed by means of observation using the gas bag exhibited in Figure 6. From the review paper of the authors’ literature survey, there are a lot of previous studies reporting CH4 dry reforming with a reverse H2O gas shift [29]. These review papers reported high CH4 and CO2 conversions and H2 yield, e.g., CH4 conversion of 43.0–98.6%, CO2 conversion of 4.0–98.5%, and H2 yield of 2.62–94.9%, respectively [29]. Consequently, we think that the presence of H2O is not a bad indicator for such a relatively atmospheric-based reaction.
Figure 7 shows the influence of the initial reaction temperature on the distributions of the molar concentration of H2 along the x-direction in the reaction chamber (y = 62 mm), Pd/Cu membrane (y = 40 mm), and sweep chamber (y = 20 mm). It is seen from Figure 7 that the molar concentration of H2 rises along the x-direction in the reaction chamber, Pd/Cu membrane, and sweep chamber. Since the H2 production reactions, i.e., Equations (1), (2) and (5), occur along the x-direction, the molar concentration of H2 rises along the x-direction. Moreover, it is observed that the molar concentration of H2 in the reaction chamber, Pd/Cu membrane, and sweep chamber rises with the rise in the initial reaction temperature. Because the H2 production reactions, i.e., Equations (1), (2) and (5), are endothermic reactions, the molar concentration of H2 increases with the rise in the initial reaction temperature. Additionally, it is known from Figure 7 that the molar concentrations of H2 in the Pd/Cu membrane and sweep chamber are higher when the molar concentration of H2 in the reaction chamber is higher. The molar concentration of H2 in the reaction chamber is higher, resulting in the driving force to permeate the Pd/Cu membrane becoming stronger because of the high H2 partial pressure difference between the reaction chamber and the sweep chamber [28]. The molar concentrations of H2 in the Pd/Cu membrane and sweep chamber are higher.
Figure 8 shows the comparison of the distributions of each gas concentration along the x-direction in the reaction chamber (y = 62 mm) among different thicknesses of Pd/Cu membranes. It is seen from Figure 8 that the influence of the thickness of the Pd/Cu membrane on gas concentrations along the-direction in the reaction chamber is small. However, it can be revealed that the molar concentrations of H2 in the Pd/Cu membrane and sweep chamber rise with the decrease in the thickness of the Pd/Cu membrane according to Figure 9. The penetration resistance of the Pd/Cu membrane decreases with the decrease in the thickness of the Pd/Cu membrane, resulting in the molar concentrations of H2 in the Pd/Cu membrane and sweep increasing with the decrease in the thickness of the Pd/Cu membrane.

3.3. Investigation on Reaction Characteristics by Evaluation Factors

To investigate the reaction characteristics of BDR with the other reactions considered in this study, Table 2 lists CH4 conversion, CO2 conversion, H2 yield, H2 selectivity, and CO selectivity for various initial temperatures using the thickness of the Pd/Cu membrane of 20 μm and various thicknesses of Pd/Cu membranes at the initial temperature of 600 °C.
According to Table 2, it can be clear that CH4 conversion, CO2 conversion, and H2 yield increase with the increase in the initial reaction temperature. Because Equations (1)–(3) and (5) are endothermic reactions, the consumption of CH4, CO2, and the production of H2 increase more with the increase in the initial reaction temperature. Additionally, it is clear from Table 2 that CH4 conversion, CO2 conversion, and H2 yield rise with the decrease in the thickness of the Pd/Cu membrane. The penetration resistance of the Pd/Cu membrane decreases with the decrease in the thickness of the Pd/Cu membrane, resulting in the permeation of H2 through the Pd/Cu membrane being promoted. Then, it is thought that Equations (1), (2) and (5), which are reactions producing H2, are in a non-equilibrium state. Therefore, the consumption of CH4 and CO2 and the production of H2 rise more with the decrease in the thickness of the Pd/Cu membrane. According to Equation (5), C is produced more if the reaction is in a non-equilibrium state by separating H2 from the reaction chamber via the Pd/Cu membrane. This phenomenon is confirmed by Figure 4.
According to the literature review, there was no H2 embrittment in the Pd/Cu membrane observed [32,33]. The Pd/Cu membrane exhibited a constant H2/N2 selectivity in the excess of 7000 over 70 days [33]. In addition, the change in the performance and shape of the Pd/Cu membrane was not observed after the experiments over 250 h [25]. Therefore, H2 embrittment of the Pd/Cu membrane was not thought to be the reason why less H2 was produced using the Pd/Cu membrane in the present study.
As explained in introduction, the previous studies reported that CH4 conversion and CO2 conversion are approximately 40–100% and 50–100%, respectively [8,9,10,11,12,13,14,15]. These values of CH4 conversion and CO2 conversion are higher than those obtained in this study. This study thinks that the initial reaction temperature of 600 °C is not sufficient to achieve a better performance of BDR, which is compared to previous studies [8,9,10,11,12,13,14,15]. From the previous reports with Ni alloy catalysts, CH4 conversion, H2 yield, and H2 selectivity rose with the rise in the initial reaction temperature, and larger values were observed over 600 °C [9,23,31,34]. This study proposes that the following subjects can be considered to enhance the performance of H2 production: (i) optimizing the catalyst shape and composition, (ii) optimizing the thickness and composition of the Pd/Cu membrane, and (iii) optimizing the H2 separation rate of the Pd/Cu membrane and the H2 production rate of the catalyst. This study would like to investigate these subjects.

4. Conclusions

We have clarified the performance of a BDR membrane reactor using a Pd/Cu membrane and an Ni/Cr catalyst by means of the COMSOL Multiphysics numerical simulation. The initial reaction temperatures studied were varied at 400 °C, 500 °C, and 600 °C. The thicknesses of the Pd/Cu membrane in the study were varied at 20 μm, 40 μm, and 60 μm. As a result, the following findings were obtained:
(i)
The pressure in the reaction chamber and Pd/Cu membrane decreased along the x-direction and they rose with the increase in the initial reaction temperature.
(ii)
The pressure in the Pd/Cu membrane rose with the decrease in the thickness of the Pd/Cu membrane, though the influence was very small.
(iii)
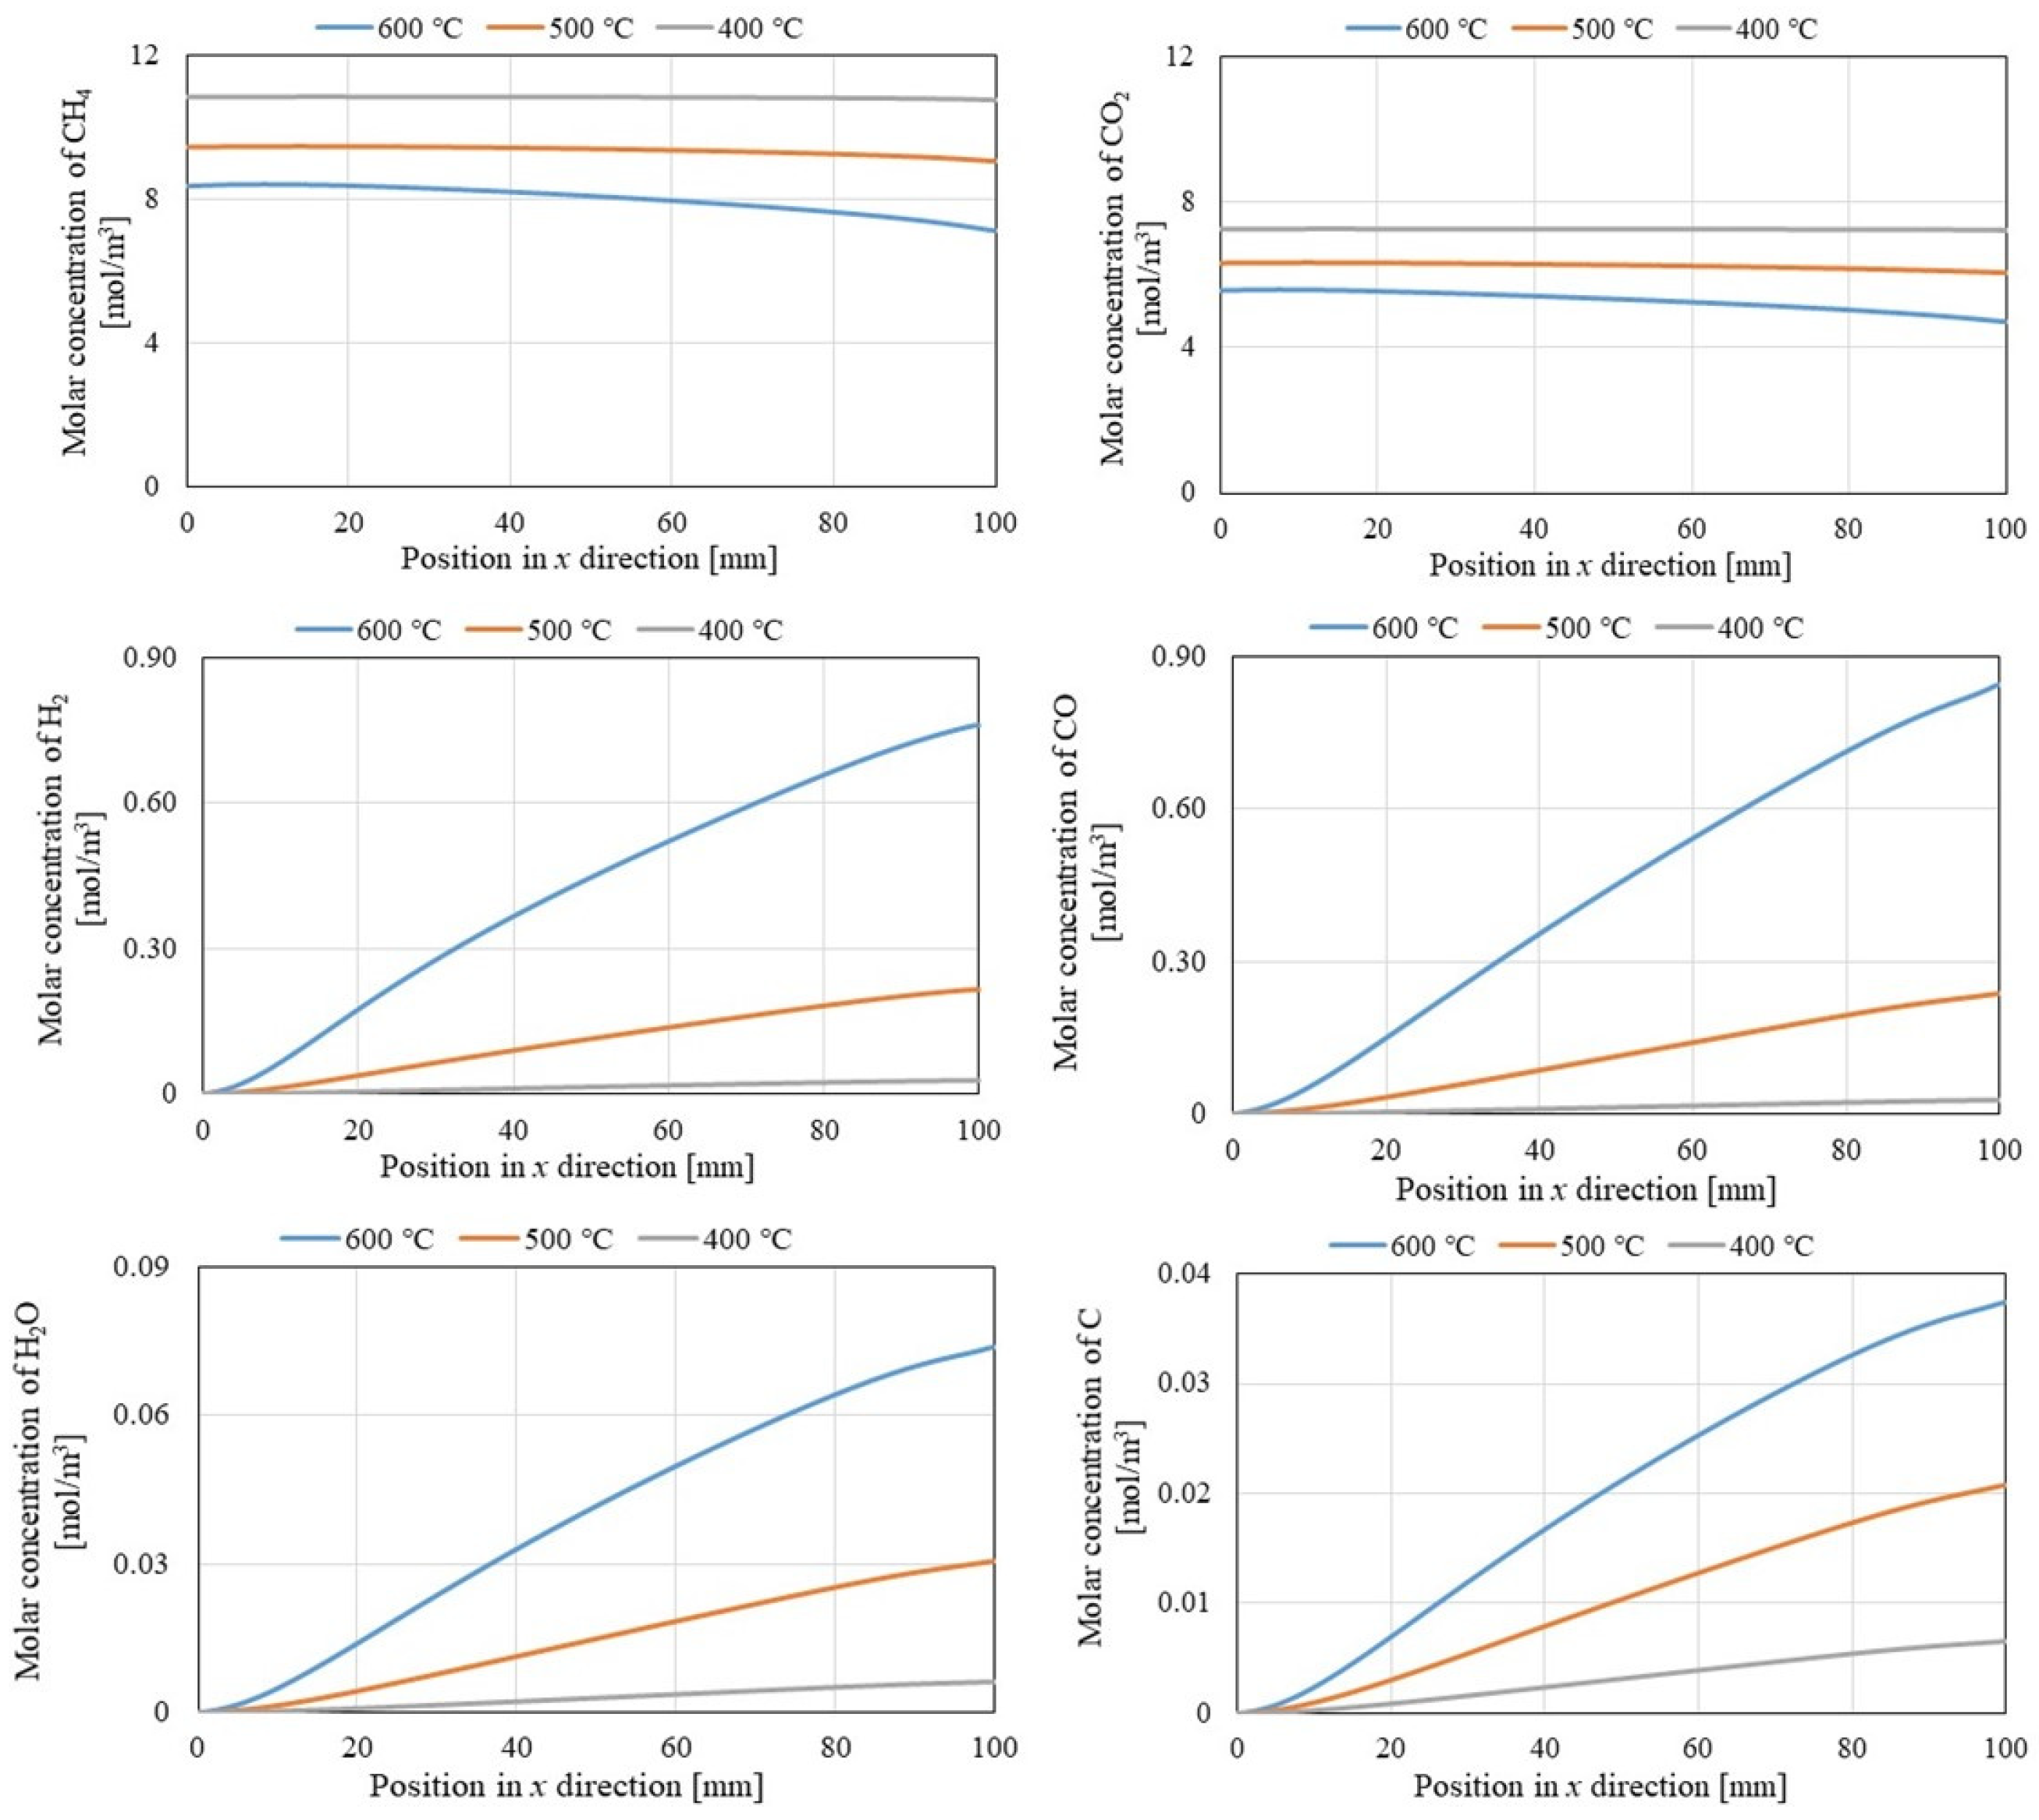
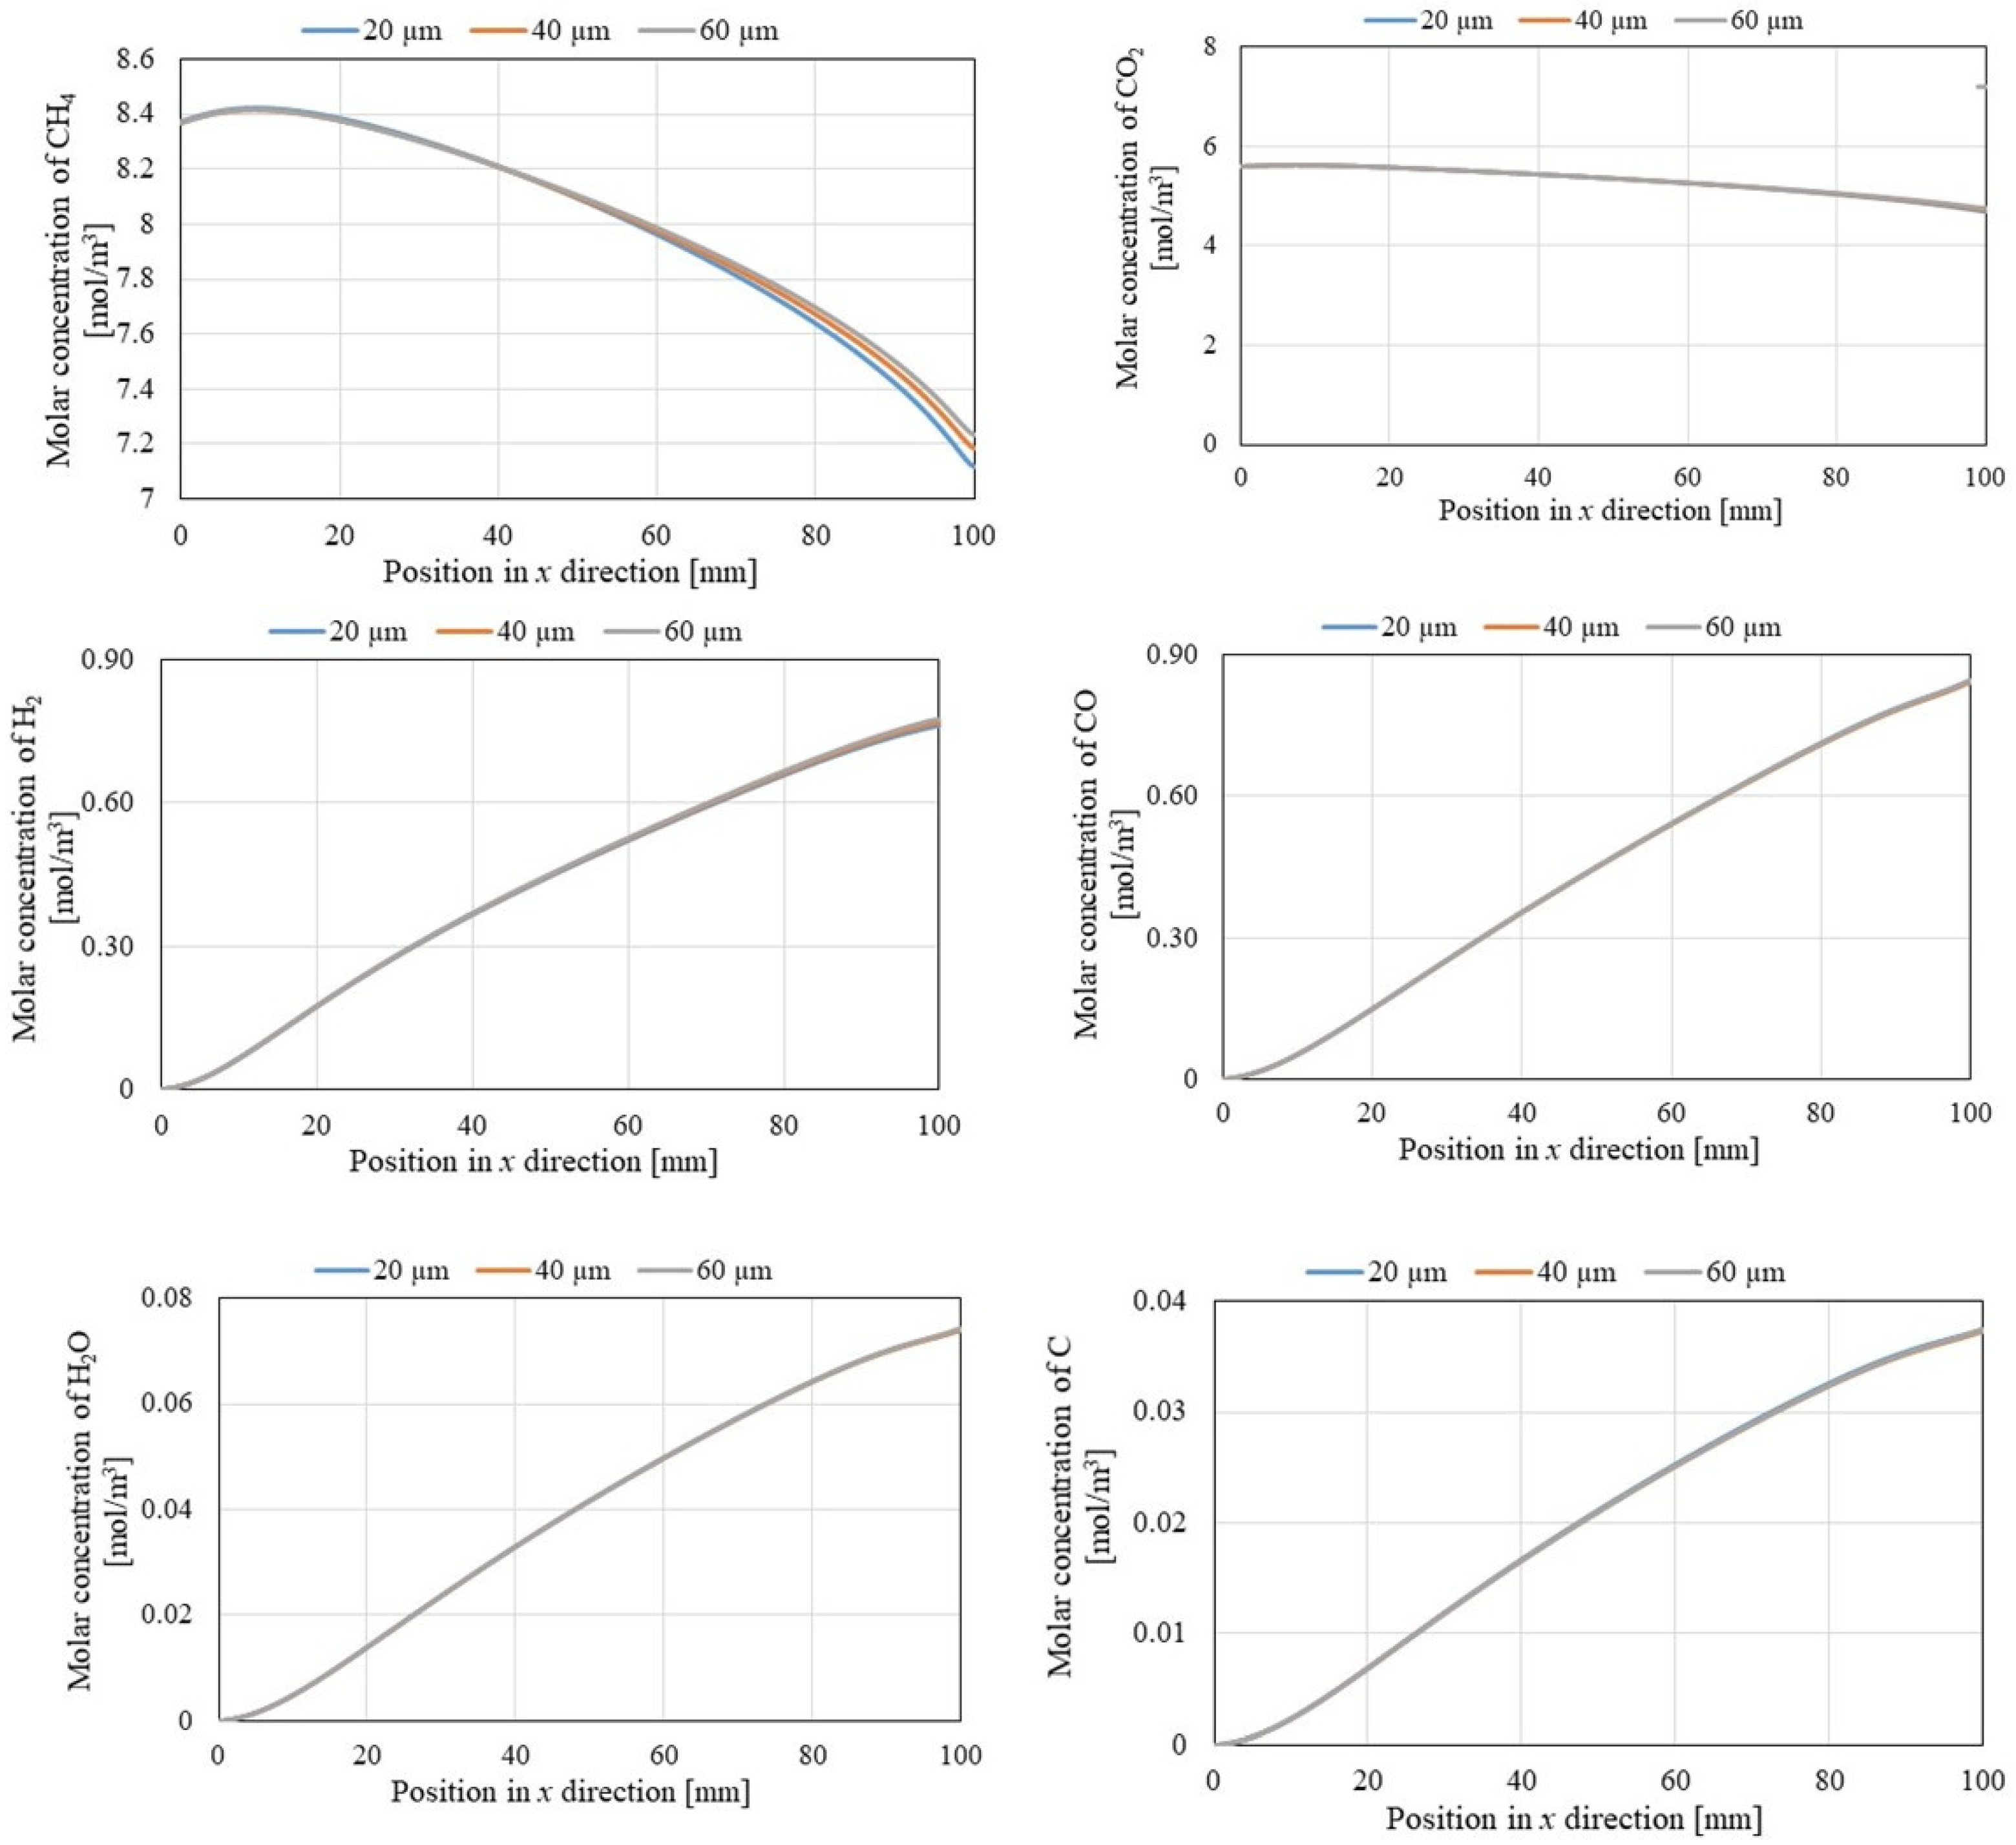
It can be revealed that the molar concentrations of CH4 and CO2 decreased with the rise in the initial reaction temperature, while the molar concentrations of H2, CO, H2O, and C increased with the increase in the initial reaction temperature. Moreover, the formed H2O and C demonstrate that Equations (3)–(6) occurred.
(iv)
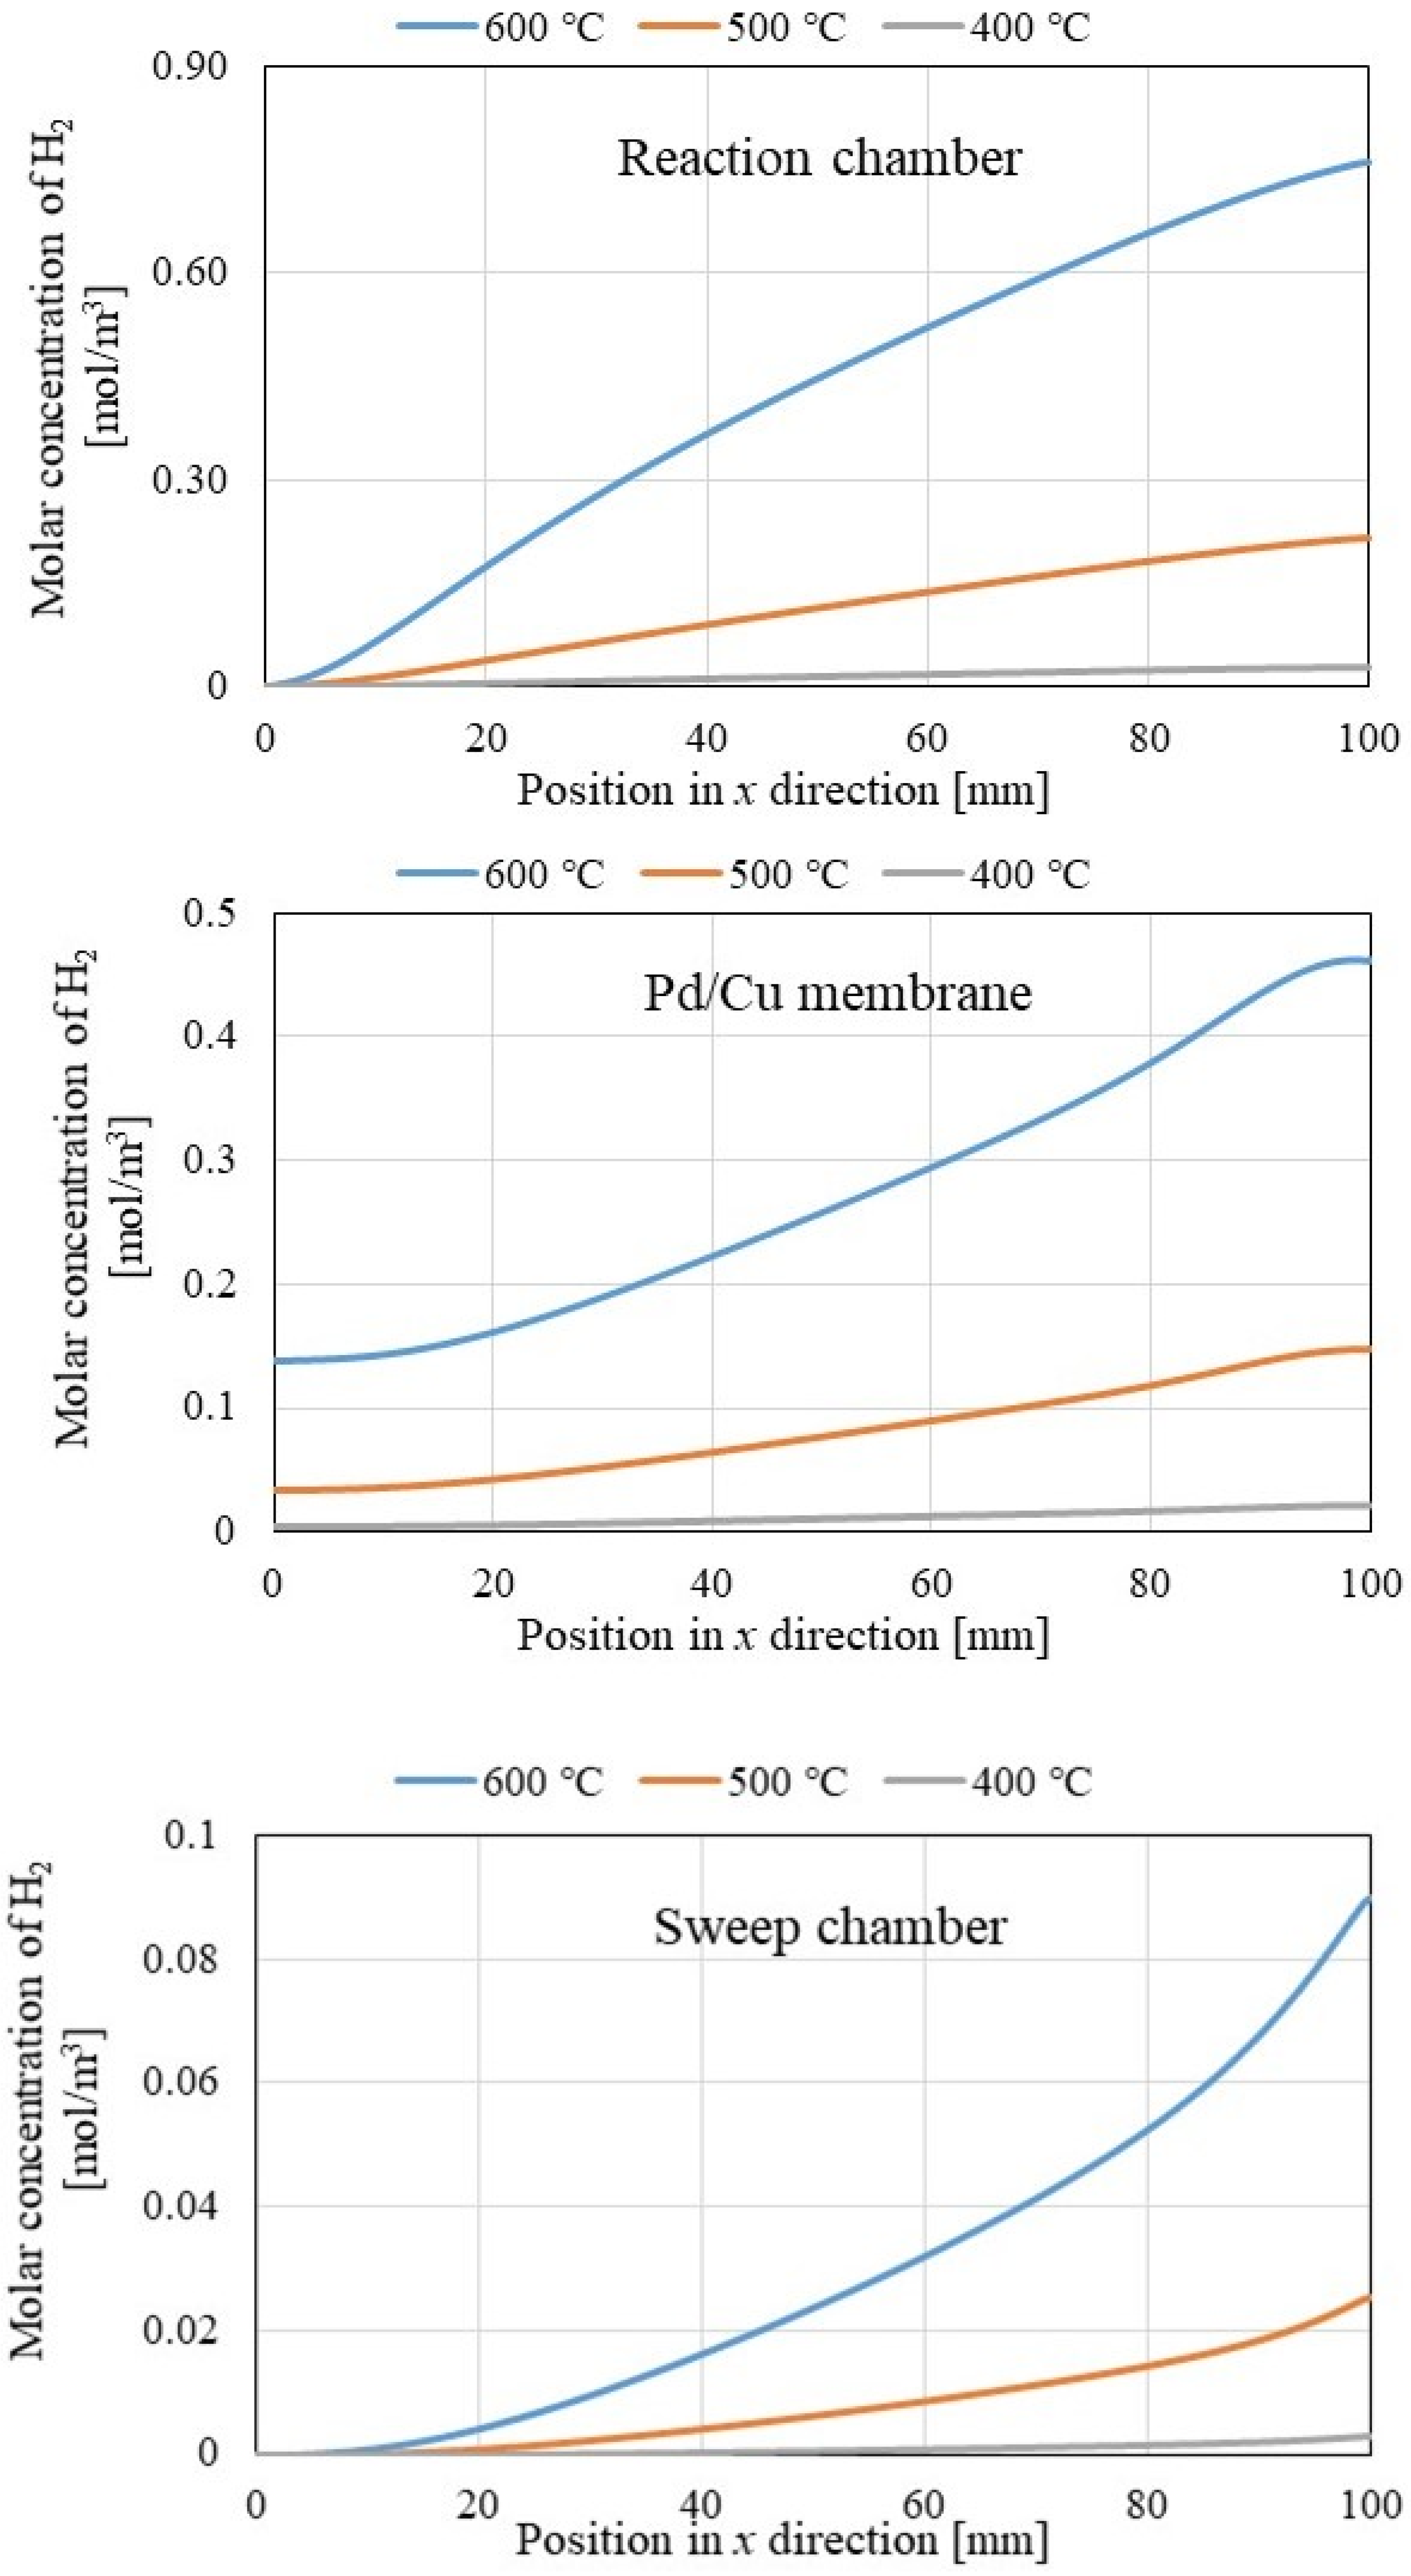
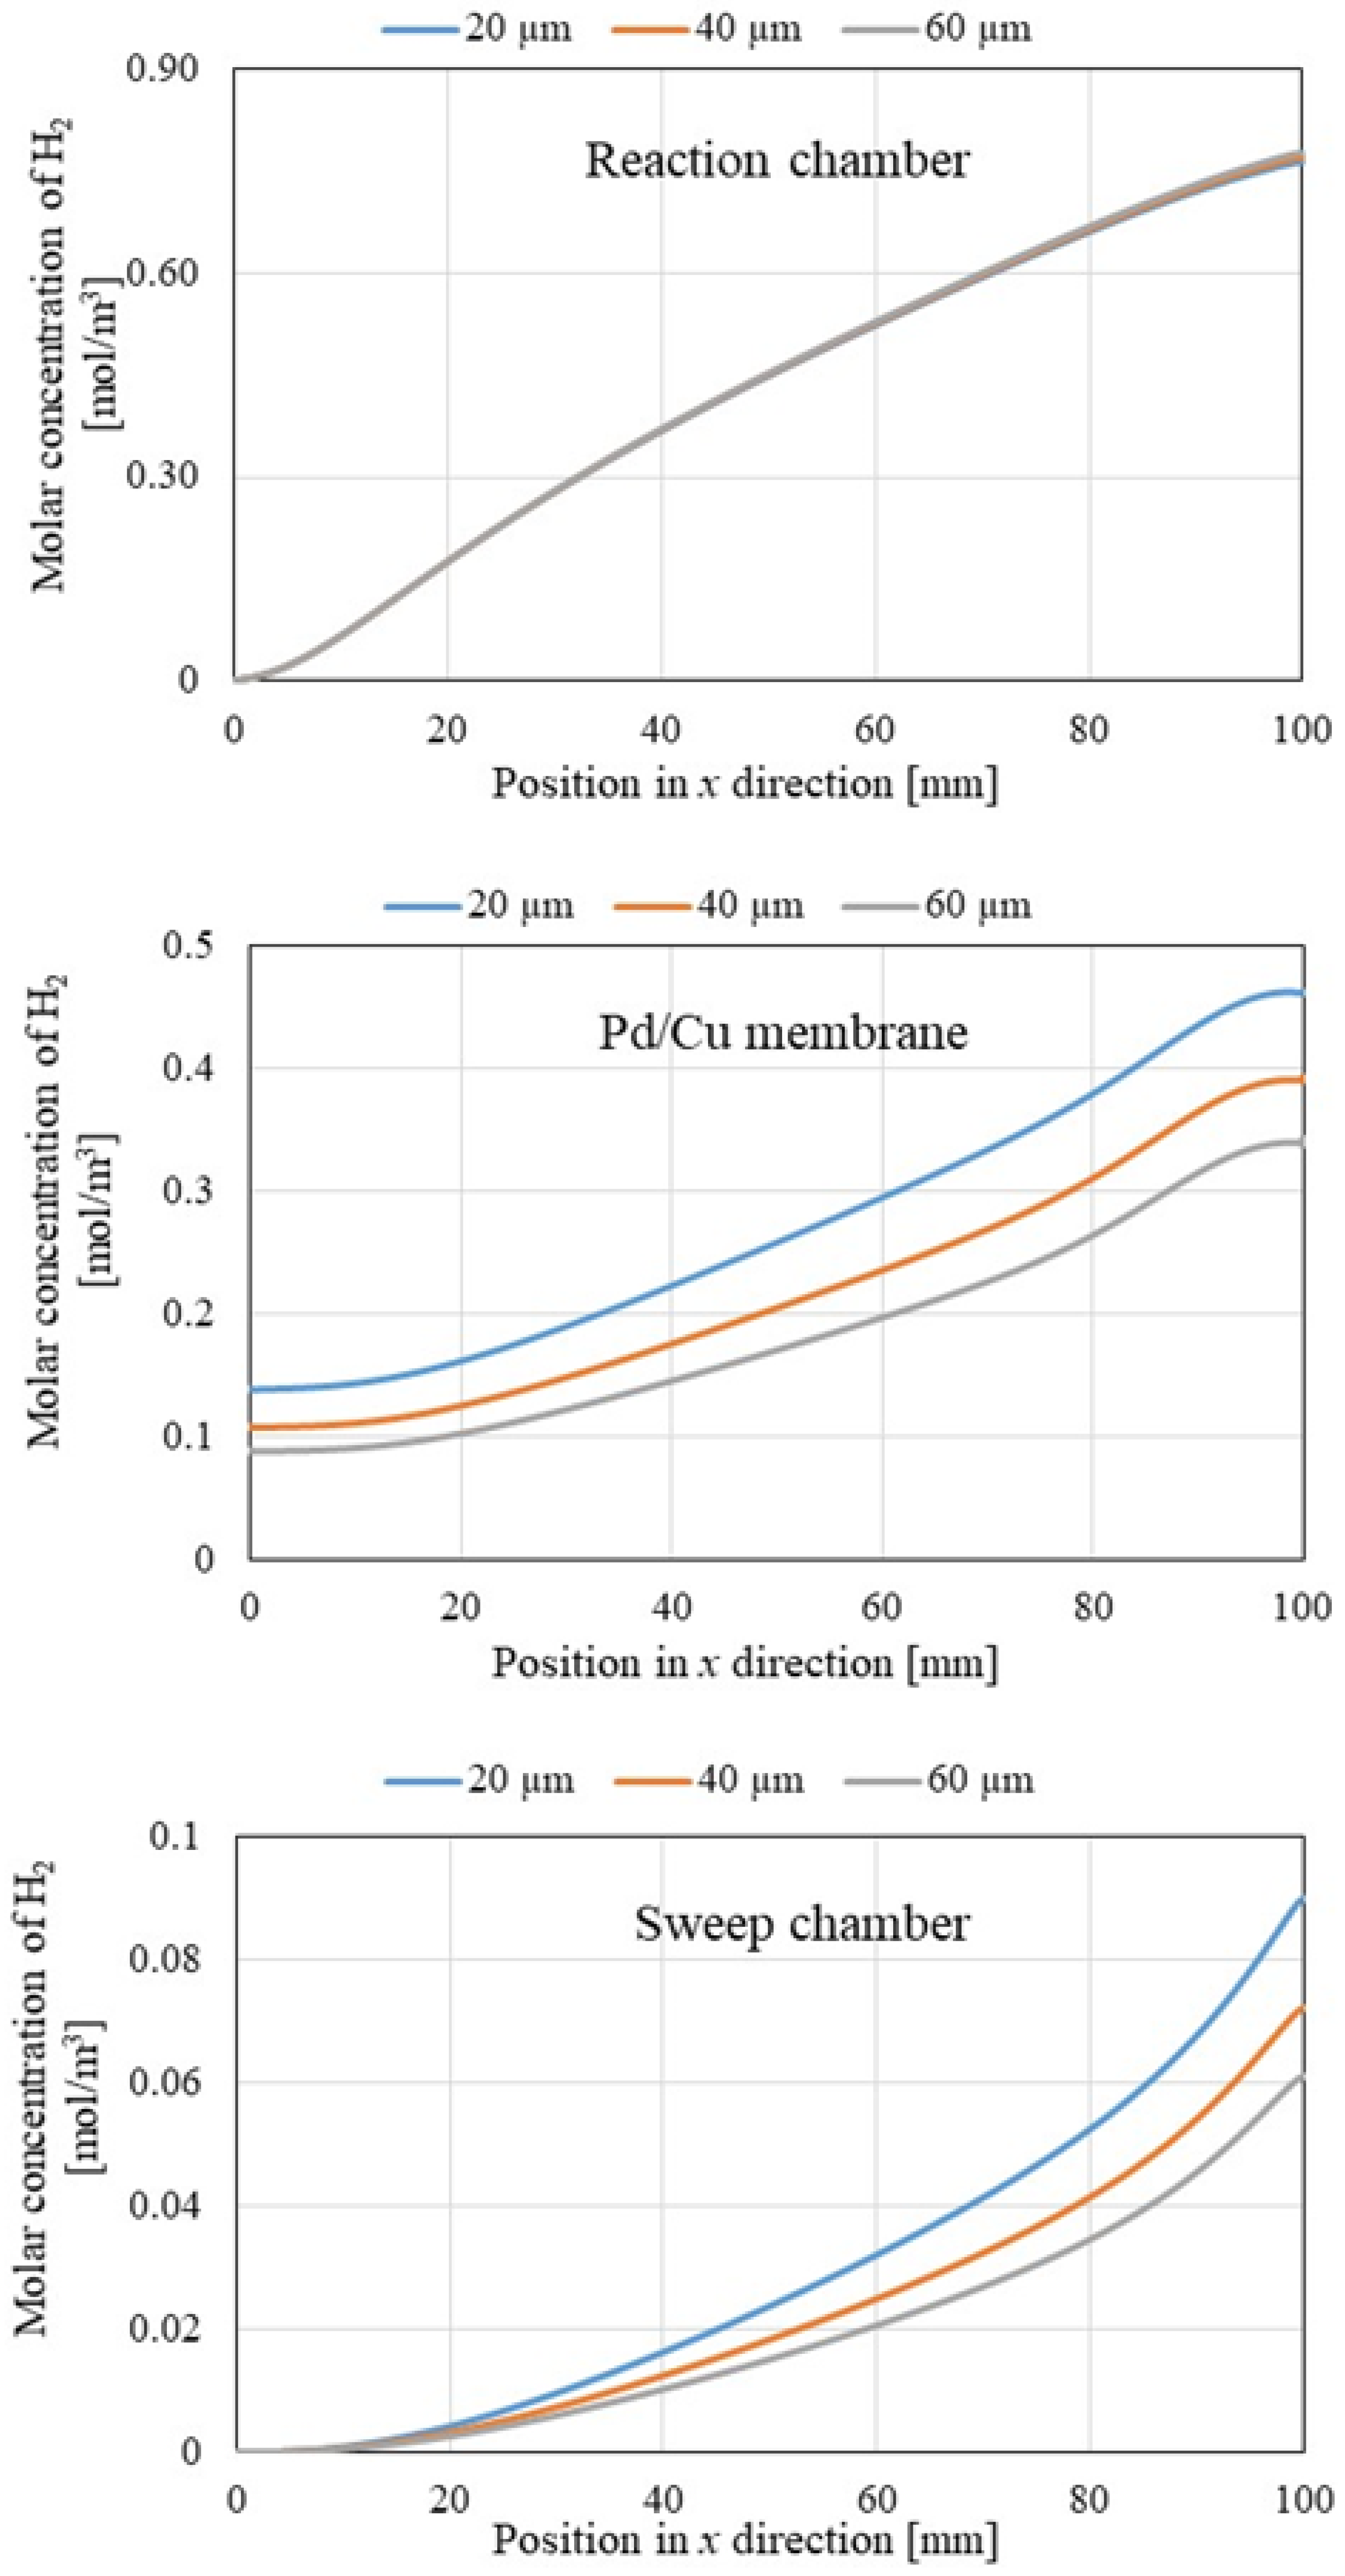
The molar concentration of H2 rose along the x-direction of the reaction chamber, Pd/Cu membrane, and sweep chamber. Since the H2 production reactions, i.e., Equations (1), (2) and (5), occur along the x-direction, the molar concentration of H2 increasing along the x-direction was expected.
(v)
The molar concentrations of H2 in the reaction chamber, Pd/Cu membrane, and sweep chamber increased with the increase in the initial reaction temperature.
(vi)
The molar concentrations of H2 in the Pd/Cu membrane and sweep chamber were higher when the molar concentration of H2 in the reaction chamber was higher.
(vii)
It is clear that the molar concentrations of H2 in the Pd/Cu membrane and sweep chamber rose with the decrease in the thickness of the Pd/Cu membrane.
(viii)
The CH4 conversion, CO2 conversion, and H2 yield rose with the increase in the initial reaction temperature and the reduction in the thickness of the Pd/Cu membrane.

Author Contributions

Conceptualization and writing—original draft preparation, A.N.; methodology and software, R.I. and S.Y.; data curation, M.I. and T.H.; writing—review and editing, E.H. All authors have read and agreed to the published version of the manuscript.

Funding

This study was funded by KRI cooperation.

Data Availability Statement

The authors agree to share the data of the paper published in this journal.

Conflicts of Interest

The authors do declare no conflicts of interest.

References

  1. Pei, A.; Xie, R.; Zhang, Y.; Feng, Y.; Wang, W.; Zhang, S.; Huang, Z.; Zhu, L.; Chai, G.; Yang, Z.; et al. Effective electronic tuning of Pt single atoms via heterogeneous atomic coordination of (Co, Ni)(OH)2 for efficient hydrogen evolution. Energy Environ. Sci. 2023, 16, 1035–1048. [Google Scholar] [CrossRef]
  2. Pei, A.; Zhu, L.; Huang, Z.; Ye, J.; Chang, Y.C.; Osman, S.M.; Pao, C.W.; Gao, Q.; Chen, B.H.; Luque, R. Nickel hydroxide-supported Ru single atoms and Pd nanoclusters for enhanced electrocatalytic hydrogen evolution and ethanol oxidation. Adv. Funct. Mater. 2022, 32, 2208587. [Google Scholar] [CrossRef]
  3. Wu, F.; Zeng, L.; Pei, A.; Feng, Y.; Zhu, L. N, P co-doped graphene-supported monometallic nanoparticles for highly efficient hydrogen evolution by acid electrolysis of water. J. Mater. Chem. A 2024, 17, 10300–10306. [Google Scholar] [CrossRef]
  4. Kalai, D.Y.; Stangeland, K.; Jin, R.; Tucho, W.M.; Yu, Z. Biogas dry reforming for syngas production on La promoted hydrotalcitederived Ni catalyst. Int. J. Hydrogen Energy 2018, 43, 19438–19450. [Google Scholar] [CrossRef]
  5. World Bioenergy Association. Available online: https://worldbioenergy.org/global-bioenergy-statistics (accessed on 12 December 2024).
  6. The Japan Gas Association. Available online: https://www.gas.or.jp/gas-life/biogas/ (accessed on 12 December 2024).
  7. Nishimura, A.; Hayashi, Y.; Ito, S.; Kolhe, M.L. Performance analysis of hydrogen production for a solid oxide fuel cell system using a biogas dry reforming membrane reactor with Ni and Ni/Cr catalysts. Fuels 2023, 4, 295–313. [Google Scholar] [CrossRef]
  8. Dogan, M.Y.; Arbag, H.; Tasdemir, M.; Yasyerli, N.; Yasyerli, S. Effect of ceria content in Ni-Ce-Al catalyst on catalytic performance and carbon/coke formation in dry reforming of CH4. Int. J. Hydrogen Energy 2023, 48, 23013–23030. [Google Scholar] [CrossRef]
  9. Kiani, P.; Meshksar, M.; Rahimpour, M.R. Biogas reforming over La-promoted Ni/SBA-16 catalyst for syngas production: Catalytic structure and process activity investigation. Int. J. Hydrogen Energy 2023, 48, 6262–6274. [Google Scholar] [CrossRef]
  10. Carrasco-Ruiz, S.; Zhang, Q.; Gandara-Loe, J.; Pastor-Perez, L.; Odriozola, J.A.; Reina, T.R.; Bobadilla, L.F. H2-rich syngas production from biogas reforming: Overcoming coking and sintering using bimetallic Ni-based catalysts. Int. J. Hydrogen Energy 2023, 48, 27907–27917. [Google Scholar] [CrossRef]
  11. Ponugoti, P.V.; Pathmanathan, P.; Rapolu, J.; Gomathi, A.; Janardhanan, V.M. On the stability of Ni/γ-Al2O3 catalyst and the effect of H2O and O2 during biogas reforming. Appl. Catal. A Gen. 2023, 651, 119033. [Google Scholar] [CrossRef]
  12. Martin-Espejo, J.L.; Merkouri, L.P.; Gandara-Loe, J.; Odriozola, J.A.; Reina, T.R.; Pastor-Perez, L. Nickel-based cerium zirconate inorganic complex structures for CO2 valorisation via dry reforming of methane. J. Environ. Sci. 2024, 140, 12–23. [Google Scholar] [CrossRef]
  13. Cao, A.N.T.; Nguyen, H.H.; Pham, T.P.T.; Pham, L.K.H.; Phuong, D.H.L.; Nguyen, N.A.; Vo, D.V.N.; Pham, P.T.H. Insight into the role of material basicity in the coke formation and performance of Ni/Al2O3 catalyst for the simulated-biogas dry reforming. J. Energy Inst. 2023, 108, 101252. [Google Scholar] [CrossRef]
  14. Veiga, S.; Romero, M.; Faccio, R.; Segobia, D.; Apesteguia, C.; Perez, A.L.; Brondino, C.D.; Bussi, J. Biogas dry reforming over Ni-La-Ti catalysts for synthesis gas production: Effects of preparation method and biogas composition. Fuel 2023, 346, 128300. [Google Scholar] [CrossRef]
  15. Cherbanski, R.; Kotkowski, T.; Molga, E. Thermogravimetric analysis of coking during dry reforming of methane. Int. J. Hydrogen Energy 2023, 48, 7346–7360. [Google Scholar] [CrossRef]
  16. Nishimura, A.; Yamada, S.; Ichii, R.; Ichikawa, M.; Hayakawa, T.; Kolhe, M.L. Hydrogen yield enhancement in biogas dry reforming with a Ni/Cr catalyst: A numerical study. Energies 2024, 17, 5421. [Google Scholar] [CrossRef]
  17. Jokar, S.M.; Farokhnia, A.; Tavakolian, M.; Pejman, M.; Parvasi, P.; Javanmardi, J.; Zare, F.; Clara Gonqalves, M.; Basile, A. The recent areas of applicability of palladium based membrane technologies for hydrogen production from methane and natural gas: A review. Int. J. Hydrogen Energy 2023, 48, 6451–6476. [Google Scholar] [CrossRef]
  18. Bang, G.; Moon, D.K.; Kang, J.H.; Han, Y.J.; Kim, K.M.; Lee, C.H. High-purity hydrogen production via a water-gas-shift reaction in a palladium-copper catalytic membrane reactor integrated with pressure swing adsorption. Chem. Eng. J. 2021, 411, 128473. [Google Scholar] [CrossRef]
  19. Lee, S.; Lim, H. The power of molten salt in methane dry reforming: Conceptual design with a CFD study. Chem. Eng. Process.-Process Intersif. 2021, 159, 108230. [Google Scholar] [CrossRef]
  20. Lee, S.; Lim, H. The effect of changing the number of membranes in methane carbon dioxide reforming: A CFD study. Int. J. Eng. Chem. 2020, 87, 110–119. [Google Scholar] [CrossRef]
  21. Ghasemazadeh, K.; Ghahremani, M.; Amiri, T.Y.; Basile, A. Performance evaluation of Pd-Ag membrane reactor in glyceol steam reforming process: Development of the CFD model. Int. J. Hydrogen Energy 2019, 44, 1000–1009. [Google Scholar] [CrossRef]
  22. Lee, B.; Lee, S.; Lim, K. Numerical modeling studies for a methane dry reforming in a membrane reactor. J. Nat. Gas. Sci. Eng. 2016, 34, 1251–1261. [Google Scholar] [CrossRef]
  23. Nishimura, A.; Mishima, D.; Ito, S.; Konbu, T.; Hu, E. Impact of separator thickness on relationship between temperature distribution and mass & current density distribution in single HT-PEMFC. Therm. Sci. Eng. 2023, 6, 4424. [Google Scholar] [CrossRef]
  24. Bian, Z.; Xia, H.; Wang, Z.; Jian, B.; Yu, Y.; Yu, K.; Zhong, W.; Kawi, S. CFD simulation of a hydrogen-permeable membrane reactor for CO2 reforming of CH4: The interplay of the reaction and hydrogen permeation. Energy Fuels 2020, 34, 12366–12378. [Google Scholar] [CrossRef]
  25. Anzelmo, B.; Wilcox, J.; Liguori, S. Hydrogen production via natural steam reforming in a Pd-Au membrane reactor. Comparison between methane and natural gas steam reforming reactions. J. Membr. Sci. 2018, 568, 113–120. [Google Scholar] [CrossRef]
  26. Bosko, M.L.; Munera, J.F.; Lombardo, E.A.; Cornaglia, L.M. Dry reforming of methane in membrane reactors using Pd and Pd-Ag composite membranes on a NaA zeolite modified porous stainless steel support. J. Membr. Sci. 2010, 364, 17–26. [Google Scholar] [CrossRef]
  27. Nishimura, A.; Ito, S.; Ichikawa, M.; Kolhe, M.L. Impact of thickness of Pd/Cu membrane on performance of biogas dry reforming membrane reactor utilizing Ni/Cr catalyst. Fuels 2024, 5, 439–457. [Google Scholar] [CrossRef]
  28. Amini, A.; Sedaghat, M.H.; Jamshidi, S.; Shariati, A.; Rahimpour, M.R. A Comprehensive CFD simulation of an industrial-scale side-fired steam methane reformer to enhance hydrogen production. Chem. Eng. Process. 2023, 184, 109269. [Google Scholar] [CrossRef]
  29. Bengerbaa, Y.; Virginieb, M.; Dumas, C. Computational fluid dynamics study of the dry reforming of methane over Ni/Al2O3 catalyst in membrane reactor—Coke deposition. Kinet. Catal. 2017, 58, 345–355. [Google Scholar] [CrossRef]
  30. Roa, F.; Way, J.D. Influence of alloy composition and membrane fabrication on the pressure dependence of the hydrogen flux of palladium-copper membranes. Ind. Eng. Chem. Res. 2003, 42, 5827–5835. [Google Scholar] [CrossRef]
  31. Kaviani, M.; Rezaei, M.; Alavi, S.M.; Akbari, E. Biogas dry reforming over nickel-silica sandwiched core-shell catalyst with various shell thickness. Fuel 2024, 355, 129533. [Google Scholar] [CrossRef]
  32. Georgiadis, A.G.; Siakavelas, G.I.; Tsiotsias, A.I.; Charisous, N.D.; Ehrhardt, B.; Wang, W.; Sebastian, V.; Hinder, S.J.; Baker, M.A.; Mascotto, S.; et al. Biogas dry reforming over Ni/LnOx-type catalysts (Ln = La, Ce, Sm or Pr). Int. J. Hydrogen Energy 2023, 48, 19953–19971. [Google Scholar] [CrossRef]
  33. Kumar, R.; Kumar, A.; Pal, A. Overview of hydrogen production from biogas reforming: Technological advancement. Int. J. Hydrogen Energy 2022, 47, 34831–34855. [Google Scholar] [CrossRef]
  34. Rosha, P.; Rosha, A.K.; Ibrahim, H.; Kumar, S. Recent advances in biogas upgrading to value added products: A review. Int. J. Hydrogen Energy 2021, 46, 21318–21337. [Google Scholar] [CrossRef]
Figure 1. Schematic figure of the 2D model used for the numerical simulation in the present study.
Fuels 06 00025 g001
Figure 2. Impact of the initial reaction temperature on the distribution of pressure along the x-direction in the reaction chamber (y = 62 mm), Pd/Cu membrane (y = 40 mm), and sweep chamber (y = 20 mm).
Fuels 06 00025 g002
Figure 3. Influence of the thickness of the Pd/Cu membrane on the distribution of pressure along the x-direction in the reaction chamber (y = 62 mm), Pd/Cu membrane (y = 40 mm), and sweep chamber (y = 20 mm).
Fuels 06 00025 g003
Figure 4. Impact of the initial reaction temperature on the distribution of the gas concentrations along the x-direction in the reaction chamber (y = 62 mm).
Fuels 06 00025 g004
Figure 5. Photo of Ni/Cr catalyst used in this study before and after experiments (left catalyst: before experiment; right catalyst: after experiment) [27].
Fuels 06 00025 g005
Figure 6. Photo of produced H2O observed using gas bag [27].
Fuels 06 00025 g006
Figure 7. Influence of the initial reaction temperature on the distribution of molar concentrations of H2 along the x-direction in the reaction chamber (y = 60 mm), Pd/Cu membrane (y = 40 mm), and sweep chamber (y = 20 mm).
Fuels 06 00025 g007
Figure 8. Influence of the thickness of the Pd/Cu membrane on the distribution of gas concentrations along the x-direction in the reaction chamber (y = 62 mm).
Fuels 06 00025 g008
Figure 9. Influence of the thickness of the Pd/Cu membrane on the distribution of the molar concentration of H2 along the x-direction in the reaction chamber (y = 60 mm), Pd/Cu membrane (y = 40 mm), and sweep chamber (y = 20 mm).
Fuels 06 00025 g009
Table 1. Numerical simulation conditions adopted in the present study.
Initial Reaction Temperature [°C]400, 500, 600
Pressure of gas in reactor [Pa]1.013 × 10⁵
Flow rate of CH4 at inlet [kg/s]
(CH4:CO2 = 1.5:1)
5.78 × 10⁻¹¹
Flow rate of CO2 at inlet [kg/s]
(CH4:CO2 = 1.5:1)
1.23 × 10⁻¹¹
Pressure at the outlet of reactor [Pa]1.013 × 10⁵
Density of Ni/Cr catalyst [kg/m3]1045, 1042, 1040 (@400 °C, 500 °C, 600 °C)
Porosity of Ni/Cr catalyst (εp) [-]0.95
Permeability of Ni/Cr catalyst [m2]1.7 × 10⁻⁸, 1.6 × 10⁻⁸, 1.5 × 10⁻⁹
Specific heat at constant pressure of
Ni/Cr catalyst [J/(kg·K)]
327, 333, 340
Thermal conductivity of Ni/Cr catalyst
[W/(m·K)]
197, 194, 192
Table 2. Comparison of CH4 conversion, CO2 conversion, H2 yield, H2 selectivity, and CO selectivity for various initial temperatures using the thickness of the Pd/Cu membrane of 20 μm and various thicknesses of Pd/Cu membranes at the initial temperature of 600 °C.
Thickness of Pd/Cu membrane of 20 μm
Initial Reaction Temperature [°C]CH4 Conversion [%]CO2 Conversion [%]H2 Yield [%]H2 Selectivity [%]CO Selectivity [%]
60015.015.95.0949.150.9
5004.033.731.1446.453.6
4001.100.490.1552.247.8
Initial Temperature of 600 °C
Thickness of
Pd/Cu Membrane [μm]
CH4 Conversion [%]CO2 Conversion [%]H2 Yield [%]H2 Selectivity [%]CO Selectivity [%]
2015.015.95.0949.150.9
4014.215.45.0249.250.8
6013.515.05.0049.250.8
Disclaimer/Publisher’s Note: The statements, opinions and data contained in all publications are solely those of the individual author(s) and contributor(s) and not of MDPI and/or the editor(s). MDPI and/or the editor(s) disclaim responsibility for any injury to people or property resulting from any ideas, methods, instructions or products referred to in the content.

