Article

Numerical and Experimental Investigation on Combustion Characteristics and Pollutant Emissions of Pulverized Coal and Biomass Co-Firing in a 500 kW Burner

Department of Mechanical Engineering, Faculty of Engineering, King Mongkut’s University of Technology Thonburi, 126 Pracha Uthit Road, Bang Mod, Thung Khru, Bangkok 10140, Thailand
*
Author to whom correspondence should be addressed.
Submission received: 24 October 2024 / Revised: 5 December 2024 / Accepted: 24 January 2025 / Published: 30 January 2025

Abstract

:
The global shift towards clean energy has been driven by the need to address global warming, which is exacerbated by economic expansion and rising energy demands. Traditional fossil fuels, particularly coal, emit more pollutants than other fuels. Recent studies have shown significant efforts in using biomass as a replacement or co-firing it with coal. This is because biomass, being a solid fuel, has a combustion mechanism similar to that of coal. This study investigates the co-firing behavior of pulverized coal and biomass in a semi-combustion furnace with a 500 kW heat input, comprising a pre-chamber and a main combustion chamber. Using computational fluid dynamics (CFD) simulations with ANSYS Fluent 2020 R1, the study employs species transport models to predict combustion reactions and discrete phase models (DPM) to track fuel particle movement. These models are validated against experimental data to ensure accurate predictions of mixed fuel combustion. The research examines various biomass-to-coal ratios (0%, 25%, 50%, 75%, and 100%) to understand their impact on combustion temperature and emissions. Results show that increasing the biomass ratio reduces combustion temperature due to biomass’s lower heating value, higher moisture content, and larger particle size, leading to less efficient combustion and higher CO emissions. However, this temperature reduction also correlates with lower NOx emissions. Additionally, biomass’s lower nitrogen and sulfur content contributes to further reductions in NOx and SO2 emissions. Despite biomass having higher volatile matter content, which results in quicker combustion, coal demonstrates a higher carbon burnout rate, indicating more efficient carbon combustion. The study concludes that while pure coal combustion efficiency is higher at 87.7%, pure biomass achieves only 77.3% efficiency. Nonetheless, increasing biomass proportions positively impacts emissions, reducing harmful NOx and SO2 levels.

1. Introduction

Due to economic and industrial expansion, the global demand for energy continues to rise. This increase has led to several impacts, particularly environmental issues, as most energy production still relies on fossil fuels. This reliance results in the release of carbon dioxide into the atmosphere, nitrogen oxides that damage the ozone layer, and sulfur dioxide that causes acid rain. These emissions contribute to climate change, affecting ecosystems and human health through the severity of global warming. Consequently, this situation has driven the promotion of biomass as a significant renewable energy source and an alternative to fossil fuels. There is an effort to use biomass alongside fossil fuel in small-scale settings or industrial furnaces, particularly in power plants where biomass is co-fired with coal [1,2,3,4].
The use of biomass as a renewable energy source has garnered attention because it is a globally available resource and does not add additional carbon dioxide to the atmosphere. During their growth process, plants can absorb up to 93% of the carbon dioxide released from biomass combustion [5]. Moreover, co-firing biomass with coal offers several advantages. It promotes the use of agricultural waste materials available in each region, reduces waste, and adds value to these residual materials, thus stimulating the local economy. This approach decreases coal imports in some countries, enhancing energy security, reducing dependence on imports, and mitigating global energy market volatility. Utilizing local fuels also lowers transportation costs and increases local employment opportunities. Blending biomass with coal helps reduce pollution at the source by lowering the overall nitrogen content of the fuel, which directly decreases the production of nitrogen dioxide, a gas that impacts the climate and public health, during combustion. Additionally, since biomass contains significantly less sulfur than coal, it substantially reduces the formation of sulfur dioxide, a primary cause of acid rain. Lowering these emissions improves air quality and mitigates long-term environmental impacts.
Currently, four common systems are used for biomass fuel energy production: direct-fired combustion, gasification, pyrolysis, and co-firing. Each method has distinct advantages and disadvantages. The direct-fired combustion system has relatively low efficiency in converting heat to electricity, ranging from 20 to 25%. Additionally, it produces relatively high pollution levels due to incomplete combustion. However, this system is simple, requires minimal maintenance, and is stable and highly reliable. The gasification system processes biomass fuel by converting it into a gaseous form. This method has a combustion efficiency of 30–40%, which can reach up to 80% when combined with other processes. The resulting pollution is relatively low, with the main emission being higher levels of carbon monoxide. However, the system is somewhat unstable, requiring significant maintenance and precise control of fuel size; if the fuel is too small, air cannot flow properly, and if it is too large, it may not fully combust. The pyrolysis system involves the thermal decomposition of biomass under low-oxygen conditions. It is similar to gasification but produces three types of fuel in different states: char, bio-oil, and biogas. The advantage is that it yields three forms of fuel of higher quality than raw biomass. However, the process is complex, requiring a good understanding from the operators, and the fuels produced by pyrolysis need further refinement before use. The final system is co-firing, where biomass fuel is mixed with other fossil fuels, such as coal. This is an appropriate option because coal is currently burned in a pulverized form, with fuel particles smaller than 1 mm, allowing for better homogeneity in mixing. Additionally, it helps maintain flame stability by using swirl-induced air injection [6,7,8,9,10,11,12,13,14,15,16]. This method also allows for better control of thermal load compared to conventional technologies.
Studies on pulverized co-firing highlight its high potential and feasibility because it can be used alongside existing coal, a solid fuel with similar combustion characteristics. This compatibility minimizes the need for extensive modifications to the combustion chamber and allows the use of basic equipment designed for coal combustion without significant infrastructure investment. Therefore, this method is an efficient alternative that can be quickly implemented in the industry.
Although co-firing offers many benefits by combining biomass with coal, it still faces several challenges, such as improving combustion efficiency, controlling emissions, and maintaining high stability and performance during combustion. Since biomass and coal have different physical and chemical properties, co-firing requires the specific analysis and design of combustion conditions to effectively address these differences. Testing co-firing in furnaces requires substantial resources, such as large-scale facilities, because solid fuel combustion involves larger machinery compared to other fuel types. Additionally, the high cost of operators and the extended duration of tests make it challenging to explore all variables related to combustion comprehensively. To address these issues, mathematical modeling (simulation) has become a popular method for reducing resource use in testing. Simulations offer the advantage of a detailed representation of phenomena occurring in the combustion chamber, allowing for more in-depth analysis compared to tests limited by equipment constraints.
This study uses numerical simulations to analyze and predict the behavior of co-firing between coal and biomass, including emissions. Mathematical modeling allows for a detailed examination of combustion at the microscopic level and enables the adjustment of various parameters to find optimal conditions for co-firing. Additionally, simulations reduce costs and risks associated with experiments. Practical studies of co-firing often face challenges such as high costs, difficulty in controlling experimental conditions, and the complexity of the combustion process. Therefore, simulation is an effective and cost-efficient method for analyzing and optimizing co-firing processes. It allows for the precise testing of factors such as temperature, pressure, airflow, and fuel composition, and helps develop strategies to improve combustion efficiency and reduce emissions. However, creating accurate models requires substantial data to ensure precision.
Research in biomass and coal co-firing systems has revealed various insights into combustion characteristics and emission controls. Several studies have focused on analyzing biomass combustion at the microscopic particle level to investigate the associated combustion characteristics and kinetic parameters [17,18,19,20].
Ballester et al. (2005) [21] conducted combustion experiments in a pilot-scale pulverized fuel furnace using bituminous coal, lignite coal, and oak wood. This study investigated the effects of fuel differences on combustion characteristics, such as flame shape, temperature distribution, and combustion gas composition, including O2, CO, NOx, and unburned carbon. Findings indicated that higher volatile content, particularly in lignite and biomass, led to more intense combustion and longer flame lengths compared to coal.
Ndibe et al. (2015) [22] analyzed the combustion of 100% pulverized coal, 100% torrefied biomass, and a 1:1 mixture of torrefied biomass and coal in a 500 kW pulverized fuel furnace. With secondary air heated to 195 °C, the study concluded that torrefied biomass addition significantly reduced NOx and SOx emissions.
Traditional combustion systems designed for coal face challenges in burning 100% biomass due to differing internal properties. Biomass requires more time to evaporate its moisture and has a lower heating value of volatiles compared to coal, causing flame stability issues. Additionally, biomass combustion occurs more slowly due to larger particle sizes and slower reaction rates, limiting the feasibility of completely replacing coal with biomass in industrial settings.
Wang et al. (2015) [23] used a drop-tube furnace to investigate coal and biomass co-firing. Their results demonstrated satisfactory performance and NOx emissions at a co-firing ratio of 0.4 biomass to coal. Aziz et al. (2016) [24] employed computational fluid dynamics (CFD) to study the combustion behavior of pulverized coal mixed with biomass in power plants, finding that up to 15% biomass could be added without adversely affecting temperature distribution within the combustion chamber.
CFD has been extensively used in researching pulverized firing systems. Ma et al. (2007) [25] conducted simulations of biomass combustion in an existing pulverized coal furnace, finding close agreement between simulation results and experimental data. Yin et al. (2012), Yin et al. (2012), and Li et al. (2013) [26] further explored the combustion characteristics of pulverized coal and biomass, revealing differences in flame characteristics and the effects of drag force and oxygen concentration on the devolatilization process and flame characteristics.
Elfasakhany et al. (2013) [27] and Elorf and Sarh (2019) [28] studied the combustion behavior of finely ground biomass using experimental and CFD modeling approaches. Findings indicated that higher volatile release leads to increased hydrocarbons and carbon monoxide concentrations. Adjusting combustion variables can improve burner performance to achieve a similar efficiency to coal combustion.
The combustion of biomass fuel in pulverized form has high potential for replacing existing or co-fire with existing coal fuels. In traditional burner designs, fuel is introduced into the combustion chamber by injecting air through a swirler, which helps disperse the fuel and enhance combustion [29,30]. However, biomass differs from coal in terms of ignition and combustion characteristics due to its fixed carbon content. Therefore, additional adjustments to the combustion variables are necessary to improve the performance of burners and achieve similar efficiency, as with coal.
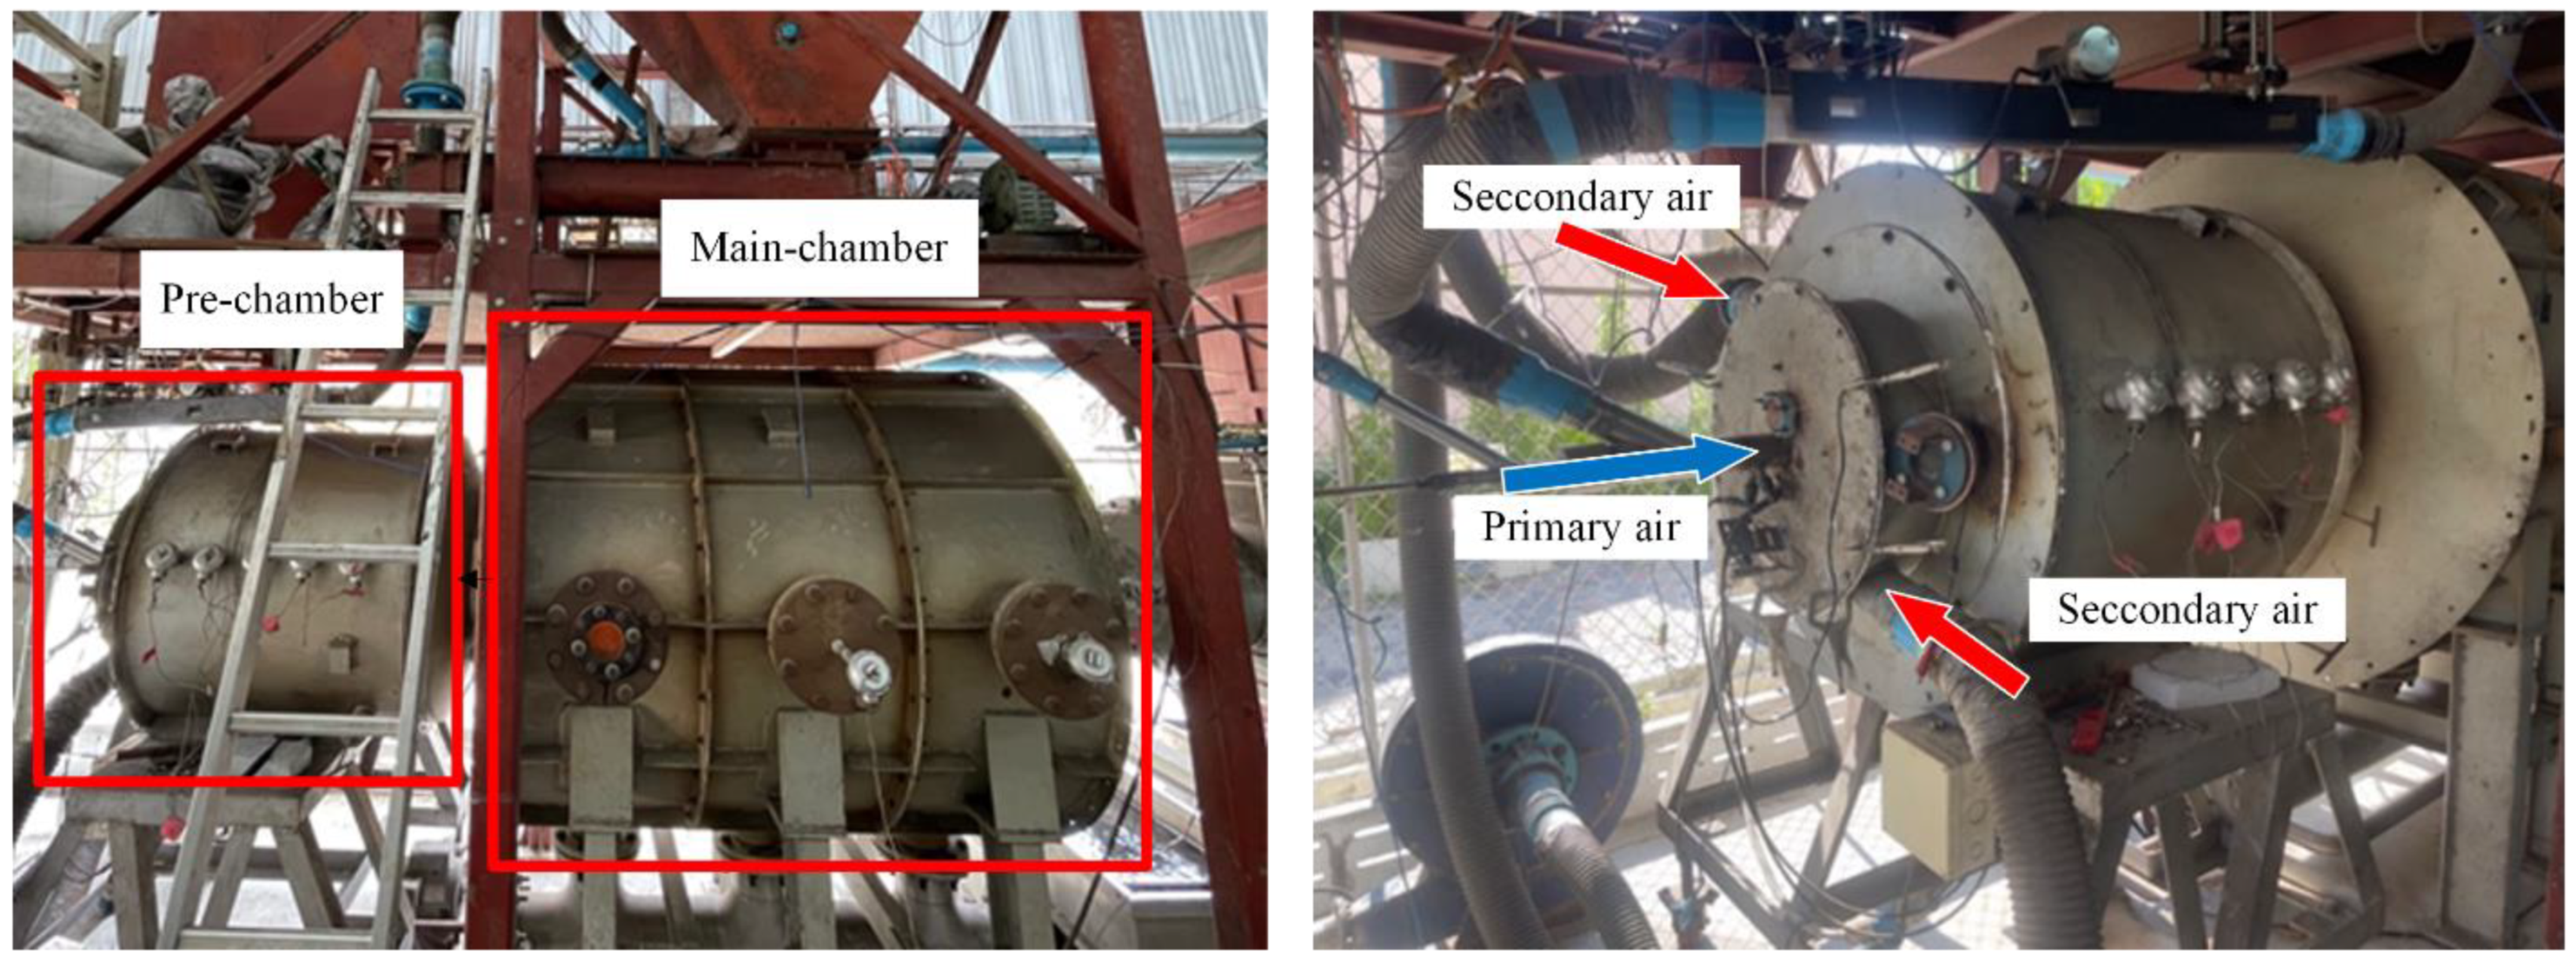
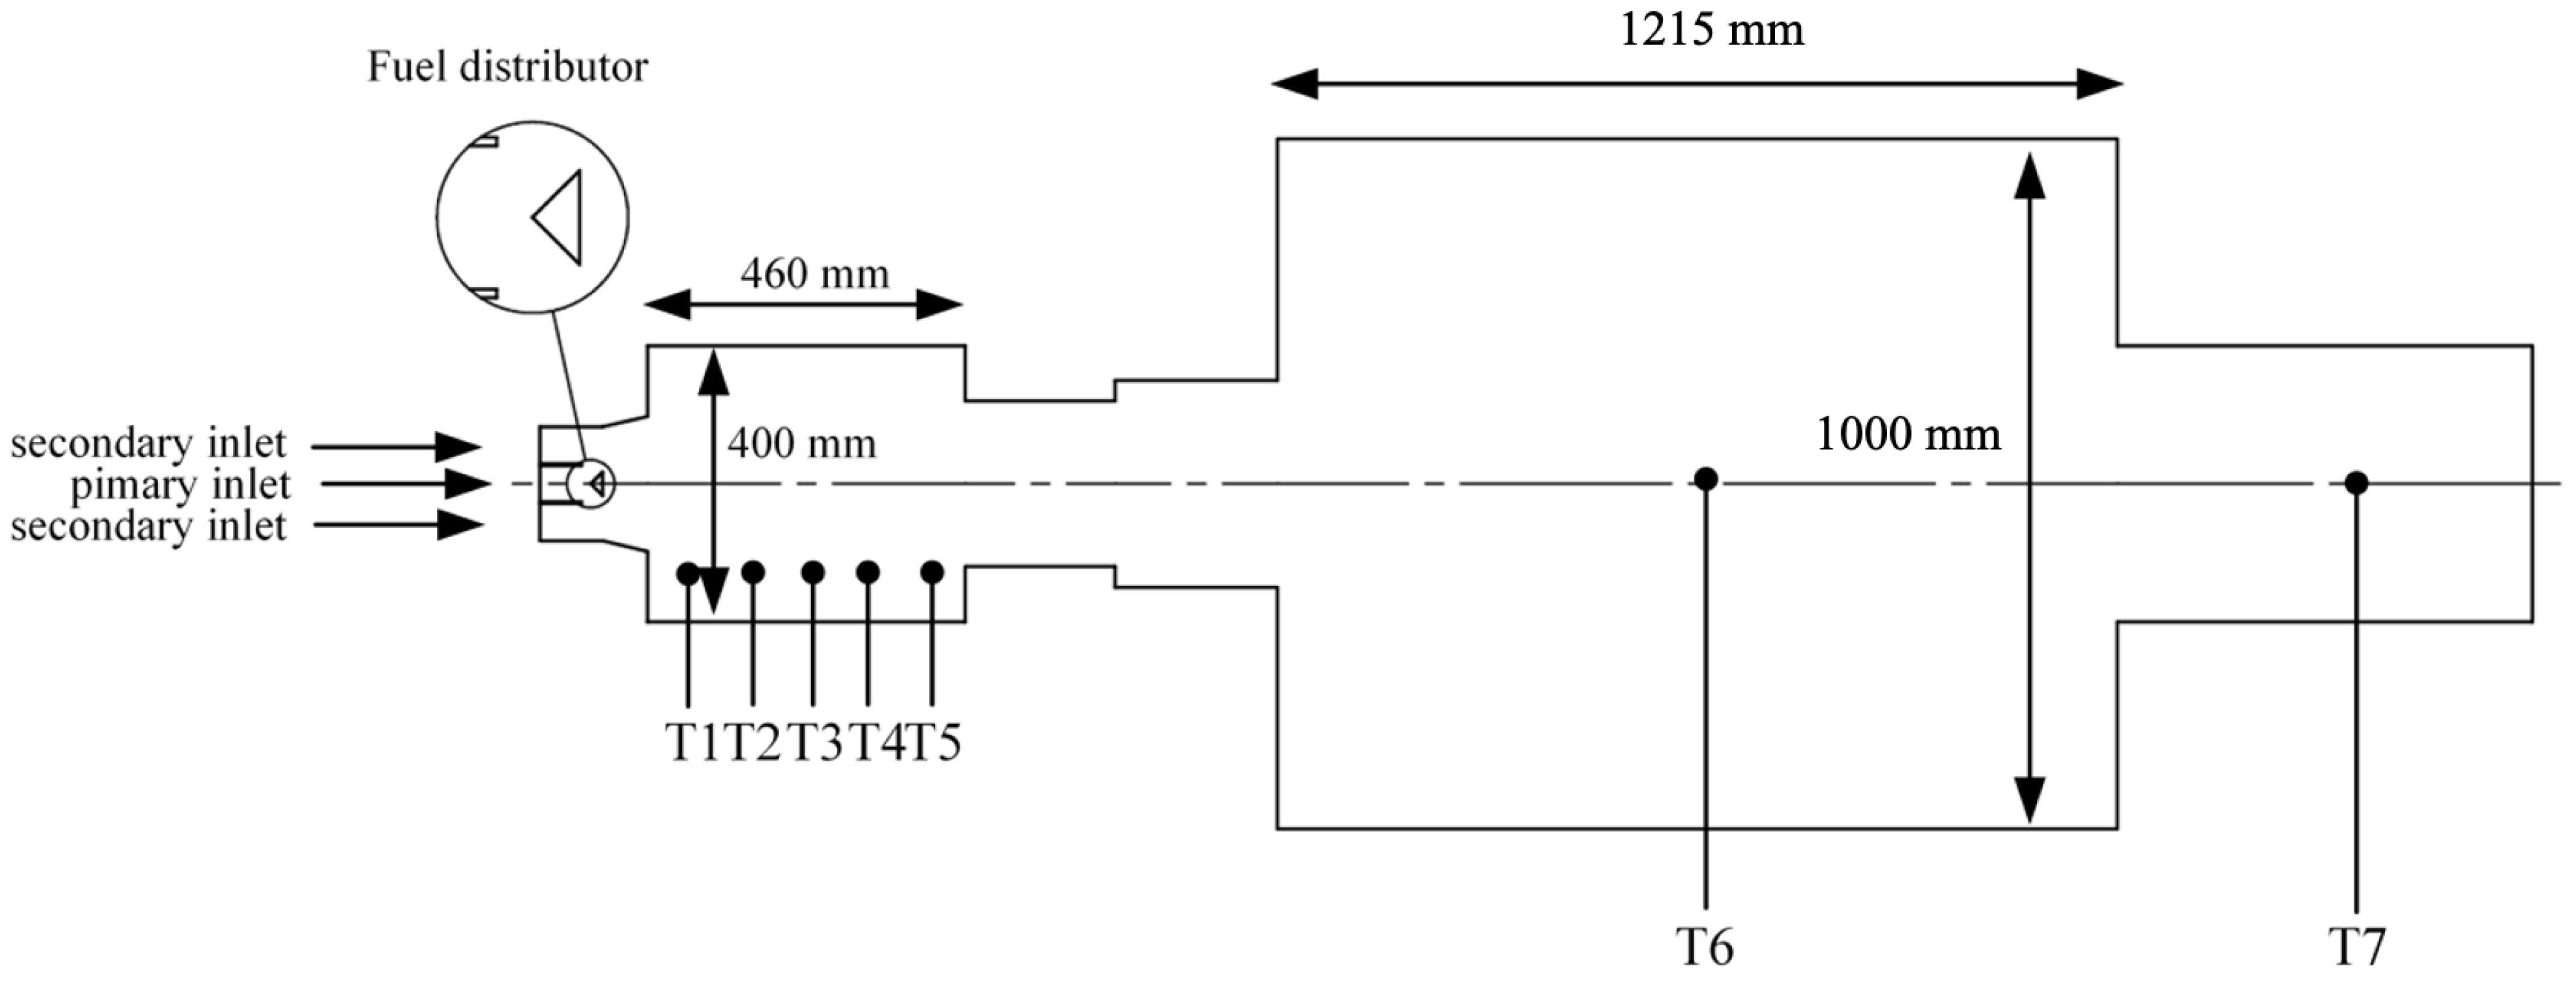
Previous research has explored co-firing biomass with coal at low proportions, typically not exceeding 25% by mass, with the aim of avoiding adverse effects on temperature distribution and combustion efficiency. However, these studies are insufficient for a future scenario in which we aim to use more renewable fuel sources to promote clean energy use. Therefore, it is essential to thoroughly understand the co-combustion behavior of coal and biomass. In this research, we utilized computational modeling to simulate the co-firing process within a furnace. This model uses experimental data and relevant databases to create realistic and accurate combustion conditions. The simulation allows us to quickly and efficiently test and optimize various parameters without the need for extensive physical experiments. Consequently, the research team designed a study on co-firing coal and biomass by conducting tests in a 500 kW heat input pulverized fuel furnace with a two-chamber design. Data were collected on fuel usage, air consumption, combustion temperatures in different areas of the furnace, and exhaust gas composition. These data were used to develop a model to study the combustion behavior and emissions when varying the ratios of coal and biomass.

2. Methodology

2.1. Experiment Setup

Figure 1 illustrates the combustion furnace utilized in this study, which is designed specifically for burning pulverized fuel. It is a semi-industrial furnace installed at King Mongkut’s Institute of Technology Ladkrabang (KMITL), Thailand. This furnace has a substantial heat input capacity of 500 kW and is divided into two main sections. The first section, known as the premixed chamber, is responsible for drying moisture and the initial combustion of volatile substances released from the fuel. The second section is the main chamber. In this section, the remaining volatile substances and fixed carbon are predominantly combusted, ensuring a complete and efficient burning of the fuel.
The furnace is equipped with two air inlets, each playing a distinct role in the combustion process. The primary air inlet is responsible for conveying the fuel into the combustion chamber through a conical fuel distributor. This ensures that the fuel is evenly distributed within the chamber, allowing for more efficient combustion. The secondary air inlet introduces the main combustion air through a swirler. The swirler is designed to create a vortex flow within the combustion chamber, which helps to improve the mixing of air and fuel, enhancing the combustion process. This design ensures that the combustion is as complete as possible, minimizing the emission of pollutants and maximizing the energy output from the fuel.
Figure 2 presents the locations of the seven temperature measurement points along the length of the furnace. These points are strategically positioned to provide accurate and comprehensive data on the temperature distribution within the furnace. Specifically, the measurement points are located at distances of 0.082 m, 0.182 m, 0.282 m, 0.382 m, 0.482 m, 1.594 m, and 2.681 m from the burner tip. This precise placement allows for detailed monitoring of temperature variations at different stages of the combustion process.
To ensure the integrity and longevity of the temperature sensors, special consideration has been given to their installation. The first five sensors, positioned closest to the burner where temperatures are highest, are installed to a maximum depth of 0.34 m from the pre-chamber wall. This installation depth helps protect the sensors from potential damage caused by the intense heat conditions present in the initial stages of combustion. By limiting the exposure of these sensors to extreme conditions, their accuracy and durability are maintained, ensuring reliable temperature measurements over extended periods.
In the experiments, the furnace operates under conditions of 500 kW heat input with 10% excess air, corresponding to an equivalence ratio of 1.1. This setup ensures that there is slightly more air than the stoichiometric requirement, promoting complete combustion. The fuel mass is determined based on its higher heating value, which represents the total energy content of the fuel. Meanwhile, the mass of air required for combustion is calculated from the chemical equilibrium of the combustion process. The data for these calculations are derived from the ultimate analysis of the fuel in Table 1, which provides detailed information on the fuel’s elemental composition. The masses of both the fuel and the air, as well as the temperatures used during the combustion tests of coal and biomass, are displayed in Table 3 in case 0% and 100% thermal basis.

2.2. Fuel Characteristics

In this study, the characteristics of pulverized fuel resulting from the co-combustion of coal and biomass are examined. The biomass fuel selected for this research is rubberwood, a widely available renewable resource in Thailand. Rubberwood is known for its relatively high volatile matter content and moderate calorific value, making it suitable for combustion processes.
The coal fuel used in this study is sub-bituminous coal imported from Indonesia and delivered to a port in Ayutthaya Province, Thailand. Sub-bituminous coal was selected due to its favorable properties, such as a higher calorific value and lower sulfur content compared to other types of coal. This type of coal, sourced from the same supplier, is widely used in various industries in Thailand. These properties make it an excellent candidate for blending with biomass to optimize the combustion process. By combining these two fuels, the study aims to explore the potential benefits and challenges associated with their co-combustion. The composition and properties of both the rubberwood and sub-bituminous coal are detailed in Table 1. This table provides essential information such as the moisture content, ash content, volatile matter, fixed carbon, and calorific value of each fuel.

2.3. Particle Size

The particle size of the fuel was assessed using a sieve analysis to ensure an accurate understanding of the size distribution of the fuel particles. In this process, fuel samples were passed through a series of sieves with mesh sizes ranging from 54 μm to 1000 μm. Each sieve allows particles smaller than its mesh size to pass through while retaining larger particles. The resulting particle size distribution is then presented as the mass fraction retained on each sieve versus the mass fraction passing through. To model this relationship, the Rosin–Rammler distribution equation is employed, as illustrated in Equation (1).
Y d = e ( d p / d ¯ p ) n
where Y d is the mass fraction of the particle size group, d p is the particle size, d ¯ p is the average particle size, and n is the distribution parameter. From the size measurement and the relationship modeled by Equation (1) as shown in Figure 3, it was determined that the average particle sizes for coal and biomass are 128 µm and 199 µm, respectively. The distribution parameters are 0.94 for coal and 1.46 for biomass.
In the Rosin–Rammler distribution equation, Y d represents the mass fraction of a specific particle size group, d p denotes the particle size, d ¯ p is the average particle size, and n is the distribution parameter that characterizes the spread of the particle sizes. By applying Equation (1) to the particle size measurements, as shown in Figure 3, the study was able to determine the average particle sizes for the two types of fuel used in the combustion model. For coal, the average particle size was found to be 128 μm, while for biomass, it was 199 μm. Additionally, the distribution parameters, which indicate the degree of uniformity in particle sizes, were calculated to be 0.94 for coal and 1.46 for biomass. These values suggest that the coal particles have a more uniform size distribution compared to the biomass particles.

3. Numerical Model

The Fluent 2020 R1 software was used to perform three-dimensional finite volume simulations using computational fluid dynamics (CFD), a sophisticated tool for analyzing fluid flow, heat transfer, and related phenomena through numerical solution of governing equations. To accurately model combustion processes, the discrete phase model (DPM) was employed. This model effectively tracks particle trajectories and simulates their interactions with the gas phase. Furthermore, chemical reactions involved in combustion were simulated using the species transport model, which incorporates an eddy dissipation-concept (EDM). This sub-model is crucial for capturing the complex interactions between turbulence and chemical reactions, ensuring a realistic simulation of the combustion process.
For pressure–velocity coupling, which is a crucial aspect of fluid flow simulations, a coupled algorithm was employed. This approach enhances the stability and accuracy of the simulation by solving the pressure and velocity fields simultaneously. To further improve the precision of the simulations, a second-order upwind scheme was used for spatial discretization. This scheme helps in reducing numerical diffusion and improving the accuracy of the gradient calculations.
Moreover, the pressure solver in Fluent was set to use the PRESTO! (Pressure Staggering Option) algorithm, which is particularly effective for handling high-speed flows and flows with strong pressure gradients. Convergence criteria were rigorously set to ensure the reliability of the simulation results. Specifically, residuals were required to fall below 10−3 for most equations, ensuring that the numerical solution had stabilized. For the energy equation, as well as for pollutants and radiation, stricter convergence criteria of 10−5 were applied, reflecting the importance of accurately capturing these aspects of the combustion process.

3.1. Grid and Mesh Sensitivity

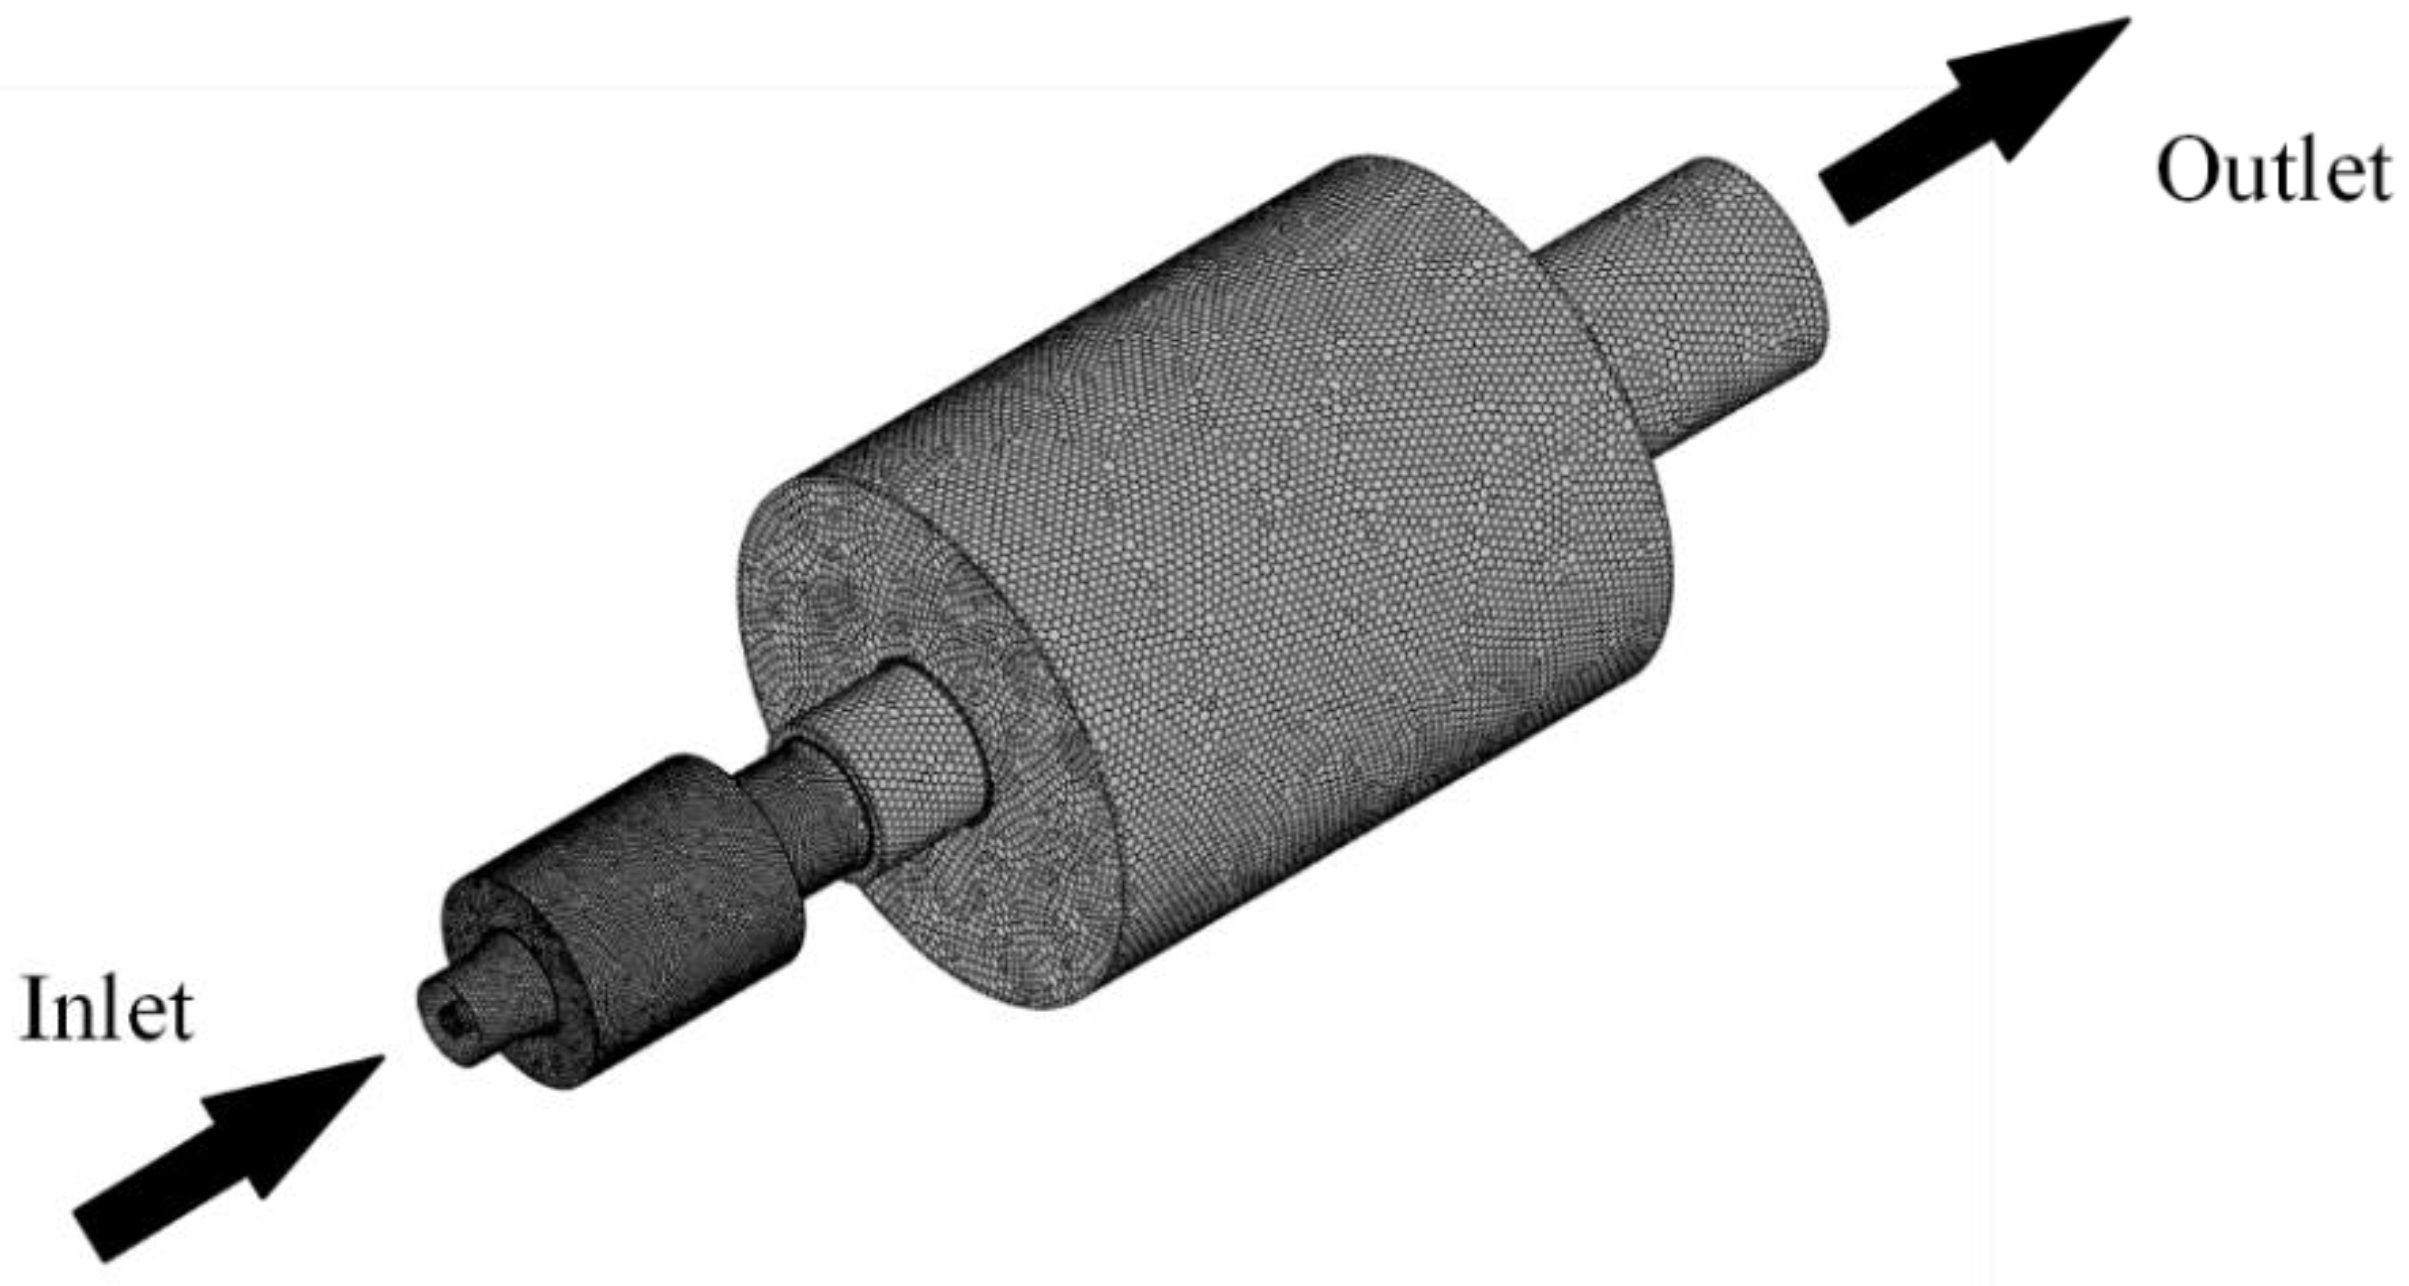
Figure 4 depicts the three-dimensional domain of the flow and showcases the polyhedral elements employed in the mesh. To ensure accurate simulation results, a mesh sensitivity analysis was conducted to optimize element sizes. The domain was divided into two distinct parts based on their characteristics: the pre-chamber, extending up to a radius of 0.7 m from the inlet, utilized smaller 10 mm elements. This choice was driven by the turbulent and reactive nature of this critical region, requiring finer resolution for precise modeling of fluid dynamics and combustion processes. In contrast, the main chamber employed larger 20 mm elements to balance computational efficiency while maintaining accuracy. Overall, the simulation utilized approximately 957,000 elements, strategically distributed to capture the complex interactions within the furnace and provide reliable insights into its operational dynamics.

3.2. Mathematics Models

3.2.1. Governing Equation

The equations of the continuous phase are governed by the conservation laws for mass, momentum, energy, and species concentration. For steady turbulent flow, these equations, when time-averaged for the gas phase, describe incompressible and turbulent flow behavior that can be expressed as [31]
x i ρ u j Φ = x j Γ Φ Φ x i + S Φ
where ρ is the fluid phase density, u j is the Cartesian velocity, Φ is the dependent variable, Γ Φ is the diffusion coefficient, and S Φ is source term.

3.2.2. Turbulent Model

Turbulent fluid flow is typically modeled by solving the steady-state Reynolds-averaged Navier–Stokes (RANS) equations, as described by Deniz et al. (2015) [32]. This approach involves using a turbulent viscosity-based turbulence model, specifically the realizable k-ε model, which is enhanced by standard wall functions to accurately capture near-wall turbulence. Laphirattanakul et al. (2020) [33] found this model to be particularly suitable for complex flow scenarios, such as recirculating and swirling flows, providing reliable and accurate predictions for these challenging conditions.

3.2.3. Particles Transport Model

In this modeling approach, the two-phase flow was evaluated using the Eulerian–Lagrangian method, as detailed by Li et al. (2012) [3]. The gas phase equations are solved within the Eulerian domain, while particle motion is treated within a Lagrangian framework, as described by Tabet et al. (2015) [34]. The discrete phase model (DPM) is employed to track the motion of fuel particles. This model determines the trajectories of the fuel particles by considering various forces acting on them, primarily gravitational and drag forces [3]. These forces significantly influence particle motion, leading to complex interaction patterns within the flow. The comprehensive force balance on each particle as it moves through the domain is mathematically represented in Equation (3). This method allows for a detailed analysis of the dynamic behavior of particles in the flow, providing insights into their interactions and the overall flow characteristics.
m P d v d t = F
d v d t = 18 μ ρ p d p 2 C D R e p 24 + ρ p ρ ρ p g
where m P is the particle mass, F = [ F x ,   F y ,   F z ] are forces acting on the particle, v is the translation velocity vector of the particle center of mass, μ is the dynamics viscosity, ρ p is the particle density, C D is the drag coefficient, R e p is the relative Reynold number, and g is the gravity vector [34].

3.2.4. Devolatilization Model

After the drying process, devolatilization occurs at around 200–300 °C. The constant rate model, as used by Backreedy et al. (2004) [35], is applied to predict the volatile yield rate during this phase. This model assumes that volatiles are released at a constant rate, which is mathematically represented by Equation (5). By using this model, the number of volatiles generated during devolatilization can be accurately predicted, providing essential insights into the behavior of the material under thermal decomposition conditions
1 f v , 0 1 f w , 0 m P , 0 d m P d t = A 0
where f v , 0 is the fraction of volatile initially present in the particle, m P , 0 is the initial particle mass, and A 0 is the rate constant (default value is 50 s−1, 20 s−1 for coal and biomass, respectively).

3.2.5. Combustion Model

The combustion model consists of two essential processes: volatile combustion and char oxidation. During the volatilization process, the volatile components within the fuel particle are released into the surrounding environment. These volatile gases mix with air and are combusted. For this work, the eddy dissipation model (EDM) was utilized to predict homogeneous reactions, accounting for chemical turbulence interactions, as described by Suksam et al. (2019) [36] and Laphirattanakul et al. (2020) [33]. Additionally, a two-step global reaction mechanism was adopted for gas phase combustion.
The char combustion process begins once the volatile components of the particles are fully released. This reaction occurs at the particle’s surface, consuming its combustible fraction until it is entirely depleted, as detailed by Backreedy et al. (2004) [35]. The process was evaluated using the diffusion-limited surface reaction rate model, according to Laphirattanakul et al. (2020) [33]. In this model, char is assumed to oxidize to carbon monoxide through a one-step heterogeneous surface reaction.

3.2.6. Radiation Mode

A radiation model was used to evaluate radiative heat transfer in the combustion chamber. The Discrete Ordinate Method (DOM), as described by Fernando (2005) [37], was employed alongside the absorption coefficient weight-sum-of-gray-gas model (WSGGM) to calculate the radiative heat transfer of the gas mixture within the domain.

3.2.7. NOx Model

The nitric oxide (NOx) model consists of NOx formation from thermal NOx, prompt NOx, and fuel NOx. Thermal NOx is formed by the oxidation of nitrogen in the air during combustion at relatively high temperatures. The formation of thermal NOx is determined by the extended Zeldovich mechanism [3]. Fuel NOx is formed by a reaction with the nitrogen content in the fuel. The nitrogen in the fuel is usually released as HCN and NH3, accompanied by a volatile release that is eventually either oxidized to NO or reduced to N2. In this work, it is assumed that the nitrogen contained in the char is directly converted to NO, since the conversion mechanisms are complex [3]. Lastly, prompt NOx, which is formed between OH radicals and nitrogen molecules near the flame, was also considered.

3.2.8. SOx Model

The calculation of SO2 formation begins from the fundamental theory of mass conservation, where the sulfur component in the fuel is entirely converted to SO2. The effect of residence time in SOx mechanisms, a Lagrangian reference frame concept, is included through the convection terms in the governing equations written in the Eulerian reference frame [38].

4. Experiment Results

From the combustion testing of coal and biomass in a 500 kW pulverized fuel burner with two combustion chambers, the measurement data from the experiments, as shown in 
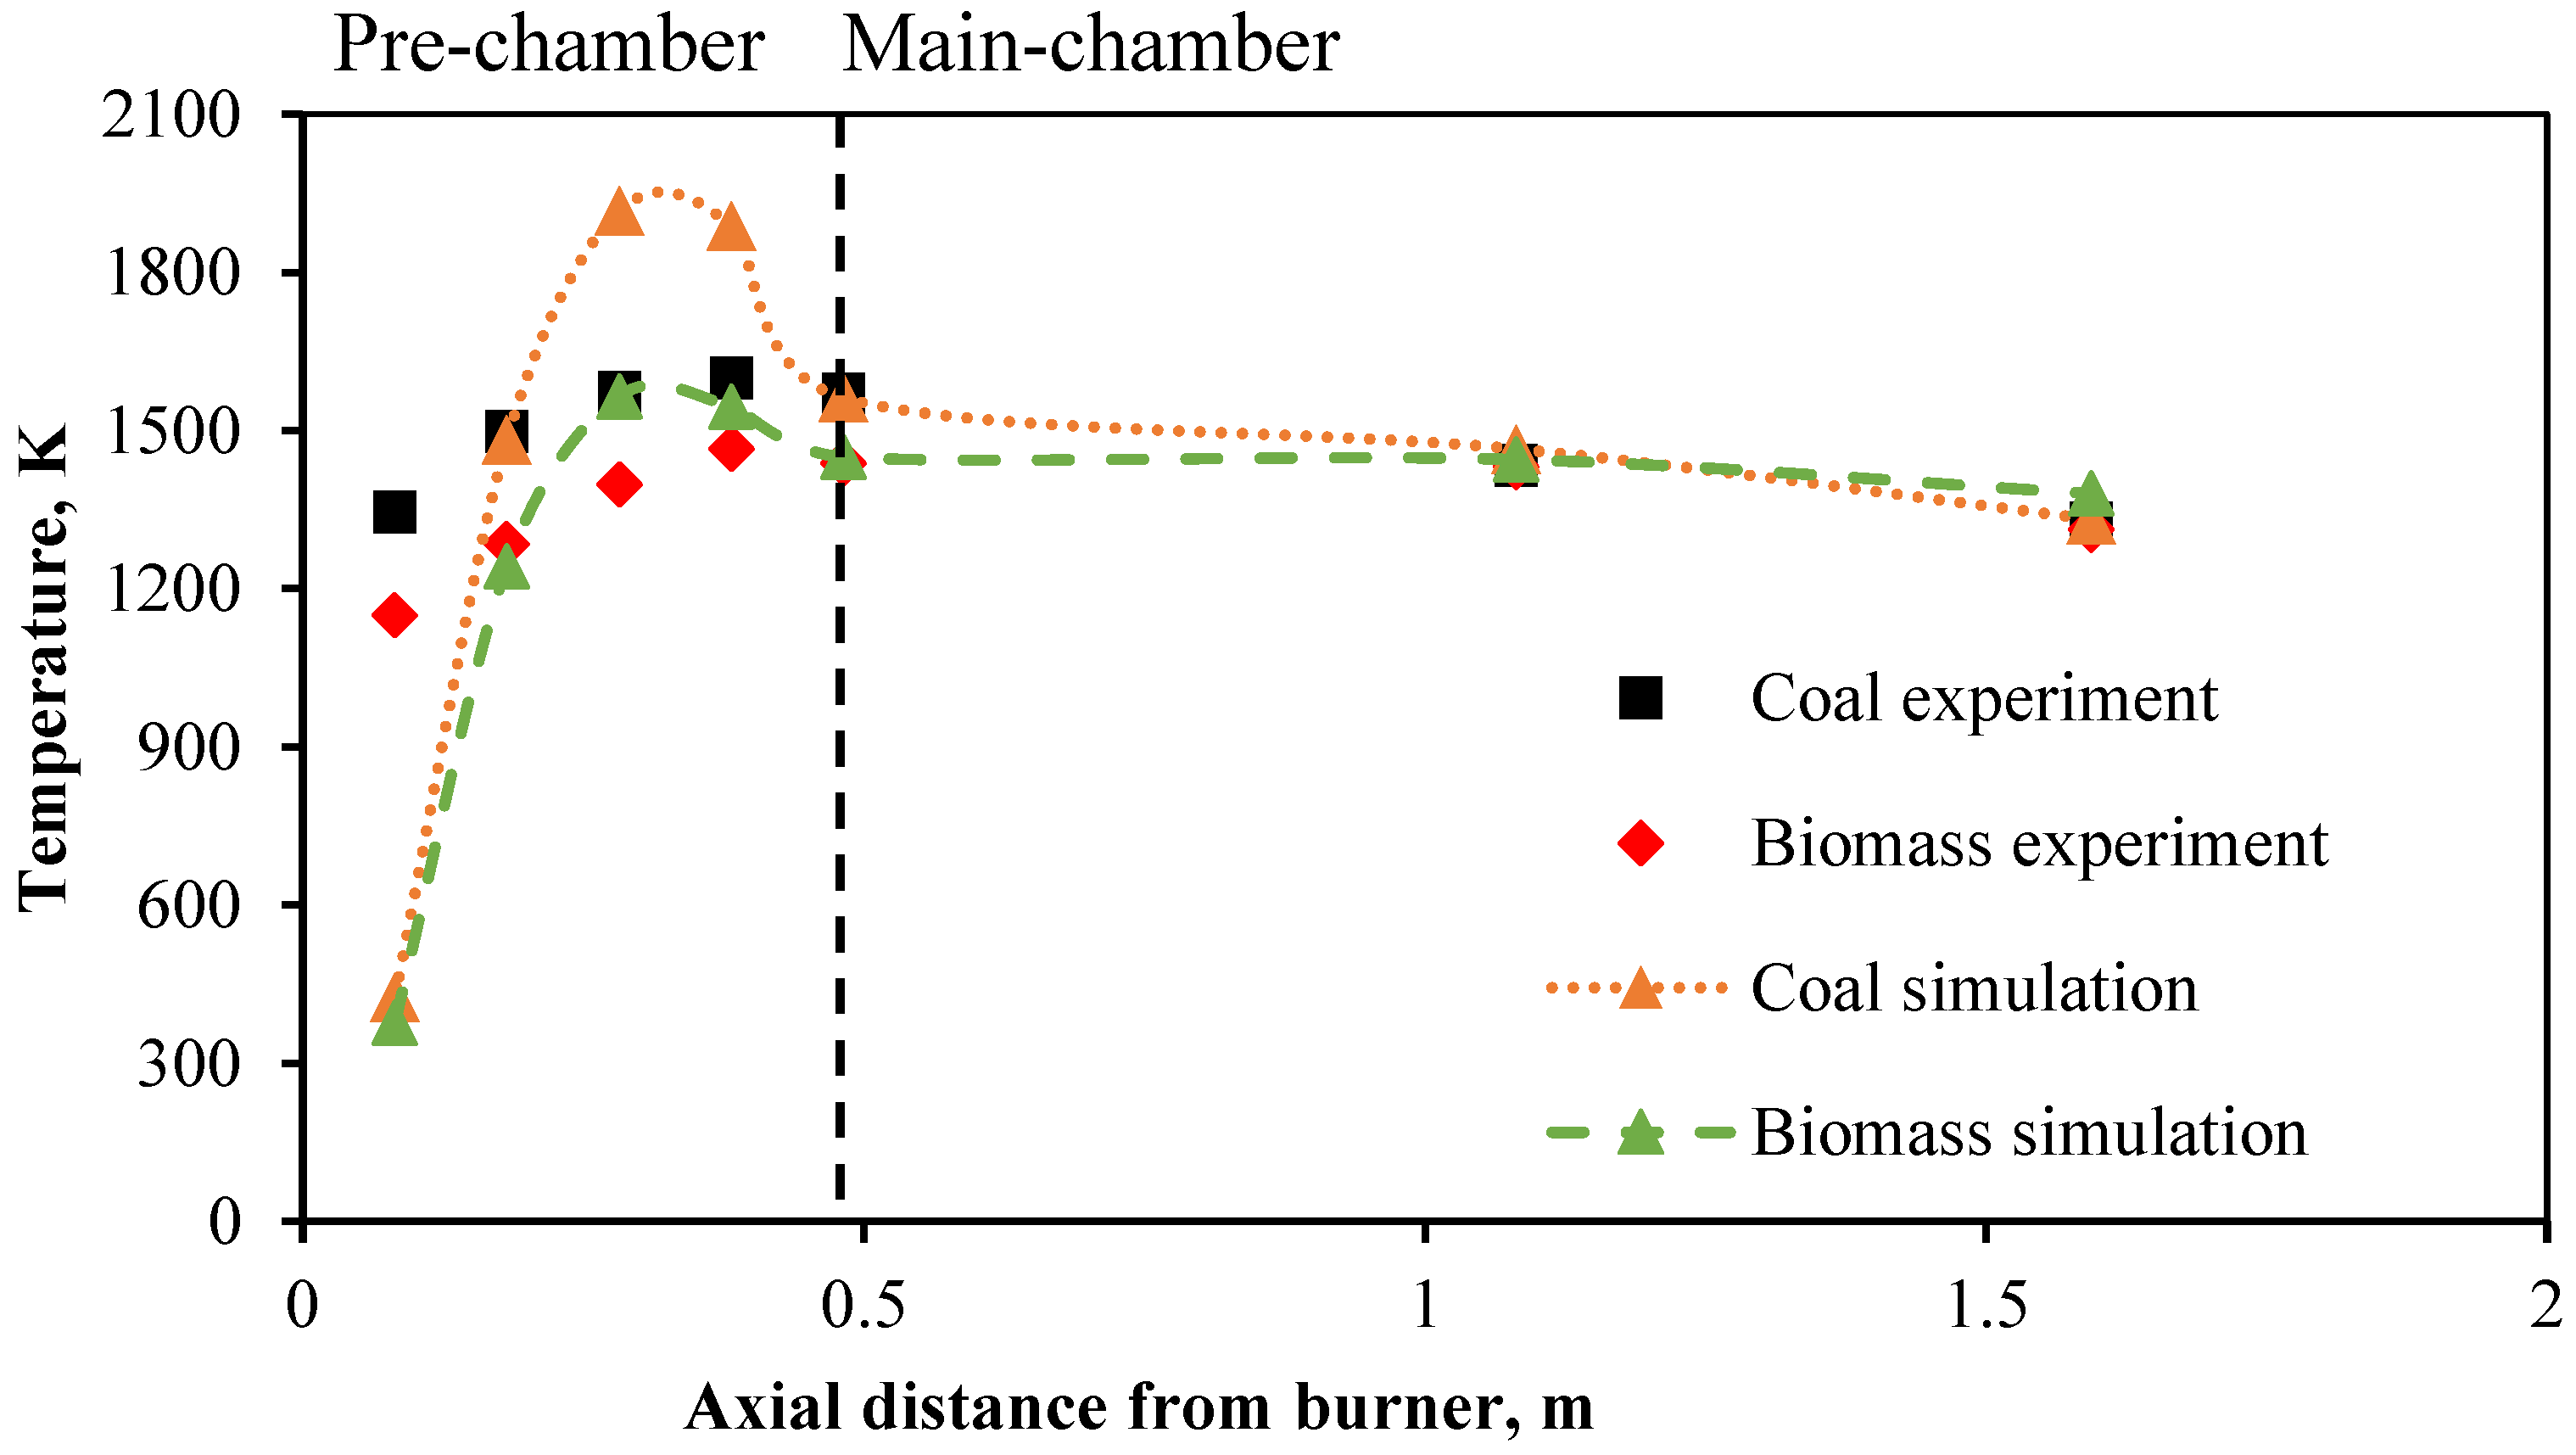
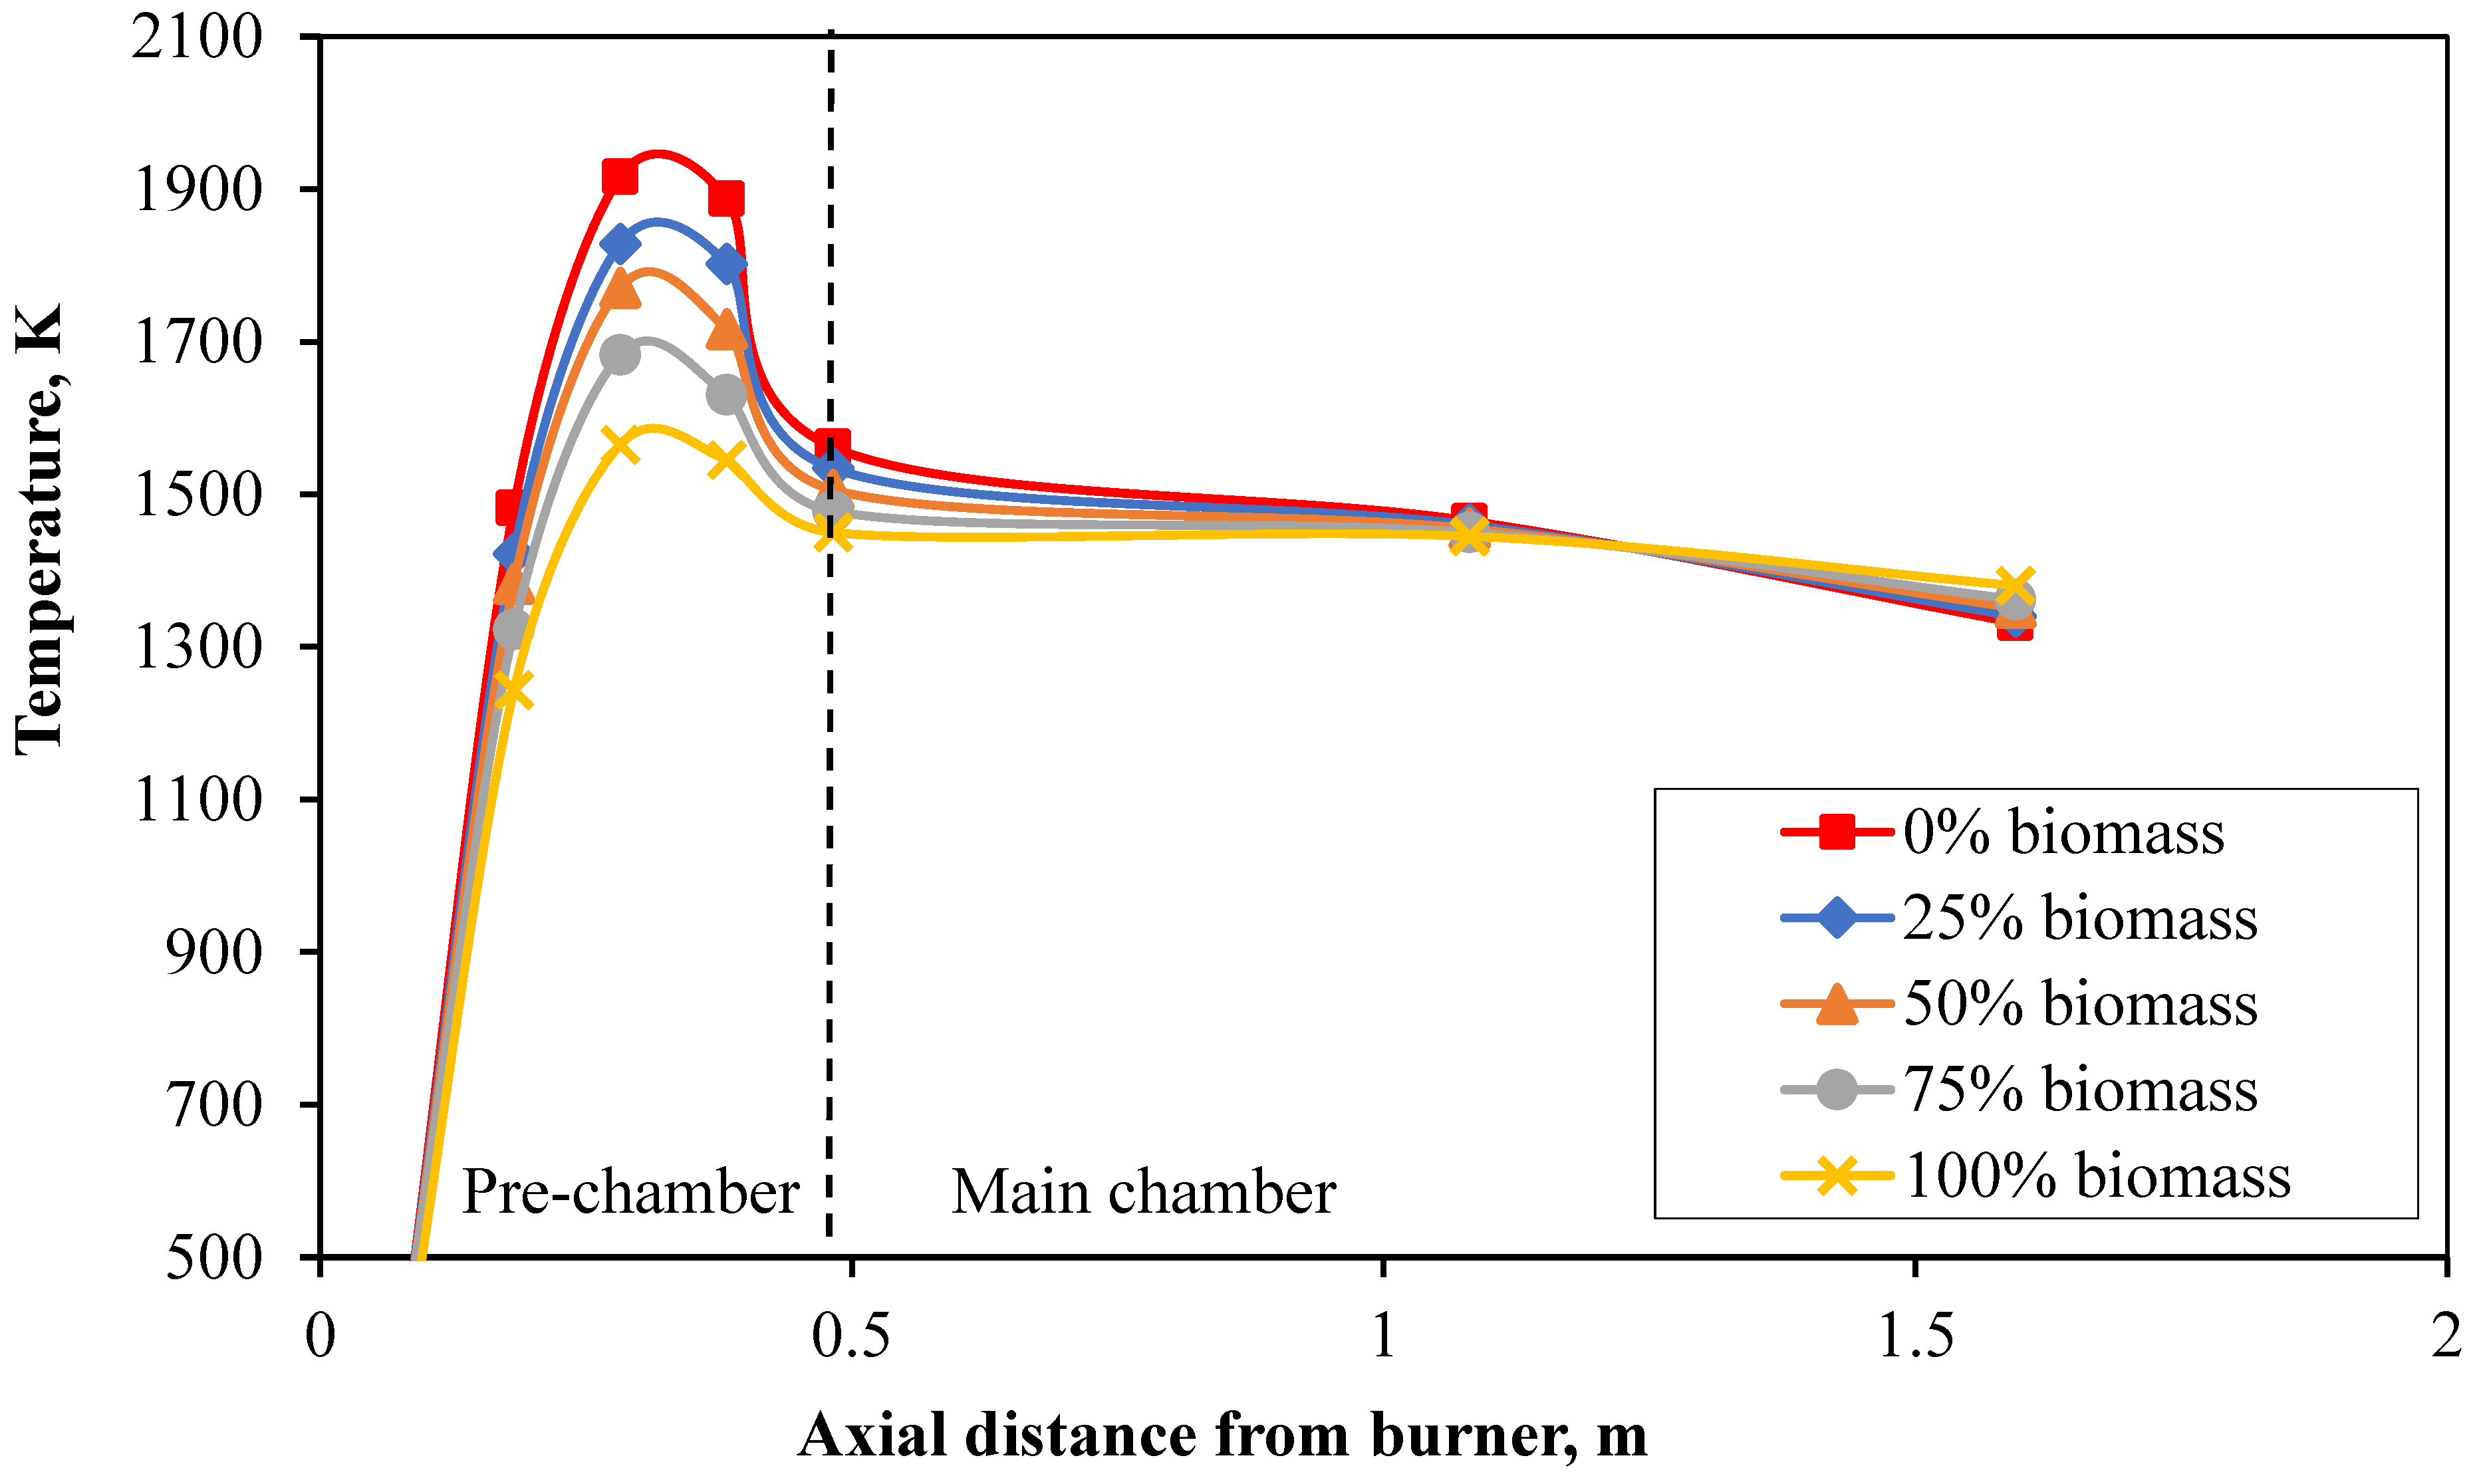
Table 2, indicate that the temperature profiles inside the combustion chamber, illustrated in Figure 5, exhibit similar behavior.
The temperature increases notably in the pre-chamber area, with pulverized coal heating up faster, reaching a maximum temperature of 1600 K compared to biomass at 1465 K upon entering the main chamber. Both temperatures decrease slightly as they exit the combustion chamber, reaching final temperatures of 1323 K for coal and 1312 K for biomass. This shows that their temperatures are closely aligned, unlike the initial stages where there was a significant difference. This is because biomass has slower combustion due to larger fuel particle size and lower devolatilization rate. However, by the end of the combustion process, sufficient time allows the temperatures to converge. The average combustion temperatures are 1478 K for pure coal and 1353 K for pure biomass. In summary, coal burns at an average temperature 9.1% higher than biomass.
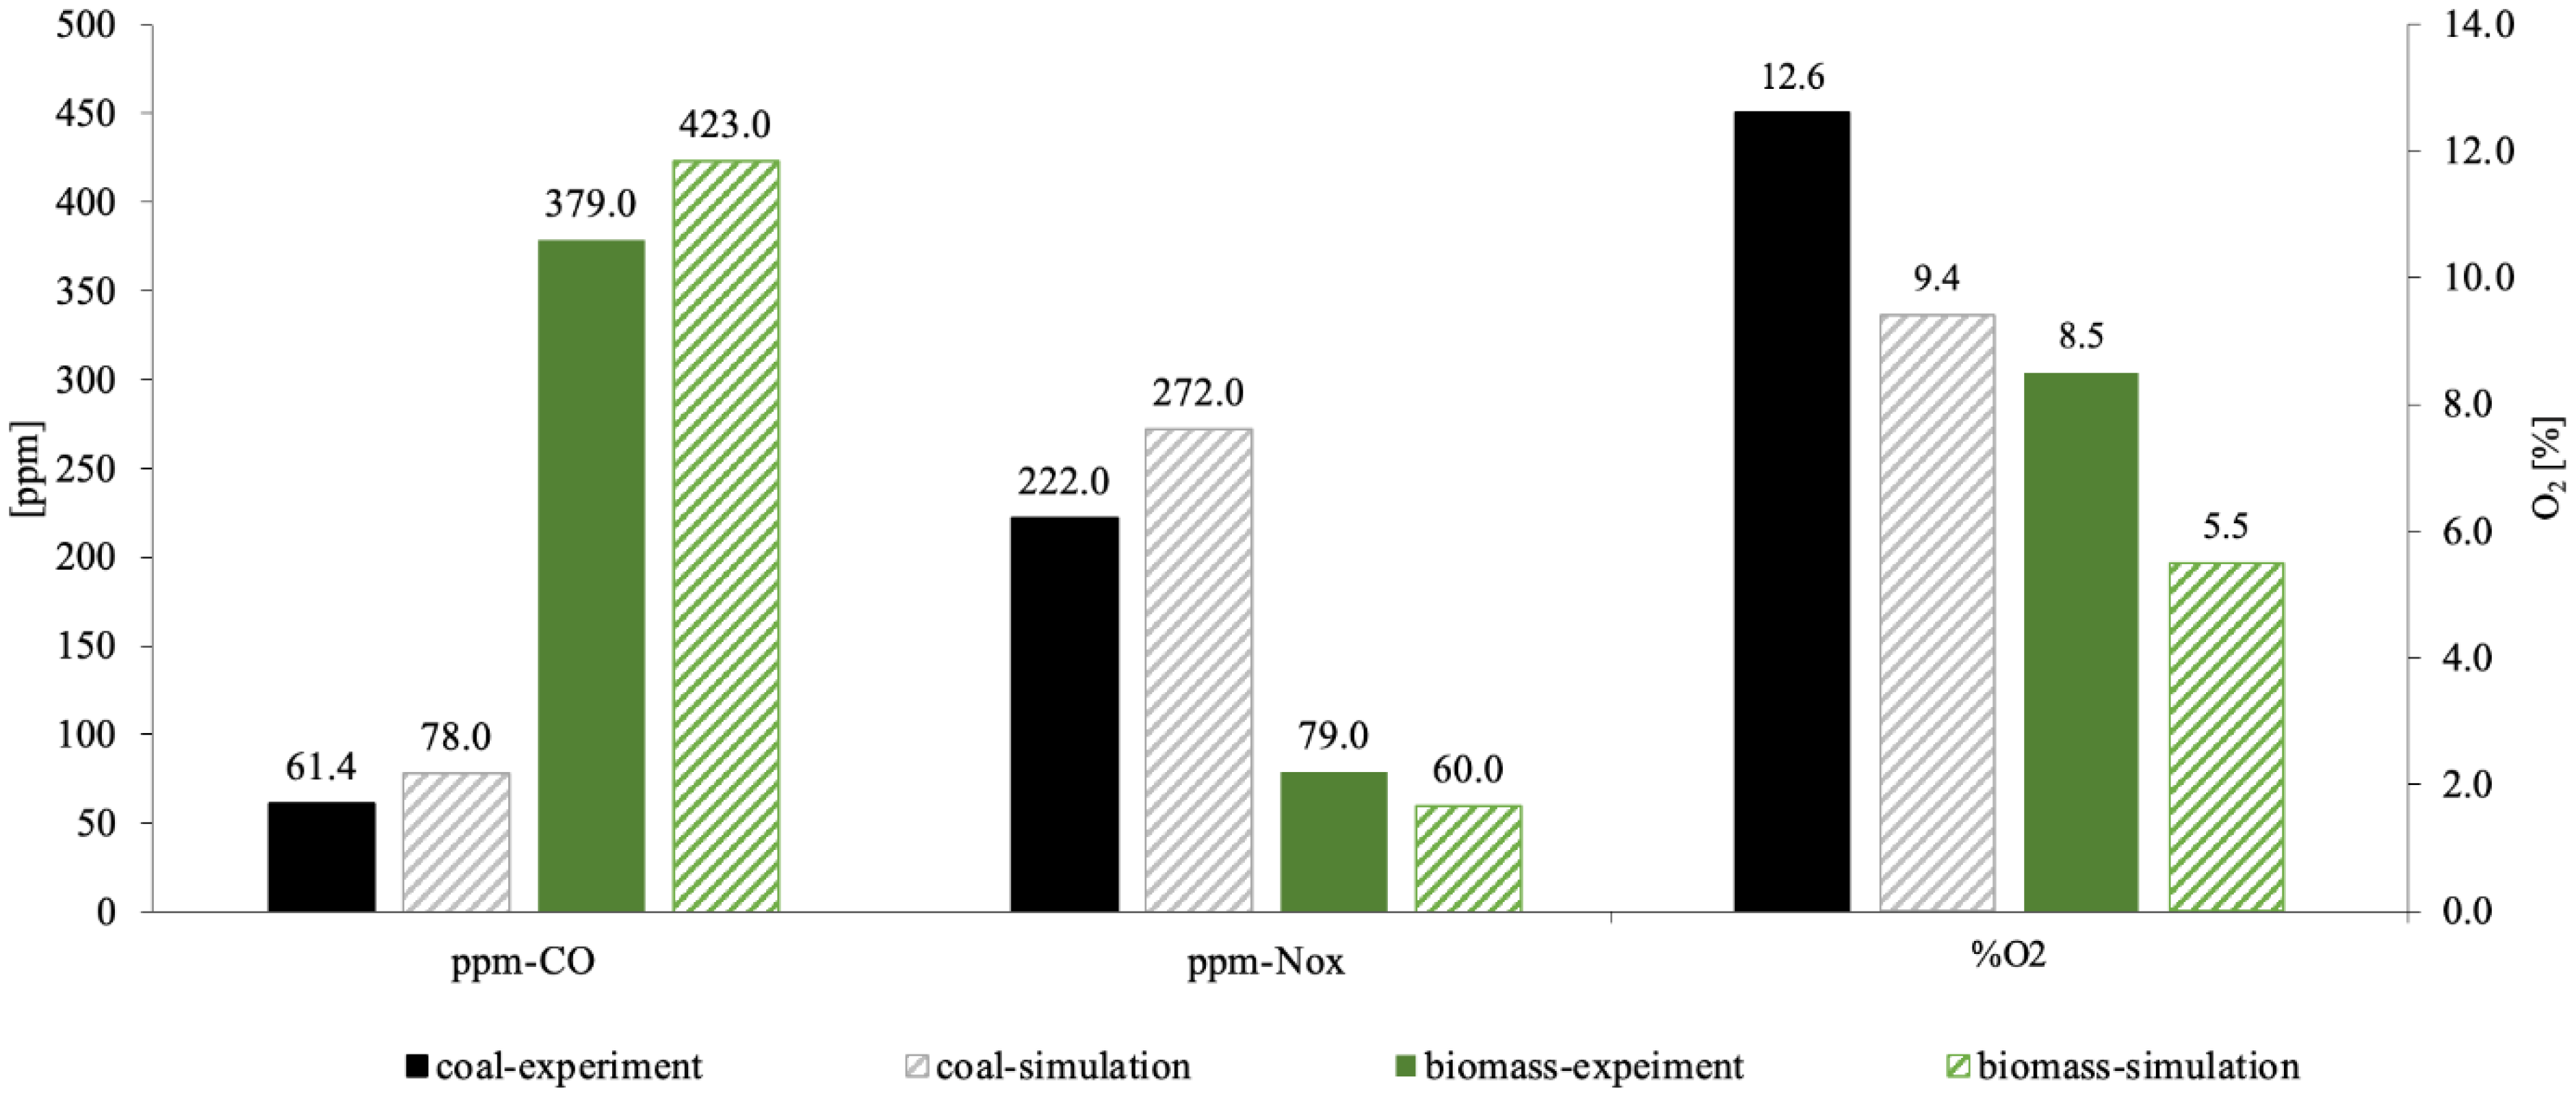
The experiment involved measuring the concentration of exhaust components, as shown in Table 2 and Figure 6. Combustion tests revealed that the carbon dioxide concentration at the outlet was 61.4 ppm for coal, compared to 379.0 ppm for pure biomass, an increase of more than 5.2 times, as illustrated in Figure 6. Additionally, it was found that NOx emissions were 221.9 ppm from burning coal and 79 ppm from biomass, indicating an increase of more than 1.8 times. Oxygen is critically important in combustion processes. In the initial testing, the air-to-fuel ratio was set at an equivalence ratio of 1.1. As the combustion process progressed, the oxygen concentration at the outlet of the combustion furnace was 8.5%vol for biomass and 12.6%vol for coal, which is less by 32%. The reasons for this behavior will be discussed in the Section 7.

5. Model Validation

In the construction of the model used to study the combustion behavior between coal and biomass, basic data from tests in a 500 kW heat input pulverized fuel combustion furnace for coal and biomass were utilized. The model was set under the same conditions as the tests outlined in Table 3 (100% coal and 100% biomass). The temperature distribution within the combustion furnace and the composition of exhaust gases closely resembled the test results as depicted in Table 2, Figure 5 and Figure 6, respectively.
The significance of temperature positions Temp 3 and Temp 4, which exhibited higher temperatures compared to both coal and biomass experiments in pre-chamber, is noteworthy due to their influence on the combustion calculations conducted via the eddy dissipation model. The intensity of reactions depends on the turbulence of the flow, with significant turbulence occurring within the combustion chamber due to swirling induced by the swirler, resulting in vigorous combustion. However, when considering the combustion trends alongside the exhaust gas composition in Figure 6, these results are deemed acceptable.
Table 3. The boundary conditions in each case of biomass fraction mixing with coal.
ConditionsBiomass Substitutions, %Thermal Basis
0255075100
Primary air mass flow (kg/s)0.0180
Secondary air mass flow (kg/s)0.12650.13210.13760.14310.1487
Primary area inlet (cm2)21.45
Secondary area inlet (cm2)148.00
Swirl number 1
Air temperature (K)313
% Excess air10
Coal mass flow rate (kg/s)0.02130.01600.01070.00530
Biomass mass flow rate (kg/s)00.00710.01420.02140.0285

6. Parametric Study

This study aims to understand the combustion mechanisms between coal and biomass with different fuel compositions. Five biomass proportions were adjusted: 0%, 25%, 50%, 75%, and 100% on a thermal basis, as shown in Table 3, with fuel compositions detailed in Table 1 and fuel sizes determined by Equation (1) All conditions maintained a consistent heat input of 500 kW in a dual-chamber powdered fuel burner with 10% excess air and a swirl number of 1 to investigate temperature distribution within the furnace and emissions released from combustion.

7. Result and Discussion

7.1. Temperature Distribution

The effect of biomass thermal share reveals that an increase in the proportion of biomass fuel results in a decrease in the average temperature of the combustion furnace as shown in Figure 7. Although biomass has a higher volatile content compared to coal, it does not lead to a higher furnace temperature than coal combustion. This is due to biomass fuel having a lower calorific value than coal and a higher specific heat capacity as shown in Figure 8.

7.2. Unburn Char Released

Increasing the proportion of thermal shearing results in a lower amount of unburned carbon (UBC), as shown in Figure 9, due to biomass containing nearly three times the amount of fixed carbon, which is lower than coal. However, when considering the percentage of fixed carbon burned in coal fuels, it was found to be higher than for biomass fuels; due to the combustion mechanism of biomass, a significant amount of time is required to evaporate the moisture and volatiles from the fuel particles first. This means that coal has a longer fixed carbon combustion time compared to biomass, resulting in a higher percentage of char conversion, as shown in Figure 10.

7.3. Species Concentration

The study using the model indicates the composition of exhaust gases from combustion, which includes carbon monoxide, carbon dioxide, and oxygen, as shown in Figure 11, along with the average combustion temperature and pollutants, including nitrogen oxide and sulfur dioxide, as shown in Figure 12.
The composition of CO and CO2 in exhaust gases serves as a crucial indicator of combustion efficiency, where complete combustion should result in the production of CO2 only, with no CO present. However, achieving a perfect fuel–air mixture in practice is challenging, making it difficult to completely avoid the formation of carbon monoxide. Studies have shown that when the proportion of biomass in the fuel is increased, both CO and CO2 tend to increase, with CO showing a greater rise. As illustrated in Figure 11, this behavior suggests that coal combustion is more efficient than biomass combustion, as indicated by the emission of CO and CO2 from coal combustion, measured at 78 ppm and 1.01 × 10⁵ ppm, respectively, compared to biomass combustion, which emits CO and CO2 at 423 ppm and 1.49 × 10⁵ ppm, respectively.
The main reasons for this phenomenon are twofold. Firstly, biomass has a significantly higher moisture content than coal. When this moisture is released from the fuel particles during combustion, it interferes with the proper mixing of fuel and oxidizer. Secondly, biomass contains a greater number of volatile compounds compared to coal. When these volatile compounds are released, they form areas with high concentrations of these volatiles, known as rich zones. These rich zones have a higher concentration of fuel, which leads to incomplete combustion and, subsequently, higher carbon dioxide emissions.
Studies have found that increasing the proportion of biomass may result in higher CO2 emissions. However, since plants are carbon neutral, having the ability to absorb CO2 during growth, biomass holds an advantage over coal, which directly increases CO2 in the atmosphere. Considering the Emission Index, a variable indicating pollutant emissions per unit of heat produced, coal emits CO2 at a level of 1.01 × 10⁵ ppm, equivalent to 148.8 gCO2/MWhth. Therefore, replacing coal with biomass could significantly reduce these emissions. Regarding the oxygen component in exhaust gases, an excess air equivalence ratio of 1.1 was initially supplied to ensure sufficient combustion.
Regarding the oxygen component in exhaust gases, an excess air equivalence ratio of 1.1 was initially supplied to ensure sufficient combustion. The results from modeling the excess air remaining after combustion at the furnace outlet indicate a decrease as the proportion of biomass in the fuel increases. This reduction occurs because, as the combustion process progresses, oxygen is consumed in the burning process, and some of it combines with carbon in the fuel to form carbon monoxide and carbon dioxide in greater proportions than in coal combustion. This results in a reduction in the oxygen concentration in the exhaust gases, measured as a percentage by volume (%vol).
The formation of NOx from combustion consists of three types: Thermal NOx, which occurs from combustion in high-temperature areas within a combustion environment containing nitrogen. This type of NOx is unavoidable if the furnace uses air with a high nitrogen content for combustion. Fuel NOx results from burning fuels that contain nitrogen, such as coal or biomass. Prompt NOx arises from chemical reactions between nitrogen in the air and hydrocarbons in the fuel during the initial stages of combustion. From Figure 12, it is observed that as the proportion of biomass in the fuel increases, NOx emissions tend to decrease significantly by reducing the emission levels by up to 4.5 times. The primary reasons for this disparity are twofold: first, the combustion temperature from coal burning is significantly higher, creating conditions more conducive to thermal NOx formation; second, coal contains a greater composition of nitrogen in its fuel composition compared to biomass, further contributing to elevated fuel NOx emissions in coal combustion processes.
Regarding sulfur dioxide emissions, Figure 12 indicates that the concentration of sulfur dioxide decreases as the proportion of biomass in the fuel increases; this can reduce emissions significantly, from 235 ppm to 0 ppm when coal is entirely replaced by biomass. This is because biomass contains significantly less sulfur compared to coal. This characteristic makes biomass a more advantageous option than coal in terms of reducing atmospheric pollution.

7.4. Heat of Combustion

When considering the heat produced from the combustion reaction, it was found to correlate with temperature. The trend shows that the amount of heat generated by combustion or the heat of a combustion reaction (including heat losses from the furnace walls) and the amount of heat at the exit of the combustion chamber or furnace heat output (excluding heat losses from the furnace walls) decreased as the thermal sharing fraction of biomass in fuel increased, as shown in Figure 13.
This led to a deterioration in combustion efficiency. It is noted that the combustion efficiency of pure coal is 87.7%, whereas the combustion efficiency of pure biomass is only 77.3%. Biomass’s high moisture content (10.8% for rubberwood) significantly affects combustion efficiency by requiring additional energy for moisture evaporation, which lowers the furnace temperature and combustion efficiency. Furthermore, higher moisture delays ignition and increases the time required to reach steady-state operation.
Specific thermal consumption (STC) is also an important parameter that reflects combustion behavior. It measures the amount of energy produced per unit of fuel consumed, offering insights into the efficiency of the combustion process. The equation for STC is given in Equation (6) as shown below:
S T C = q ˙ o u t p u t m ˙ f
where q ˙ o u t p u t is the rate of heat energy output (expressed in kW), m ˙ f is the fuel feed rate (expressed in kg/s). As shown in Figure 14, the specific thermal consumption (STC) for 100% coal combustion is observed to be 17,409. The STC value exhibits a downward trend as the proportion of biomass mixed with coal increases, reaching its lowest point of 11,500 for 100% biomass combustion. This trend occurs because coal has a higher calorific value and combustion efficiency compared to biomass, enabling it to produce more heat per unit of fuel. Consequently, as the proportion of biomass increases, the heat generated per unit of fuel decreases, resulting in a lower STC.

8. Concerns and Limitations

8.1. Slagging and Fouling

In biomass co-fired furnaces, attention should be given to the rates of slagging and fouling caused by biomass. These two issues in the long term can reduce system efficiency and may cause damage to the equipment. As mathematical simulations cannot replicate the occurrence of melting and fouling, experiments to measure the rates of these two variables within the furnace require an extended period of operation, posing significant challenges in laboratory settings. Generally, the occurrence characteristics are described using indices, namely the slagging index and the fouling index [39], which are reference values derived from the properties of alkaline matter and inorganic matter [40,41] present in the fuel. The slagging index criteria are generally divided into categories of <0.6, 0.6–2.0, 2.0–2.6, and >2.6, indicating whether the degree of occurrence is low, moderate, high, or very high, respectively. Similarly, the fouling index is divided into <0.6, 0.6–40, and >40, representing the degree of fouling as low, moderate, and high, respectively [42]. For the biomass used in co-firing with coal in this study, rubberwood from Thailand was used. The slagging index and fouling index are 2.07 and 356.28, respectively [43], which are considered very high compared to the widely used bituminous coal, which has slagging and fouling indices of 0.02 to 1.39 and less than 3.2, respectively [42].

8.2. Biomass Properties

Biomass, due to its diverse specific characteristics, differs significantly from coal, which has relatively uniform properties, necessitating careful consideration before its use in co-combustion with coal. Firstly, the higher moisture content in biomass compared to coal significantly reduces combustion efficiency, as part of the energy must be used to evaporate the moisture. Secondly, biomass has higher volatile matter and lower fixed carbon than coal, directly affecting the combustion characteristics behavior, burning rate, burnout time, and flame shape. Volatile matter in biomass burns much faster than fixed carbon, requiring adjustments in the combustion process when co-fired with coal. Improper control of volatile matter combustion can lead to fuel-rich zones, resulting in incomplete combustion and carbon monoxide production. Furthermore, although biomass contains less ash than coal, the ash from biomass is stickier due to essential minerals that plants use for growth, which can lead to increased accumulation of fly ash and potential operational challenges. One of the most critical challenges in co-firing biomass with coal in pulverized firing technology is the difficulty in grinding biomass into small particles due to its fibrous structure. This structure makes fine grinding require high energy consumption, and finely ground biomass particles, due to their sharp and non-spherical nature, can easily obstruct conveying systems. Lastly, while biomass is a renewable fuel, its life cycle is long, making it challenging to supply large-scale industries, particularly in the energy sector. This challenge is compounded when large quantities of uniform biomass are required, necessitating the use of various biomass types, which directly impacts the aforementioned issues. Therefore, the unique properties of biomass, such as higher moisture content, higher volatile matter, and fibrous structure, pose significant challenges for its co-combustion with coal, requiring proper management and combustion adjustments to achieve efficient and environmentally friendly energy production.

9. Conclusions

The combustion of pulverized coal and biomass co-firing at 500 kW thermal throughput with 10% excess air revealed several key effects of increasing the thermal fraction of biomass in fuel. Through a combination of modeling and experimental testing, it was determined that increasing the proportion of thermal shearing of biomass in the fuel influences various aspects of combustion behavior, as summarized below.
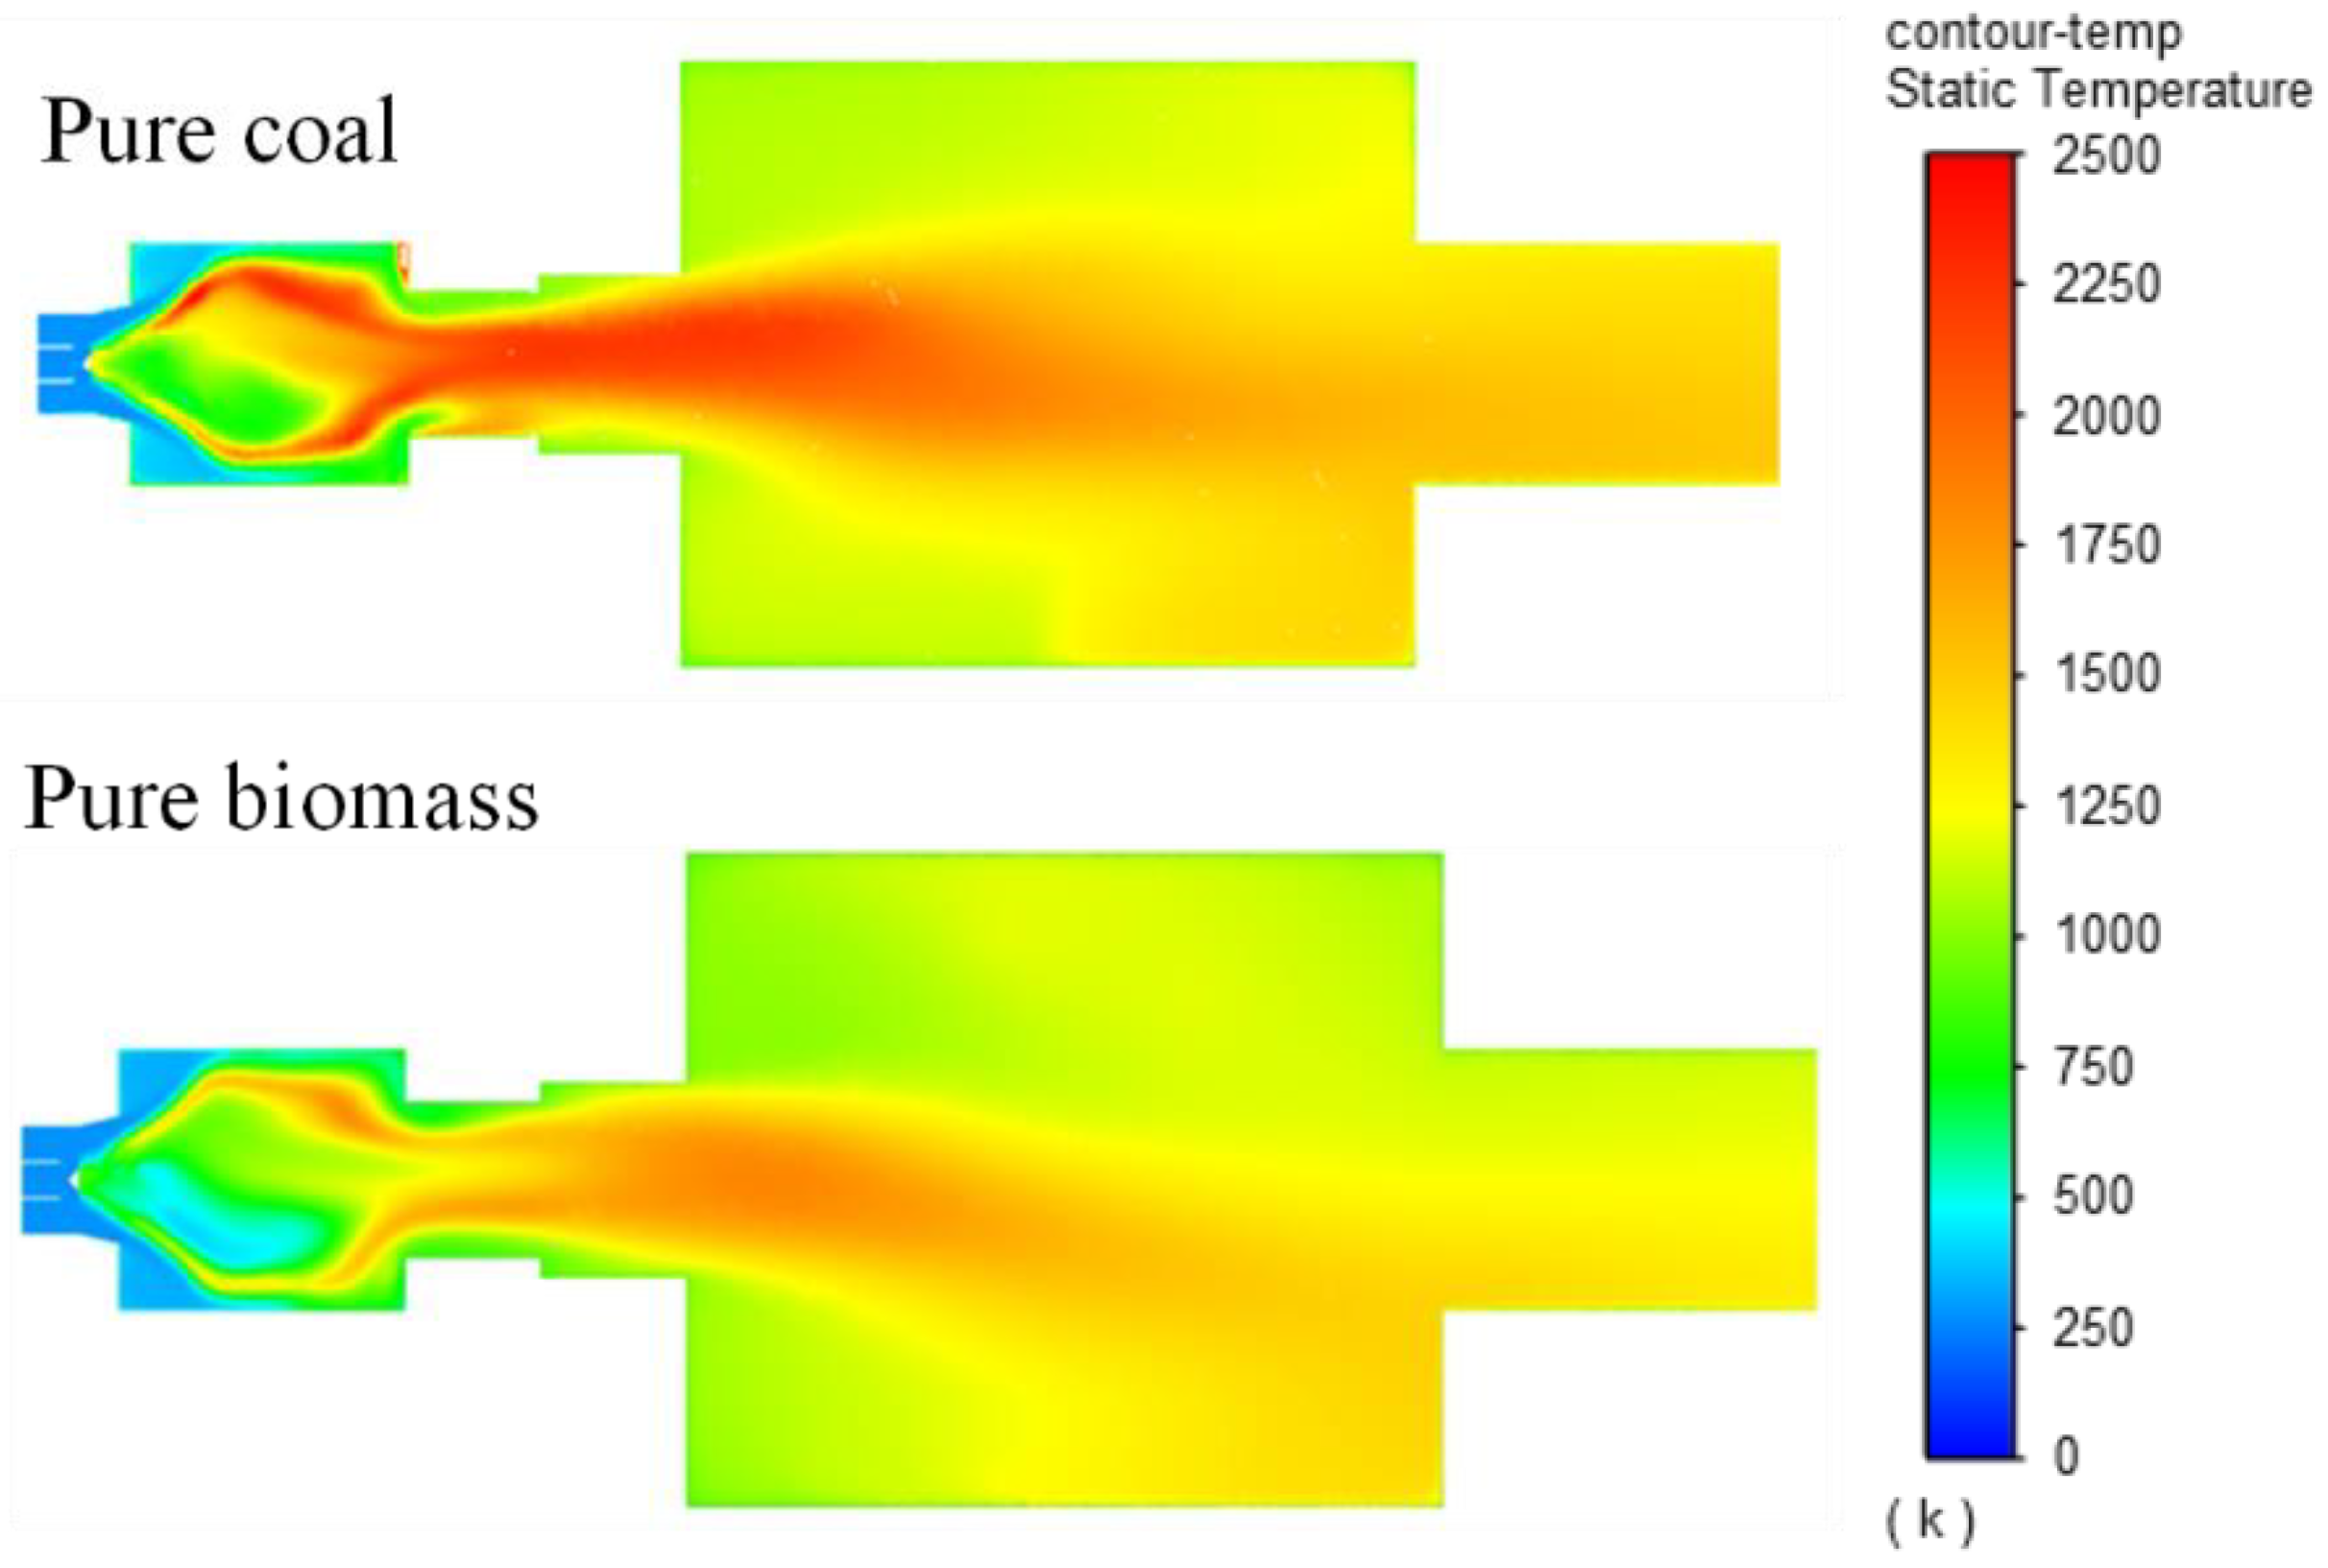
Model Validation and Combustion Behavior: The 3D CFD model of co-firing pulverized coal and biomass aligns well with the experimental data, demonstrating accurate predictions of combustion behavior and exhaust gas composition. Some discrepancies in temperature distribution were noted, but overall results were satisfactory.
Temperature and Emissions Trends: Increasing the biomass proportion from 0% to 100% significantly lowers the average combustion temperature from 1438 K to 1289 K. This reduction is due to biomass’s higher moisture content and lower heating value. Concurrently, NOx emissions decrease by up to 77.9% and SO2 emissions drop to zero with higher biomass content.
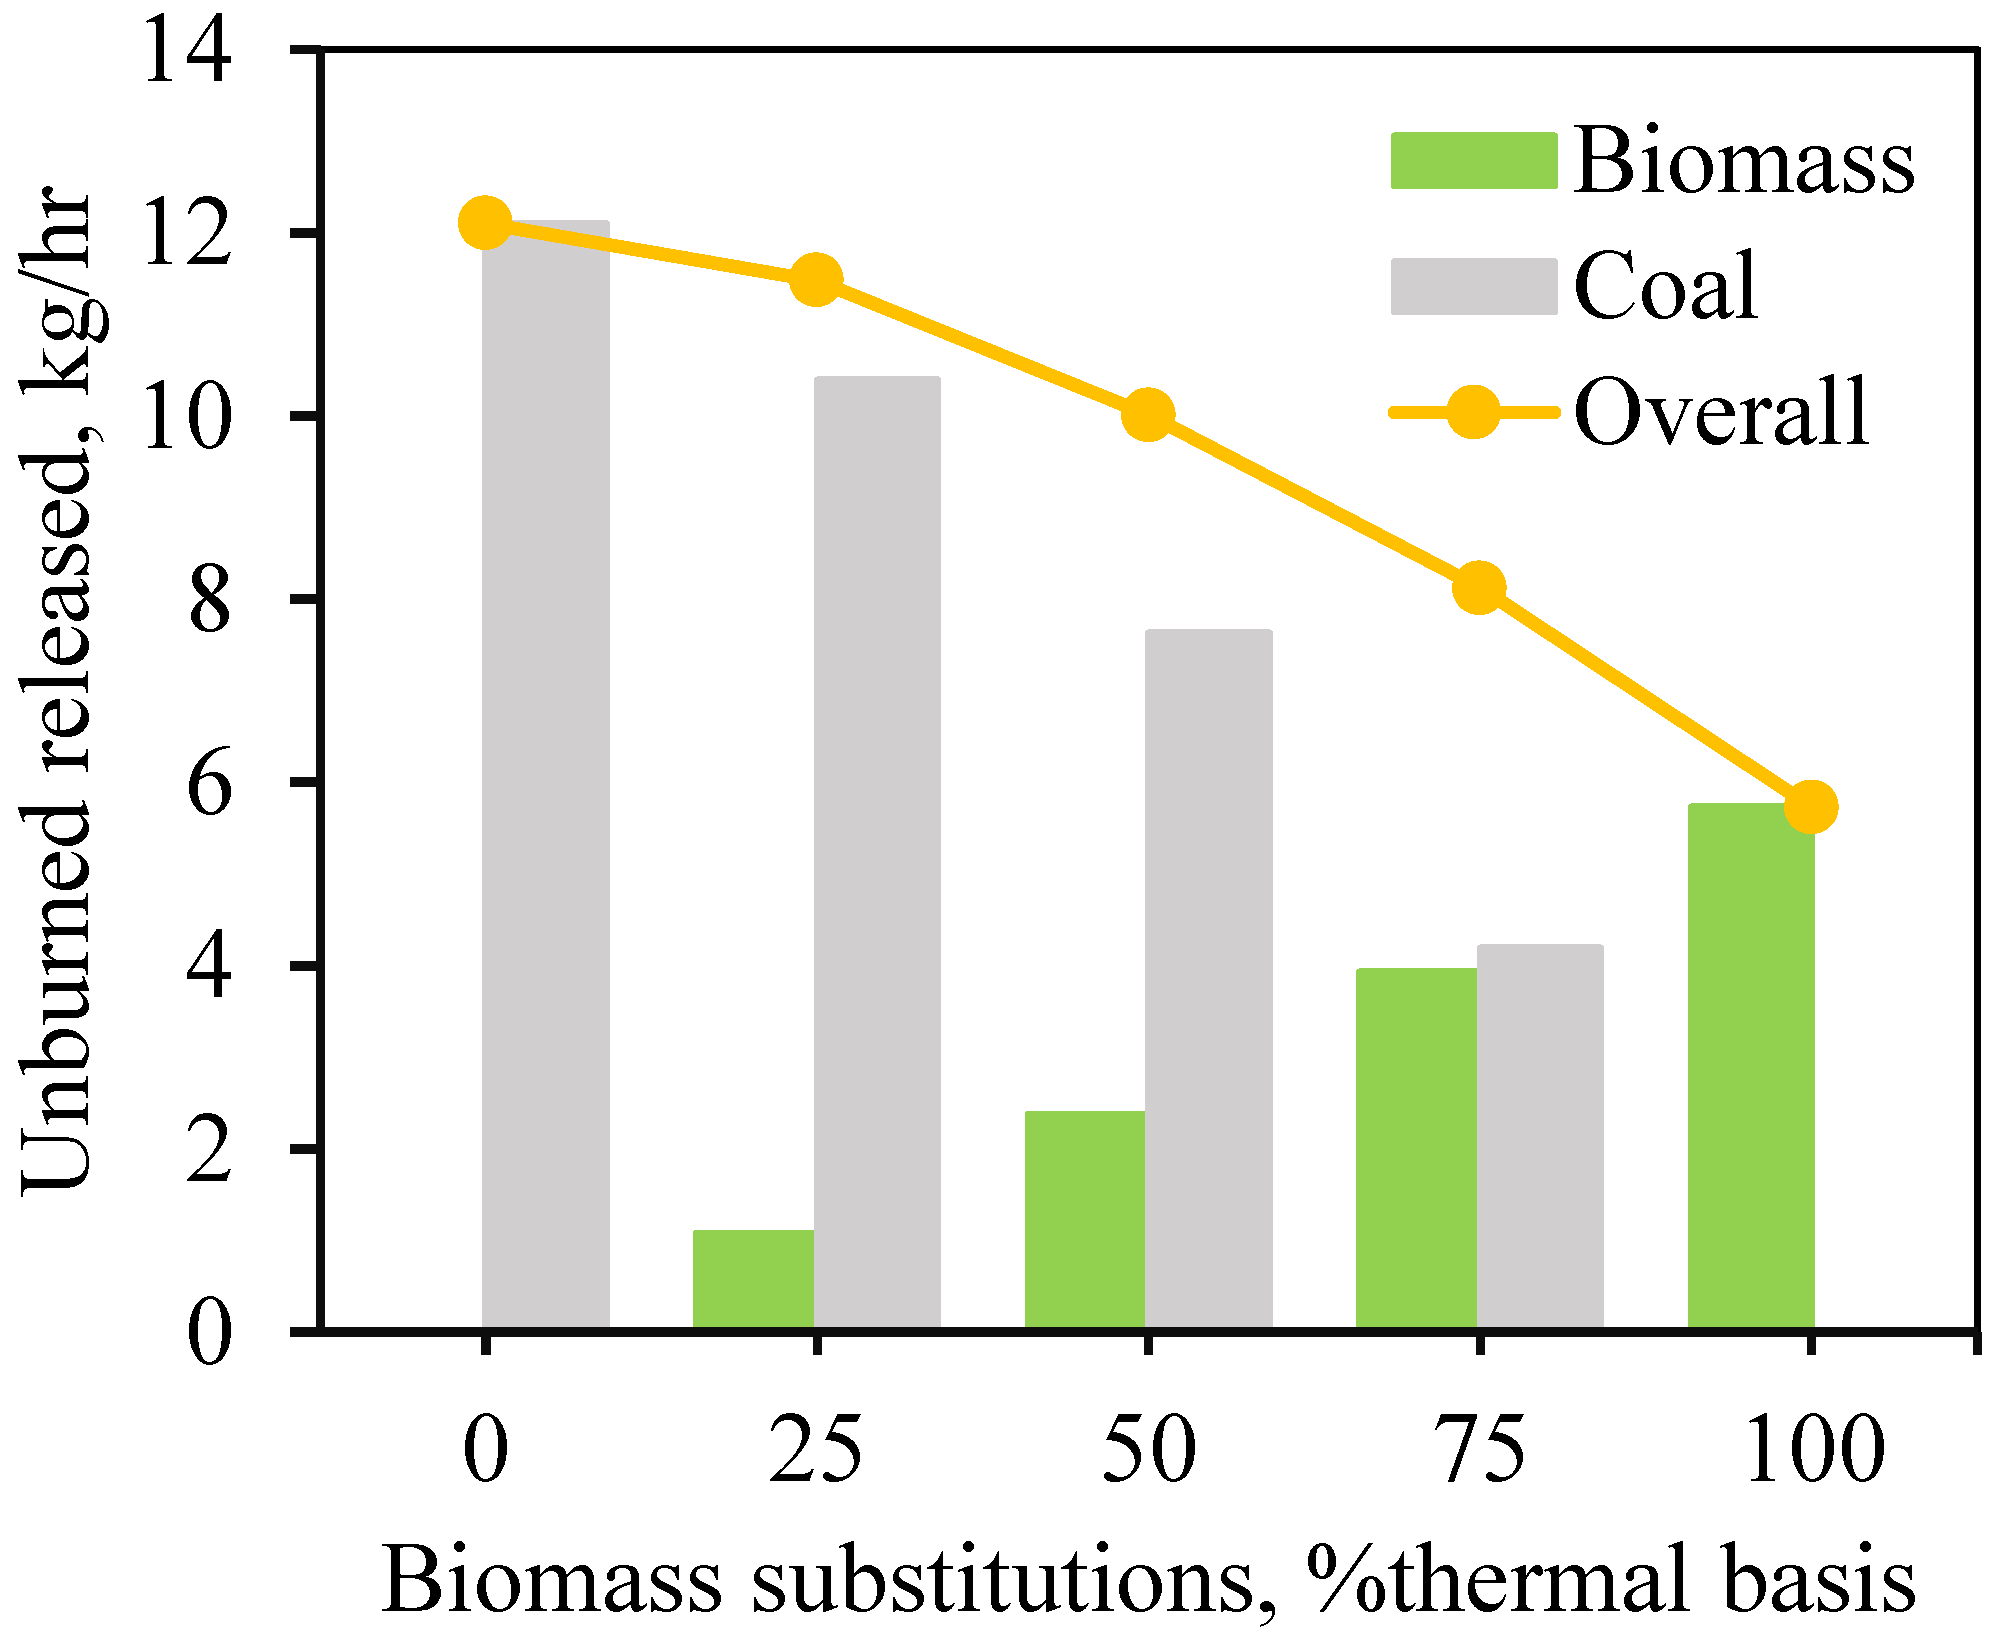
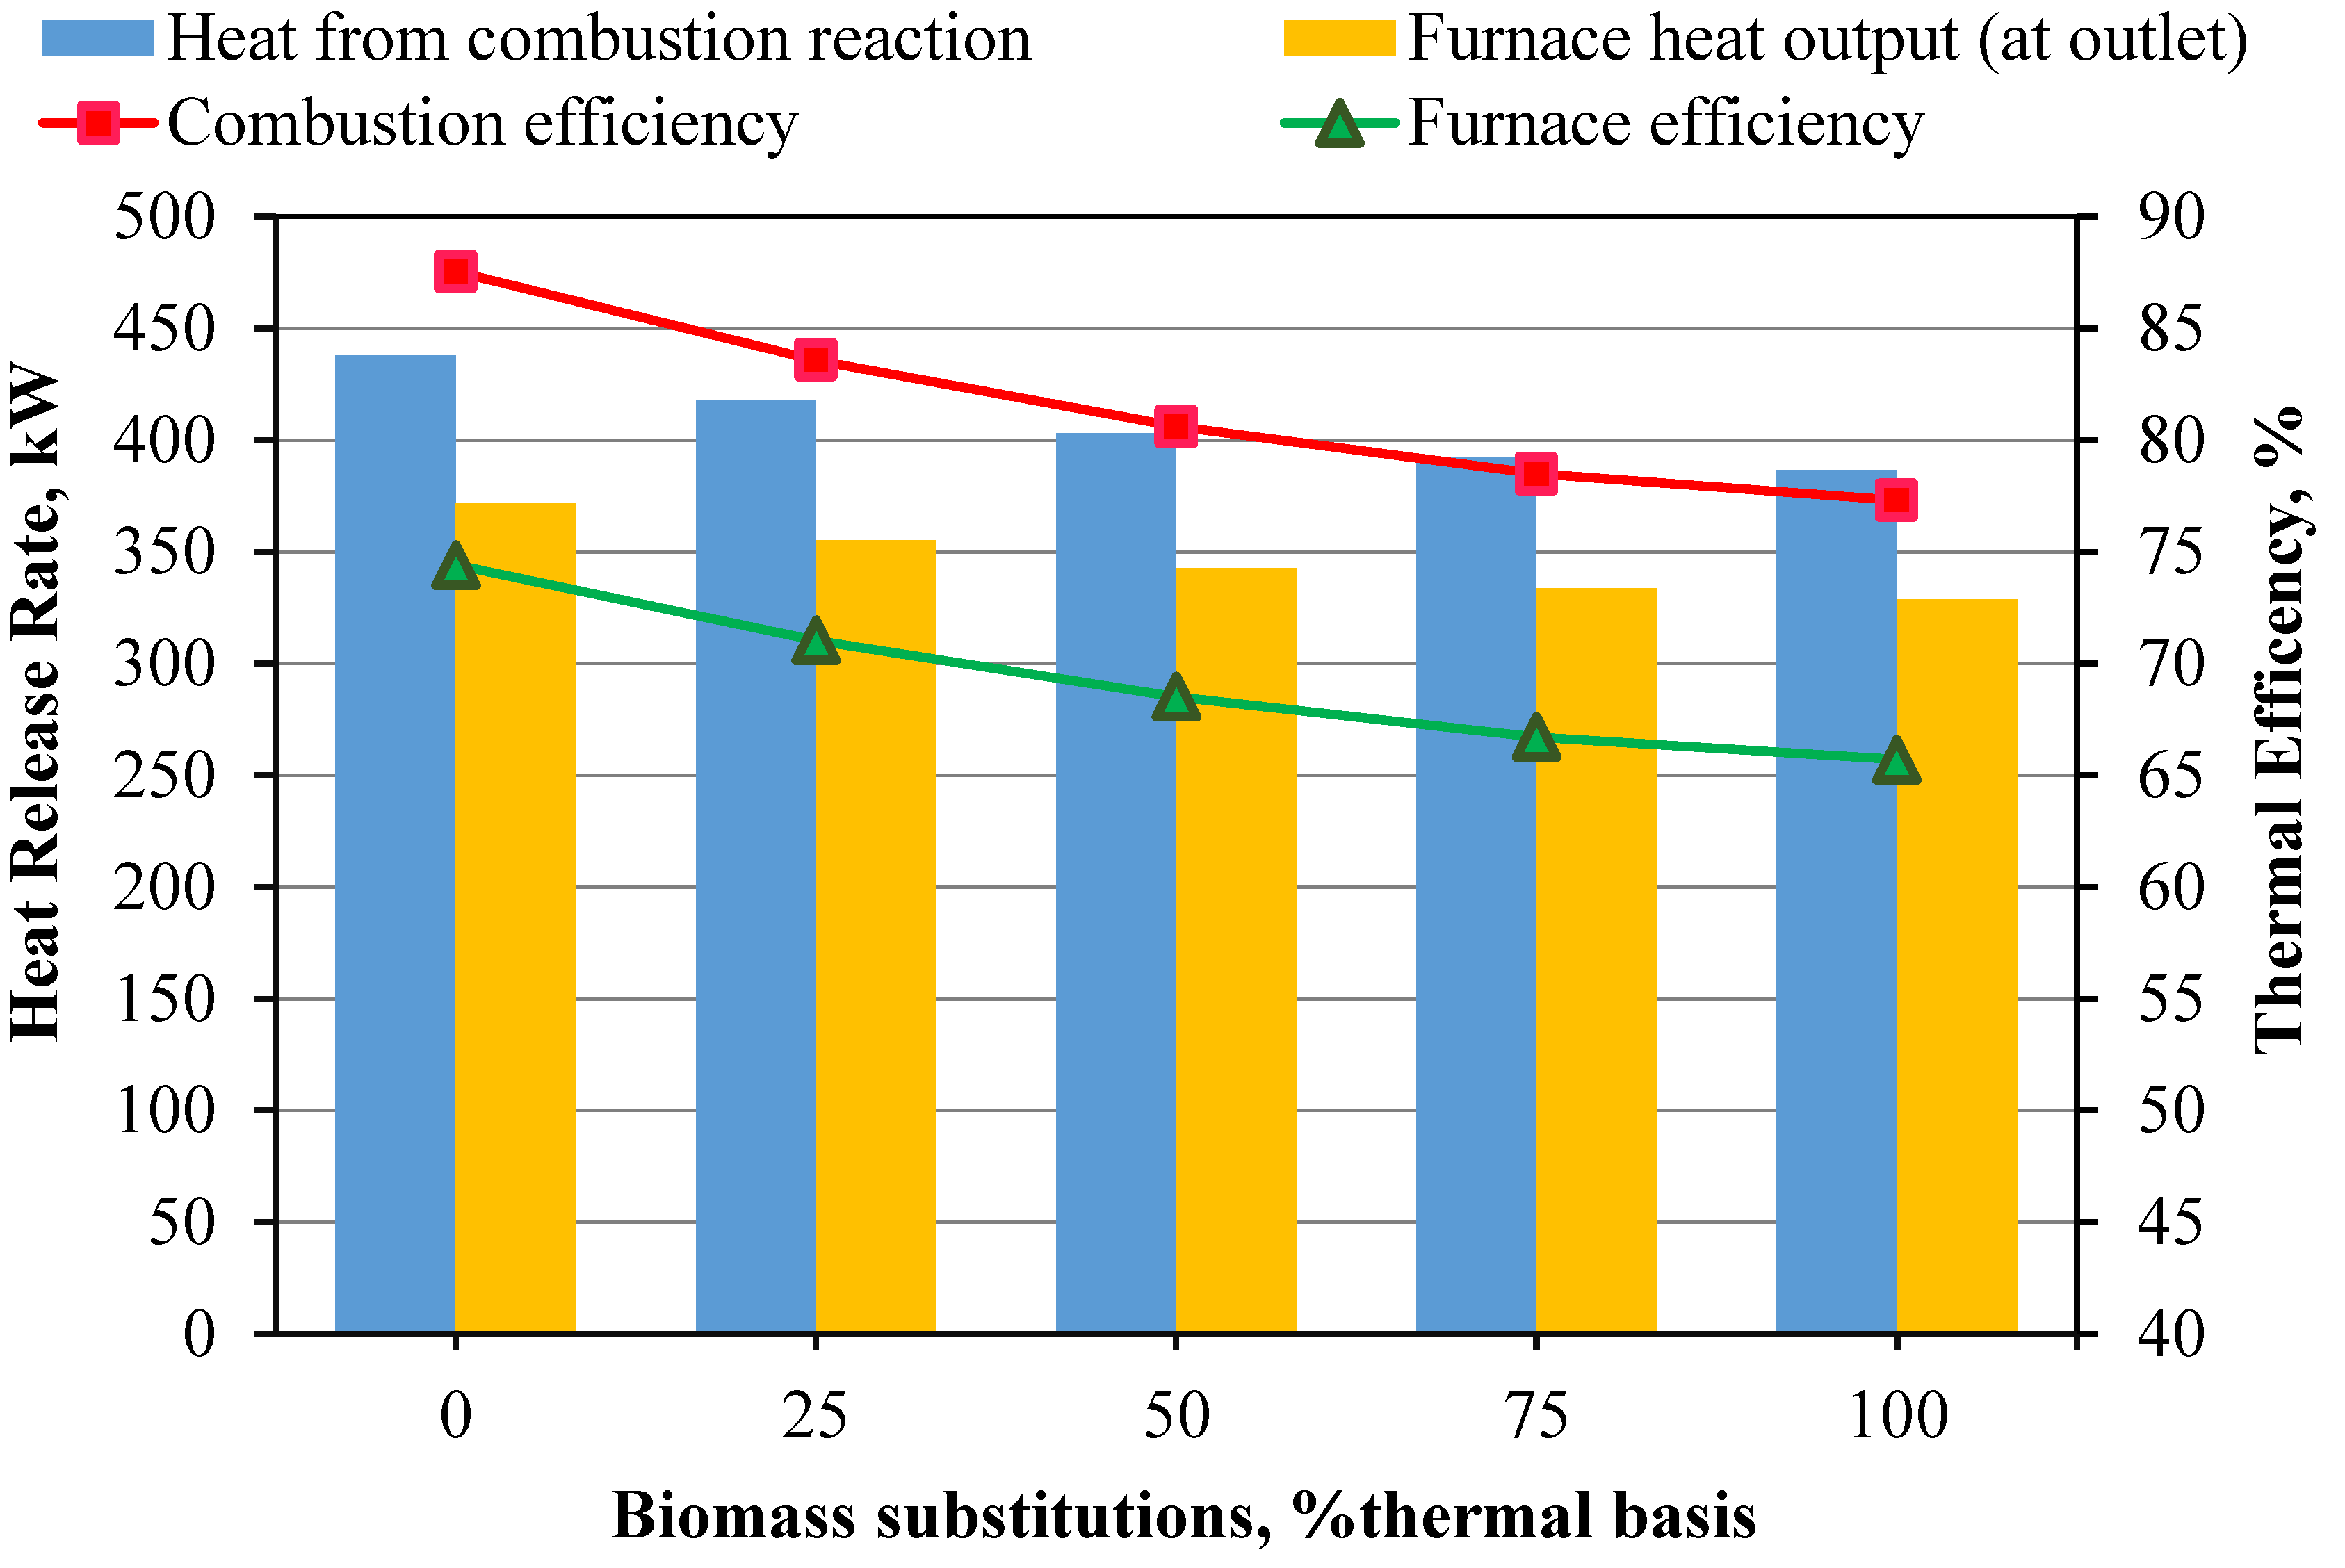
Combustion Completeness and Efficiency: The completeness of combustion declines as biomass content increases, evidenced by higher CO and CO2 emissions. The combustion efficiency decreases from 87.7% with coal to 77.3% with biomass, due to larger biomass particle size and incomplete combustion.
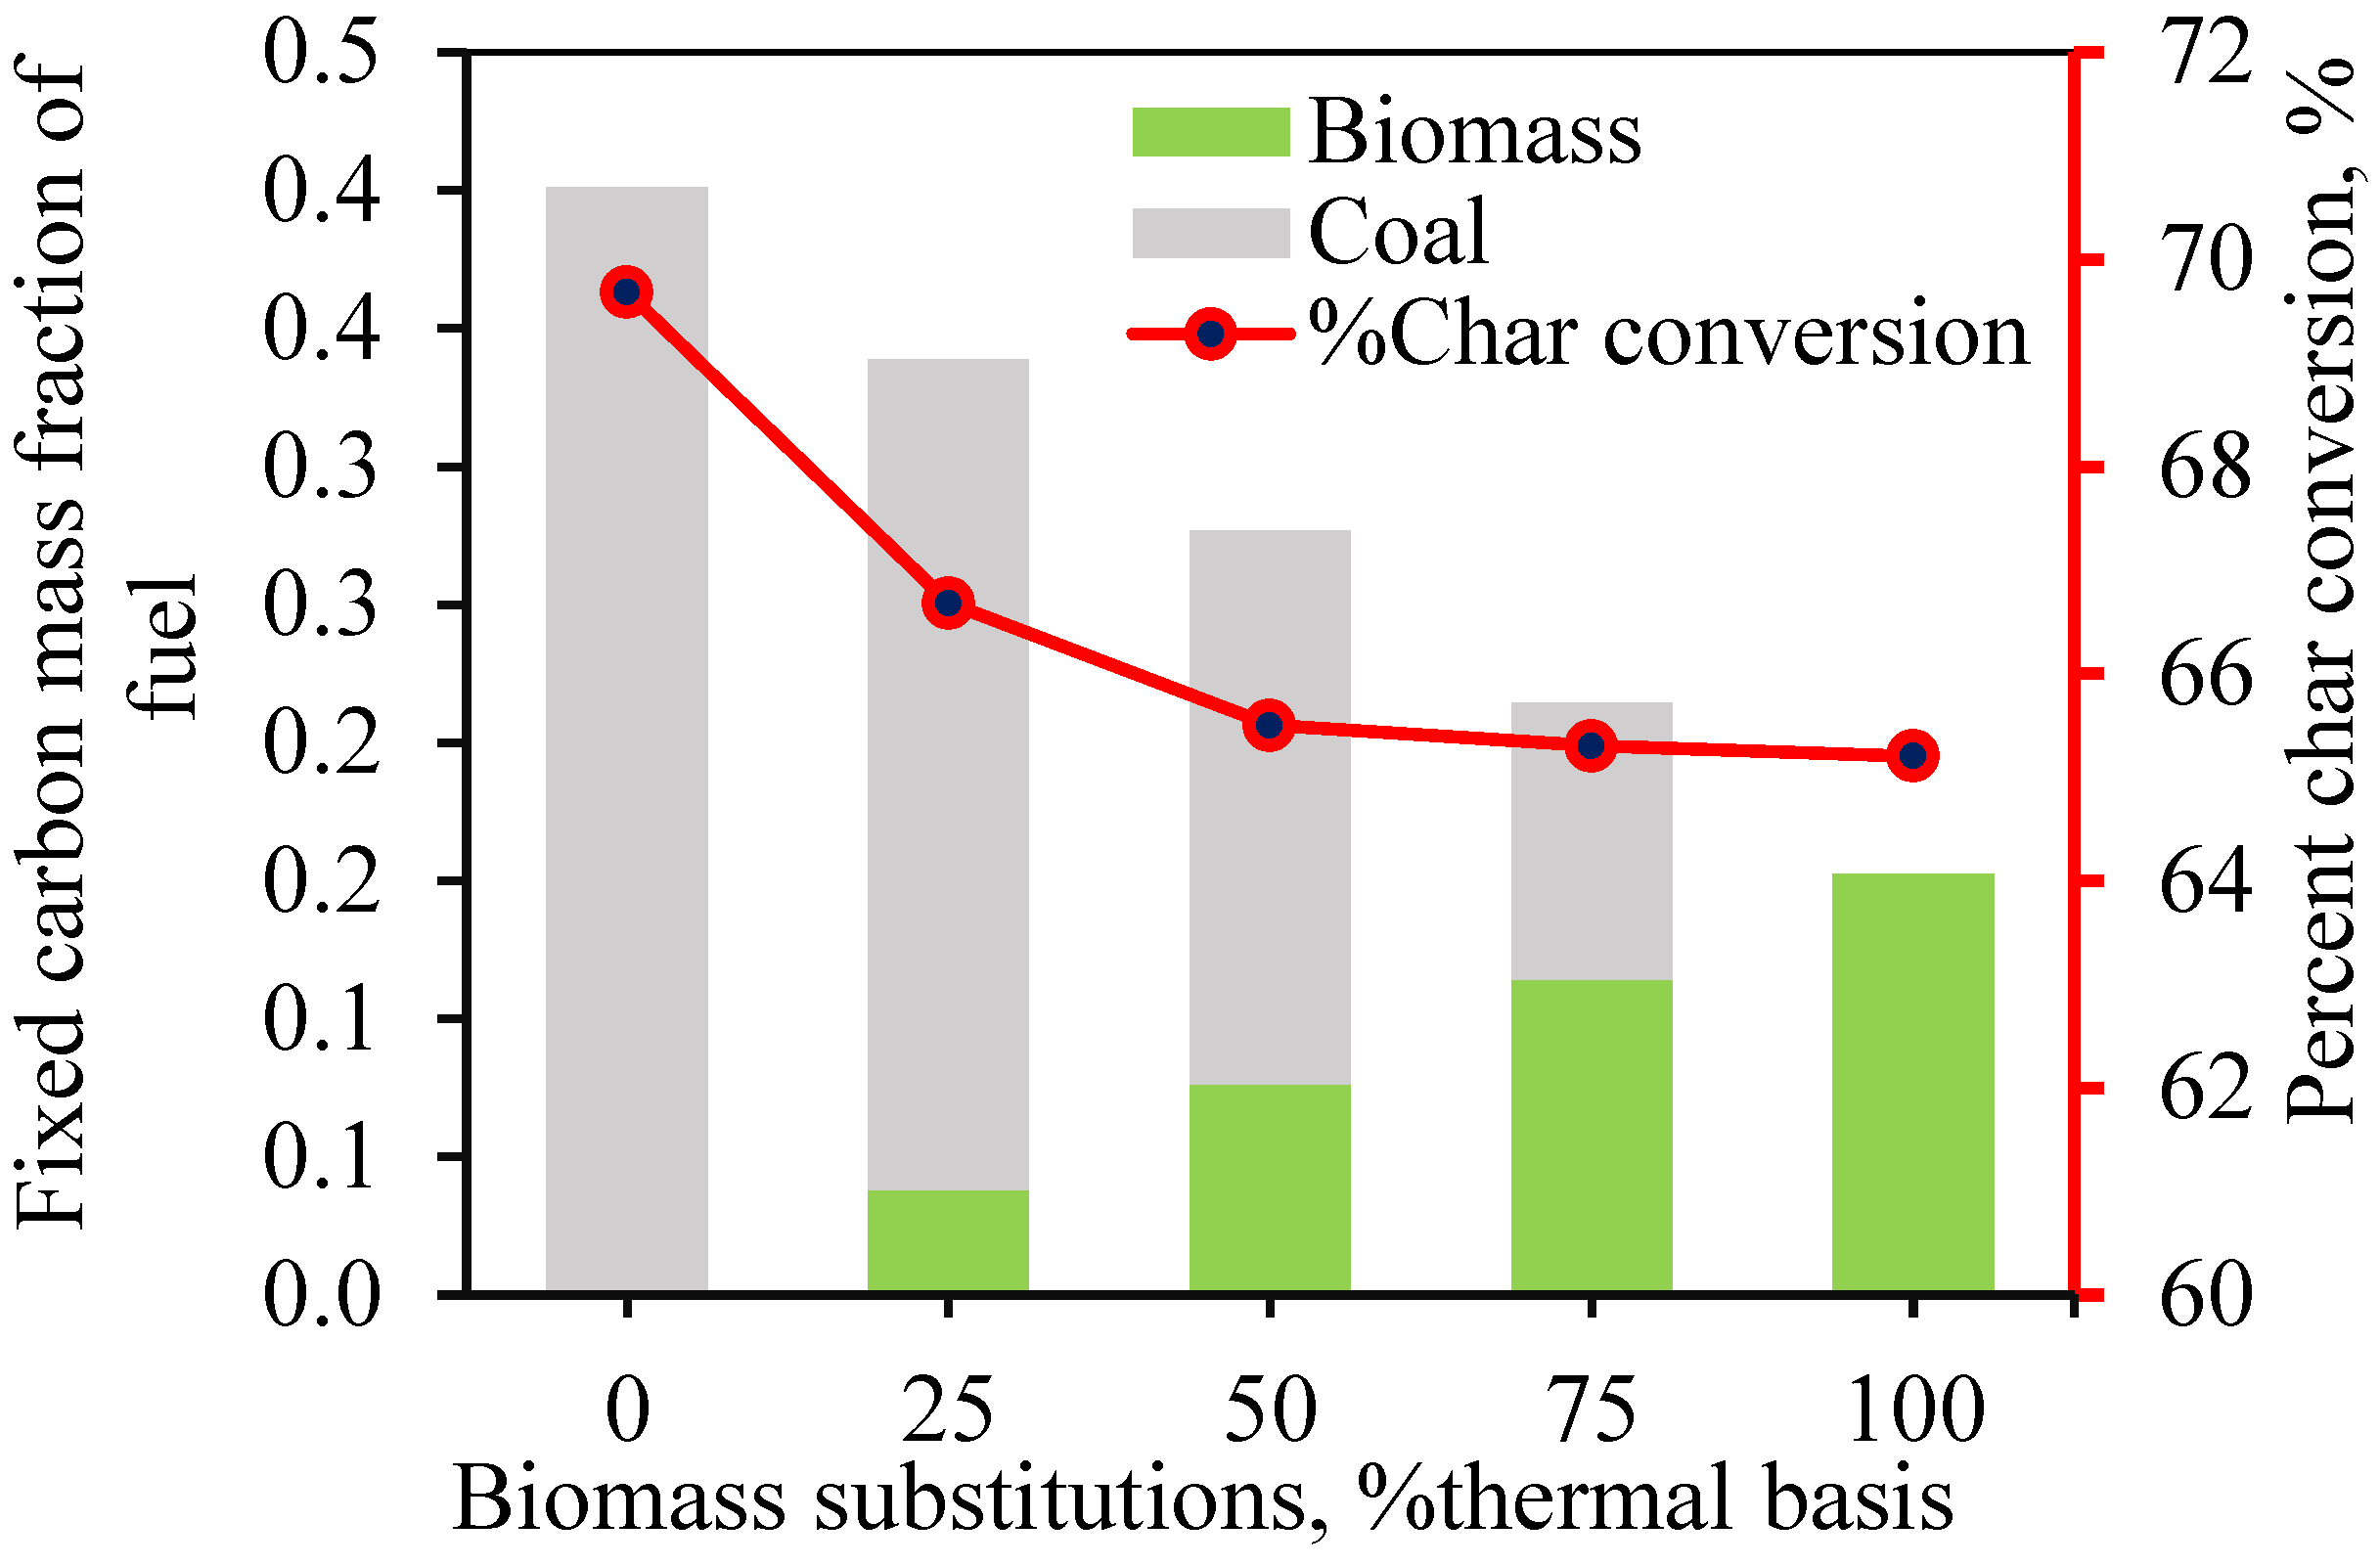
Oxygen and Carbon Dynamics: The oxygen content in exhaust gases decreases from 9.5% to 5.5% as biomass proportion increases due to higher CO levels from incomplete combustion. Biomass releases less unburned carbon compared to coal, but coal has a higher char conversion rate (69.7% vs. 65.2%).
Environmental and Cost Implications: Biomass combustion does not increase atmospheric CO2, potentially reducing CO2 emissions by up to 148.8 gCO2/MWhth compared to coal. Although biomass combustion is 11.8% less efficient, the increased fuel cost can be offset by carbon credits. It is noteworthy that Thailand has not yet started implementing a carbon tax, but there are plans to begin in 2025 with a proposed rate of 200 baht per ton of carbon dioxide emissions. The Thai Ministry of Finance has mandated a study within the year to develop a carbon tax policy that fits the national context and considers approaches from other countries as well. The introduction of this carbon tax aims to encourage businesses to accelerate the use of clean energy and environmentally friendly technologies, helping to reduce the costs associated with importing fuels and supporting the country’s environmental goals. If implemented, this push could significantly enhance the competitiveness of biomass as a fuel alternative, benefiting from lower fuel costs compared to fossil fuels.
In the study, it was found that biomass can be co-fired with coal as an option to reduce energy usage from fossil fuels. Biomass has several advantages over other clean energy alternatives, such as reducing agricultural waste that would otherwise need to be disposed of by landfilling, which would generate methane, a greenhouse gas, or by open burning, which would cause air pollution and particulate emissions. Biomass offers a more stable energy supply compared to solar and wind energy, which depend on weather conditions, has lower costs and greater readiness than hydrogen technology, and does not involve the radiation risks associated with nuclear energy.
With all of the above-mentioned conclusions, it is clear this research has high potential for application in other countries, especially those with biomass resources and coal infrastructure. The methods can be adapted to various types of biomasses, according to regional characteristics, through adjustments in model parameters such as calorific values, fuel composition, particle size, and moisture content. It serves as a tool to meet greenhouse gas (GHG) emission reduction targets under the Paris Agreement. Co-firing biomass can be performed without significant modifications to existing coal-burning equipment, making it suitable for countries with financial and technical resource limitations and allowing for rapid implementation. The research also presents a CFD model that is transferable and easily adapted to local contexts, reducing the cost of physical trials. It provides a pathway for scaling from experimentation to industrial application, where countries reliant on coal burning can reduce pollution and comply with environmental regulations effectively, making biomass co-firing a key technology for sustainable energy production globally. To ensure the credibility of this research and its readiness for industrial application, it is necessary to undertake further studies to resolve potential issues, enhance efficiency, and confirm the scalability of biomass co-firing in actual industrial settings. Full-scale industrial trials will verify the scalability and identify potential operational challenges. Studies on ash behavior and slagging will help address fouling issues and optimize combustion conditions. Moisture management will enhance combustion efficiency through biomass preparation processes such as drying or pelletization. Logistics and supply chain analysis are crucial for evaluating the economic feasibility of biomass supply. Health, safety, and environmental impact assessments will help manage particle emissions and ensure workplace safety. Economic feasibility studies will provide financial models and return on investment data for stakeholders. Studies on system flexibility will ensure efficient operation under varying conditions. Life Cycle Assessment (LCA) will evaluate the environmental impact, support sustainability, and integration with new technologies like carbon capture and storage (CCS) will improve system efficiency. Long-term reliability studies will guide maintenance scheduling and material selection, while policy and regulatory alignment will ensure compliance with environmental standards and take advantage of financial incentives, creating a sustainable and widely applicable operational framework for biomass co-firing technology in the industry.

Author Contributions

Conceptualization, R.C., J.W. and Y.S.; Methodology, R.C., J.W. and Y.S.; Software, R.C.; Validation, J.W. and Y.S.; Formal analysis, R.C.; Investigation, R.C.; Resources, Y.S.; Data curation, R.C.; Writing—original draft, R.C.; Writing—review & editing, J.W. and Y.S.; Visualization, R.C.; Supervision, Y.S.; Project administration, J.W. and Y.S.; Funding acquisition, Y.S. All authors have read and agreed to the published version of the manuscript.

Funding

This research project is supported by Thailand Science Research and Innovation (TSRI) Basic Research Fund: Fiscal year 2024 under project number FRB670016/0164 (Program Sustainable Energy).

Data Availability Statement

The raw data supporting the conclusions of this article will be made available by the authors on request.

Acknowledgments

This research project is supported by Thailand Science Research and Innovation (TSRI) Basic Research Fund: Fiscal year 2024 under project number FRB670016/0164 (Program Sustainable Energy). The authors would like to thank. Jaruwat Charoensuk for assistance and advice during model development, computer simulation, and experimental validation. Special thanks are extended to Supachai Kaewsathain, Poommares Yangsomboon, and Patthanakrid Torsakul for their initial contribution and assistance of this work. The financial resources and supporting information from Energy Provider Corporation Co., Ltd. are greatly appreciated.

Conflicts of Interest

The authors declare no conflict of interest.

References

  1. Panahi, A.; Tarakcioglu, M.; Schiemann, M.; Delichatsios, M.; Levendis, Y.A. On the particle sizing of torrefied biomass for co-firing with pulverized coal. Combust. Flame 2018, 194, 72–84. [Google Scholar] [CrossRef]
  2. Sahu, S.G.; Chakraborty, N.; Sarkar, P. Coal–biomass co-combustion: An overview. Renew. Sustain. Energy Rev. 2014, 39, 575–586. [Google Scholar] [CrossRef]
  3. Li, J.; Brzdekiewicz, A.; Yang, W.; Blasiak, W. Co-firing based on biomass torrefaction in a pulverized coal boiler with aim of 100% fuel switching. Appl. Energy 2012, 99, 344–354. [Google Scholar] [CrossRef]
  4. Wang, X.; Tan, H.; Niu, Y.; Pourkashanian, M.; Ma, L.; Chen, E.; Liu, Y.; Liu, Z.; Xu, T. Experimental investigation on biomass co-firing in a 300 MW pulverized coal-fired utility furnace in China. Proc. Combust. Inst. 2011, 33, 2725–2733. [Google Scholar] [CrossRef]
  5. Saidur, R.; Abdelaziz, E.; Demirbas, A.; Hossain, M.S.; Mekhilef, S. A review on biomass as a fuel for boilers. Renew. Sustain. Energy Rev. 2011, 15, 2262–2289. [Google Scholar] [CrossRef]
  6. Ti, S.; Chen, Z.; Li, Z.; Min, K.; Zhu, Q.; Chen, L.; Wang, Z. Effect of outer secondary air vane angles on combustion characteristics and NOx emissions for centrally fuel rich swirl burner in a 600-MWe wall-fired pulverized-coal utility boiler. Appl. Therm. Eng. 2017, 125, 951–962. [Google Scholar] [CrossRef]
  7. Li, D.; Lv, Q.; Feng, Y.; Wang, C.a.; Liu, X.; Chen, K.; Xu, K.; Zhong, J.; Che, D. Effects of coal blending and operating conditions on combustion and NOx emission characteristics in a tangentially-fired utility boiler. Energy Procedia 2017, 105, 4015–4020. [Google Scholar] [CrossRef]
  8. Zhou, H.; Yang, Y.; Dong, K.; Liu, H.; Shen, Y.; Cen, K. Influence of the gas particle flow characteristics of a low-NOx swirl burner on the formation of high temperature corrosion. Fuel 2014, 134, 595–602. [Google Scholar] [CrossRef]
  9. Zhou, C.; Wang, Y.; Jin, Q.; Chen, Q.; Zhou, Y. Mechanism analysis on the pulverized coal combustion flame stability and NOx emission in a swirl burner with deep air staging. J. Energy Inst. 2019, 92, 298–310. [Google Scholar] [CrossRef]
  10. Li, X.; Choi, M.; Kim, K.; Park, Y.; Sung, Y.; Muramatsu, M.; Choi, G. Effects of pulverized coal particle size on flame structure in a methane-assisted swirl burner. Fuel 2019, 242, 68–76. [Google Scholar] [CrossRef]
  11. Ti, S.; Chen, Z.; Li, Z.; Kuang, M.; Xu, G.; Lai, J.; Wang, Z. Influence of primary air cone length on combustion characteristics and NOx emissions of a swirl burner from a 0.5 MW pulverized coal-fired furnace with air staging. Appl. Energy 2018, 211, 1179–1189. [Google Scholar] [CrossRef]
  12. Rago, G.D.; Rossiello, G.; Dadduzio, R.; Giani, T.; Saponaro, A.; Cesareo, F.; Lacerenza, M.; Fornarelli, F.; Caramia, G.; Fortunato, B. CFD analysis of a swirl stabilized coal combustion burner. Energy Procedia 2018, 148, 703–711. [Google Scholar] [CrossRef]
  13. Sung, Y.; Lee, S.; Eom, S.; Moon, C.; Ahn, S.; Choi, G.; Kim, D. Optical non-intrusive measurements of internal recirculation zone of pulverized coal swirling flames with secondary swirl intensity. Energy 2016, 103, 61–74. [Google Scholar] [CrossRef]
  14. Yonmo, S.; Gyungmin, C. Effectiveness between swirl intensity and air staging on NOx emissions and burnout characteristics in a pulverized coal fired furnace. Fuel Process. Technol. 2015, 139, 15–24. [Google Scholar]
  15. Zeng, L.; Li, Z.; Zhao, G.; Li, J.; Zhang, F.; Shen, S.; Chen, L. The influence of swirl burner structure on the gas/particle flow characteristics. Energy 2011, 36, 6184–6194. [Google Scholar] [CrossRef]
  16. Jing, J.; Li, Z.; Zhu, Q.; Chen, Z.; Wang, L.; Chen, L. Influence of the outer secondary air vane angle on the gas/particle flow characteristics near the double swirl flow burner region. Energy 2011, 36, 258–267. [Google Scholar] [CrossRef]
  17. Saeed, M.A.; Andrews, G.E.; Phylaktou, H.N.; Gibbs, B.M. Flame speed and Kst reactivity data for pulverised corn cobs and peanut shells. J. Loss Prev. Process Ind. 2017, 49, 880–887. [Google Scholar] [CrossRef]
  18. Riaza, J.; Gibbins, J.; Chalmers, H. Ignition and combustion of single particles of coal and biomass. Fuel 2017, 202, 650–655. [Google Scholar] [CrossRef]
  19. Sousa, N.; Azevedo, J.L. Model simplifications on biomass particle combustion. Fuel 2016, 184, 948–956. [Google Scholar] [CrossRef]
  20. Garcia-Maraver, A.; Perez-Jimenez, J.A.; Serrano-Bernardo, F.; Zamorano, M. Determination and comparison of combustion kinetics parameters of agricultural biomass from olive trees. Renew. Energy 2015, 83, 897–904. [Google Scholar] [CrossRef]
  21. Ballester, J.; Barroso, J.; Cerecedo, L.; Ichaso, R. Comparative study of semi-industrial-scale flames of pulverized coals and biomass. Combust. Flame 2005, 141, 204–215. [Google Scholar] [CrossRef]
  22. Ndibe, C.; Grathwohl, S.; Paneru, M.; Maier, J.; Scheffknecht, G. Emissions reduction and deposits characteristics during cofiring of high shares of torrefied biomass in a 500 kW pulverized coal furnace. Fuel 2015, 156, 177–189. [Google Scholar] [CrossRef]
  23. Wang, Y.; Wang, X.; Hu, Z.; Li, Y.; Deng, S.; Niu, B.; Tan, H. NO emissions and combustion efficiency during biomass co-firing and air-staging. BioResources 2015, 10, 3987–3998. [Google Scholar] [CrossRef]
  24. Aziz, M.; Budianto, D.; Oda, T. Computational fluid dynamic analysis of co-firing of palm kernel shell and coal. Energies 2016, 9, 137. [Google Scholar] [CrossRef]
  25. Ma, L.; Jones, J.; Pourkashanian, M.; Williams, A. Modelling the combustion of pulverized biomass in an industrial combustion test furnace. Fuel 2007, 86, 1959–1965. [Google Scholar] [CrossRef]
  26. Li, J.; Biagini, E.; Yang, W.; Tognotti, L.; Blasiak, W. Flame characteristics of pulverized torrefied-biomass combusted with high-temperature air. Combust. Flame 2013, 160, 2585–2594. [Google Scholar] [CrossRef]
  27. Elfasakhany, A.; Tao, L.; Espenas, B.; Larfeldt, J.; Bai, X.-S. Pulverised wood combustion in a vertical furnace: Experimental and computational analyses. Appl. Energy 2013, 112, 454–464. [Google Scholar] [CrossRef]
  28. Elorf, A.; Sarh, B. Excess air ratio effects on flow and combustion caracteristics of pulverized biomass (olive cake). Case Stud. Therm. Eng. 2019, 13, 100367. [Google Scholar] [CrossRef]
  29. Zhou, L.; Zhang, Y.; Zhang, J. Simulation of swirling coal combustion using a full two-fluid model and an AUSM turbulence-chemistry model☆. Fuel 2003, 82, 1001–1007. [Google Scholar] [CrossRef]
  30. Gu, M.; Zhang, M.; Fan, W.; Wang, L.; Tian, F. The effect of the mixing characters of primary and secondary air on NOx formation in a swirling pulverized coal flame. Fuel 2005, 84, 2093–2101. [Google Scholar] [CrossRef]
  31. Ghenai, C.; Janajreh, I. CFD analysis of the effects of co-firing biomass with coal. Energy Convers. Manag. 2010, 51, 1694–1701. [Google Scholar] [CrossRef]
  32. Deniz, C.; Boke, Y.; Aydin, O.; BenİM, A. Computational analysis of pulverized coal co-firing with biomass in 150mwe unit of tuncbilek thermal power plant. Isı Bilim. Tek. Derg. 2021, 41, 37–50. [Google Scholar] [CrossRef]
  33. Laphirattanakul, P.; Charoensuk, J.; Turakarn, C.; Kaewchompoo, C.; Suksam, N. Development of pulverized biomass combustor with a pre-combustion chamber. Energy 2020, 208, 118333. [Google Scholar] [CrossRef]
  34. Tabet, F.; Gökalp, I. Review on CFD based models for co-firing coal and biomass. Renew. Sustain. Energy Rev. 2015, 51, 1101–1114. [Google Scholar] [CrossRef]
  35. Backreedy, R.I.; Fletcher, L.M.; Jones, J.M.; Ma, L.; Pourkashanian, M.; Williams, A. Co-firing pulverised coal and biomass: A modeling approach. Proc. Combust. Inst. 2005, 30, 2955–2964. [Google Scholar] [CrossRef]
  36. Suksam, N.; Charoensuk, J. Development of pulverized biomass combustion for industrial boiler: A study on bluff body effect. BioResources 2019, 14, 6146–6167. [Google Scholar] [CrossRef]
  37. Fernando, R. Fuels for Biomass Cofiring; IEA Coal Research, Clean Coal Centre: London, UK, 2005. [Google Scholar]
  38. Fluent, A. Ansys Fluent Theory Guide; Ansys Inc.: Canonsburg, PA, USA, 2011; Volume 15317, pp. 724–746. [Google Scholar]
  39. Kleinhans, U.; Wieland, C.; Frandsen, F.J.; Spliethoff, H. Ash formation and deposition in coal and biomass fired combustion systems: Progress and challenges in the field of ash particle sticking and rebound behavior. Prog. Energy Combust. Sci. 2018, 68, 65–168. [Google Scholar] [CrossRef]
  40. Garcia-Maraver, A.; Mata-Sanchez, J.; Carpio, M.; Perez-Jimenez, J.A. Critical review of predictive coefficients for biomass ash deposition tendency. J. Energy Inst. 2017, 90, 214–228. [Google Scholar] [CrossRef]
  41. Yang, X.; Ingham, D.; Ma, L.; Williams, A.; Pourkashanian, M. Predicting ash deposition behaviour for co-combustion of palm kernel with coal based on CFD modelling of particle impaction and sticking. Fuel 2016, 165, 41–49. [Google Scholar] [CrossRef]
  42. Lachman, J.; Baláš, M.; Lisý, M.; Lisá, H.; Milčák, P.; Elbl, P. An overview of slagging and fouling indicators and their applicability to biomass fuels. Fuel Process. Technol. 2021, 217, 106804. [Google Scholar] [CrossRef]
  43. Kongto, P.; Palamanit, A.; Chaiprapat, S.; Tippayawong, N. Enhancing the fuel properties of rubberwood biomass by moving bed torrefaction process for further applications. Renew. Energy 2021, 170, 703–713. [Google Scholar] [CrossRef]
Figure 1. Combustion furnace utilized in this study.
Fuels 06 00009 g001
Figure 2. Temperature measurement locations (top view).
Fuels 06 00009 g002
Figure 3. Rosin–Rammler particle size distribution.
Fuels 06 00009 g003
Figure 4. Computational domain.
Fuels 06 00009 g004
Figure 5. Axisymmetric temperature profiles from simulation and experiment.
Fuels 06 00009 g005
Figure 6. Comparing the exhaust gas components from experimentation with simulation.
Fuels 06 00009 g006
Figure 7. Axial temperature distribution in the furnace.
Fuels 06 00009 g007
Figure 8. Temperature contour inside the furnace of coal (Upper) compared with biomass (Lower).
Fuels 06 00009 g008
Figure 9. Unburned char release rate of biomass (Green chart), Coal (Gray chart), and overall (Orange line).
Fuels 06 00009 g009
Figure 10. Mass fraction of fixed carbon composition of biomass (Green chart), Coal (Gray chart), and percentage of overall char conversion (Red line).
Fuels 06 00009 g010
Figure 11. CO2 concentration (Orange line), CO concentration (Red line), and percentage of O2 excess (Blue line).
Fuels 06 00009 g011
Figure 12. Volume average temperature (Orange chart), NOx concentration at outlet (Blue line), and SO2 concentration at outlet (Yellow line).
Fuels 06 00009 g012
Figure 13. Combustion efficiency (Red line), Furnace efficiency (Green line), Heat from combustion reaction (Blue chart), and Heat output at outlet (Yellow chart) of each case.
Fuels 06 00009 g013
Figure 14. Specific thermal consumption for each biomass substitution.
Fuels 06 00009 g014
Table 1. The proximate and ultimate analyses of the pulverized coal and biomass.
Fuel PropertiesUnitCoalRubberwood
Proximate (wet basis, as received)
Volatile%46.969.29
Fixed carbon%40.117.97
Ash%6.51.94
Moisture%6.510.80
Ultimate (dry basis, ash free)
Carbon, C%5749.42
Hydrogen, H%5.66.16
Oxygen, O%143.93
Nitrogen, N%35.90.49
Sulfur, S%0.50
High heating value, HHVMJ/kg23.3717.5
Low heating value, LHVMJ/kg22.1016.15
DensityKg/m31400751
Table 2. Experimental data measurement and simulation prediction.
ParametersUnitPure CoalPure BiomassPure Coal—SimulationPure Biomass—Simulation
Temp 1K13451149424376
Temp 2K1498128414821243
Temp 3K1573139719161565
Temp 4K1600146518881545
Temp 5K1569143715621450
Temp 6K1434143114651445
Temp 7K1324131213321380
O2%vol12.608.509.405.50
COppm61.40379.0078.00423.00
NOxppm221.9079.00272.0060.00
Disclaimer/Publisher’s Note: The statements, opinions and data contained in all publications are solely those of the individual author(s) and contributor(s) and not of MDPI and/or the editor(s). MDPI and/or the editor(s) disclaim responsibility for any injury to people or property resulting from any ideas, methods, instructions or products referred to in the content.

