Article

Development and Characterization of κ-Carrageenan and Boron Nitride Nanoparticle Membranes for Improved Ionic Conductivity in Fuel Cells

by
Ermides Chavez-Baldovino
1,*,
Carlos A. Malca-Reyes
1,
Roberto Masso
1,
Peter Feng
1 and
Liz M. Díaz-Vázquez
2,*
1
Department of Physics, University of Puerto Rico-Rio Piedras, San Juan 00925-2537, Puerto Rico
2
Department of Chemistry, University of Puerto Rico-Rio Piedras, 17 Ave. Universidad #1701, San Juan 00925-2537, Puerto Rico
*
Authors to whom correspondence should be addressed.
Fuels 2025, 6(1), 15; https://doi.org/10.3390/fuels6010015
Submission received: 31 July 2024 / Revised: 30 October 2024 / Accepted: 27 November 2024 / Published: 12 February 2025

Abstract

:
The development of alga-based biodegradable membranes represents a significant advancement in fuel cell technology, aligning with the need for sustainable material solutions. In a significant advancement for sustainable energy technologies, we have developed a novel biodegradable κ-carrageenan (KC) and boron nitride (BN) nanoparticle membrane, optimized with ammonium sulfate (NHS). This study employed a set of characterization techniques, including thermogravimetric analysis (TGA) and differential scanning calorimetry (DSC), where thermal anomalies were observed in the membranes around 160 °C and 300 °C as products of chemical decomposition. X-ray diffraction (XRD), scanning electron microscopy (SEM), and energy-dispersive X-ray spectroscopy (EDS) revealed the phases corresponding to the different precursors, whose value in the EDS measurements reached a maximum in the KC/BN/NHS5% membrane at 2.31 keV. In terms of the mechanical properties (MPs), a maximum tensile stress value of 10.96 MPa was achieved for the KC/BN sample. Using Fourier transform infrared spectroscopy (FTIR), the physicochemical properties of the membranes were evaluated. Our findings reveal that the KC/BN/NHS1% membrane achieves an exceptional ionic conductivity of 7.82 × 10⁻⁵ S/cm, as determined by impedance spectroscopy (IS). The properties of the developed membrane composite suggest possible broader applications in areas such as sensor technology, water purification, and ecologically responsive packaging. This underscores the role of nanotechnology in enhancing the functional versatility and sustainability of energy materials, propelling the development of green technology solutions.

Graphical Abstract

1. Introduction

The pursuit of sustainable energy solutions has intensified in the face of global environmental challenges and the growing demand for renewable energy sources. One of the consequences of global warming is carbon dioxide emissions, caused mainly by fossil fuels such as diesel, gasoline, natural gas, and coal, which directly affect the environment, health, and the economy [1]. As an alternative, to mitigate this problem, there are fuel cells and lithium batteries [2]. Fuel cells are electrical devices that generate energy from a chemical reaction; that is, they convert chemical energy into electrical energy without the use of fossil fuels being necessary for their operation. A fuel cell works as follows: the fuel (e.g., H2) is electrochemically oxidized at the anode, and this produces both protons and electrons. The protons are then transported through the polymer exchange membrane to the cathode, while the electrons move through the outer loop and thus also reach the cathode side. These protons and electrons react electrochemically with the oxidant (i.e., oxygen from the supplied air) at the cathode, producing water and heat [3,4,5]. However, the widespread adoption of fuel cell technology is hampered by the limitations of current fuel cell membranes, which often involve expensive, non-biodegradable materials that pose disposal challenges. Many of these fuel cells use proton exchange membranes as a fundamental part of their operation. However, these membranes are made mainly of perfluorinated compounds that are harmful to the environment and health [6,7,8]. Therefore, the development of sustainable, high-performance, and cost-effective materials is critical to the future of fuel cell technologies as an alternative. In the search for new materials that do not have an impact on the environment, natural polymers or biopolymers have been proposed as an alternative in the manufacture of membranes for use in energy generation systems [9,10,11,12]. Applying macroalga-derived polysaccharides in developing bio-based membranes presents a sustainable alternative to synthetic polymers like Nafion. These natural polymers are biodegradable and can be chemically modified to improve their proton conductivity and mechanical stability, making them suitable for use in fuel cells and energy storage [13,14,15,16]. Research has highlighted the potential of using alginate and carrageenan, derived from macroalgae, to enhance fuel cell technologies’ environmental performance and cost-effectiveness [17,18,19,20,21]. As shown in Figure 1 Carrageenan is a family of sulfated polysaccharides whose main polysaccharide chain is formed mainly by the monomers β-D-galactopyranose and α-D-galactopyranose linked by α-(1→3) and β-(1→4) [22,23] bonds. These polysaccharides are classified into six basic forms: iota-, kappa-, lambda-, mu-, nu-, and theta-carrageenan, with the iota, kappa, and lambda forms being the most commercially used [24,25].
Regarding further environmentally friendly materials, bulk boron nitride (BN) [26,27,28] presents different allotropic forms analogous to carbon, such as hexagonal, cubic, wurtzite, rhombohedral, fullerene, and single- and multiple-wall nanotubes [29], which are found in the form of nanoparticles, such as hexagonal boron nitride (h-BN) nanoparticles, that have attracted special interest in the industry due to their thermal and chemical stability, their low density, their intrinsic electrical insulation, and their high thermal conductivity [30]. Another material that has environmentally friendly characteristics is ammonium sulfate, (NH4)2SO4 (NHS) [31,32], which is a crystalline inorganic salt whose most common use is as a soil fertilizer, but which can also be used to improve the conductive properties of some materials due to its ionic contribution [33]. These materials (BN and NHS) have physicochemical properties that make them excellent candidates for use as additives to improve the properties of biopolymers, as well as their low cost, non-toxicity, biocompatibility, and electrical properties.
In recent years, different groups have worked with biopolymers, composites, and nanocomposites made of biopolymers, metal oxides, and other compounds. Vivela et al. [34] worked with membranes made of a mixture of bacterial nanocellulose and a lignin derivative, finding thermo-oxidative stability up to approximately 200 °C in atmospheres of N2 (inert) and O2 (oxidative), as well as high mechanical properties, with a maximum Young’s modulus of 8.2 GPa. For their part, Kawabata and Matsuo found that chitin becomes a proton conductor and acts as the electrolyte of the fuel cell and that its proton conductivity increases with the increase in the number of water molecules [35]. Pasini-Cabello et al. [36] created alginate (Alg) and carrageenan (Car) membranes and found that the proton conductivities of the membranes increased with the carrageenan content from 9.79 × 10⁻³ Scm−1 for Alg/Car 100/00 to 3.16 × 10⁻² Scm−1 for Alg/Car 80/20 at 90 °C. Mohy et al. [37] created iota-carrageenan and polyvinyl alcohol (iota-carrageenan-g-PVA) membranes and found that the efficiency factor of the prepared I-Car-g-PVA membrane was one order higher than that of Nafion 117. Selvasekarapandian et al. [38] studied proton-conducting polymeric electrolytes made of pectin biopolymer doped with ammonium chloride (NH4Cl) and ammonium bromide (NH4Br), which were characterized by X-ray, FTIR, and impedance spectroscopy, finding a higher ionic conductivity for the pectin membranes doped with 30 mol% NH4Cl and 40 mol% NH4Br of 4.52 × 10⁻⁴ and 1.07 × 10⁻³ S cm−1, respectively. Shukur et al. [39] manufactured a polymer blend of chitosan, poly(ethylene oxide) (PEO) electrolytes, and ammonium nitrate (NH4NO3), finding the highest value in the dielectric constant for the sample with a concentration of 40 wt % of NH4NO3. For their part, Moniha et al. [40] prepared biopolymeric electrolytes of iota-carrageenan (I-carrageenan) with ammonium nitrate (NH4NO3), finding an ionic conductivity value of 1.46 × 10⁻³ S/cm, an ionic transference number of 0.95, and an open-circuit voltage, in the fuel cell, of 442 mV for the 1.0 g Ι-carrageenan sample with a concentration of 0.4 wt % NH4NO3. Liew et al. [41] developed a new membrane from chemically modified k-carrageenan through phosphorylation, producing O-methylene phosphonic κ-carrageenan (OMPC), which showed an ionic conductivity of 1.54 × 10⁻⁵ Scm−1, an order of magnitude higher (2.79 × 10⁻⁶ Scm−1) than the κ-carrageenan membrane. Songtao Li et al. [42] developed citric acid cross-linked (Carboxycellulose nanofibers) CNF membranes, finding a maximum power density of 27.7 mW/cm2 and a maximum current density of 111.8 mA/cm2 at 80 °C and 100% relative humidity (RH).
The characteristics that biomembranes must achieve for commercial use must be analogous to those demonstrated by Nafion, as shown in Table 1. The closeness between the values of the electrical and mechanical properties of the different biomembranes and commercial Nafion can be observed. The most marked difference is found in the thermal properties, with a discrepancy of up to 180 C.
There is another class of polymers, contrary to biopolymers: synthetic polymers, which are widely used as proton exchange membranes and are based on poly(perfluorosulfonic acids) (PFAs), also called perfluorosulfonic acid ionomers (PFSIs), for example, Nafion, which is the most used commercially and has been the standard material for polymeric electrolyte fuel cells [53,54,55]. However, in recent decades, research has reported the existence of polyfluorinated substances in the environment that correlate with harmful effects on human health and ecosystems [6,7,8].
In this study, we explore the development of novel biopolymer membranes composed of κ-carrageenan (KC), enhanced with boron nitride nanoparticles (BN NPs) and ammonium sulfate (NHS). This research aims to provide a sustainable alternative to widely used synthetic proton exchange membranes such as those based on poly(perfluorosulfonic acids) (PFAs), commonly known as perfluorosulfonic acid ionomers (PFSIs), exemplified by Nafion [16]. Despite Nafion’s prevalent use and effectiveness in polymeric electrolyte fuel cells, its environmental footprint, highlighted by the persistence of polyfluorinated compounds, raises significant ecological and health concerns [56,57,58]. Our membranes aim to not only mitigate these environmental impacts but also enhance the thermal, electrical, and structural properties necessary in high-efficiency fuel cells. We conducted a detailed analysis of the thermal, electrical, and structural properties of membranes composed of κ-carrageenan (biopolymer), boron nitride nanoparticles, and ammonium sulfate (labeled as KC/BN/NHS).

2. Materials and Methods

2.1. Synthesis of Samples

The method for obtaining nanocomposites was very similar to that of Chavez et al. [59] and E. Lizundia et al. [60], with a few modifications. A solution of 5.260 ± 0.001 g and 100 mL of κ-carrageenan and distilled water, respectively, was prepared to obtain a weight percentage of 5%. Approximately 12 g was extracted from this solution to be later used in manufacturing the κ-carrageenan membrane. A suspension of BN nanoparticles was prepared and homogenized to obtain 5 wt % in distilled water and dispersed with a T18 B S1 ULTRA-TURRAX disperser. The κ-carrageenan solution was then manually mixed with the BN nanoparticle suspension to form a composite with 95 wt % KC and 5 wt % BN, from which approximately 14 g was extracted for use in the κ-carrageenan/BN (KC/BN) membrane. Then, different ammonium sulfate solutions were prepared at 1, 2, 3, 4, and 5 wt % concentrations. These were manually incorporated into separate KC/BN mixture batches to produce KC/BN/NHS composites at the corresponding concentrations. Each mixture was stirred magnetically for 48 h. The resultant solutions, initial κ-carrageenan, and KC/BN mixtures were poured into Petri dishes and dried in an oven at 50 °C for 48 h. To label the membranes, the following nomenclature was used: first, KC corresponds to k-carrageenan, then BN corresponds to boron nitride, and finally, NHS% corresponds to the variation in the concentration of ammonium sulfate in the construction of the membranes that are labeled as KC/BN/NHS1, 2, 3, 4, and 5%.

2.2. Differential Scanning Calorimetry (DSC)

A calorimeter DSC 822e Mettler Toledo was used to analyze the samples’ thermal stability. Nanocomposites were placed on aluminum sample holders, and nitrogen was used as a purge gas, with a flow rate of 60 mL/min and a heating rate of 5 °C/min from room temperature to 500 °C.

2.3. Thermogravimetric Analysis (TGA)

A TGA-2 Mettler Toledo was used to study the loss of mass membrane depending on temperature. The work temperature was from room temperature to 800 °C with a heating rate of 10 °C /min.

2.4. X-Ray Diffraction (XRD)

Using a Rigaku X-ray diffractometer (Smartlab), the crystalline structures of the membranes were studied with a Cu-Kα monochromatic radiation source. The collected data were taken from 20 to 80 degrees with a sampling step of 0.02 degrees and a 1 degree/min scanning speed.

2.5. Fourier Transform Infrared Spectroscopy (FTIR)

The samples’ membranes were analyzed with a Shimadzu IRAffinity-1S spectrophotometer coupled with an attenuated total reflectance cell (ATR). The spectra were obtained from 400 to 4000 cm−1, with 100 scans per sample and a resolution of 2 cm−1.

2.6. Impedance Spectroscopy (IS)

The electrical properties of nanocomposites were measured using the ID method with a HIOKI 3522-50 LCR impedance analyzer (Hioki E. E. Corporation, Melrose, MA, USA). The frequency range of measurement was 42 to 5 MHz, with an applied voltage amplitude of 0.1 V at room temperature. In the KC/BN/NHS1% sample, the measurements were conducted from room temperature to 200 °C.

2.7. Scanning Electron Microscopy (SEM) with Energy-Dispersive X-Ray Spectroscopy (EDS)

SEM examined the surface morphology, and the EDS measurements allowed chemical composition analysis with a JSMIT-500 HR (JEOL, Tokyo, Japan) with a voltage of 20 k. All spectra were taken at room temperature.

2.8. Mechanical Properties

The mechanical properties were studied with a Brookfield CT3 Texture Analyzer, using tensile tests at room temperature. The samples were approximately 20 mm long and 0.6 mm thick. These measurements were taken from an average of replicas. The strain rate was 0.5 mm/s for samples loaded to failure. Using Origin Pro. 8.5 software, Young’s modulus was calculated from the stress versus strain curve, and the tensile stress and elongation at break values in the plastic limit region were obtained.

2.9. Hydrophilicity

To measure the hydrophilicity of the membranes on the surface, this analysis was evaluated via surface energy measurements performed with a Krüss drop shape analyzer DSA25S at room temperature. A piece of the membrane was fixed to the instrument using carbon tape, and an ultrapure water drop was deposited on the membrane using a syringe with a 25-gauge needle.

3. Results and Discussion

In the discussion of our findings, it is important that we contextualize the enhanced properties of the κ-carrageenan (KC), boron nitride (BN) nanoparticles, and ammonium sulfate (NHS)-based membranes. This study addresses the critical need for environmentally sustainable alternatives to traditional proton exchange membranes, like those made from perfluorosulfonic acid ionomers, which are widely used but raise significant ecological and health concerns due to their persistent polyfluorinated compounds. Our analysis demonstrates the potential for these biopolymer membranes to reduce environmental impact and their capability to meet, if not exceed, the thermal, electrical, and structural demands in high-efficiency fuel cells.

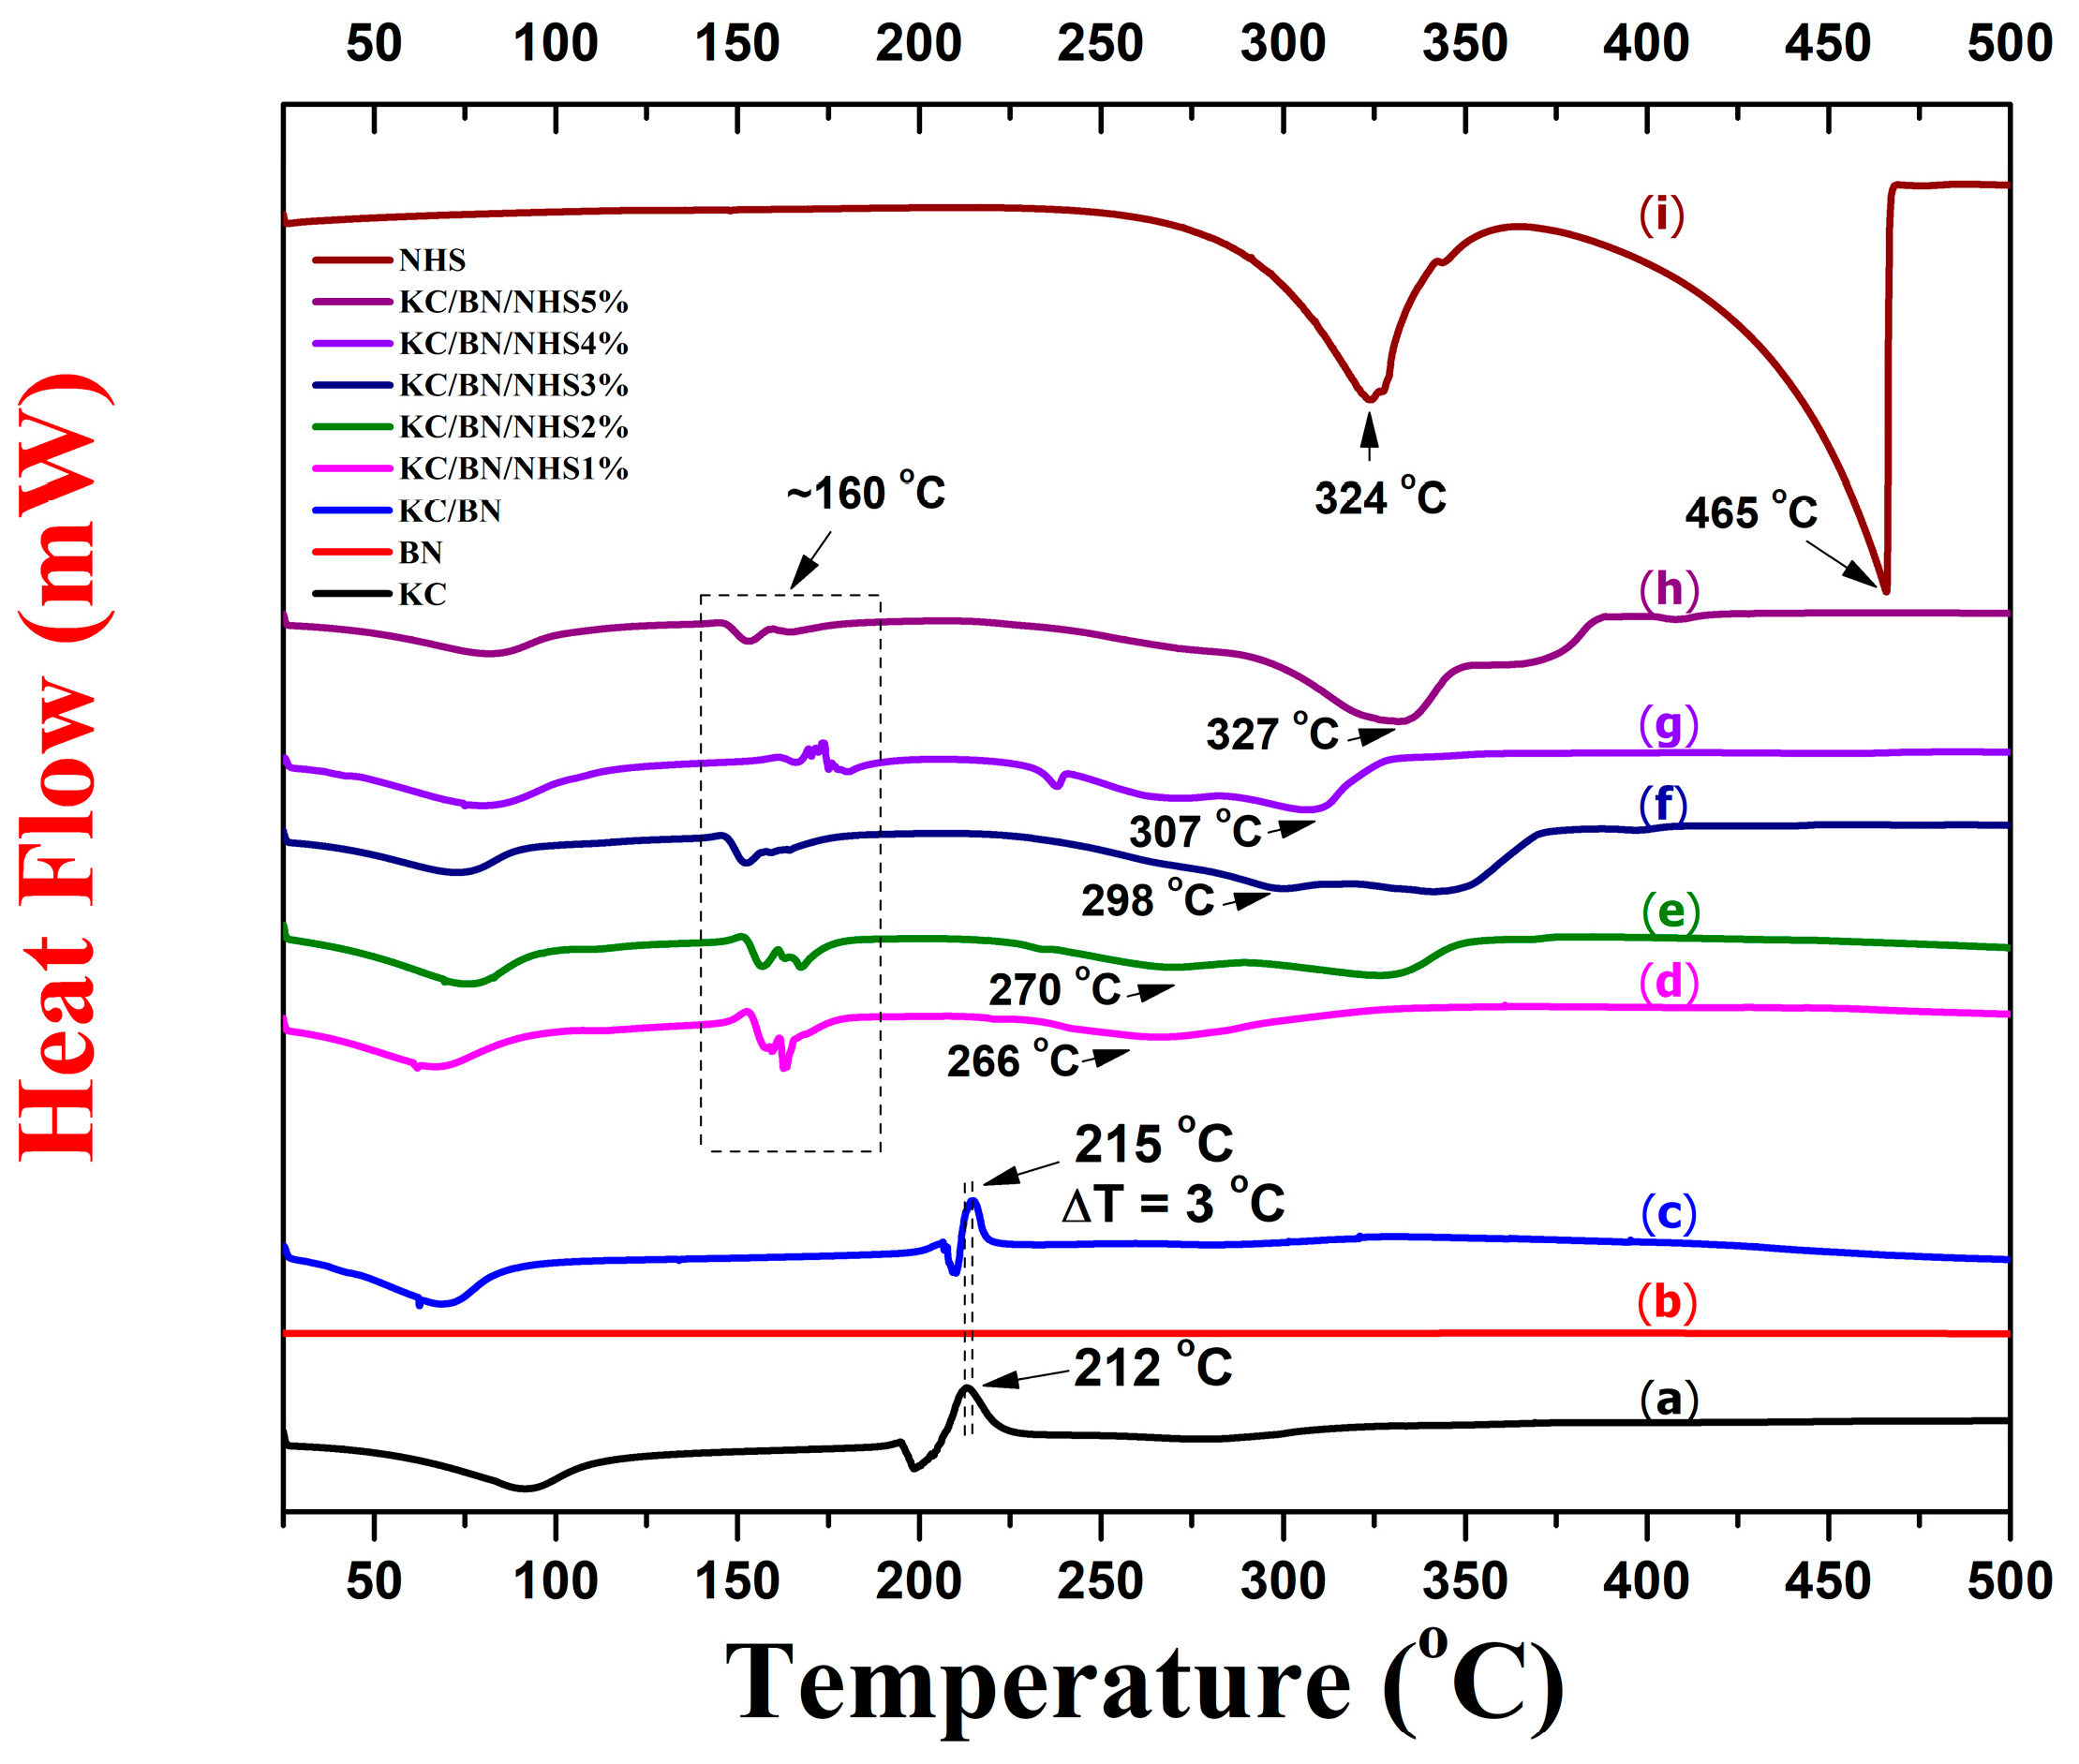
3.1. Thermal Stability

Figure 2 shows the thermograms of the different membranes and the precursors (NHS and BN). For each of the membranes, including the KC, a first endothermic anomaly is observed around 100 °C, the product of water evaporation that is physically bound in the different membranes. The endothermic peak at this temperature is not observed in the two precursors, sulfate ammonium (NHS) and boron nitride (BN), which do not have hygroscopic properties. In addition, BN shows excellent thermal stability at a wide range of temperatures. The KC sample presents an exothermic peak at 212 °C, typical of combustion, whose enthalpy is 151.6 J/g, while the κ-carrageenan membrane with 5 wt % of BN (KC/BN) presents a shift in the peak of 3 °C, moving towards a temperature of 215 °C, with a significant reduction, approximately by half, in its enthalpy of 68.8 J/g. On the other hand, in the KC/BN/NHS membranes with different concentrations of NHS (1, 2, 3, 4, and 5 wt %), we have not observed the exothermic peak in each of the samples due to the aggregation of the NHS. All these membranes present an endothermic anomaly due to physically binding water in the samples around 75 °C, together with another endothermic anomaly around 160 °C, due to a structural phase change in the membranes or a process of chemical decomposition. In addition to these two endothermic anomalies, there is a third anomaly around 250 °C, which could be related to the decomposition of ammonium sulfate in the membranes. This anomaly shows a shift to the right towards higher temperatures as the concentration of ammonium sulfate increases. Furthermore, for the NHS, a first stage of decomposition is observed at 324 °C, which corresponds to the loss of NH3, and a second is observed at 465 °C, which could correspond to the loss of ammonia, water vapor, and sulfuric oxides, as has been reported [61].
Some thermal anomalies raised in the DSC measurements may be due to solid–solid phase transitions, volatilization, or decomposition processes in the samples. To investigate these processes better and identify the different changes in the membranes due to heat treatment, we conducted thermogravimetric analysis (TGA) measurements. Figure 3A shows a loss of 8% in mass around 100 °C, corresponding to water loss in all membranes (KC, KC/BN, KC/BN/NHS1%, KC/BN/NHS2%, KC/BN/NHS3%, KC/BN/NHS4%, and KC/BN/NHS5%) as observed via DSC measurement [45,62,63,64,65]. The maximum mass losses in this temperature range are shown as downward peaks in Figure 3B (dM/dT vs. Temperature). For their part, the precursors (NHS and BN) do not show any mass loss at these temperatures, whereas BN is known for its excellent thermal stability over various temperatures. The KC and KC/BN membranes present another mass loss of approximately 18% at 212 °C, as shown in Figure 3A, which is related to a degradation process by the membranes (this degradation process could be associated with the exothermic peak shown in Figure 2) and also reported by Mishra et al. [65]. For the KC/BN membrane, a reduction in its maximum mass loss is observed (Figure 3B), compared to the KC, due to the addition of BN, which helps to improve the thermal stability of the membrane. On the other hand, the membranes doped with NHS show the loss of between 10% and 15% in mass around 160 °C, which could be related to the volatilization of CO2, where we can see their maximum mass loss in Figure 3B. In addition, a third but strong mass loss, between 20% and 40%, occurs around 300 °C, which may correspond to the onset of the loss of ammonia, water vapor, and sulfur oxides, as occurs in NHS decomposition at 400 °C [61].

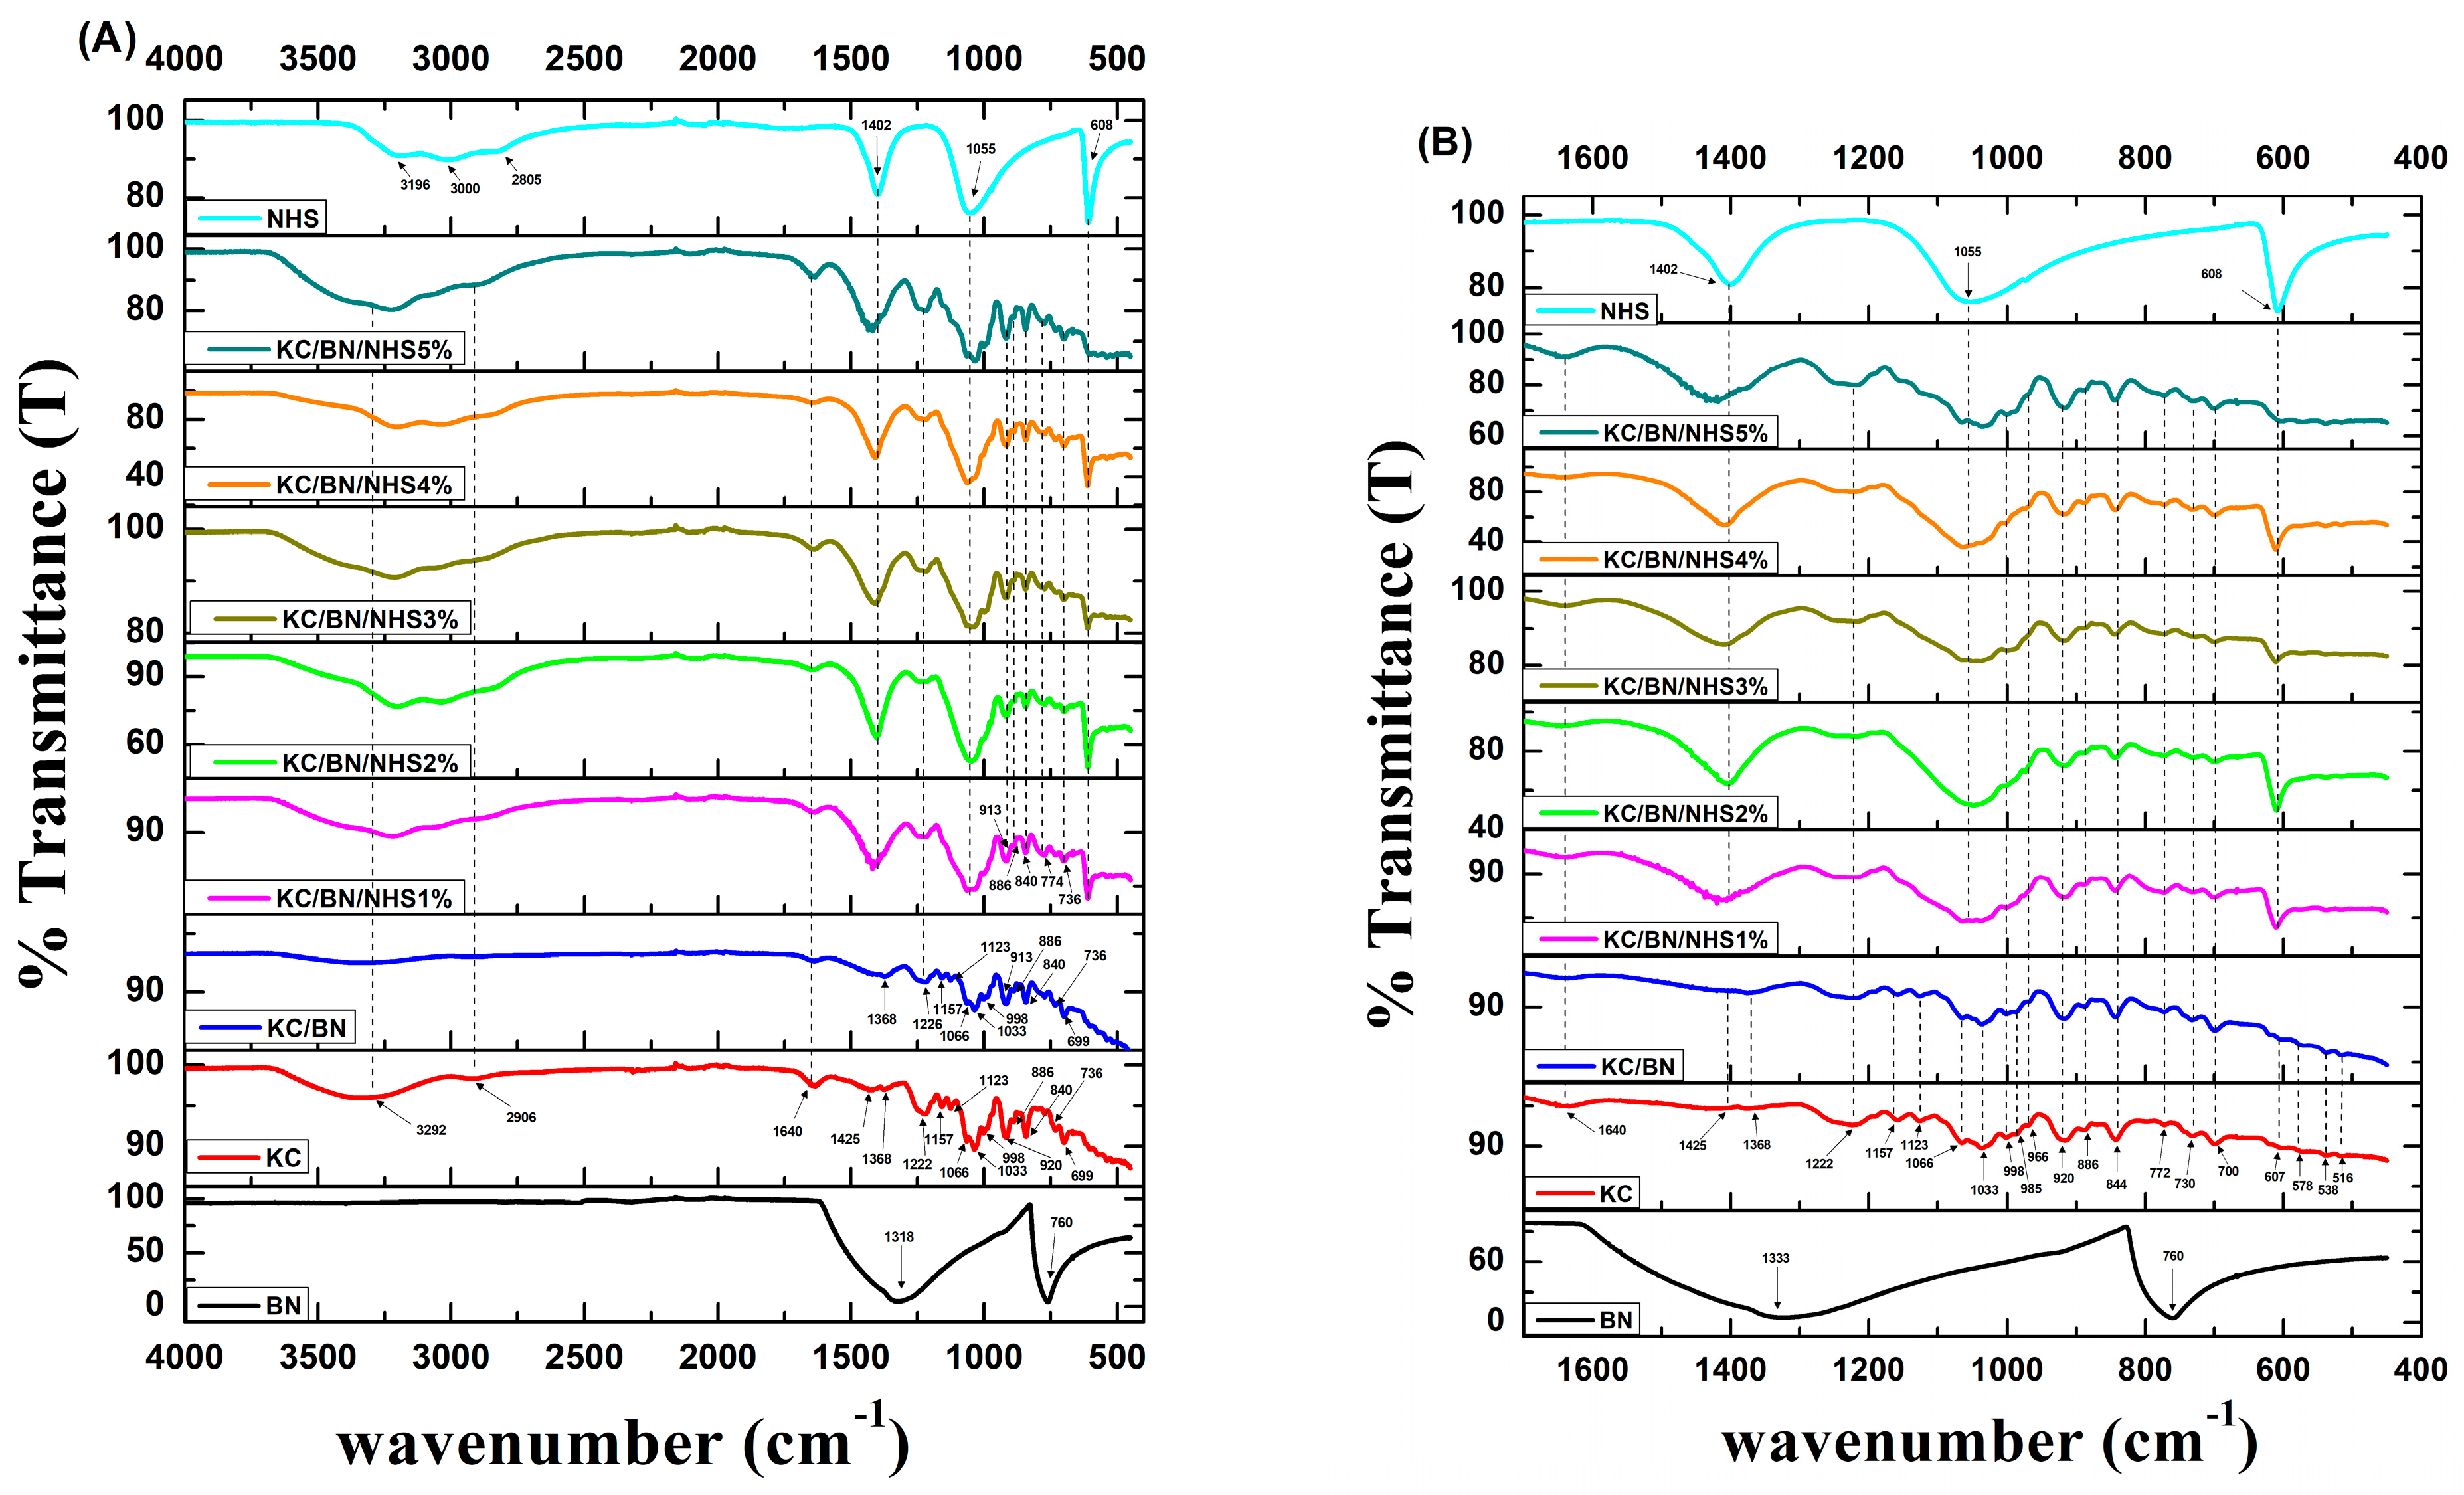
3.2. Chemical Composition

The FT-IR spectrum is show for different precursors and nanocomposites between 4000 and 450 cm1 (Figure 4A) and fingerprints at 1700 and 450 cm−1 (Figure 4B). In Figure 4A, the spectrum peaks are at 3292 and 3210 cm−1, corresponding to O-H stretching vibrations [66]. The most relevant region to study is the fingerprint region, corresponding to 1700 and 400 cm−1 (Figure 4B), where the peak at 1640 cm−1, corresponding to the water bounds of membranes. Furthermore, the peak 1222 cm−1 corresponds to the asymmetric stretching of the O=S=O. On the other hand, another characteristic band comprises the glycosidic bonds at 1064 and 1037 cm−1, together with the peak at 920 cm−1 belonging to the stretching vibration coupling of C-O-C in 3,6-anhydro-D-galactose (3,6-anhydrogalactose). As well as the galactose group C4-O-S (stretch) at 844 cm−1 and 700 cm−1, there is a C-O-C α(1,3) (stretch) at 730 cm−1. For the BN/KC/NHS1% sample, the signal characteristics of ammonium sulfate (NHS) are shown at 1402 cm−1, 1055 cm−1, and 608 cm−1. All these peaks are summarized in Table 2. The three peaks are observed in the different membranes with different concentrations of ammonium sulfate (2, 3, 4, and 5 wt %), evidencing this inorganic salt’s presence in the membranes. Boron nitride (BN) nanoparticles have two characteristic peaks, one at 1333 cm−1, corresponding to the stretching vibrations of B-N bonds, and another at 760 cm−1, corresponding to the bending vibrations of B-N-B [67,68,69]. However, these peaks are not significantly observed in the different BN-doped membranes.

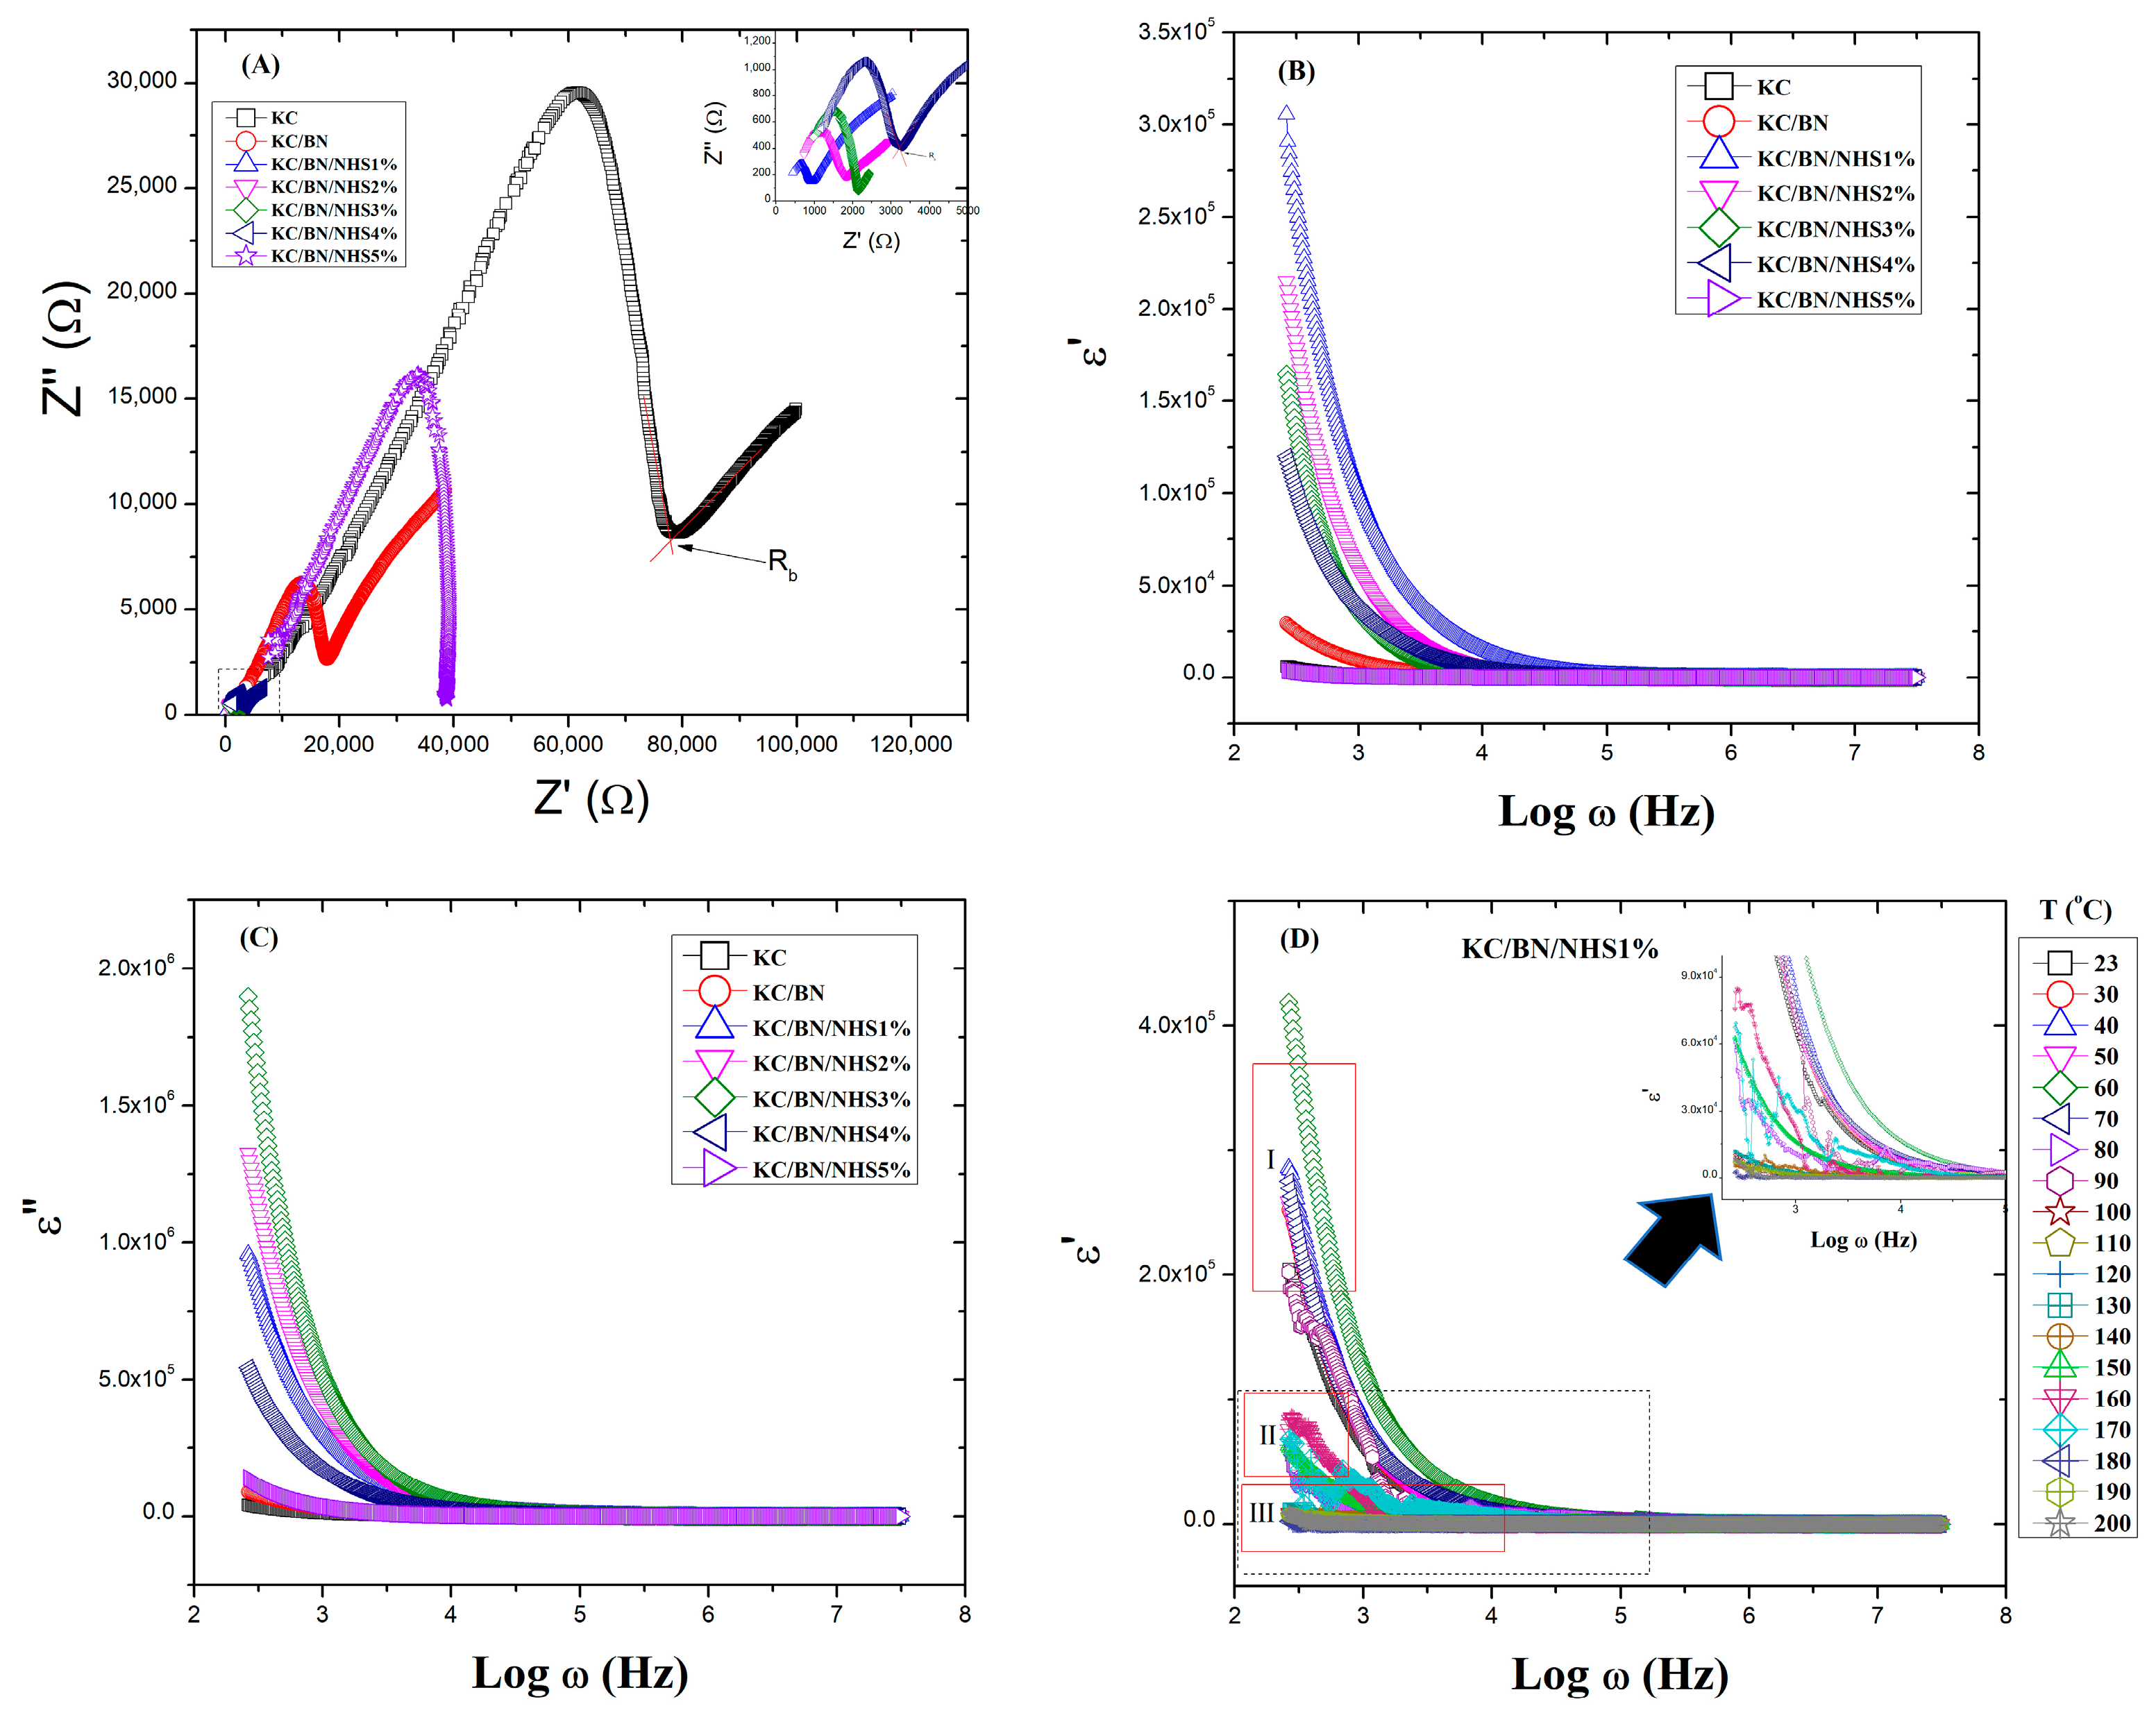
3.3. Electrical Properties

Understanding electrical properties is essential in determining the most significant potential for use in electrical devices. Figure 5A shows the Cole–Cole plot for the samples (KC, KC/BN, KC/BN/NHS1%, KC/BN/NHS2%, KC/BN/NHS3%, KC/BN/ NHS4%, and KC/BN/NHS5%). In the high-frequency area, we can see a reduction (by approximately four times) in the radius of the semicircle for the KC/BN membrane compared to the KC membrane. This continuous reduction in the KC/BN/NHS1% membrane reaches a minimum value. The process of decreasing ionic conduction is visible when the semicircle of the KC/BN/NHS membranes decreases. If we continue with the addition of NHS (KC/BN/NHS2%, KC/BN/NHS3%, KC/BN/NHS4%, and KC/BN/NHS5%), then the value of the radius of the semicircle increases. This increase in the semicircle value could be related to the agglomeration of the ions/charge carriers. For membranes, the low-frequency area has a tilted tip, which is related to the polarization effect at the electrode–electrolyte interface. The overall resistance Rb was obtained at the intersection of the semicircle and the sloping tip; this intersection is marked with red lines for the κ-carrageenan membrane and for KC/BN/NHS4% in the inserted Figure 5A. Knowing Rb, the ionic conductivity at room temperature was determined by the following equation:
σ = t R b A
The membrane thickness is t, the electrical resistance bulk is Rb, and the contact area of the electrodes is A. The measured conductivity values are displayed in Table 3. The KC membrane ionic conductivity value was 1.22 × 10⁶ S/cm, the same order of magnitude as that reported by Selvin et al. [76] and Liew et al. [77] for κ-carrageenan. When the KC membrane is doped with BN NPs, its ionic conductivity (KC/BN) increases. Adding BN nanoparticles favors the movement of hydrogen protons in the polymer chains, increasing the membrane’s conductivity. This increase in conductivity continues if we dope the membrane with NHS at 1 wt % concentration, reaching a maximum value of 7.82 × 10⁵ S/cm. By adding ammonium sulfate, NH4+ and SO4 ions contribute to increased conduction. However, as the concentration of the NHS increases, the conductivity values decrease. The decrease in conductivity for higher NHS concentrations could be due to saturation and screening by NH4+ and SO4 ions in the membrane’s polymeric network, hindering the passage of ions through the bulk.

Dielectric Study

The dielectric properties of many solids and liquids depend on frequency. The following equation describes this dispersion phenomenon for the complex dielectric constant:
ε * = ε i ε
ε′ and ε″ represent the real part and the imaginary part of the complex dielectric constant, respectively. ε′ is defined as the dielectric constant of the material, and ε″ is the dielectric loss related to the dissipation processes energy. The variation in ε′ and ε″ with frequency is shown in Figure 5B,C, respectively, for the different membranes. The values of ε′ and ε″ at low frequencies are high and then show a constant behavior at high frequencies. Similarly, as in conductivity measurements, the value of ε′ increases when we fill the KC membrane with BN Nps (KC/BN). This increase continues when we fill the KC/BN membrane with 1 wt % of NHS, for which ε′ reaches its maximum value at low frequencies. Previous studies reveal that some composites’ dielectric constant increases when the filler material increases [78]. The polarization effect of the dipoles, ions, or charge space could increase these values in the samples by interacting with electrodes [79]. If we continue adding NHS to the membranes (KC/BN/NHS2%, KC/BN/NHS3%, KC/BN/NHS4%, and KC/BN/NHS5%), then the values of ε′ begin to decrease at low frequencies. This decrease is attributed to the phenomenon of agglomeration by NH4+ and SO4 ions in the membranes, like the conductivity values. Figure 5A,B, show the dielectric constant and dielectric loss drop by several orders of magnitude due to dipoles and ions not being able to follow the high frequency of the applied electric field, reducing charge accumulation at the electrode/electrolyte interface. The value behaviors for ε′ are similar in order of magnitude to those reported by Hema et al. [79,80], making them good candidates for applications in electronic devices.
The behavior of the dielectric constant versus the frequency at different temperatures from room temperature to 200 °C is shown in Figure 5D. We observe three different behaviors of ε′, called phases I, II, and III. In the low-frequency region, corresponding to phase I, we see high values of ε′, from room temperature to 90 °C, reaching their maximum value at 60 °C. If we continue increasing the temperature, then we see a significant drop in ε′ from 100 °C, corresponding to phase II, up to 160 °C. These values continue to decrease up to an order of magnitude, concerning phase I, from 170 °C to 200 °C, for phase III. The behavior of ε′ for the three phases can be explained as follows: in phase I, we find water bound to the membrane (water embedded in a polymer network), which serves as a medium through which ions can quickly move through the bulk. As the temperature increases, more thermal energy increases the mobility of ions through the sample, reaching a maximum value of 60 °C. If we continue to increase the temperature, the embedded water begins to volatilize (see TGA and DSC measurements), hindering ions’ mobility through the polymer. In phase II, part of all of this water has evaporated, together with other decomposition processes around 160 °C, as observed in the TGA measurements, which makes ion mobility more difficult; finally, in phase III, we find another strong decomposition process, where it is probable that no water facilitates the movement of ions through the membrane, showing an intense decrease in the values of ε′. For high frequencies, the behavior of ε′ is analogous to that shown by the different membranes at room temperature.

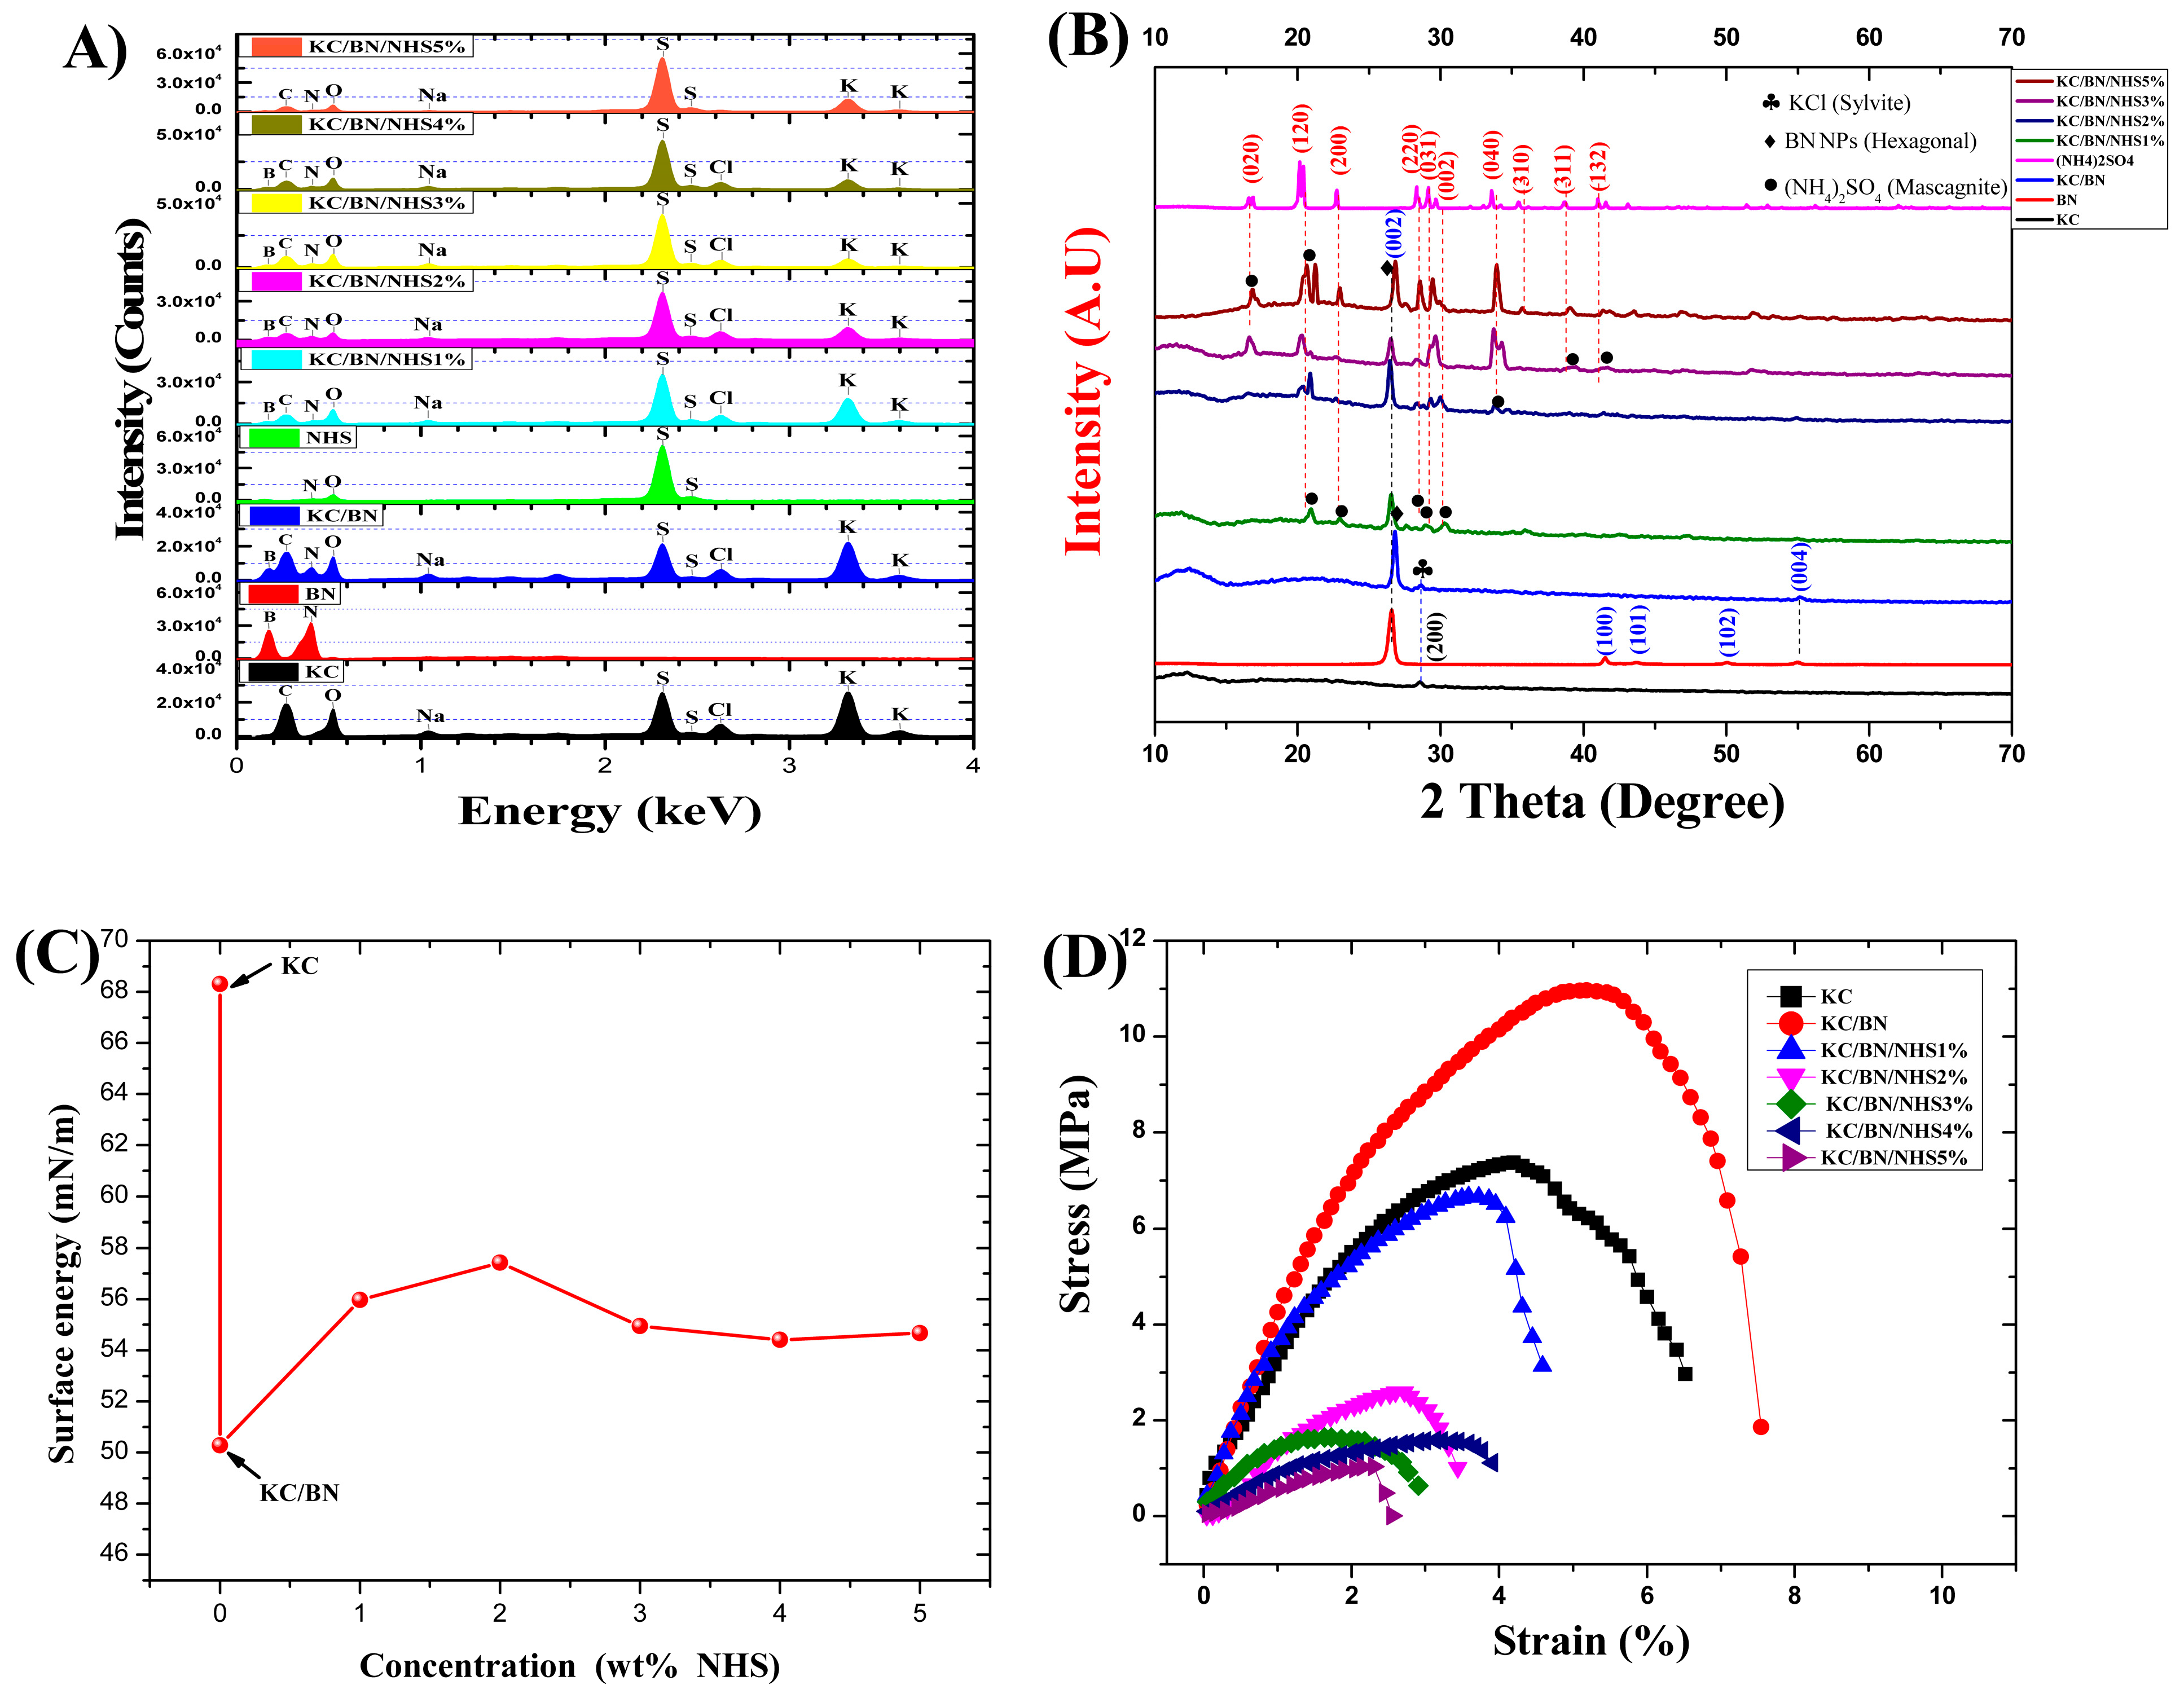
3.4. Morphology and Composition Analysis Samples (SEM-EDS)

It is essential in the manufacture of electronic devices that the morphology of the surface of the materials is known. Figure 6a shows an SEM micrograph for the amorphous surface of κ-carrageenan. Red circles indicate the presence of small KCl crystals. In Figure 6b, we observe the BN NPs as small lumps embedded in the surface of the KC (KC/BN membrane); these nanoparticles are shown more clearly in Figure 6c, which is a medium-magnification micrograph taken on pure BN NPs. Figure 6d shows the presence of large crystals corresponding to the inorganic NHS salt, along with small lumps of BN NPs that belong to the KC/BN membrane mixed with 1 wt % NHS (KC/BN /NHS1%). Pure NHS crystals are shown in Figure 6e.
For their part, Figure 6f–i show low-magnification SEM micrographs on the surfaces corresponding to the membranes KC/BN/NHS2%, KC/BN/NHS3%, KC/BN/NHS4%, and KC/BN/NHS5%, respectively. We observed the presence of the NHS salt with different morphologies as its concentration increased on the surface of the KC/BN membrane, which also changed, becoming less porous.
It is essential in elemental analysis that the chemical composition and abundance of the elements in membranes are studied. EDS identification of composition was performed on the different samples (KC, KC/BN, KC/BN/NHS1%, KC/BN/NHS2%, KC/BN/NHS3%, KC/BN/NHS4%, and KC /BN/NHS5%) and the compounds (the BN NPs and the NHS crystals) in areas identified by the SEM, as shown in Figure 7A. In the KC membrane, the principal signals correspond to the elements C, O, and S, which are shown in Figure 7A; additional elements of the polysaccharide structure (κ-carrageenan) correspond to K, Cl, and Na ions, belonging to inorganic salts, present in commercial carrageenan [59,81]. As expected, the spectrum of BN NPs shows peaks corresponding to both B and N. The membrane spectrum of KC/BN is shown as the sum of the above spectra (KC + BN NPs). On the other hand, in the spectrum of the NHS crystals, we observe the main peaks of N, O and S. When we begin to add different concentrations of NHS on the KC/BN membrane, we see a progressive increase in the intensity of the S element in membranes (KC/BN/NHS1%, KC/BN/NHS2%, KC/BN/NHS3%, KC/BN/NHS4%, and KC/BN/NHS5%) at 2.31 keV, reaching its maximum value at a concentration of 5 wt % (KC/BN/NHS5%). Table 4 shows a progressive increase in the NHS of membranes, which shows the relative abundance in mass % and atom % of elements in the different membranes and the compounds (BN NPs and NHS).

3.5. Identification of Structural Phases in Membranes Through X-Rays

In the EDS measurements, we identified different phases belonging to both κ-carrageenan and BN NPs and NHS. However, we are also interested in corroborating, through the X-ray technique, how these phases appear in the structure of the membranes and the type of structure that they possess. Figure 7B shows the diffractograms of the membranes, the BN NPs, and the NHS. In ascending order, we initially see the spectrum of κ-carrageenan, where we note its amorphous structure and a small peak at 2θ = 28.5° corresponding to the KCl (Sylvite) phase, typical of commercial carrageenan [59,81]. Next, we observe the diffractogram of the BN NPs, where the highly crystalline structure of this compound is observed, with peaks at 2θ = 26.5°, 41.5°, 43.3°, 50°, and 55° with Miller indices of (002), (100), (101), (102), (004), respectively, as has been reported [82,83,84,85]. Two phases are shown in the KC/BN membrane: the amorphous phase corresponding with κ-carrageenan and the other corresponding with the crystalline phase of the BN NPs, with its highest-intensity peak at 2θ = 26.5°. Following the ascent in Figure 7B, we see that the KC/BN/NHS1% membrane still shows the phases of its precursors (BN and κ-carrageenan), but now, the appearance of some peaks of the NHS crystalline phase is noted but with low intensity. If we continue to increase the concentration of NHS, additional peaks of this phase appear, along with an increase in its intensity at 2θ = 16.5°, 20.1°, 28.3°, 29.1°, 29.6°, 29.6°, 33.5°, 35.4°, 38.7 °, and 41.0° with Miller indices of (020), (120), (200), (220), (031), (002), (040), (310), (212), and (132), respectively, as reported for the NHS [86,87,88,89,90].

3.6. Surface Energy

Another important physicochemical property in the study of materials is surface tension. Therefore, surface energy measurements were conducted on the different membranes, as shown in Figure 7C. In this Figure, we observe a sharp drop in surface energy when adding the BN NPs to the KC membrane, which indicates that the membrane becomes more hydrophilic, making it more wettable. This drastic reduction in surface energy is possibly due to the partially ionic structure of BN NPs, which facilitates the electrostatic interaction with the OSO3 groups and the OH [91,92] groups belonging to κ-carrageenan This helps the interaction of water molecules on the surface of the KC/BN membrane, making it more hydrophilic. However, when adding the NHS, we notice an increase in surface energy, which remains relatively constant as the concentration of the NHS increases. This increase in surface energy is possibly due to the change in the morphology of the membranes when adding the NHS, as observed in the SEM micrographs. However, the contact angle values do not show a systematic trend with the variation in NHS concentration. The values for surface tension and contact angle values are indicated in Table 5.

3.7. Mechanical Properties

The other membrane characterization, stress vs. strain, is shown in Figure 7D. As we noted, the KC membrane shows an ultimate tensile stress value of 7.36 MPa and an elongation at a break of 6.5%, corresponding to those reported for this membrane [93,94]. When the BN NPs are added, significant increases in the values of ultimate tensile stress, elongation at break, and Young’s modulus values are observed; these are of 10.96 MPa, 7.2%, and 3.73 MPa, respectively, which shows how the mechanical properties of the samples are improved. According to Nogueira et al. [94], the increase in membrane rigidity could represent the cross-linking points established between the nanoparticles and polymeric chains of κ-carrageenan. Table 6 shows the different values of the ultimate tensile stress, elongation at break, and Young’s modulus of each of the membranes. This Table shows the ultimate tensile stress, elongation at break, and Young’s modulus values decreasing for the NHS in different concentrations, this is possibly due to the ionic interaction of salt and the cross-linking points in the KC/BN, weakening the interaction of different polymer chains, forming a membrane that is more straightforward to break.

3.8. Implications

The novel biodegradable membrane, crafted from κ-carrageenan (KC) and boron nitride (BN) nanoparticles, optimized with ammonium sulfate (NHS), offers broad applications across sustainable energy and environmental technologies. Primarily utilized in fuel cell technology in proton exchange membranes, KC provides a biodegradable matrix for proton conduction. At the same time, BN enhances mechanical and thermal stability. These properties are shown in Table 7 These membranes also function as electrolyte separators in batteries, selective filtration media in water purification, sensors in environmental monitoring, controlled drug release systems in biomedical applications, and CO2 capture and separation aids in environmental management. Additionally, they are used in hydrogen production for renewable energy systems and smart packaging for the food industry, responding dynamically to environmental changes.

4. Conclusions

Using an environmentally friendly method (solvent evaporation), κ-carrageenan and BN nanocomposites with different concentrations of NHS were synthesized. The thermal stability of the membranes was studied through DSC and TGA. In the DSC measurements, the κ-carrageenan membrane with 5 wt % of BN (KC/BN) presents a shift in the peak of 3 °C, moving towards a temperature of 215 °C, with a reduction to approximately half of its enthalpy of 68.8 J/g. For their part, the KC/BN/NHS membranes with different concentrations of NHS (1, 2, 3, 4, and 5 wt %) do not observe the exothermic peak due to the aggregation of the NHS. In the TGA measurements, the samples present a loss of 10% of mass around 100 °C, which corresponds to the loss of water (KC, KC/BN, KC/BN/NHS1%, KC/BN/NHS2%, KC/BN/NHS3%, KC/BN/NHS4%, and KC/BN/NHS5%) observed in the DSC measurement. Furthermore, membranes doped with NHS show a loss between 10% and 15% by weight around 160 °C, which could be related to CO2 volatilization. These same membranes present the characteristic peaks of the NHS, at 1402 cm−1, corresponding to ammonium ions, and at 1055 cm−1 and 608 cm−1, belonging to sulfate ions, in the FTIR measurements. The conductivity of the ionic species was confirmed by impedance measurements, giving a maximum value of 7.82 × 10⁻⁵ S/cm for KC/BN/NHS1%, whose dielectric constant ε′ reaches its maximum value at 60 °C. In the SEM micrographs, different BN NPs are observed, along with NHS crystals, in addition to traces of K and Cl belonging to the commercial κ-carrageenan, which are corroborated in the EDS measurements, where the main peaks of these compounds are shown. The KC/BN membrane has a minimum value for surface free energy, which makes it more hydrophilic. On the other hand, it shows maximum values for ultimate tensile stress, elongation at break, and Young’s modulus of 10.96 MPa, 7.2%, and 3.73 MPa, respectively.

Author Contributions

The authors of this article contributed equally to the completion of this manuscript and participated in the design, execution, analysis, and writing. E.C.-B. worked on the synthesis of the nanocomposites, carried out some characterizations, analyzed the data, and wrote this manuscript; C.A.M.-R. contributed to the writing and revision of the manuscript; R.M. worked on the impedance spectroscopy and studied the data; L.M.D.-V. and P.F. edited and reviewed this manuscript and also worked on supervision and the acquisition of funds to develop this research. All authors have read and agreed to the published version of the manuscript.

Funding

This research was supported by National Science Foundation NSF-CREST-CIRE2N—NSF-HRD #1736093, Department of Education MSEIP program with GRANT # P120A210035, the NSF-EPSCoR Center for the Advancement of Wearable Technologies with award No. NSF OIA-1849243, and NASA MIRO PR-SPRINT GRANT # 80NSSC19M0236. Any opinions, findings, conclusions, or recommendations expressed in this material are those of the author(s) and do not necessarily reflect the views of the National Science Foundation or NASA.

Data Availability Statement

The original contributions presented in this study are included in the article. Further inquiries can be directed to the corresponding authors.

Acknowledgments

The authors acknowledge the U.P.R. Materials Characterization Center (MCC), for providing some measuring equipment for this work Nicolau’s laboratory, and doctoral students Luis Bermudez Morales and Samir A. Bello for helping with the measurements of hydrophobicity and mechanical properties.

Conflicts of Interest

The authors declare no conflicts of interest.

Acronyms

κ-Carrageenan(KC)
Boron nitride(BN)
Ammonium sulfate(NHS)
Thermogravimetric analysis(TGA)
Differential scanning calorimetry(DSC)
X-ray diffraction(XRD)
Scanning electron microscopy(SEM)
Energy-dispersive X-ray spectroscopy(EDS)
Fourier transform infrared spectroscopy(FTIR)
Impedance spectroscopy(IS)
Ammonium chloride(NH4Cl)
Ammonium bromide(NH4Br)
O-methylene phosphonic κ-carrageenan(OMPC)
Carboxycellulose nanofibers(CNFs)
Poly(perfluorosulfonic acids)(PFAs)
Perfluorosulfonic acid ionomers(PFSIs)
KC/BN/NHS1, 2, 3, 4, and 5%κ-carrageenan/boron nitride/variation in the concentration of ammonium sulfate

References

  1. Samsudin, A.M.; Roschger, M.; Wolf, S.; Hacker, V. Preparation and Characterization of QPVA/PDDA Electrospun Nanofiber Anion Exchange Membranes for Alkaline Fuel Cells. Nanomaterials 2022, 12, 3965. [Google Scholar] [CrossRef] [PubMed]
  2. Khan, M.I.; Shanableh, A.; Shahida, S.; Lashari, M.H.; Manzoor, S.; Fernandez, J. SPEEK and SPPO Blended Membranes for Proton Exchange Membrane Fuel Cells. Membranes 2022, 12, 263. [Google Scholar] [CrossRef]
  3. Peighambardoust, S.J.; Rowshanzamir, S.; Amjadi, M. Review of the proton exchange membranes for fuel cell applications. Int. J. Hydrogen Energy 2010, 35, 9349–9384. [Google Scholar] [CrossRef]
  4. Zhang, J.; Zhang, H.; Wu, J.; Zhang, J.; Boston, A.L.; London, H.L. PEM Fuel Cell Testing and Diagnosis; Newnes: London, UK, 2013. [Google Scholar]
  5. Fan, L.; Tu, Z.; Chan, S.H. Recent development of hydrogen and fuel cell technologies: A review. Energy Rep. 2021, 7, 8421–8446. [Google Scholar] [CrossRef]
  6. Bonato, M.; Corrà, F.; Bellio, M.; Guidolin, L.; Tallandini, L.; Irato, P.; Santovito, G. Pfas environmental pollution and antioxidant responses: An overview of the impact on human field. Int. J. Environ. Res. Public. Health 2020, 17, 8020. [Google Scholar] [CrossRef] [PubMed]
  7. Lukić Bilela, L.; Matijošytė, I.; Krutkevičius, J.; Alexandrino, D.A.M.; Safarik, I.; Burlakovs, J.; Gaudêncio, S.P.; Carvalho, M.F. Impact of per- and polyfluorinated alkyl substances (PFAS) on the marine environment: Raising awareness, challenges, legislation, and mitigation approaches under the One Health concept. Mar. Pollut. Bull. 2023, 194, 115309. [Google Scholar] [CrossRef]
  8. Kurwadkar, S.; Dane, J.; Kanel, S.R.; Nadagouda, M.N.; Cawdrey, R.W.; Ambade, B.; Struckhoff, G.C.; Wilkin, R. Per- and polyfluoroalkyl substances in water and wastewater: A critical review of their global occurrence and distribution. Sci. Total Environ. 2022, 809, 151003. [Google Scholar] [CrossRef] [PubMed]
  9. Liu, C.; Luan, P.; Li, Q.; Cheng, Z.; Xiang, P.; Liu, D.; Hou, Y.; Yang, Y.; Zhu, H. Biopolymers Derived from Trees as Sustainable Multifunctional Materials: A Review. Adv. Mater. 2021, 33, e2001654. [Google Scholar] [CrossRef]
  10. George, A.; Sanjay, M.R.; Srisuk, R.; Parameswaranpillai, J.; Siengchin, S. A comprehensive review on chemical properties and applications of biopolymers and their composites. Int. J. Biol. Macromol. 2020, 154, 329–338. [Google Scholar] [CrossRef]
  11. Abouricha, S.; Aziam, H.; Noukrati, H.; Sel, O.; Saadoune, I.; Lahcini, M.; Ben Youcef, H. Biopolymers-Based Proton Exchange Membranes For Fuel Cell Applications: A Comprehensive Review. ChemElectroChem 2024, 11, e202300648. [Google Scholar] [CrossRef]
  12. Doobi, F.A.; Mir, F.Q. Exploring the development of natural biopolymer (chitosan)-based proton exchange membranes for fuel cells: A review. Results Surf. Interfaces 2024, 15, 100218. [Google Scholar] [CrossRef]
  13. Ma, J.; Sahai, Y. Chitosan biopolymer for fuel cell applications. Carbohydr. Polym. 2013, 92, 955–975. [Google Scholar] [CrossRef] [PubMed]
  14. Dalwadi, S.; Goel, A.; Kapetanakis, C.; Salas-De La Cruz, D.; Hu, X. The Integration of Biopolymer-Based Materials for Energy Storage Applications: A Review. Int. J. Mol. Sci. 2023, 24, 3975. [Google Scholar] [CrossRef]
  15. Nur, N.F.; Shyuan, L.K.; Mohamad, A.B.; Kadhum, A.A.H. Review on biopolymer membranes for fuel cell applications. Appl. Mech. Mater. 2013, 291–294, 614–617. [Google Scholar] [CrossRef]
  16. Myrzakhmetov, B.; Akhmetova, A.; Bissenbay, A.; Karibayev, M.; Pan, X.; Wang, Y.; Bakenov, Z.; Mentbayeva, A. Review: Chitosan-based biopolymers for anion-exchange membrane fuel cell application. R. Soc. Open Sci. 2023, 10, 230843. [Google Scholar] [CrossRef] [PubMed]
  17. Samoila, P.; Grecu, I.; Asandulesa, M.; Cojocaru, C.; Harabagiu, V. Bio-based ionically cross-linked alginate composites for PEMFC potential applications. React. Funct. Polym. 2021, 165, 104967. [Google Scholar] [CrossRef]
  18. Shaari, N.; Kamarudin, S.K. Chitosan and alginate types of bio-membrane in fuel cell application: An overview. J. Power Sources 2015, 289, 71–80. [Google Scholar] [CrossRef]
  19. Liew, J.W.Y.; Loh, K.S.; Ahmad, A.; Lim, K.L.; Wan Daud, W.R. Synthesis and characterization of modified κ-carrageenan for enhanced proton conductivity as polymer electrolyte membrane. PLoS ONE 2017, 12, e0185313. [Google Scholar] [CrossRef]
  20. Christwardana, M.; Kuntolaksono, S.; Septevani, A.A.; Hadiyanto, H. Starch—Carrageenan based low-cost membrane permeability characteristic and its application for yeast microbial fuel cells. Int. J. Renew. Energy Dev. 2024, 13, 303–314. [Google Scholar] [CrossRef]
  21. Esmaeili, C.; Ghasemi, M.; Heng, L.Y.; Hassan, S.H.A.; Abdi, M.M.; Daud, W.R.W. Synthesis and application of polypyrrole/carrageenan nano-bio composite as a cathode catalyst in microbial fuel cells. Carbohydr. Polym. 2014, 114, 253–259. [Google Scholar] [CrossRef]
  22. Prado-Fernández, J.; Rodríguez-Vázquez, J.A.; Tojo, E.; Andrade, J.M. Quantitation of κ-, ι- and λ-carrageenans by mid-infrared spectroscopy and PLS regression. Anal. Chim. Acta 2003, 480, 23–37. [Google Scholar] [CrossRef]
  23. Belton, P.S.; Wilson, R.H. Interaction of group I cations with iota and kappa carrageenans studied by Fourier transform infrared spectroscopy. Int. J. Biol. Macromol. 1986, 8, 247–251. [Google Scholar] [CrossRef]
  24. Necas, J.; Bartosikova, L. Carrageenan: A review. Vet. Med. 2013, 58, 187–205. [Google Scholar] [CrossRef]
  25. Tasende, M.G.; Manriquez-Hernandez, J. Carrageenan Properties and Applications: A Review. In Carrageenans: Sources and Extraction Methods, Molecular Structure, Bioactive Properties and Health Effects; Nova Science Publishers: Hauppauge, NY, USA, 2016. [Google Scholar]
  26. An, D.; Cheng, S.; Jiang, C.; Duan, X.; Yang, B.; Zhang, Z.; Li, J.; Liu, Y.; Wong, C.-P. A novel environmentally friendly boron nitride/lignosulfonate/natural rubber composite with improved thermal conductivity. J. Mater. Chem. C Mater. 2020, 8, 4801–4809. [Google Scholar] [CrossRef]
  27. Cheng, Z.L.; Ma, Z.S.; Ding, H.L.; Liu, Z. Environmentally friendly, scalable exfoliation for few-layered hexagonal boron nitride nanosheets (BNNSs) by multi-time thermal expansion based on released gases. J. Mater. Chem. C Mater. 2019, 7, 14701–14708. [Google Scholar] [CrossRef]
  28. Mehmet Ay, G.; Göncü, Y.; Ay, N. Environmentally friendly material: Hexagonal boron nitride. J. Boron 2016, 1, 66–73. [Google Scholar]
  29. Arenal, R.; Lopez-Bezanilla, A. Boron nitride materials: An overview from 0D to 3D (nano)structures. Wiley Interdiscip. Rev. Comput. Mol. Sci. 2015, 5, 299–309. [Google Scholar] [CrossRef]
  30. Han, W.; Ma, Z.; Liu, S.; Ge, C.; Wang, L.; Zhang, X. Highly-dispersible boron nitride nanoparticles by spray drying and pyrolysis. Ceram. Int. 2017, 43, 10192–10200. [Google Scholar] [CrossRef]
  31. Konzock, O.; Zaghen, S.; Fu, J.; Kerkhoven, E.J. Urea is a drop-in nitrogen source alternative to ammonium sulphate in Yarrowia lipolytica. IScience 2022, 25, 105703. [Google Scholar] [CrossRef] [PubMed]
  32. Chien, S.H.; Gearhart, M.M.; Villagarcía, S. Comparison of ammonium sulfate with other nitrogen and sulfur fertilizers in increasing crop production and minimizing environmental impact: A review. Soil. Sci. 2011, 176, 327–335. [Google Scholar] [CrossRef]
  33. Hassan, M.A.; Gouda, M.E.; Sheha, E. Investigations on the electrical and structural properties of PVA doped with (NH4)2SO4. J. Appl. Polym. Sci. 2010, 116, 1213–1217. [Google Scholar] [CrossRef]
  34. Vilela, C.; Morais, J.D.; Silva, A.C.Q.; Muñoz-Gil, D.; Figueiredo, F.M.L.; Silvestre, A.J.D.; Freire, C.S.R. Flexible nanocellulose/lignosulfonates ion-conducting separators for polymer electrolyte fuel cells. Nanomaterials 2020, 10, 1713. [Google Scholar] [CrossRef] [PubMed]
  35. Kawabata, T.; Matsuo, Y. Chitin Based Fuel Cell and Its Proton Conductivity. Mater. Sci. Appl. 2018, 9, 779–789. [Google Scholar] [CrossRef]
  36. Pasini Cabello, S.D.; Mollá, S.; Ochoa, N.A.; Marchese, J.; Giménez, E.; Compañ, V. New bio-polymeric membranes composed of alginate-carrageenan to be applied as polymer electrolyte membranes for DMFC. J. Power Sources 2014, 265, 345–355. [Google Scholar] [CrossRef]
  37. Mohy Eldin, M.S.; Farag, H.A.; Tamer, T.M.; Konsowa, A.H.; Gouda, M.H. Development of novel iota carrageenan-g-polyvinyl alcohol polyelectrolyte membranes for direct methanol fuel cell application. Polym. Bull. 2020, 77, 4895–4916. [Google Scholar] [CrossRef]
  38. Vijaya, N.; Selvasekarapandian, S.; Sornalatha, M.; Sujithra, K.S.; Monisha, S. Proton-conducting biopolymer electrolytes based on pectin doped with NH4X (X = Cl, Br). Ionics 2017, 23, 2799–2808. [Google Scholar] [CrossRef]
  39. Shukur, M.F.; Kadir, M.F.Z.; Ahmad, Z.; Ithnin, R. Dielectric studies of proton conducting polymer electrolyte based on chitosan/PEO blend doped with NH 4NO 3. Adv. Mater. Res. 2012, 488–489, 583–587. [Google Scholar] [CrossRef]
  40. Moniha, V.; Alagar, M.; Selvasekarapandian, S.; Sundaresan, B.; Boopathi, G. Conductive bio-polymer electrolyte iota-carrageenan with ammonium nitrate for application in electrochemical devices. J. Non Cryst. Solids 2018, 481, 424–434. [Google Scholar] [CrossRef]
  41. Li, S.; Cai, G.; Wu, S.; Raut, A.; Borges, W.; Sharma, P.R.; Sharma, S.K.; Hsiao, B.S.; Rafailovich, M. Sustainable Plant-Based Biopolymer Membranes for PEM Fuel Cells. Int. J. Mol. Sci. 2022, 23, 15245. [Google Scholar] [CrossRef]
  42. Smitha, B.; Sridhar, S.; Khan, A.A. Chitosan-sodium alginate polyion complexes as fuel cell membranes. Eur. Polym. J. 2005, 41, 1859–1866. [Google Scholar] [CrossRef]
  43. Sigwadi, R.; Dhlamini, M.S.; Mokrani, T.; Ṋemavhola, F.; Nonjola, P.F.; Msomi, P.F. The proton conductivity and mechanical properties of Nafion®/ ZrP nanocomposite membrane. Heliyon 2019, 5, e02240. [Google Scholar] [CrossRef] [PubMed]
  44. Zakuwan, S.Z.; Ahmad, I. Effects of hybridized organically modified montmorillonite and cellulose nanocrystals on rheological properties and thermal stability of K-carrageenan bio-nanocomposite. Nanomaterials 2019, 9, 1547. [Google Scholar] [CrossRef]
  45. Surowiec, J.; Bogoczek, R. Studies on the thermal stability of the perfluorinated cation-exchange membrane nafion-417. J. Therm. Anal. 1988, 33, 1097–1102. [Google Scholar] [CrossRef]
  46. Lee, E.J.; Shin, D.S.; Kim, H.E.; Kim, H.W.; Koh, Y.H.; Jang, J.H. Membrane of hybrid chitosan-silica xerogel for guided bone regeneration. Biomaterials 2009, 30, 743–750. [Google Scholar] [CrossRef] [PubMed]
  47. Kundu, S.; Simon, L.C.; Fowler, M.; Grot, S. Mechanical properties of NafionTM electrolyte membranes under hydrated conditions. Polymer 2005, 46, 11707–11715. [Google Scholar] [CrossRef]
  48. Sonef, Y.; Ekdunge, P.; Simonsson, D. Proton Conductivily of Nafion 117 as Measured by a Four-Electrode AC Impedance Method. J. Electrochem. Soc. 1996, 143, 1254. [Google Scholar] [CrossRef]
  49. Che Balian, S.R.; Ahmad, A.; Mohamed, N.S. The effect of lithium iodide to the properties of carboxymethyl κ-carrageenan/carboxymethyl cellulose polymer electrolyte and dye-sensitized solar cell performance. Polymers 2016, 8, 163. [Google Scholar] [CrossRef] [PubMed]
  50. Lin, H.L.; Yu, T.L.; Han, F.H. A method for improving ionic conductivity of nafion membranes and its application to PEMFC. J. Polym. Res. 2006, 13, 379–385. [Google Scholar] [CrossRef]
  51. Walkowiak-Kulikowska, J.; Wolska, J.; Koroniak, H. Polymers application in proton exchange membranes for fuel cells (PEMFCs). Phys. Sci. Rev. 2017, 293-347, 293–347. [Google Scholar] [CrossRef]
  52. Karaca, A.; Galkina, I.; Sohn, Y.J.; Wippermann, K.; Scheepers, F.; Glüsen, A.; Shviro, M.; Müller, M.; Carmo, M.; Stolten, D. Self-Standing, Ultrasonic Spray-Deposited Membranes for Fuel Cells. Membranes 2023, 13, 522. [Google Scholar] [CrossRef]
  53. Di Virgilio, M.; Basso Peressut, A.; Arosio, V.; Arrigoni, A.; Latorrata, S.; Dotelli, G. Functional and Environmental Performances of Novel Electrolytic Membranes for PEM Fuel Cells: A Lab-Scale Case Study. Clean. Technol. 2023, 5, 74–93. [Google Scholar] [CrossRef]
  54. Krafft, M.P.; Riess, J.G. Per- and polyfluorinated substances (PFASs): Environmental challenges. Curr. Opin. Colloid. Interface Sci. 2015, 20, 192–212. [Google Scholar] [CrossRef]
  55. Lindstrom, A.B.; Strynar, M.J.; Libelo, E.L. Polyfluorinated compounds: Past, present, and future. Environ. Sci. Technol. 2011, 45, 7954–7961. [Google Scholar] [CrossRef] [PubMed]
  56. Mudumbi, J.B.N.; Ntwampe, S.K.O.; Matsha, T.; Mekuto, L.; Itoba-Tombo, E.F. Recent developments in polyfluoroalkyl compounds research: A focus on human/environmental health impact, suggested substitutes and removal strategies. Environ. Monit. Assess. 2017, 189, 402. [Google Scholar] [CrossRef] [PubMed]
  57. Chavez-Baldovino, E.; Malca-Reyes, C.A.; Masso, R.; Feng, P.; Camacho, A.; Sarmiento, J.; Negrón, J.I.B.; Pagán-Torres, Y.J.; Díaz-Vázquez, L.M. Optimizing Sustainable Energy Generation in Ethanol Fuel Cells: An Exploration of Carrageenan with TiO 2 Nanoparticles and Ni/CeO 2 Composites. ACS Omega 2023, 8, 20642–20653. [Google Scholar] [CrossRef]
  58. Lizundia, E.; Urruchi, A.; Vilas, J.L.; León, L.M. Increased functional properties and thermal stability of flexible cellulose nanocrystal/ZnO films. Carbohydr. Polym. 2016, 136, 250–258. [Google Scholar] [CrossRef] [PubMed]
  59. Petkova, V.; Pelovski, Y.; Hristova, V. Introduction thermal analysis for identification of e-beam nanosize ammonium sulfate. J. Therm. Anal. Calorim. 2005, 82, 813–817. [Google Scholar] [CrossRef]
  60. Sadeghi, M. Synthesis of a biocopolymer carrageenan-g-poly(aam-co-ia)/ montmorilonite superabsorbent hydrogel composite. Braz. J. Chem. Eng. 2012, 29, 295–305. [Google Scholar] [CrossRef]
  61. Zhou, F.; Wang, D.; Zhang, J.; Li, J.; Lai, D.; Lin, S.; Hu, J. Preparation and Characterization of Biodegradable κ-Carrageenan Based Anti-Bacterial Film Functionalized with Wells-Dawson Polyoxometalate. Foods 2022, 11, 586. [Google Scholar] [CrossRef]
  62. Wang, N.; Teng, H.; Li, L.; Zhang, J.; Kang, P. Synthesis of phosphated K-carrageenan and its application for flame-retardant waterborne epoxy. Polymers 2018, 10, 1268. [Google Scholar] [CrossRef]
  63. Mishra, D.K.; Tripathy, J.; Behari, K. Synthesis of graft copolymer (k-carrageenan-g-N,N-dimethylacrylamide) and studies of metal ion uptake, swelling capacity and flocculation properties. Carbohydr. Polym. 2008, 71, 524–534. [Google Scholar] [CrossRef]
  64. Pereira, L.; Amado, A.M.; Critchley, A.T.; van de Velde, F.; Ribeiro-Claro, P.J.A. Identification of selected seaweed polysaccharides (phycocolloids) by vibrational spectroscopy (FTIR-ATR and FT-Raman). Food Hydrocolloids 2009, 23, 1903–1909. [Google Scholar] [CrossRef]
  65. Muthu, R.N.; Rajashabala, S.; Kannan, R. Synthesis, characterization of hexagonal boron nitride nanoparticles decorated halloysite nanoclay composite and its application as hydrogen storage medium. Renew. Energy 2016, 90, 554–564. [Google Scholar] [CrossRef]
  66. Madakbaş, S.; Çakmakçi, E.; Kahraman, M.V. Preparation and thermal properties of polyacrylonitrile/hexagonal boron nitride composites. Thermochim. Acta 2013, 552, 1–4. [Google Scholar] [CrossRef]
  67. Iger, S.J.; Bewilogua, K.; Klages, C.-P. Infrared spectroscopic investigations on h-BN and mixed h/c-BN thin films. Thin Solid Films 1994, 245, 50–55. [Google Scholar] [CrossRef]
  68. Şen, M.; Erboz, E.N. Determination of critical gelation conditions of κ-carrageenan by viscosimetric and FT-IR analyses. Food Res. Int. 2010, 43, 1361–1364. [Google Scholar] [CrossRef]
  69. Mobarak, N.N.; Ramli, N.; Ahmad, A.; Rahman, M.Y.A. Chemical interaction and conductivity of carboxymethyl κ-carrageenan based green polymer electrolyte. Solid. State Ion. 2012, 224, 51–57. [Google Scholar] [CrossRef]
  70. Fan, L.; Peng, K.; Li, M.; Wang, L.; Wang, T. Preparation and properties of carboxymethyl κ -carrageenan / alginate blend fibers. J. Biomater. Sci. Polym. Ed. 2013, 24, 1099–1111. [Google Scholar] [CrossRef] [PubMed]
  71. Daud, J.M.; Warzukni, N.S.; Salim, R.M.; Zuberdi, A.M. Semi-refined κ-carrageenan: Part 1. Chemical modification of semi-refined κ-carrageenan via graft copolymerization method, optimization process and characterization of its super absorbent hydrogel. Orient. J. Chem. 2015, 31, 973–980. [Google Scholar] [CrossRef]
  72. Pereira, L.; Sousa, A.; Coelho, H.; Amado, A.M.; Ribeiro-Claro, P.J.A. Use of FTIR, FT-Raman and13C-NMR spectroscopy for identification of some seaweed phycocolloids. Biomol. Eng. 2003, 20, 223–228. [Google Scholar] [CrossRef] [PubMed]
  73. Ahmad, W.; Mahmood, K.; Mizanur, M.; Khan, R.; Yee, T.C. Effects of Reaction Temperature on the Synthesis and Thermal Properties of Carrageenan Ester. J. Phys. Sci. 2014, 25, 123–138. [Google Scholar] [CrossRef]
  74. Selvin, P.C.; Perumal, P.; Selvasekarapandian, S.; Monisha, S.; Boopathi, G.; Chandra, M.V.L. Study of proton-conducting polymer electrolyte based on K-carrageenan and NH 4 SCN for electrochemical devices. Ionics 2018, 24, 3535–3542. [Google Scholar] [CrossRef]
  75. Huang, X.; Wang, S.; Zhu, M.; Yang, K.; Jiang, P.; Bando, Y.; Golberg, D.; Zhi, C. Thermally conductive, electrically insulating and melt-processable polystyrene/boron nitride nanocomposites prepared by in situ reversible addition fragmentation chain transfer polymerization. Nanotechnology 2015, 26, 015705. [Google Scholar] [CrossRef]
  76. Hema, M.; Selvasekarapandian, S.; Arunkumar, D.; Sakunthala, A.; Nithya, H. Author ’ s personal copy FTIR, XRD and ac impedance spectroscopic study on PVA based polymer electrolyte doped with NH4X ( X = Cl, Br, I). J. Non Cryst. Solids 2009, 355, 84–90. [Google Scholar] [CrossRef]
  77. Moniha, V.; Alagar, M.; Selvasekarapandian, S.; Sundaresan, B.; Hemalatha, R.; Boopathi, G. Synthesis and characterization of bio-polymer electrolyte based on iota-carrageenan with ammonium thiocyanate and its applications. J. Solid. State Electrochem. 2018, 22, 3209–3223. [Google Scholar] [CrossRef]
  78. Bantang, J.P.O.; Bigol, U.G.; Camacho, D.H. Gel and Film Composites of Silver Nanoparticles in κ-, ι-, and λ-Carrageenans: One-Pot Synthesis, Characterization, and Bioactivities. Bionanoscience 2021, 11, 53–66. [Google Scholar] [CrossRef]
  79. Zhi, C.; Bando, Y.; Tang, C.; Honda, S.; Sato, K.; Kuwahara, H.; Golberg, D. Characteristics of boron nitride nanotube-polyaniline composites. Angew. Chem.—Int. Ed. 2005, 44, 7929–7932. [Google Scholar] [CrossRef]
  80. Harrison, H.; Lamb, J.T.; Nowlin, K.S.; Guenthner, A.J.; Ghiassi, K.B.; Kelkar, A.D.; Alston, J.R. Quantification of hexagonal boron nitride impurities in boron nitride nanotubes: Via FTIR spectroscopy. Nanoscale Adv. 2019, 1, 1693–1701. [Google Scholar] [CrossRef] [PubMed]
  81. Dash, S.; Swain, S.K. Effect of nanoboron nitride on the physical and chemical properties of soy protein. Compos. Sci. Technol. 2013, 84, 39–43. [Google Scholar] [CrossRef]
  82. Kubota, Y.; Watanabe, K.; Tsuda, O.; Taniguchi, T. Deep Ultraviolet Light–EmittingHexagonal Boron Nitride Synthesizedat Atmospheric Pressure. Science (1979) 2007, 317, 932–934. [Google Scholar] [CrossRef]
  83. Paleckiene, R.; Sviklas, A.; Šlinkšiene, R. Physicochemical properties of a microelement fertilizer with amino acids. Russ. J. Appl. Chem. 2007, 80, 352–357. [Google Scholar] [CrossRef]
  84. Mohod, A.V.; Gogate, P.R. Improved crystallization of ammonium sulphate using ultrasound assisted approach with comparison with the conventional approach. Ultrason. Sonochem. 2018, 41, 310–318. [Google Scholar] [CrossRef] [PubMed]
  85. Nelmes, R.J. An X-ray Diffraction Determination of the Crystal Structure of Ammonium Hydrogen Sulphate above the Ferroeleetrie Transition. Acta Cryst. 1971, 27, 272–281. [Google Scholar] [CrossRef]
  86. Schlemper, E.O.; Hamilton, W.C. Neutron-diffraction study of the structures of ferroelectric and paraelectric ammonium sulfate. J. Chem. Phys. 1966, 44, 4498–4509. [Google Scholar] [CrossRef]
  87. Sen Gupta, S.; Karan, S.; Gupta, S.P.S. Growth and Defect Characterisation in Single Crystals of Ferroelectric Ammonium Sulphate. Jpn. J. Appl. Phys. 2000, 39, 2736. [Google Scholar] [CrossRef]
  88. Pakdel, A.; Bando, Y.; Golberg, D. Plasma-assisted interface engineering of boron nitride nanostructure films. ACS Nano 2014, 8, 10631–10639. [Google Scholar] [CrossRef]
  89. Achari, P.F.; Bejagam, K.K.; Singh, S.; Deshmukh, S.A. Development of non-bonded interaction parameters between hexagonal boron-nitride and water. Comput. Mater. Sci. 2019, 161, 339–345. [Google Scholar] [CrossRef]
  90. Moustafa, M.; Abu-Saied, M.A.; Taha, T.H.; Elnouby, M.; El Desouky, E.A.; Alamri, S.; Shati, A.; Alrumman, S.; Alghamdii, H.; Al-Khatani, M.; et al. Preparation and characterization of super-absorbing gel formulated from κ-carrageenan–potato peel starch blended polymers. Polymers 2021, 13, 4308. [Google Scholar] [CrossRef]
  91. Nogueira, L.F.B.; Maniglia, B.C.; Pereira, L.S.; Tapia-Blácido, D.R.; Ramos, A.P. Formation of carrageenan-CaCO3 bioactive membranes. Mater. Sci. Eng. C 2016, 58, 1–6. [Google Scholar] [CrossRef]
  92. Blumenthal, R.N.; Whitmore, D.H.; Narayanan, U.H.; Sundararajan, K.; Kasabekar, M.S.; Nagasubramanian, G. Thermal Stability of Nafion® in Simulated Fuel Cell Environments Thermodynamic Study of Phase Equilibria in the TitaniumOxygen System Within the TiO 1.95 TiO 2 Region Measurement of Thickness of Electroplates Taking Advantage of the Impedance Change in the Stripping Cell Thermal Stability of Nafion® in Simulated Fuel Cell Environments; Academic Press: Cambridge, MA, USA, 1996; Volume 143. [Google Scholar]
  93. Iwai, Y.; Yamanishi, T. Thermal stability of ion-exchange Nafion N117CS membranes. Polym. Degrad. Stab. 2009, 94, 679–687. [Google Scholar] [CrossRef]
  94. Lage, L.G.; Delgado, P.G.; Kawano, Y. Thermal Stability and Decomposition of Nafion ® Membranes with Different Cations Using High-Resolution Thermogravimetry. J. Therm. Anal. Calorim. 2004, 75, 521–530. [Google Scholar] [CrossRef]
  95. Garaev, V.; Pavlovica, S.; Reinholds, I.; Vaivars, G. Mechanical properties and XRD of Nafion modified by 2-hydroxyethylammonium ionic liquids. IOP Conf. Ser. Mater. Sci. Eng. 2013, 49, 012058. [Google Scholar] [CrossRef]
  96. Satterfield, M.B.; Majsztrik, P.W.; Ota, H.; Benziger, J.B.; Bocarsly, A.B. Mechanical properties of Nafion and titania/Nafion composite membranes for polymer electrolyte membrane fuel cells. J. Polym. Sci. B Polym. Phys. 2006, 44, 2327–2345. [Google Scholar] [CrossRef]
  97. Di Noto, V.; Gliubizzi, R.; Negro, E.; Pace, G. Effect of SiO2 on relaxation phenomena and mechanism of ion conductivity of [Nafion/(SiO2)x] composite membranes. J. Phys. Chem. B 2006, 110, 24972–24986. [Google Scholar] [CrossRef] [PubMed]
  98. Kuwertz, R.; Kirstein, C.; Turek, T.; Kunz, U. Influence of acid pretreatment on ionic conductivity of Nafion® membranes. J. Memb. Sci. 2016, 500, 225–235. [Google Scholar] [CrossRef]
Figure 1. Disaccharide belonging to κ-carrageenan.
Fuels 06 00015 g001
Figure 2. DSC thermogram showing the thermal stability of the samples: (a) κ-carrageenan (KC), (b) boron nitride (BN) nanoparticles, (c) κ-carrageenan with a concentration of 5 wt % of BN NPs (KC/BN), (d–h) KC/BN with a concentration of 1, 2, 3, 4, and 5 wt % of ammonium sulfate (KC/BN/NHS1%, KC/BN/NHS2%, KC/BN/NHS3%, KC/BN/NHS4%, and KC/BN/NHS5%), respectively, (i) ammonium sulfate (NHS). A heating rate of 10 °C/min was used.
Fuels 06 00015 g002
Figure 3. (A) TGA thermogram showing percent mass loss as a function of temperature for different samples, and (B) the derivative of percent mass loss (DTG). Dashed rectangles show the temperatures where there are the greatest mass losses. A heating rate of 10 °C/min was used.
Fuels 06 00015 g003
Figure 4. (A) Spectrum of FT-IR in the range of 4000 to 450 cm1 and (B) spectrum in the range of the fingerprint (1700–450 cm1) for different samples. Dashed lines show characteristic peaks for membranes and ammonium sulfate (NHS).
Fuels 06 00015 g004
Figure 5. (A) The Cole–Cole plot shows the electrical behavior of different membranes, (B) dielectric constant, and (C) dielectric loss versus frequency for different membranes, (D) variation in the dielectric constant for different temperatures of the membrane KC/BN/NHS1%. The red boxes show phases I, II, and III, respectively.
Fuels 06 00015 g005
Figure 6. Micrographs: (a) carrageenan KC membrane, (b) KC/BN membrane, (c) pure BN NPs, (d) KC/BN/NHS1% membrane, and (e) pure NHS crystals, (fi) corresponding to 2 wt %, 3 wt %, 4 wt %, and 5 wt % concentrations of NHS, respectively.
Fuels 06 00015 g006
Figure 7. (A) EDS measurements for different samples, (B) X-ray measurements for the different nanocomposites and precursors. Vertical dashed lines indicate the different phases in the membranes. (C) Surface energy measurements for the different membranes. In this Figure, we indicate the two membranes where the concentration of NHS is zero. (D) Stress as a function of strain for the different membranes.
Fuels 06 00015 g007
Table 1. Comparison between the different properties of biomembranes and commercial Nafion.
PropertyBiomembranesNafion Commercial
Thermal
Stability
Up to 200 °C [43]Up to 380 °C [44]
Up to 150 °C [45]Up to 280 [46]
Mechanical
Strength
72.29 MPa (Tensile Strength) [43]~1 MPa (Stress) [44]
~1 MPa (Stress) [47]3.23 MPa/% (Young’s modulus) [48]
Ionic
Conductivity
4.2 × 10⁻² S/cm [43]1.5 × 10⁻² S/cm at 30 °C and 70% RH [44]
3.16 × 10⁻² S/cm [49]7.8 × 10⁻² S/cm [50]
3.89 × 10⁻² S/cm [51]3.7 × 10⁻² S/cm 75 °C, 95% RH [52]
Table 2. Bands and functional groups detected in the nanocomposite samples corresponding to κ-carrageenan.
Wavenumber (cm−1)Functional GroupReferences
3392O–H (stretching)[22,70,71]
1640Polymer-bound water[22,70]
1222O=S=O (asymmetric stretching)[22,23,70,71,72,73,74]
1064C–O + C–OH[22,70]
1037C–OH + S=O[70]
1002Glicosidic bonds[22]
9203,6-anhydro-D-galactose[71,73,74]
844C4–O–S group in galactose (stretching)[22,70,71,72,73]
730C–O–C α(1,3) (stretching)[22,70]
700Sulfates in C4, galactose[75]
Table 3. Membrane conductivity.
MembranesConductivity (Scm−1)
KC1.22 × 10−6
KC/BN4.87 × 10−6
KC/BN/NHS1%7.82 × 10−5
KC/BN/NHS2%5.13 × 10−5
KC/BN/NHS3%5.05 × 10−5
KC/BN/NHS4%2.65 × 10−5
KC/BN/NHS5%3.27 × 10−6
Table 4. Relative abundance (% mass and % atom) of the different elements in the membranes, corresponding to the EDS measurements.
SamplesElements
BCNONaSClK
Mass%Atom%Mass%Atom%Mass%Atom%Mass%Atom%Mass%Atom%Mass%Atom%Mass%Atom%Mass%Atom%Total Mass%Total Atom%
KC0046.860.8002928.410.77.83.92.5112.95.2100100
BN54.6610045.4390000000000100100
KC/BN4.26.445.9580.70.62725.510.87.23.32.5111.54.4100100
NHS000010.917.529.541.10059.641.40000100100
KC/BN/NHS1%8.712.733.944.67.88.624.123.60.80.6114.42.71.1114.4100100
KC/BN/NHS2%19.625.9313716.416.813.511.90.60.411.75.22.414.81.8100100
KC/BN/NHS3%8.711.839.24811.41221.319.50.90.613.2620.93.31.2100100
KC/BN/NHS4%9.613.336.745.710.511.221.3200.90.514.26.62.414.41.7100100
KC/BN/NHS5%003854.31110.623.221.500188.6009.85100100
Table 5. The surface tension and contact angle for each membrane.
MembranesSurface Tension (mN/m)Contact Angle (°)
KC68.319.9
KC/BN50.355.2
KC/BN/NHS1%55.945
KC/BN/NHS2%57.4 42.7
KC/BN/NHS3%54.964.1
KC/BN/NHS4%54.448.1
KC/BN/NHS5%54.647.2
Table 6. Different tensile values for κ-carrageenan membranes.
MembranesUltimate Tensile Stress (MPa)Elongation at Break (%)Young’s Modulus (MPa)
KC7.366.5 2.20
KC/BN10.96 7.2 3.73
KC/BN/NHS1%6.66 4.8 3.02
KC/BN/NHS2%2.29 3.61.56
KC/BN/NHS3%1.64 3.0 1.32
KC/BN/NHS4%1.59 4.1 0.72
KC/BN/NHS5%1.04 2.4 0.57
Table 7. Comparison of thermal, electrical, mechanical properties and environmental impacts between the membranes and commercial Nafion.
Propertyκ-Carrageenan
and BN
Traditional Nafion (commercial)Comments/Notes
Thermal stabilityImproved by BNAround 280 °C [46,95,96,97]BN improves thermal stability up to 160 °C, although Nafion has a higher operating temperature range of 280 °C.
Mechanical strength (Young’s modulus)Enhanced by BN nanoparticlesAround 250 MPa [48,98]BN improves the strength of the biopolymer with a value of 10.96 Mpa, but Nafion is inherently more robust, with values up to 250 MPa.
Ionic conductivityEnhanced by NHS~0.1 S/cm at room temperatureNHS improves conductivity with the value of 7.82 × 10⁻⁵ S/cm; this is still lower than Nafion (~0.1 S/cm) but competitive for many applications.
Environmental impactBiodegradable, lower toxicological profilePersistent fluorinated compounds [56,57]Significant advantage over Nafion due to sustainable and eco-friendly profile.
Disclaimer/Publisher’s Note: The statements, opinions and data contained in all publications are solely those of the individual author(s) and contributor(s) and not of MDPI and/or the editor(s). MDPI and/or the editor(s) disclaim responsibility for any injury to people or property resulting from any ideas, methods, instructions or products referred to in the content.

