Article

Study of Spray Behaviors to Correlate with Engine Performance and Emissions of a Diesel Engine Using Canola-Based Biodiesel

Science, Technology, Engineering, and Mathematics (STEM), Mawson Lakes Campus, University of South Australia, Adelaide 5095, Australia
*
Author to whom correspondence should be addressed.
Fuels 2022, 3(1), 87-112; https://doi.org/10.3390/fuels3010007
Submission received: 13 December 2021 / Revised: 1 January 2022 / Accepted: 24 January 2022 / Published: 10 February 2022

Abstract

:
The use of renewable biodiesel fuel in diesel engines can reduce the demand for depleting fossil fuels and reduce harmful emissions to the environment. In this research, an engine simulation is conducted using ANSYS Forte software, which allows for visualization of the spray inside the combustion chamber. The results show that biodiesel has higher liquid and vapor penetration lengths, higher droplet mass and diameter, and a longer breakup length. Molecular images of fuel molecules show that the temperature of biodiesel molecules is 141 °C lower than diesel molecules at 709 degree crank angle (°CA). These characteristics result in an extended evaporation time for biodiesel, consequently leading to poorer performance. Additionally, increased penetration length can lead to carbon deposits inside the combustion chamber. Therefore, such inefficiencies of biodiesel spray properties lead to lower combustive performance than diesel. In terms of performance, on average, biodiesel produces 16.9% lower power and 19.9% higher brake specific fuel consumption. On average, the emissions of CO, CO2, and HC of biodiesel are 17.8%, 3.41%, and 23.5% lower and NOx is 14.39% higher than the corresponding values obtained for pure diesel, respectively. In-cylinder combustion analyses show that the peak pressure of biodiesel is 0.5 MPa lower, the peak cycle temperature is 36 °C lower, the ignition delay is 4 °CA longer, the peak heat release rate is 16.5 J/deg. higher, and the combustion duration is 5.96 °CA longer compared to diesel combustion.

1. Introduction

Depletion of limited global fossil fuel reserves and global warming caused by the burning of these fossil fuels have made it essential for humanity to reduce the demand for fossil fuel. Subsequently, the rate of fossil fuel depletion and atmospheric pollution levels caused by the burning of fossil fuel need to be reduced. According to statistics from 1971 to 2018 [1], the total final consumption (TFC) of energy was increased 2.6 times during this period. The final consumption of energy in most industries has slightly reduced, but the transportation industries have had a major increase. According to another statistic, 29% of global crude oil consumption and 25% of CO2 emissions came from the transportation industries in 2018 [1,2]. Compared to the gasoline engines, diesel engines have higher thermal efficiency, and higher power output, reliability, and durability. Therefore, diesel engines are commonly used in many industries such as transportation industries, including in passenger vehicles, generators, and ships, as well as in agricultural vehicles and heavy equipment. As progressively more countries began to use renewable energy, the share of renewable energy supply in the total primary energy supply (TPES) has also increased significantly [3]. In 2018, the share of renewable energy was 13.5% of the TPES, which came from sources such as biofuels, solar, and wind energy. Energy from biofuels was 67.9% of the total renewable energy [4]. Biodiesel as an alternative fuel to diesel can be produced from renewable sources such as edible palm oil, canola oil, and soybean oil, and non-edible sources such as waste cooking oil, algal oil, animal fat, and microalgae. Plantation will absorb CO2 during growth; hence, utilization in biodiesel production allows for a zero net production of CO2 emissions when using biodiesel in engines [5,6,7]. A study from Mahmudul, H. M. et al. [5,8] found that during the biodiesel production process, the fatty acids extraction by transesterification had the lowest cost and the simplest method, but a more important consideration factor than the extraction method was feedstock selection. The feedstock cost of biodiesel is the most important part of the biodiesel production cost; it accounts for two-thirds of the total production cost of biodiesel. Conversely, differences in biodiesel feedstock also affect the engine performance and emissions. Therefore, feedstock selection is most important when producing biodiesel with further consideration of the local agricultural and climate conditions of each country.
According to a report from the Food and Agriculture Organization (FAO), during 26 years between 1993 and 2019, the global annual canola production tripled from an initial 26 Mt to a peak of 76 Mt [9]. During this period, production in the major canola-producing countries, led by Canada, China, and the EU, increased significantly. Canada, the world’s largest canola producer, tripled its production in 2019 from 1993 to 18.7 Mt, followed by China with 13.5 Mt and the EU with 23.2 Mt [9]. With the implementation of renewable energy policies in many countries, Australia, the world’s fourth largest canola producer, has also seen a sharp increase in its canola production this year. According to a report, Australia’s average annual canola production has exceeded 4 Mt in 2017, an increase of more than 13 times compared to 0.3 Mt in 1993 [10]. With newer breeding techniques and more land being developed, the FAO predicts that global vegetable oil production will be doubled by 2050 to meet the global demand for vegetable oils for food, fuel, and industry [11,12,13].
It is evident from many studies in the literature that the applications of Canola Oil Biodiesel (COB) and derived blends with diesel in diesel engines have been pursued by many researchers and studied for performance and emissions [14,15,16,17,18,19]. Jun et al. [20] investigated the effects of use of COB and diesel blends in a diesel engine. In their study, the presence of oxygen in biodiesel had great significance in the combustion of COB. The maximum pressures during B100 (pure biodiesel) and B20 combustions (20% biodiesel blended with 80% diesel by volume) were lower when compared to diesel. In addition, this study indicated that the ignition delay of B100 and B20 were shorter than diesel. The emissions of CO and PM decreased but NOx emissions increased when the engine was run on biodiesel. Can et al. conducted a study on COB and listed the fatty acid compositions of refined biodiesel [21]. The major components of refined canola oil are 58.9 wt.% oleic acid (C18:1) and 20.57 wt.% linoleic acid (C18:2) fatty acids. It also has 9.33 wt.% unsaturated fatty acid content (C18:3). The viscosity and density of pure canola oil are 4.526 mm2/s and 886.5 kg/m3, respectively, while those of traditional diesel are 2.719 mm2/s and 830 kg/m3, respectively. In terms of cetane number, pure canola oil has 54.3 whereas diesel has 47. It is worth noting that the oxygen content of canola oil is 10.8% compared to diesel, which does not contain any oxygen [22]. Biodiesel having both a higher cetane number and oxygen content should result in a more efficient combustion when compared to diesel [23,24].
However, because of the higher viscosity and density of biodiesel compared to diesel, the fuel injection characteristics will be affected, making the engine performance with biodiesel inferior to diesel fuel [23,25]. As a result, many researchers have become interested in the spray behavior of fuels and are attempting to find ways to optimize the performance of biodiesel through the study of fuel spray behaviors [23,26,27,28]. An important characteristic of biodiesel is that changes in biodiesel properties affect the process of spray formation during fuel injection, which consequently affects the fuel’s evaporation efficiency and flame structure [29]. When a nozzle with a plurality of small-diameter injection holes is used, the fuel droplets can be more atomized [30]. The fuel injection pressure will affect the evolution velocity and strength of the cavitation layer, while higher injection pressures will affect the formation of cavitation zones [30]. Agarwal et al. [31], in a study of macroscopic spray parameters, compared the simulation results of diesel, and each biodiesel and its blend with diesel, with the experimental results. They concluded that the physical properties of the fuel have a profound effect on nozzle flow and spray characteristics. Moreover, turbulence and fuel velocity can significantly affect the atomization and evaporation characteristics of the spray exiting the injector nozzle by changing the cavitation at the nozzle exit. Therefore, the best spray characteristics can be obtained by optimizing the nozzle hole design, and this also can improve the engine performance and emission characteristics. Wang et al. [32] studied the effects of room temperature and injection pressure on the fuel spray and breakup length. It was demonstrated that lower room temperature would affect poor spray dispersibility, resulting in larger fuel ligaments and smaller spray cone angles. Conversely, the dispersibility of the spray can be improved when the injection pressure is increased. Xue et al. [33] studied the difference in flow characteristics in nozzle hole in a multi-hole fuel injection system. It was found that cavitation formation and development were affected when the angle between the injection needle and injection holes axes was increased. Therefore, observation of these spray characteristics of biodiesel is essential to improve the mixing of air and fuel. However, the study of spray properties in real engines is expensive and difficult, and most research studies are performed in chambers of transparent constant volume using Schlieren imaging and Mie-scattering techniques. Complications leading to infeasibility of experimental testing include dealing with extremely high temperatures in a large chamber with a moving piston as well as microsecond 3D-imaging of the system.
The majority of current research regarding biodiesel as an alternative fuel focuses on the effects of engine performance and exhaust emissions when substituting biodiesel into diesel engines. The novelty of this paper is the consideration and observation of the in-cylinder molecular behavior and characteristics of the liquid fuels after injection into the combustion chamber. Although the study of biodiesel spray behavior is quite limited due to the difficulty and expensiveness of the method used to observe the spray behavior by experiment, having a method of studying the biodiesel spray behavior is important in terms of providing insights to improve the engine performance. This study was dedicated to visualizing the spray behavior of biodiesel and diesel fuel using ANSYS Forte engine simulation software with a biodiesel reaction mechanism created through Chemkin-Pro. ANSYS Forte simulations provide qualitative data, which can be expressed both graphically and visually. Therefore, the user is able to compare graphical regions where biodiesel performs poorer than diesel with visual spray behaviors at various crank angles. A key area of focus in this study was the spray characteristics from before injection until combustion. Such characteristics include liquid and vapor penetration lengths, as well as the spray cone angle, droplet mass, breakup length, and Sauter Mean Diameter (SMD). This study also investigated numerous in-cylinder parameters that affect performance and emissions. Analysis and evaluation of results to identify areas where biodiesel performance is lacking can be utilized to improve the performance of engines using biodiesels.

2. Modelling

In this study, a HINO-manufactured W04D model diesel engine was used in the experiments and simulations. The specification of the engine is shown in Table 1. The 3D model of the engine was created by SOLIDWORKS software based on the dimensions measured from the actual engine. This 3D model was imported into ANSYS Workbench and used a diesel chemistry set provided by ANSYS software to simulate the performance of the diesel engine in the ANSYS Forte module. The simulation data of diesel performance were compared with the experimental baseline data of the HINO W04D engine to verify the simulation model.
Since this study used 100% Canola Oil Biodiesel (B100 COB), the biodiesel chemistry data set used in the simulations was created based on the content of the fatty acid composition of canola oil. Canola oil consists mainly of 58.9% oleic acid (C18:1), 20.569% linoleic acid (C18:2), 9.336% Linolenic (C18:3), 4.141% Palmitic (C16:0), 1.911% Stearic (C18:0), 1.349% Gadoleic (C20:1), 0.63% Arachidic (C20:0), 0.372% Behenic (C22:0), 0.203% Palmitoleic (C16:1), 0.058% Erucic (C22:1), 0.052% Myrictic (C14:0), and others 2.479% [21]. The chemical reaction mechanism of B100 COB was created using Reaction Workbench in the ANSYS series software. ANSYS provides a chemistry set, which includes a full range of diesel reaction mechanisms. Additionally, the chemistry set includes the expansion of biodiesel-related species and reactions, which are used to model biodiesel reaction mechanisms. This study used the mechanism reduction utility in Reaction Workbench to reduce the mechanism from 9382 species and 83,874 reactions to 575 species and 40,924 reactions, respectively, from the master chemistry set.
In the internal combustion engine model, COB is modelled as a mixture consisting of several species. During engine operation, the composition of the fuel mixture changes at different stages due to fuel injection, turbulence in transport and combustion. Therefore, Equation (1) is used in the modelling as a conservation equation of mass of the species.
ρ ¯ k t + ρ ¯ k u ˜ = ρ ¯ D y ¯ k + ρ ¯ k u ˜ ρ ¯ k u + ρ ¯ ˙ k c + ρ ˙ k s k = 1 , , K
where
ρ ¯ = density
k = species index
K = total number of species
u ˜ = flow velocity vector
y k = mass fraction of species
D = mixture-averaged molecular diffusion coefficient
During the operation of an internal combustion engine, the energy produced by the injection of fuel and the chemical reactions that occur during combustion are converted into pressure work and heat released, based on the first law of thermodynamics. Therefore, Equation (2) is used as the energy conversion equation in this simulation.
ρ ¯ I ˜ t + ( ρ ¯ u ˜ I ˜ ) = p ¯ u ˜ J ¯ ( ρ ¯ ( u i ˜ u ˜ I ˜ ) ) + ρ ¯ ε ˜ + Q ˙ C + Q ˙ S
where
I = specific internal energy
J = heat flux vector
ε ˜ = dissipation rate of the turbulent kinetic energy
Q ˙ C = chemical heat releases
Q ˙ S = the spray interactions
Since, both Equations (1) and (2) are related to turbulence, a correct turbulence model is essential to obtain accurate simulation results. In this study, turbulent transport process with gradient diffusion was assumed to be modeled by the Reynolds-Averaged-Navier–Stokes (RANS) method with the k-ε turbulence model from Renormalization Normalized Group (RNG) theory. Brief descriptions of the RANS method and the k-ε turbulence model are given below. The detailed argumentation process can be obtained from [34,35,36]. Equation (3) is used in the RANS method to define the turbulent kinetic energy k ˜ .
k ˜ = 1 2 ρ ¯ trace Γ = 1 2 u u ˜
where
u = fluctuating part of the flow velocity vector u
ρ ¯ = filtered density field
Γ = Reynolds stress tensor
Equation (3) is also used to define the Reynolds stress tensor Γ .
Γ = ρ ¯ v T u ˜ + ( u ˜ ) T 2 3 u ˜ I + 2 3 ρ ¯ k ˜ I  
where
u ˜ = ensemble average of the flow velocity vector u
I = identity tensor
T = tensor transpose
Since the dissipation rate ε ˜ of turbulent flow is related to the turbulent viscosity v T and the turbulent kinetic energy k ˜ , Equation (5) is used to define the turbulent viscosity v T :
v T = c μ k ˜ 2 ε ˜
where c μ is a constant that varies according to different turbulence model formulations.
In the k-ε turbulence model, the k-equation is written as:
ρ ¯ k ˜ t + ( ρ ¯ u ˜ k ˜ ) = 2 3 ρ ¯ k ˜ u ˜ + σ ¯ Γ : u ˜ + μ + μ T Pr k k ˜ ρ ¯ ε ˜ + W ¯ ˙ S
The ε-equation obtained by Yakhot and Orszag through a rigorous mathematical derivation is written as:
ρ ¯ ε ˜ t + ρ ¯ u ˜ ε ˜ = 2 3 c ε 1 c ε 3 ρ ¯ ε ˜ u ˜ + v + v T P r ε ε ˜ + ε ˜ k c ε 1 σ Γ : u ˜ c ε 2 ρ ¯ ε ˜ + c s W ¯ s ρ ¯ R
where P r k ,   P r ε , c ε 1 ,   c ε 2 ,   c ε 3 are model constants and the values of W ¯ ˙ S and c s are derived with reference to the 1997 Amsden study [34].
The simulations of spray vaporization as well as droplet breakup are necessary when studying the spray behavior of fuels. The Kelvin–Helmholtz (KH) and Rayleigh–Taylor (RT) instability mechanisms are used to simulate spray vaporization and droplet breakup when modelling the spray behavior [37,38]. The way the KH/RT breakup model is applied is shown in Figure 1. As can be seen in the figure, the KH breakup model is used from the nozzle to the breakup location. After the breakup location, the RT model is used together with the KH model so as to predict the secondary breakup location [37,39].
In the KH/RT fracture model, Equation (8) is used to define the breakup time scale τ K H   [40]:
τ K H = 3.726 C K H r p Λ K H Ω K H
where Λ K H is the wavelength of the fastest growing wave, which is defined as:
Λ K H r p = 9.02 1 + 0.45 Z 0.5 1 + 0.4 T 0.7 1 + 0.87 We g 1.67 0.6
where r p is the jet radius, and the growth rate of the fastest growing wave Ω K H is defined as:
Ω K H ρ l r p 3 σ 0.5 = 0.34 + 0.38 We g 1.5 1 + Z 1 + 1.4 T 0.6
where σ is surface tension and We g ,   Z and T   Taylor   number are three dimensionless numbers: the gas Weber number, the Ohnesorge number, and the Taylor number.
Equation (11) is used to define the wavelength Λ R T of the fastest growing wave, while Equation (12) is used to define the growth rate Ω R T of the fastest growing wave [41]:
Ω R T = 2 3 3 σ a ρ l ρ g 3 / 2 ρ l + ρ g  
Λ R T = 2 π 3 σ a ρ l ρ g
The above equations briefly show the theoretical basis of ANSYS Forte in simulating fuel spray behavior and show how different mathematical models can be applied at different stages of fuel spray behavior to simulate nozzle flow, spray atomization, droplet break-up, droplet collision and coalescence, droplet vaporization, and wall impact.

3. Model Validation

This study validated the accuracy of the simulation model by comparing the simulation results with experimental results for power- and brake-specific fuel consumption (BSFC) using diesel only. Figure 2 compares the power vs. fuel consumption and Figure 3 compares the BSFC vs. power derived from the experiments and simulations. It can be seen from the two figures that the experimental results are on average 3.4% lower than the simulation results. Uncertainties in modelling such as friction losses, heat losses, molecular friction losses inside the combustion chamber, air–fuel mixing, and combustion are very complicated to evaluate and could be higher in experiments, resulting in better performing simulation results when compared to experimental results. However, having a difference of only 3.4% higher power output shows that there is good agreement between the simulation and experimental results, which indicates that the model is well constructed [42].

4. Simulation Results of Diesel and Biodiesel

This section presents the simulation results of the engine operating on biodiesel and diesel. Biodiesel and diesel results are compared, with reasoning given for the identification of inefficiencies when the biodiesel was run on the diesel engine.

4.1. Spray Behaviors

Fuel in liquid form is injected into the combustion chamber at a high pressure so the liquid droplet size is small enough to evaporate quickly. Following this, the vapor mixes with air, and then the mixture combusts. The spray behavior presented in this section is, therefore, critical for vapor to entrain the maximum volume of air possible for a better combustion within the combustion time available.

4.1.1. Liquid Penetration Length

Figure 4. Liquid penetration length vs. crank angle. compares the liquid penetration lengths of biodiesel and diesel. It can be seen from the figure that the penetration length of biodiesel is higher than that of diesel due to having higher viscosity, and a higher density and presence of heavier molecules. At a crankshaft angle of 714°, the penetration length of biodiesel reaches a maximum value of 16.7 mm and decreases rapidly to 9.74 mm at 717°. In contrast, the liquid penetration length of diesel reaches a maximum of 14.3 mm at a crankshaft angle of 709° and decreases rapidly to 9.02 mm at 712°. It can also be seen that biodiesel requires a larger crank angle than diesel to penetrate inside the combustion chamber. This larger crank angle means that the main combustion will be away from TDC, which reduces the peak pressure and temperature as shown later in Figure 5 and Figure 6, respectively. In addition, the higher penetration of liquid of COB could hit the piston, leaving carbon deposits on the piston head, as found by many researchers [25,43]. The analyses of liquid penetration length clearly show why biodiesel performance is poorer than diesel.

4.1.2. Vapor Penetration Length

Figure 7 compares the vapor penetration lengths of biodiesel and diesel. The figure shows that the vapor penetration lengths of biodiesel and diesel are stable at 22 mm between the start of injection and the crankshaft angle of 718°. After the crank angle of 719°, diesel starts to fluctuate but always remains in the range of 19–22 mm. In contrast, the penetration length of biodiesel suddenly increases to 42.83 mm at 719° and remains fluctuating between 42.86 and 44.26 mm until it reaches a maximum of 46.81 mm at a crank angle of 733°. As the liquid penetration length of biodiesel is longer than diesel, the vapor generated from this liquid is also longer than diesel. This can result in insufficient combustion of the fuel and increased carbon deposits on the piston head.

4.1.3. Spray Breakup Length

Figure 8 compares the breakup length of the spray from liquid to vapor state for both biodiesel and diesel. It is evident in the figure that the breakup length of biodiesel fuel is longer than that of diesel throughout the injection period, from the start of the injection to the end of the injection. The density of biodiesel is higher than diesel, which, as shown in Figure 9, makes the droplet mass of biodiesel higher than diesel. This will cause the momentum of biodiesel molecules to be higher than those of diesel, leading to a longer penetration length of biodiesel than diesel. Similar results of longer breakup length were observed with biodiesel by many researchers such as Som et al. [44], Subramanian et al. [45], and Sivakumar et al. [46].

4.1.4. Droplet Mass and Diameter

In the process of fuel vaporization, the droplets of fuel after injection should be as small as possible to accelerate the vaporization process. This allows for a better fuel vapor mixing with air in the cylinder for the combustion process. However, it can be seen in Figure 9 that the droplet mass of biodiesel after injection is always higher than that of diesel. On average, the droplet mass of biodiesel is 35.7% higher than diesel fuel. At the crankshaft angle of 712°, the droplet mass of biodiesel reaches a maximum value of 0.000947 g, which is 97.9% more than that of diesel. Since the density of diesel is lower than that of biodiesel, it can be clearly seen in Figure 9 that the droplet mass of diesel reaches a maximum of 0.000697 g at a crankshaft angle of 709°. It is also clear from the SMD comparison of droplets in Figure 10 that the overall SMD of biodiesel is larger than diesel, which makes the droplet mass of biodiesel higher than diesel owing to higher density of biodiesel than diesel. Research conducted by Park et al. [47] also reported higher fuel mass molecules using biodiesel as compared to diesel. Sazhin et al. also reported a higher molecular droplet mass of biodiesel relative to diesel. Biodiesel has components with a narrow range of heavier molar masses compared to diesel, which has a wider range of molar masses consisting of lighter and heavier masses [47]. As a result, the percentage of heavier molecules in biodiesel is higher than diesel, which makes the mass of biodiesel molecules higher than those of diesel. Heavier molecular masses of biodiesel makes it more difficult to mix well with air in comparison to diesel, which subsequently affects the combustion and performance of the engine. The SMD of biodiesel is higher than that of diesel owing to the influence of higher viscosity and surface tension than diesel. Similar results were obtained in the research conducted by Chong et al. [48], Geng et al. [49], and Kim et. al. [50].

4.1.5. Molecular Images of Droplets

In this study, the spray behavior of the fuel could be shown in detail using the particle-tracking tool in ANSYS software. Figure 11 and Figure 12 show the particle tracking of biodiesel and diesel sprays at 709 °CA. Comparison of the two figures clearly shows that the spray cone angle of biodiesel is significantly larger than that of diesel, and the liquid penetration length of biodiesel is also longer than that of diesel, which can also be seen in Figure 4. It is also noted that the maximum temperature of the biodiesel molecules is 996 K, whereas for diesel, it is 1137 K. The larger SMD (Figure 10) and higher mass (Figure 9) of biodiesel absorbs more heat, which reduces the maximum temperature of biodiesel molecules when compared to diesel. This lower temperature will affect the evaporation process of biodiesel, resulting in poorer combustion than diesel.

4.2. Combustion Analysis

It is important to correlate combustion analyses, such as those focusing on the pressure, temperature, heat release rate, and cumulative heat release inside the combustion chamber, with the performance and emissions of the engine described earlier. Any inefficiencies found in these analyses can be addressed to improve the performance with biodiesel. The combustion analyses are shown for the rated power of 26 kW.

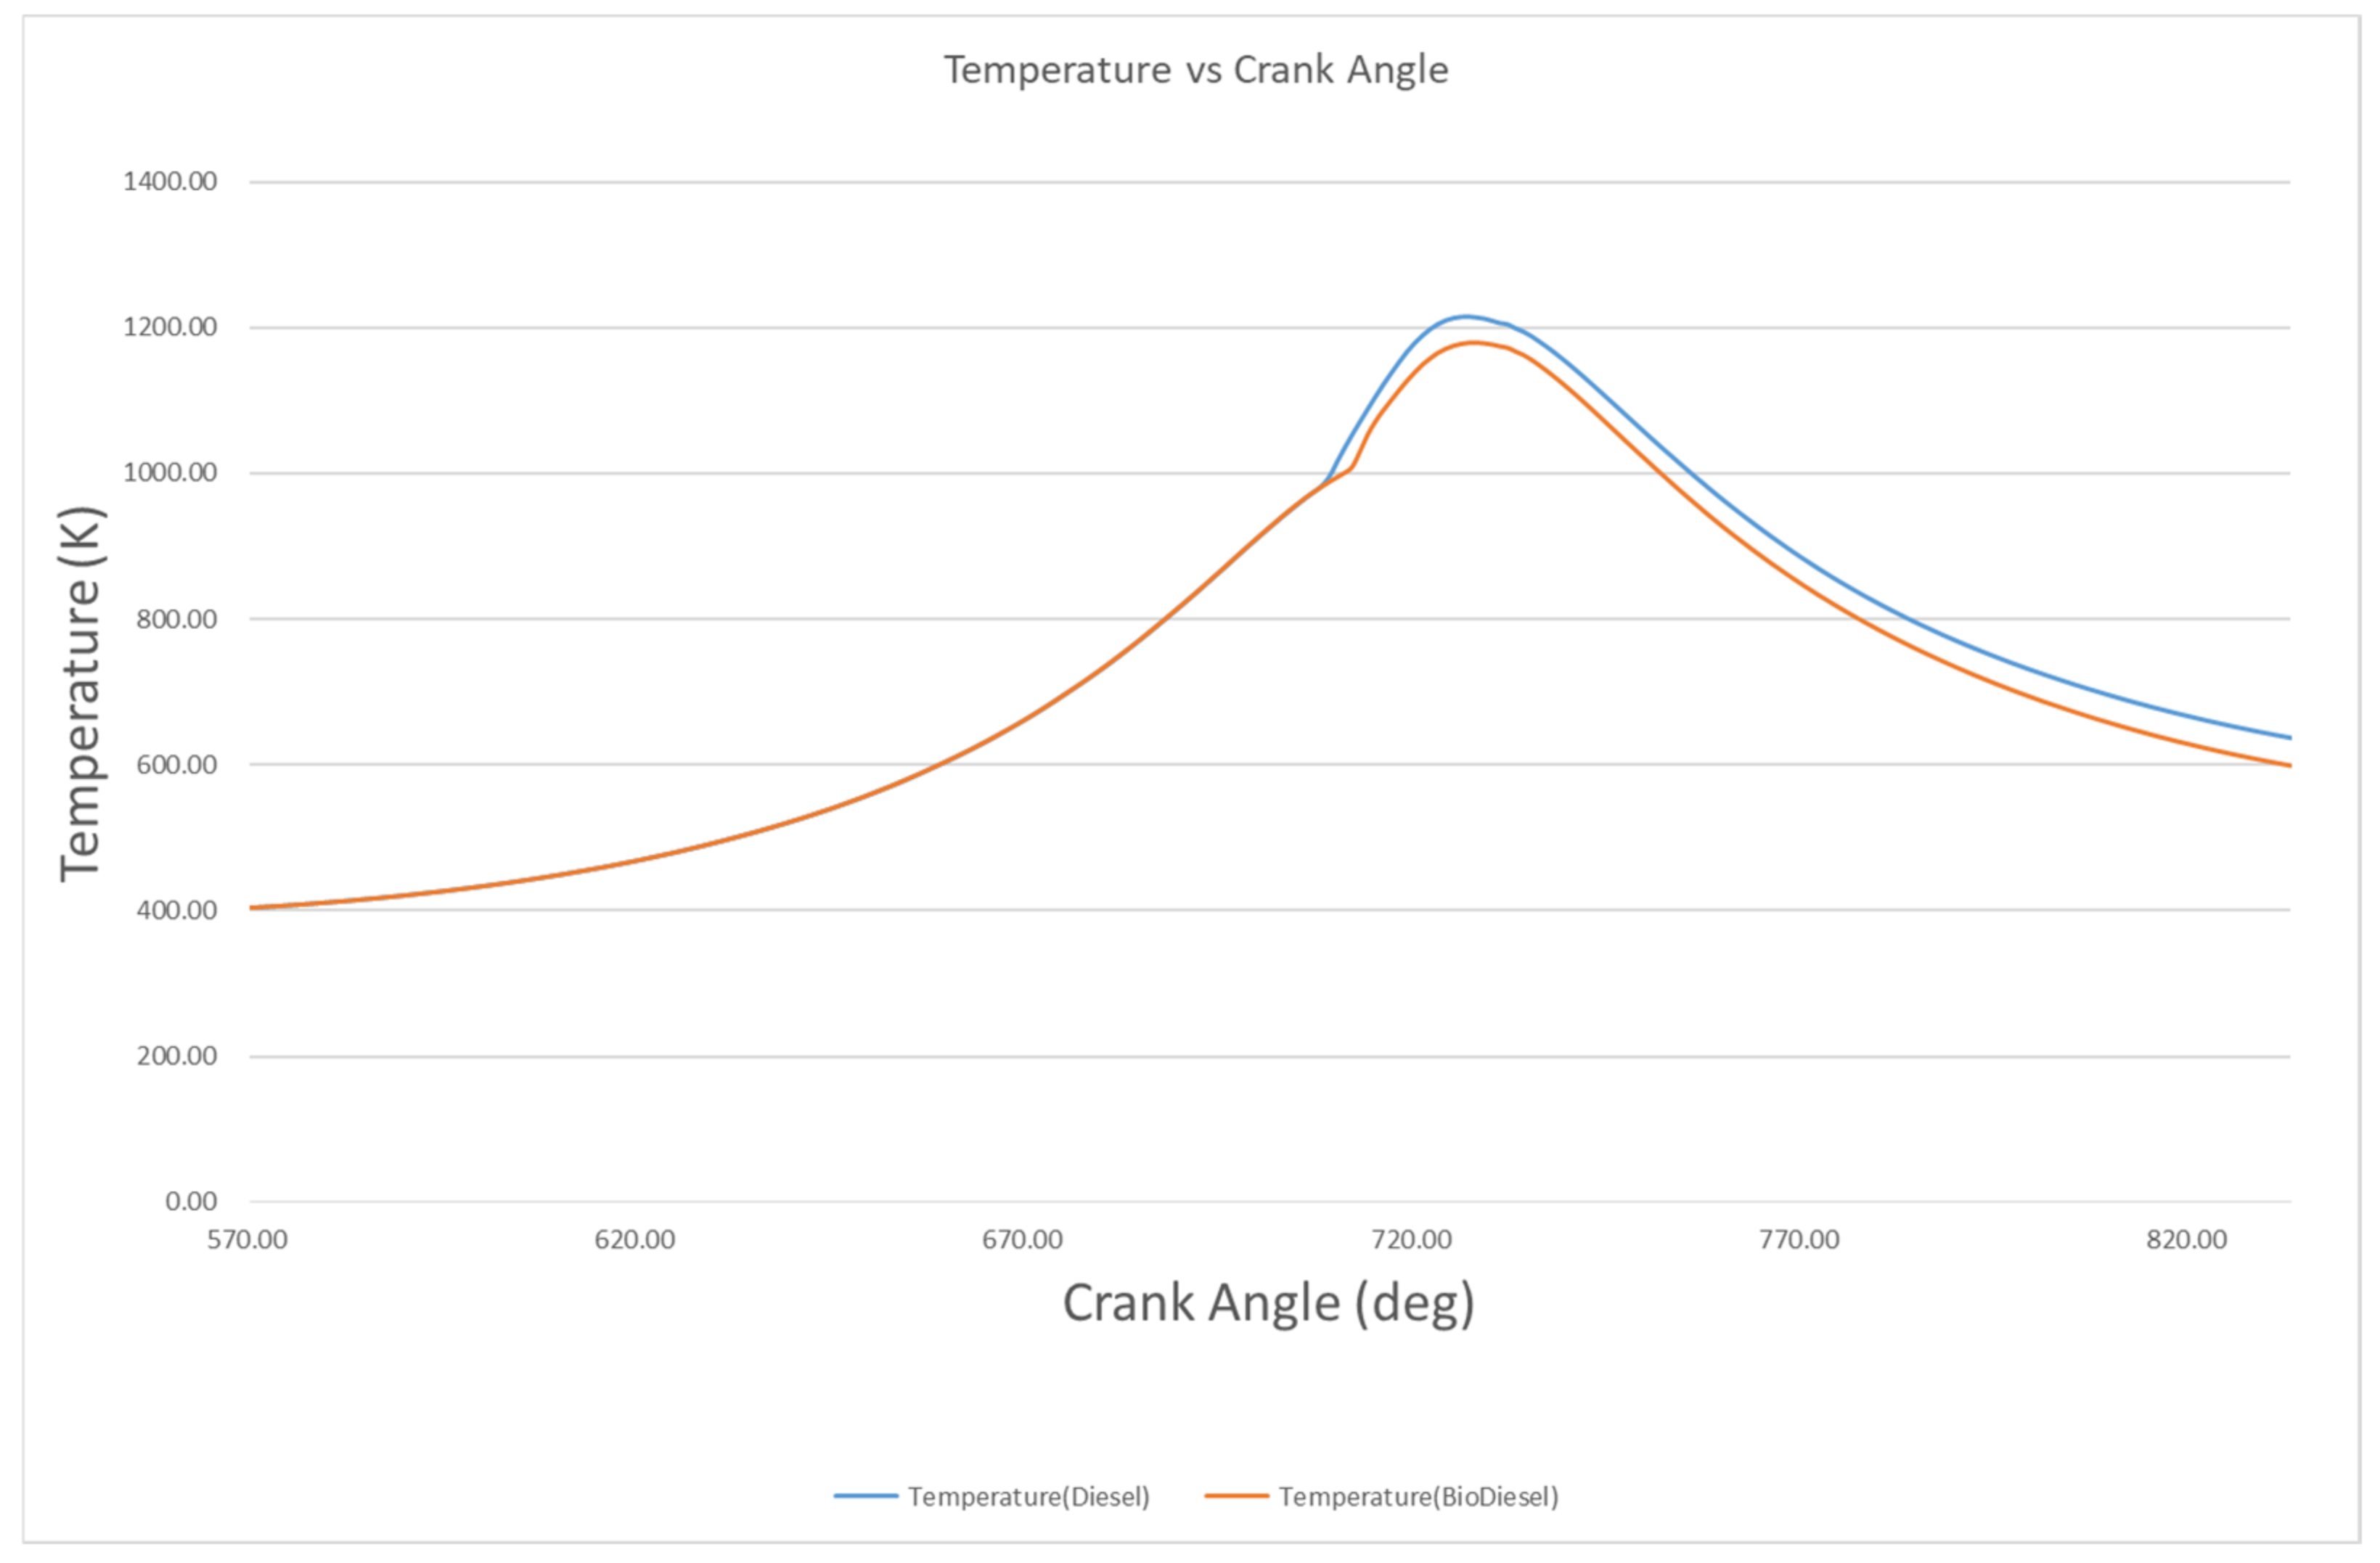
4.2.1. Pressure and Temperature

The P-θ plots of the simulated data for biodiesel and diesel are compared in Figure 5. It can be seen from the graph that the peak pressure of biodiesel is lower than that of diesel. The peak pressure of diesel is 17.4 MPa at a crankshaft angle of 722°, while when running on biodiesel, the peak pressure is 16.9 MPa at a crank angle of 723 °CA. This shows that biodiesel has a lower peak pressure and the peak occurrence angle is delayed by 1 °CA compared to diesel. As shown earlier, due to higher viscosity and density, the SMD (Figure 10), mass (Figure 9), liquid penetration length (Figure 4), and vapor penetration length (Figure 7) of biodiesel molecules are higher than diesel. Earlier, it was also shown that the biodiesel molecule’s temperature is 141 °C lower than diesel (Figure 11 and Figure 12). Lower temperature also affects the evaporation rate. The thermal conductivity of biodiesel is 0.13 W/m-K, which is lower than that of diesel, at 0.19 W/m-K [51]. This will decrease the heat transfer from the surroundings to the inside of the fuel molecules, which will result in a lower evaporation rate. The latent heat of vaporization of biodiesel is over 350 kJ/kg, which is higher than that of diesel, at 250 kJ/kg [51]. This will decrease the combustion chamber temperature when the fuel injection takes place. Fuel, when evaporating, will absorb the latent heat of vaporization from the surroundings of the fuel and, in the cumulative heat release vs. crank angle graph, shows a negative value (Figure 13). This will also effect the evaporation rate of biodiesel. All of these factors lower the evaporation rate of biodiesel and delay the onset of combustion, i.e., increase the delay period as compared to diesel. Due to the longer delay period, more vapor mixes with the air and combustion occurs, resulting in a higher heat release rate, as shown later in Figure 14. As a result, the peak pressure is only 0.5 MPa lower but the combustion duration is longer and the cumulative heat release is lower as compared to diesel. In terms of peak pressure, similar results were found in Jun Cong, G. et al.’s study, in which a 1979 cc common rail direct injection diesel engine was used to test the combustion, performance, and exhaust emission characteristics of diesel, B20, and B100 COB [20]. The results showed that the peak pressure of the B100 was 8.4% lower than that of diesel at high loadings as biodiesel has higher viscosity and density than diesel. The study also showed that increasing the injection pressure of the fuel could increase the turbulence intensity in the combustion chamber, thereby allowing for better vaporization of the fuel, resulting in better combustion.
The relationship between in-cylinder temperature and crank angle is shown in Figure 6. Normally, a higher pressure inside the combustion chamber leads to a higher temperature. Therefore, the temperature vs. crank angle follows the same trend as the pressure vs. crank angle. Owing to lower pressure, the temperature inside the combustion chamber of biodiesel is lower than that of diesel. When the engine starts to inject at 706 °CA, diesel starts to burn at 710 °CA, while biodiesel starts to burn at 714 °CA. The in-cylinder temperature of biodiesel reaches a maximum of 1179 K at 728 °CA, whereas diesel reaches a peak temperature of 1215 K at 726 °CA. As previously stated, this is because of lower calorific value, higher viscosity, and higher density, as well as the heavier molecules present in biodiesel causing poorer mixing with air, which results in lower heat release than diesel. The higher absorption of heat by heavier mass of biodiesel molecules, as shown previously, reduces the temperature of the biodiesel molecules (Figure 11 and Figure 12) as compared to diesel, and this also reduces the in-cylinder temperature of the biodiesel. Certainly, the lower temperature of the biodiesel molecules reduces the evaporation rate, resulting in poorer combustion performance as compared to diesel.

4.2.2. Heat Release Rate

Excessive heat release rate in a diesel engine would damage the combustion chamber. Figure 14 shows the heat release rate of biodiesel and diesel. The heat release rate of biodiesel is higher than that of diesel and the angle of occurrence is later. Seen in the graph, the ignition delays of biodiesel and diesel are found to be 8 °CA and 4 °CA, respectively. Therefore, the ignition delay of biodiesel is 4 °CA longer than that of diesel. The longer delay period allows more fuel to vaporize and mix with the air. When the ignition occurs, having more vapor–air to ignite in the uncontrolled combustion phase of biodiesel causes the rate of heat release to be higher than that of diesel. The peak heat release rates of biodiesel and diesel are 57.23 J/deg and 40.78 J/deg, with the angles of occurrence of these peaks being at 714° and 710°, respectively.

4.2.3. Cumulative Heat Release

Figure 13 shows the Cumulative Heat Release (CHH) for biodiesel and diesel. Though biodiesel has a higher cetane number than diesel, CHH clearly shows that the ignition of biodiesel occurs later than diesel. There is an 8 °CA delay in the onset of the cumulative heat gain for biodiesel, while diesel only has 4 °CA. This could be due to insufficient vapor–air mixture being available to auto-ignite the biodiesel, as stated in the previous section. The 10–90% combustion duration of biodiesel is 42.98 °CA, while that of diesel is 37.02 °CA. Again, this is because of the higher viscosity, higher density, and heavier molecules present in biodiesel, which prolongs the combustion, resulting in a longer combustion duration than diesel. Having a longer combustion means that the combustion continues further during power strokes, reducing the work produced by the piston, as shown in Figure 2.

4.3. Performance

The performance of the diesel engine, such as brake power (BP), BSFC, and brake thermal efficiency (BTE), operating using COB and diesel, are described in this section.

4.3.1. Brake Power and BSFC

Figure 15 shows the graph of power vs. fuel consumption for biodiesel and diesel with the same simulation model. It can be seen from the graph that the power of biodiesel is lower than that of diesel for the same fuel consumption. In the lowest power region, the power of diesel is 3.05 kW, while the power of biodiesel is 2.06 kW. In the higher power region, biodiesel produces 24.63 kW and the power of biodiesel is, on average, 16.9% lower than that of diesel. This is because of the calorific value of COB, which is 10% lower than that of diesel. This loss of power is also due to the higher SMD (Figure 8), the heavier mass of the molecules (Figure 7), and longer penetration length (Figure 4) of biodiesel, which causes biodiesel to take a longer time to evaporate and mix with air, which ultimately results in poorer mixing with air and a longer combustion duration than diesel, which can be seen in Figure 14.
Figure 16 compares the BSFC of biodiesel and diesel at different powers. The overall BSFC of biodiesel is 19.9% higher than that of diesel. This is mainly due to the lower calorific value of biodiesel, which means more biodiesel needs to be injected to obtain the same power output as diesel, resulting in an increase in BSFC [15,23]. Similar results were found in a study by A. Praveen et al. on a single-cylinder four-stroke diesel engine fueled with a blend of COB and diesel in different proportions [23,52]. The results of the study showed that due to the lower calorific value of biodiesel, the BSFC of biodiesel increased with the increasing of the proportion of COB in the biodiesel–diesel blend, with an average increase of 15.7% in the BSFC of biodiesel compared to that of diesel, at a COB proportion of 40%.

4.3.2. Brake Thermal Efficiency vs. Power

Figure 17 compares the brake thermal efficiency vs. power of biodiesel and diesel. The figure shows that the overall thermal efficiency of biodiesel is lower than that of diesel. This is because of the higher viscosity and the presence of heavier molecules in biodiesel, which makes biodiesel and air difficult to mix properly. In addition, as shown earlier in Figure 4, Figure 5, Figure 7 and Figure 8, the liquid and vapor penetration lengths of biodiesel are longer, and the SMD and mass of biodiesel fuel molecules are larger. These cause the biodiesel to take a longer time to mix with air, resulting in lower thermal efficiency [14,23]. The average reduction in the thermal efficiency is 4.98%. Similar results are found in Simsek’s study, in which the engine performance and exhaust emissions of a 296 cc single-cylinder, four-stroke diesel engine fueled with COB were studied at a fixed speed of 3000 rpm [15]. The results of the study showed that the combustion efficiency was reduced due to the higher viscosity and lower calorific value of the biodiesel, with an average reduction of 1.95% in combustion efficiency when using B100.

4.4. Emission Results of Biodiesel and Diesel

The emissions of CO, CO2, HC, and NOX of the diesel engine run on COB and diesel are discussed in this section. One of the main aims of using biodiesel is to reduce harmful emissions. In this section, the emissions produced by using biodiesel are correlated with performance to identify critical areas to address.

4.4.1. CO Emissions

A comparative graph of CO emissions from biodiesel and diesel is shown in Figure 18. CO vs. Power. The CO emissions of biodiesel are lower than those of diesel, and the average CO emission of biodiesel is 17.8% lower than that of diesel for the engine output range of 2–25 kW. At the engine output of 3.05 kW, the CO emissions of biodiesel show the largest decrease, at 29.1%. When the output power of biodiesel reaches 24.8 kW, the CO emissions of biodiesel decrease by 17.8% compared with those of diesel. The decrease in CO emissions with COB is due to the presence of oxygen molecules in biodiesel [22].
The CO emissions from COB were similarly lower than diesel in the study by A. Praveen et al. However, CO emissions from COB increased with the proportion of COB in the biodiesel–diesel blend [52]. It is noteworthy that some different results were observed in the study of K. Veera Raghavulu et al. [53]. When the proportion of COB in the biodiesel–diesel blend was low, CO emissions from COB were higher than diesel in the high load region of the engine. However, when the proportion of COB increased, the CO emissions in the high load range of the engine were lower than those of diesel [53].

4.4.2. CO2 Emissions

Figure 19 shows the CO2 emissions of biodiesel and diesel. Due to the lower engine power output when using biodiesel, the comparable calculated power range of the two fuels is restricted. Therefore, the graph only compares CO2 emissions for engine outputs in the range of 2–25 kW. The CO2 emissions of biodiesel are lower than those of diesel at different engine output powers. For the engine power output ranging from 2 to 25 kW, the average CO2 emission of biodiesel is 3.4% lower than that of diesel. At the engine output power of 24.8 kW, the maximum CO2 emission of biodiesel reaches 307.12 mg, which is 2.6% lower than that of diesel. An important observation in the results is the maximum difference in CO2 emissions of biodiesel, which occurs at an engine output of 21.76 kW. At this point, the CO2 emissions of diesel reach 311.05 mg, whereas those of biodiesel reach 297.57 mg, being 4.33% lower than diesel. Several different percentages of COB selected in the study of K. Veera Raghavulu et al. demonstrated lower CO2 emissions than diesel, and only at lower percentages of COB were CO2 emissions higher than diesel at full engine load [53]. Biodiesel contains 6.25% less carbon content than diesel due to the higher oxygen presence in biodiesel molecules, resulting in lower carbon dioxide emissions in COB runs. An advantageous quality of utilizing a renewable canola oil source is that CO2 emissions are absorbed by canola oil crops. Therefore, diesel engines burning COB produce zero net CO2 emissions and do not contribute to the total calculated greenhouse CO2 emissions.

4.4.3. HC Emissions

Figure 20 shows a comparison of the unburnt hydrocarbon (HC) emissions from biodiesel and diesel. It is evident that biodiesel has lower unburnt HC emissions than diesel throughout the engine power output range. In the engine output range of 2–25 kW, the average unburnt HC emissions of biodiesel are reduced by 23.5% when compared to diesel. At an engine output of 24.8 kW, the unburnt HC emissions of biodiesel reach a maximum value of 2.04 mg, which is 26.2% lower than the unburnt HC emissions of diesel of 2.77 mg. Moreover, it is seen that the increasing rate of unburnt HC emissions from biodiesel significantly reduces after the engine output power reaches 21.4 kW. Similar results were observed in Simsek’s study [15], where the unburnt hydrocarbons of biodiesel decreased with the increasing of the biodiesel blend percentage and reached a maximum reduction of 17.5% at B100. Combustion in diesel engines is in the form of heterogeneous mixtures of fuel and air. After the main combustion phase, during the late combustion phase, the injected fuel cannot mix with enough air to combust and this leads to unburnt hydrocarbons and, consequently, the emission of black smoke [25]. Therefore, the maximum power of a diesel engine is limited by this black smoke and, as a result, diesel engines always operate on lean mixtures whereas gasoline engines are able to operate on rich mixtures. Biodiesels with higher oxygen contents in their molecules are more conducive to combustion as they provide oxygen in a rich fuel–air mixture, which leads to a reduction in unburnt hydrocarbon.

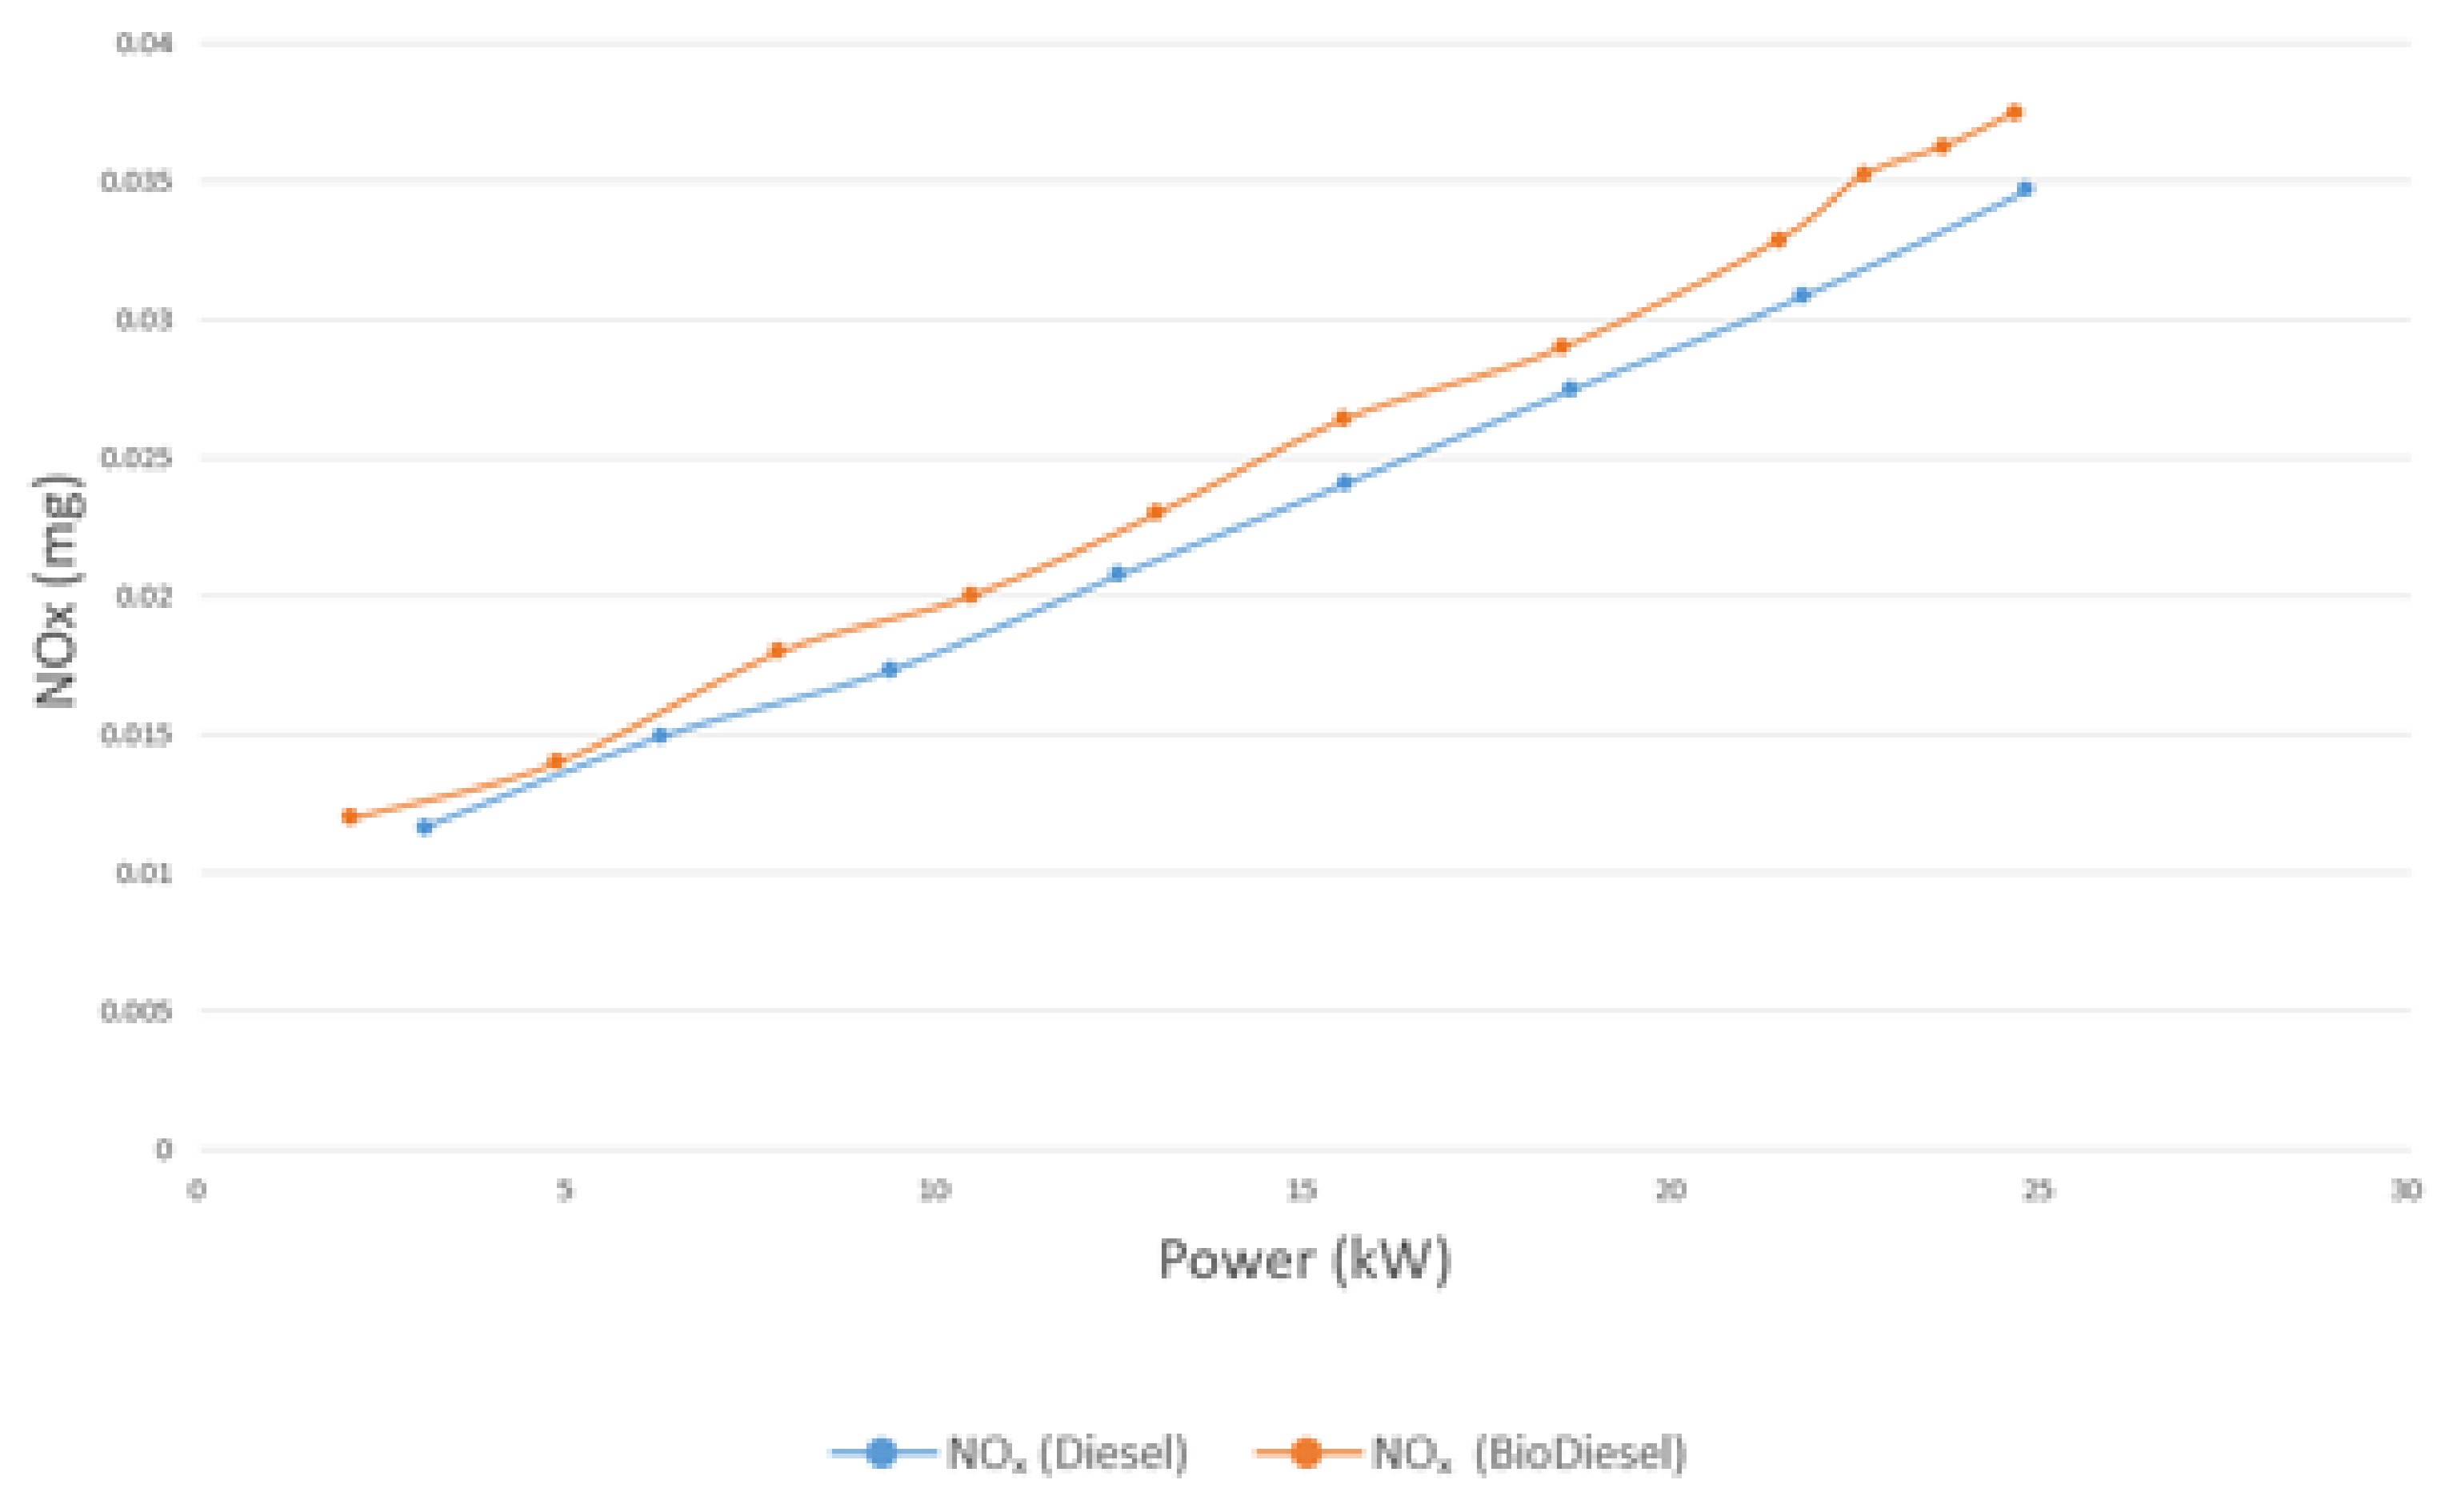
4.4.4. NOx Emissions

Figure 21 shows the NOx emissions of biodiesel and diesel. It is evident in the figure that the NOx emissions produced from biodiesel are higher than those of diesel across the power range. On average, within the engine output power range of 2–24 kW, the NOx emission of biodiesel is increased by 14.39% compared to that of diesel. At the engine output power of 24.8 kW, the NOx emission of biodiesel reaches the maximum value of 0.038 mg, which is 9.8% higher than the NOx emission of diesel, at 0.034 mg. When the engine output power is 9.38 kW, the NOx emission of biodiesel increases to a maximum of 20.5% or 0.015 mg compared to that of the diesel operation, which is 0.012 mg. The formation of NOX is accelerated with the high temperature and the presence of O2. Biodiesels have inherent O2 in their molecules. Therefore, the presence of O2 in high-temperature regions promotes more NOX formation than in diesels, which have no O2 in their fuel molecules. In Manigandan’s study [14], the NOx emissions of biodiesel were higher than those of diesel at speeds lower than 1800 rpm, as higher contents of the unsaturated fatty acid also contributed to NOx formation. The NOx emissions of biodiesel were reported to be 1% higher than those of diesel at lower engine speeds and kept increasing until 1800 rpm was reached, and then, the NOx emissions decreased by 11% when the engine speed was above 1800 rpm. The reason for the NOx reduction above 1800 rpm was the liberation of energy that creates an unfavorable condition for NOx formation. In Simsek’s study [15], the NOx emissions of biodiesel increased by 80.5% compared to diesel over the whole load range, as the combustion rate of biodiesel was increased due to higher oxygen content, and the temperature inside the combustion chamber increased as well, which resulted in higher NOx emission [54]. In another study, Raghavulu et al. found that NOx emissions from biodiesel were higher than those of diesel fuel, and that the NOx emissions were increased with the proportion of COB in the biodiesel–diesel blend [53].

4.5. Relationship of Injection Process of Fuel with the Performances and Emissions

The previous few sections present the injection processes, combustion, performance, and emissions of biodiesel and their comparison with diesel fuel. Due to higher viscosity, higher density, and the presence of heavier molecules, the molecules of biodiesel are larger than diesel, travel a longer distance than diesel, and delay the ignition process. Such inherent properties result in a longer combustion duration of biodiesel in comparison to diesel. Consequently, these result in lower power, higher BFSC, lower brake thermal efficiency, lower peak pressure, and lower in-cylinder temperature. In terms of emissions, due to the oxygen content of biodiesel, the CO and unburnt HC emissions are lower than in diesel. However, due the presence of O2 in biodiesel molecules, the NOX emissions of biodiesel are higher than those of diesel. The lower carbon content of biodiesel results in lower CO2 in comparison to diesel.

5. Strategies to Improve the Performance of Biodiesel in Diesel Engine in Terms of Injection and Combustion Processes

The analyses of the injection and combustion processes show that the performance of biodiesel can be improved by:
  • Injecting at a higher pressure to reduce the size of liquid molecules, which will also reduce the liquid and vapor penetration lengths. This will allow the biodiesel to evaporate more quickly and mix properly with air within the limited time available to complete the combustion, thus improving the performance of the biodiesel.
  • Injecting at a higher temperature will reduce the viscosity and density, which will decrease the size of liquid molecules and reduce the penetration lengths. As shown earlier, biodiesel molecules are around 141 °C lower than those of diesel, which hinders the evaporation process. Therefore, heating will increase the temperature of biodiesel molecules and, thus, will improve the evaporation process, and thereby improve the performance of the diesel engine when biodiesel is used.
  • With biodiesel, the occurrence of peak pressure is later (further away from TDC) and the combustion duration is longer than that of diesel. Therefore, advancing the injection timing will allow biodiesel to have more time to complete combustion. This will improve the engine performance when biodiesel is used. However, injection timing needs further research to find the optimum injection timing.
  • Blending biodiesel with diesel or a lighter fuel such as kerosene will reduce the viscosity and density. Researchers applied this technique and found improvement. However, the recommended blend is up to 20% biodiesel with 80% diesel or kerosene (B20). This technique combined with the previously mentioned techniques is expected to allow a greater percentage of biodiesel to be present in the blend. This again needs further investigation.
The above-mentioned techniques have already been applied by many researchers, and improvements were found [23,30,38,55,56,57,58,59,60,61,62,63]. Therefore, the in-cylinder injection parameters and the visualizations of the spray inside the combustion chamber performed in this research identify the reasons for inefficiencies during the operation of biodiesel in a diesel engine.

6. Conclusions

In this study, the fuel spray molecular image and characteristics of biodiesel and diesel were studied and compared using the RANS k-ε turbulence and KH/RT breakup models. The engine performances, emissions and in-cylinder combustion parameters, following the burning of biodiesel, were also investigated and compared with those obtained for diesel. The results obtained in this study are summarized as follows.
(1)
The liquid penetration length of biodiesel is 17.7 mm at 714 °CA, but rapidly decreases to 9.74 mm at 717 °CA. However, the liquid penetration length of diesel at 714 °CA is 9.02 mm, and rapidly decreases to 9.02 mm at 717 °CA. Biodiesel has a vapor penetration length that fluctuates between 42.86 mm to 44.26 mm, whereas the vapor penetration length of diesel fluctuates between 19 and 22 mm.
(2)
The liquid breakup lengths of biodiesel vary between 9.75 mm and 10.74 mm, while these values vary between 9.06 mm and 10.99 mm for diesel. The droplet masses of biodiesel and diesel are 9.47 mg and 6.97 mg at 712 °CA and 709 °CA, respectively. At 709 °CA, the molecular images of biodiesel and diesel show that the maximum temperatures of the fuel molecules are 996 K and 1137 K, respectively.
(3)
The effects of points 1 and 2 reduce the evaporation rate of biodiesel as compared to diesel, which results in inferior mixing with air; this ultimately reduces the performance of biodiesel relative to diesel.
(4)
The peak pressures of biodiesel and diesel are 16.9 MPa and 17.4 MPa, with these occurring at 722 °CA and 123 °CA, respectively. However, the in-cylinder temperatures of biodiesel and biodiesel are 1179 K and 1216 K at 728 °CA and 726 °CA, respectively.
(5)
The longer delay of biodiesel than diesel results in more vapor mixing with air, which, when ignited, produces higher heat release rate as compared to diesel. The heat release rate of biodiesel and diesel are 57.23 J/deg. and 40.18 J/deg., with these occurring at 714 °CA and 710 °CA, respectively. The cumulative heat release graph shows that biodiesel and diesel have combustion durations of 42.98 °CA and 37.02 °CA, respectively. From the graph, it is also found that the ignition delay of biodiesel and diesel are 8 °CA and 4 °CA, respectively.
(6)
In terms of performance, power with biodiesel is, on average, 16.9% lower than that of diesel. Overall, the BSFC of biodiesel is 19.9% higher than that of diesel. This is mainly because of the lower calorific value of biodiesel.
(7)
The emissions of CO, CO2, and unburnt HC, on average, are 17.8%, 3.4%, and 23.5% lower for biodiesel than diesel, respectively. On the other hand, the emission of NOX is 14.39% higher for biodiesel than diesel.

Author Contributions

Conceptualization, C.Z. and F.K.; methodology, C.Z.; software, C.Z.; validation, C.Z., K.H.L. and S.B.; formal analysis, C.Z. and S.B.; investigation, C.Z. and S.B.; resources, S.B.; data curation, C.Z., F.K., K.H.L. and S.B.; writing—original draft preparation, C.Z.; writing—review and editing, C.Z., F.K., K.H.L. and S.B.; visualization, C.Z.; supervision, S.B.; project administration, S.B.; funding acquisition, Not applicable. All authors have read and agreed to the published version of the manuscript.

Funding

I confirm that there is no funding involved in this project.

Conflicts of Interest

The authors declare no conflict of interest.

References

  1. IEA. World Energy Balances 2021 Overview. Available online: https://www.iea.org/reports/world-energy-balances-overview (accessed on 17 June 2021).
  2. IEA. CO₂ Emissions from Fuel Combustion 2021. Available online: https://www.iea.org/reports/co2-emissions-from-fuel-combustion-overview (accessed on 17 June 2021).
  3. Mahlia, T.; Syazmi, Z.A.H.S.; Mofijur, M.; Pg Abas, A.E.; Bilad, M.R.; Ong, H.C.; Silitonga, A.S. Patent landscape review on biodiesel production: Technology updates. Renew. Sustain. Energy Rev. 2020, 118, 109526. [Google Scholar] [CrossRef]
  4. IEA. Renewables Information 2020 Overview. Available online: https://www.iea.org/reports/renewables-information-overview (accessed on 25 November 2020).
  5. Mahmudul, H.M.; Hagos, F.Y.; Mamat, R.; Adam, A.A.; Ishak, W.F.W.; Alenezi, R. Production, characterization and performance of biodiesel as an alternative fuel in diesel engines–A review. Renew. Sustain. Energy Rev. 2017, 72, 497–509. [Google Scholar] [CrossRef]
  6. Bari, S.; Saad, I. Optimization of vane numbers through simulation and experiment, and investigation of the effect on the performance and emissions of a CI (compression ignition) engine run with biodiesel. Energy 2015, 79, 248–263. [Google Scholar] [CrossRef]
  7. Bari, S.; Hossain, S.N.; Saad, I. A Review on Techniques to Improve Performance and Reduce Emissions of Diesel Engine Running with Higher Viscous Fuels (HVFs). Fuel 2019, 264. [Google Scholar] [CrossRef]
  8. Khoobbakht, G.; Kheiralipour, K.; Rasouli, H.; Rafiee, M.; Hadipour, M.; Karimi, M. Experimental exergy analysis of transesterification in biodiesel production. Energy 2020, 196, 117092. [Google Scholar] [CrossRef]
  9. FAO. FAOSTAT. Available online: https://www.fao.org/faostat/en/#data/QC/visualize (accessed on 26 November 2021).
  10. AEGIC. Australian Canola. Available online: https://www.aegic.org.au/wp-content/uploads/2018/02/AEGIC-Grain-Note-canola_LR.pdf (accessed on 25 November 2020).
  11. Kirkegaard, J.A.; Lilley, J.M.; Morrison, M.J. Drivers of trends in Australian canola productivity and future prospects. Crop Pasture Sci. 2016, 67, 1–9. [Google Scholar] [CrossRef] [Green Version]
  12. FAO. World Agriculture: Towards 2015/2030. Earthscan. Available online: www.fao.org/docrep/005/y4252e/y4252e00.htm (accessed on 26 November 2021).
  13. Bari, S.; Saad, I. Effect of guide vane height on the performance and emissions of a compression ignition (CI) engine run with biodiesel through simulation and experiment. Appl. Energy 2014, 136, 431–444. [Google Scholar] [CrossRef]
  14. Manigandan, S.; Gunasekar, P.; Praveenkumar, T.R.; Sabir, J.S.; Mathimani, T.; Pugazhendhi, A.; Brindhadevi, K. Performance, noise and emission characteristics of DI engine using canola and Moringa oleifera biodiesel blends using soluble multiwalled carbon nanotubes. Fuel 2021, 289, 119829. [Google Scholar] [CrossRef]
  15. Simsek, S. Effects of biodiesel obtained from Canola, sefflower oils and waste oils on the engine performance and exhaust emissions. Fuel 2020, 265, 117026. [Google Scholar] [CrossRef]
  16. Temizer, İ.; Eskici, B. Investigation on the combustion characteristics and lubrication of biodiesel and diesel fuel used in a diesel engine. Fuel 2020, 278, 118363. [Google Scholar] [CrossRef]
  17. Saad, I.; Bari, S. Guide vane swirl and tumble device to improve in-cylinder air flow of CI engine using vegetable oil. Procedia Eng. 2014, 90, 425–430. [Google Scholar] [CrossRef] [Green Version]
  18. Lim, T.; Bari, S.; Yu, C. Using crude palm oil (CPO) as diesel engine fuel. ASEAN J. Sci. Technol. Dev. 2002, 19, 1–13. [Google Scholar] [CrossRef] [Green Version]
  19. Bari, S.; Hossain, S.; Saad, I. A review on improving airflow characteristics inside the combustion chamber of CI engines to improve the performance with higher viscous biofuels. Fuel 2020, 264, 116769. [Google Scholar] [CrossRef]
  20. Cong, G.J.; Ki, Y.S.; Soo, K.M.; Jung, C.N. Application of Canola Oil Biodiesel/Diesel Blends in a Common Rail Diesel Engine. Appl. Sci. 2016, 7, 34. [Google Scholar] [CrossRef] [Green Version]
  21. Can, Ö.; Öztürk, E.; Yücesu, H.S. Combustion and exhaust emissions of canola biodiesel blends in a single cylinder DI diesel engine. Renew. Energy 2017, 109, 73–82. [Google Scholar] [CrossRef]
  22. Anbarasu, A.; Karthikeyan, A. Diesel engine performance and emission evaluation using Canola biodiesel emulsion fuel. Aust. J. Mech. Eng. 2016, 14, 174–181. [Google Scholar] [CrossRef]
  23. Nguyen, T.; Pham, M.; Anh, T.L. Spray, combustion, performance and emission characteristics of a common rail diesel engine fueled by fish-oil biodiesel blends. Fuel 2020, 269, 117108. [Google Scholar] [CrossRef]
  24. Bari, S.; Zhang, C. Analysis of Performance and Emission of Diesel Engines Operating on Palm Oil Biodiesel. SAE Int. J. Adv. Curr. Pract. Mobil. 2020, 2, 1862–1869. [Google Scholar]
  25. Bari, S. Durability issues of running diesel engine with crude palm oil. In Proceedings of the 2009 1st International Conference on the Developements in Renewable Energy Technology (ICDRET), Dhaka, Bangladesh, 17-19 December 2009; 2009; pp. 1–4. [Google Scholar] [CrossRef]
  26. Algayyim, S.J.M.; Wandel, A.P. Macroscopic and microscopic characteristics of biofuel spray (biodiesel and alcohols) in CI engines: A review. Fuel 2021, 292, 120303. [Google Scholar] [CrossRef]
  27. Yu, S.; Yin, B.; Deng, W.; Jia, H.; Ye, Z.; Xu, B.; Xu, H. Experimental study on the spray and mixing characteristics for equilateral triangular and circular nozzles with diesel and biodiesel under high injection pressures. Fuel 2019, 239, 97–107. [Google Scholar] [CrossRef]
  28. Kuti, O.A.; Sarathy, S.M.; Nishida, K. Spray combustion simulation study of waste cooking oil biodiesel and diesel under direct injection diesel engine conditions. Fuel 2020, 267, 11724. [Google Scholar] [CrossRef]
  29. Chong, C.T.; Hochgreb, S. Flame structure, spectroscopy and emissions quantification of rapeseed biodiesel under model gas turbine conditions. Appl. Energy 2017, 185, 1383–1392. [Google Scholar] [CrossRef] [Green Version]
  30. Yin, B.; Yu, S.; Jia, H.; Yu, J. Numerical research of diesel spray and atomization coupled cavitation by Large Eddy Simulation (LES) under high injection pressure. Int. J. Heat Fluid Flow 2016, 59, 1–9. [Google Scholar] [CrossRef]
  31. Agarwal, A.K.; Som, S.; Shukla, P.C.; Goyal, H.; Longman, D. In-nozzle flow and spray characteristics for mineral diesel, Karanja, and Jatropha biodiesels. Appl. Energy 2015, 156, 138–148. [Google Scholar] [CrossRef] [Green Version]
  32. Wang, Z.; Li, Y.; Wang, C.; Xu, H.; Wyszynski, M.L. Experimental study on primary breakup of diesel spray under cold start conditions. Fuel 2016, 183, 617–626. [Google Scholar] [CrossRef]
  33. Xue, F.; Luo, F.; Cui, H.; Moro, A.; Zhou, L. Numerical analyses of transient flow characteristics within each nozzle hole of an asymmetric diesel injector. Int. J. Heat Mass Transf. 2017, 104, 18–27. [Google Scholar] [CrossRef]
  34. Amsden, A.A.; Findley, M. KIVA-3V: A Block-Structured KIVA Program for Engines With Vertical or Canted Valves; Lawrence Livermore National Lab. (LLNL): Livermore, CA, USA, 1997.
  35. Yakhot, V.; Orszag, S.A. Renormalization group analysis of turbulence. I. Basic theory. J. Sci. Comput. 1986, 1, 3–51. [Google Scholar] [CrossRef]
  36. Tan, Z. Multi-Dimensional Modeling Of Ignition And Combustion In Premixed And DIS/CI (Direct Injection Spark/Compression Ignition) Engines; University of Wisconsin-Madison: Madison, WI, USA, 2004. [Google Scholar]
  37. Beale, J.C.; Reitz, R.D. Modeling spray atomization with the Kelvin-Helmholtz/Rayleigh-Taylor hybrid model. At. Sprays 1999, 9, 623–650. [Google Scholar]
  38. Su, T.; Patterson, M.; Reitz, R.D.; Farrell, P. Experimental and Numerical Studies of High Pressure Multiple Injection Sprays; SAE Transactions: Warrendale, PA, USA, 1996; Volume 105, pp. 1281–1292. [Google Scholar]
  39. Wang, Y.; Ge, H.-W.; Reitz, R.D. Validation of mesh-and timestep-independent spray models for multi-dimensional engine CFD simulation. SAE Int. J. Fuels Lubr. 2010, 3, 277–302. [Google Scholar] [CrossRef]
  40. Reitz, R.D.; Diwakar, R. Effect of Drop Breakup On Fuel Sprays; SAE Transactions: Warrendale, PA, USA, 1986; pp. 218–227. [Google Scholar]
  41. Bellman, R.; Pennington, R.H. Effects of surface tension and viscosity on Taylor instability. Q. Appl. Math. 1954, 12, 151–162. [Google Scholar] [CrossRef] [Green Version]
  42. Ibrahim, A.; Bari, S.; Bruno, F. A Study on EGR Utilization In Natural Gas SI Engines Using A Two-Zone Combustion Model; SAE Technical Paper; SAE Transactions: Warrendale, PA, USA, 2007; ISSN 0148-7191. [Google Scholar]
  43. Bari, S.; Yu, C.; Lim, T. Performance deterioration and durability issues while running a diesel engine with crude palm oil. Proc. Inst. Mech. Eng. Part D J. Automob. Eng. 2002, 216, 785–792. [Google Scholar] [CrossRef]
  44. Som, S.; Longman, D.; Ramírez, A.; Aggarwal, S. A comparison of injector flow and spray characteristics of biodiesel with petrodiesel. Fuel 2010, 89, 4014–4024. [Google Scholar] [CrossRef]
  45. Subramanian, K.; Lahane, S. Comparative evaluations of injection and spray characteristics of a diesel engine using karanja biodiesel–diesel blends. Int. J. Energy Res. 2013, 37, 582–597. [Google Scholar] [CrossRef]
  46. Sivakumar, D.; Vankeswaram, S.; Sakthikumar, R.; Raghunandan, B. Analysis on the atomization characteristics of aviation biofuel discharging from simplex swirl atomizer. Int. J. Multiph. Flow 2015, 72, 88–96. [Google Scholar] [CrossRef]
  47. Park, S.H.; Kim, H.J.; Suh, H.K.; Lee, C.S. Experimental and numerical analysis of spray-atomization characteristics of biodiesel fuel in various fuel and ambient temperatures conditions. Int. J. Heat Fluid Flow 2009, 30, 960–970. [Google Scholar] [CrossRef]
  48. Chong, C.T.; Hochgreb, S. Spray combustion characteristics of palm biodiesel. Combust. Sci. Technol. 2012, 184, 1093–1107. [Google Scholar] [CrossRef] [Green Version]
  49. Kim, H.J.; Park, S.H.; Lee, C.S. A study on the macroscopic spray behavior and atomization characteristics of biodiesel and dimethyl ether sprays under increased ambient pressure. Fuel Process. Technol. 2010, 91, 354–363. [Google Scholar] [CrossRef]
  50. Liu, H.-P.; Strank, S.; Werst, M.; Hebner, R.; Osara, J. Combustion Emissions Modeling and Testing of Neat Biodiesel Fuels, University of Texas at Austin. Available online: https://repositories.lib.utexas.edu/bitstream/handle/2152/30746/PR_499.pdf?sequence=1 (accessed on 17 June 2021).
  51. Praveen, A.; Rao, G.L.N.; Balakrishna, B.; Rao, K.S. Comparative analysis of the performance and emission characteristics of a diesel engine by using canola and sesame biodiesel-diesel blends. AIP Conf. Proc. 2019, 2161, 020029. [Google Scholar]
  52. Raghavulu, K.V.; Uppalapati, S.; Jani, S.; Rajalingam, A.; Rasu, N.G. Effect on performance and emission of canola oil and snake gourd oil biodiesel blended in fossil Diesel-Biodiesel blend. Mater. Today Proc. 2021, 37, 1091–1095. [Google Scholar] [CrossRef]
  53. Mehmet, Ş. The influence of canola oil biodiesel on performance, combustion characteristics and exhaust emissions of a small diesel engine. Sak. Univ. J. Sci. 2019, 23, 121–128. [Google Scholar]
  54. Hawi, M.; Kosaka, H.; Sato, S.; Nagasawa, T.; Elwardany, A.; Ahmed, M. Effect of injection pressure and ambient density on spray characteristics of diesel and biodiesel surrogate fuels. Fuel 2019, 254, 115674. [Google Scholar] [CrossRef]
  55. Geng, L.; Wang, Y.; Wang, Y.; Li, H. Effect of the injection pressure and orifice diameter on the spray characteristics of biodiesel. J. Traffic Transp. Eng. 2020, 7, 331–339. [Google Scholar] [CrossRef]
  56. Anis, S.; Budiandono, G.N. Investigation of the effects of preheating temperature of biodiesel-diesel fuel blends on spray characteristics and injection pump performances. Renew. Energy 2019, 140, 274–280. [Google Scholar] [CrossRef]
  57. Yilmaz, N. Performance and emission characteristics of a diesel engine fuelled with biodiesel–ethanol and biodiesel–methanol blends at elevated air temperatures. Fuel 2012, 94, 440–443. [Google Scholar] [CrossRef]
  58. Balasubramanian, D.; Hoang, A.T.; Venugopal, I.P.; Shanmugam, A.; Gao, J.; Wongwuttanasatian, T. Numerical and experimental evaluation on the pooled effect of waste cooking oil biodiesel/diesel blends and exhaust gas recirculation in a twin-cylinder diesel engine. Fuel 2021, 287, 119815. [Google Scholar] [CrossRef]
  59. Matbouei, M.; Weston, D.; Liang, X.; Hainsworth, S. An investigation of the effect of temperature on the oxidation processes of metallic diesel engine fuel system materials and B100 biodiesel from used cooking oil in exposure testing. Fuel 2021, 285, 119063. [Google Scholar] [CrossRef] [PubMed]
  60. Reddy, S.R.; Murali, G.; Shaik, A.A.; Raju, V.D.; Reddy, M.S. Experimental evaluation of diesel engine powered with waste mango seed biodiesel at different injection timings and EGR rates. Fuel 2021, 285, 119047. [Google Scholar] [CrossRef]
  61. Santhosh, K.; Kumar, G. Effect of injection time on combustion, performance and emission characteristics of direct injection CI engine fuelled with equi-volume of 1-hexanol/diesel blends. Energy 2021, 214, 118984. [Google Scholar] [CrossRef]
  62. Saad, I.; Bari, S. CFD investigation of in-cylinder air flow to optimize number of guide vanes to improve CI engine performance using higher viscous fuel. Int. J. Automot. Mech. Eng. 2013, 8, 1096–1107. [Google Scholar] [CrossRef]
  63. Sawant, P.; Bari, S. Effects of variable intake valve timings and valve lift on the performance and fuel efficiency of an internal combustion engine. SAE Tech. Pap. 2018. [Google Scholar] [CrossRef]
Figure 1. KH/RT breakup model [38].
Fuels 03 00007 g001
Figure 2. Power vs. fuel consumption.
Fuels 03 00007 g002
Figure 3. BSFC vs. power.
Fuels 03 00007 g003
Figure 4. Liquid penetration length vs. crank angle.
Fuels 03 00007 g004
Figure 5. Pressure vs. crank angle.
Fuels 03 00007 g005
Figure 6. Temperature vs. crank angle.
Fuels 03 00007 g006
Figure 7. Vapor penetration length vs. crank angle.
Fuels 03 00007 g007
Figure 8. Breakup length vs. crank angle.
Fuels 03 00007 g008
Figure 9. Droplet mass vs. crank angle.
Fuels 03 00007 g009
Figure 10. Sauter mean diameter vs. crank angle.
Fuels 03 00007 g010
Figure 11. Spray of Biodiesel.
Fuels 03 00007 g011
Figure 12. Spray of diesel.
Fuels 03 00007 g012
Figure 13. Cumulative heat release vs. crank angle.
Fuels 03 00007 g013
Figure 14. Heat release rate vs. crank angle.
Fuels 03 00007 g014
Figure 15. Power vs. fuel consumption.
Fuels 03 00007 g015
Figure 16. BSFC vs. power.
Fuels 03 00007 g016
Figure 17. Brake thermal efficiency vs. power.
Fuels 03 00007 g017
Figure 18. CO vs. power.
Fuels 03 00007 g018
Figure 19. CO2 vs. power.
Fuels 03 00007 g019
Figure 20. HC vs. power.
Fuels 03 00007 g020
Figure 21. NOx vs. power.
Fuels 03 00007 g021
Table 1. Specification of HINO W04D diesel engine.
Technical SpecificationValue/Type
Bore104 mm
Stroke108 mm
Number of cylinders4
Compression ratio17.9
Engine speed1500 rpm
Engine displacement4000 cc
Publisher’s Note: MDPI stays neutral with regard to jurisdictional claims in published maps and institutional affiliations.

