Abstract
The use of biofuels in vehicles becomes more advantageous than the consumption of fossil fuels, mainly because it uses renewable sources of energy. Recently there are some concerns about biodiesel sources, and hydrotreated vegetable oils (HVO) appear as a possible advanced solution. To understand the effect that the implementation of the new and old European type-approval test cycles (NEDC e WLTP) has on the results of these fuels considering pollutant emissions and fuel consumption results, a EURO V vehicle was subject to these cycles and also to engine performance evaluation tests. For this analysis, the fuels considered were: B0 (pure diesel), B7 (7% of biodiesel), B15 (15% of biodiesel), B100 (pure biodiesel), and HVO15 (15% of HVO). The findings lead to the conclusion that completely replacing fossil fuels with biofuels is not the most cost-effective approach. No significant differences were observed considering the two homologation cycles, the oldest (NEDC) and the actual (WLTP) and the use of HVO also does not present any relevant differences concerning the fuel consumption differences to B0 (+0.58% NEDC and +0.05%WLTP), comparing well with biodiesel behavior (−1.74% NEDC and −0.69%WLTP for B7 and +1.48% NEDC and 1.89% WLTP for B15). Considering the power of the engine obtained with the fuels, the differences are almost negligible, revealing variations smaller than 2% for B7, B15, and HVO15.
1. Introduction
The benefit that today’s society obtains from energy reveals a monumental technological evolution and promotes an exponential growth in the quality of life. However, the amount of energy that humans consume, and all the resources considered fundamental to maintain the dynamics of society, from electricity to transport sectors, reflect a problematic energy fossil fuel dependence. It is evident that this dependency, for all its designated cons, is not an ideal condition. Nevertheless, this situation worsens considerably in relation to the most exploited energy source: oil. In addition to oil being a non-renewable energy source, which may be extinguished due to excessive use, the pollutant emissions, and the release of carbon dioxide resulting from its intensive use are unaffordable for atmospheric equilibrium. Since energy is currently used in almost all sectors, even in the most trivial things, the consequences of oil abuse are already evident in the ecosystem, which is even more amplified in transportation.
The worsening of global warming and air pollution has led to growing concern among experts who continually seek solutions to mitigate its effects. The automotive industry is one of the sectors most in need of reorganization, due to its relevant exhaust emission rates. Several actions have already been implemented to encourage a reduction in the number of vehicles in circulation, such as the improvement of public transport networks (comfort, schedules, routes, and cost) or the provision of low-cost electric bicycles and scooters.
Moreover, the circulation of heavy vehicles for cargo and passenger transport, which exists in large numbers, would not suffer any change. Therefore, the solution to improve pollutant emissions may lie not only in the reduction of vehicles in circulation, but in the vehicles themselves, by the fuel they use, and by their ability to act on the gases they emit.
From the vehicle itself, there are two ways to reduce emissions of polluting gases into the atmosphere: using innovative emission-reduction technology to improve engine efficiency and exhaust system capability or parameterizing the vehicle for the use of less polluting fuels in both the production and combustion processes.
Emissions standards are the official requirements that regulate the maximum limits of polluting emissions and that must be respected by all vehicles that were produced with the intention of being commercialized to circulate on European roads. The Euro Standard defines the allowable pollutant emissions considering particulates and exhaust gases, the type of tests applied to vehicles, the associated consumption limits, the testing methodology, and the mandatory technological innovations of the vehicles. It is imperative that vehicles’ engines comply with all the regulations described in the Euro Standard in effect at the time of manufacturing. Over the years, six Euro Standards have been implemented, with ever-higher levels of demand and rigor, not only in restricting the permissible limits but also in optimizing the tests that vehicles are subjected to. The transition from the NEDC cycle to the WLTP protocol for vehicle approval, which took place in 2017, aimed at this optimization, attempting to reproduce real driving conditions in a more authentic way and, consequently, achieve more realistic emissions and fuel consumptions.
In view of this, the application of exhaust gas treatment devices has been the most adopted resource by manufacturers. First, because there are several technologies with an efficient performance in the attenuation of different emissions, specifically of substances considered pollutants. Then, despite the fact that vehicle approval legislation is becoming more stringent and demanding, emissions are controlled “tank-to-wheel”, which means that emissions from fuel production are not accounted for. In this way, and for legal purposes, treating pollutants emitted directly by the vehicle is not sufficient.
At a more comprehensive level, the use of biofuel emerges as a viable solution for reducing emissions, since its production represents much lower carbon emissions than those resulting from the production of fossil fuels. Furthermore, it is a renewable fuel, from non-fossil organic sources, that is, unlimited. The evolution in the development of biofuels from new origins also becomes a great asset of this energy source. The ethical controversy associated with the first generation of biofuels (“FAME”) was surpassed by the second generation (“HVO”), which comes only from residues, debris, and waste from industry and agriculture. Furthermore, in addition to the optimization of the raw materials used, the evolution of biofuel generation has permitted the development of fuels with more interesting physical and chemical characteristics, known as synthetic fuels.
In view of all the mentioned advantages, it is not necessary that the consumption of biofuel represents a considerable reduction in the direct emissions of exhaust gases from a vehicle. If the emissions are not significantly higher, the advantage of deriving from greener production takes precedence.
Although synthetic fuels can be manufactured on a customized basis, allowing pollutant emissions to be improved more easily by allowing the contribution to greenhouse gas emissions to be minimized, this analysis will depend mainly on the level of sustainability of their raw materials (fossil/renewable), the energy source from which they are developed, and the energy and efficiency of the process [1].
There are many results about the use of first-generation biodiesel considering the use in light vehicle engines having the NEDC test as a reference, however, taking into consideration the change in the homologation test cycle and the increasing perspective of the use of synthetic fuels such as HVO, it is important to know how the change of cycle and fuel can be related. This important analysis has not yet been carried out and that is one of the main purposes of the present work.
To understand whether biofuels are, in fact, a beneficial solution, it is crucial to understand the consequences resulting from their use on the performance, consumption, and emissions of vehicles. The main objectives of this work are to verify the consequences inherent to the use of biofuels in a diesel engine, on performance, consumption, and emissions from the engine; to verify the impact that the use of a different cycle could represent in the measured parameters, by comparing the results obtained with the older tests (NEDC), still used in the approval of Euro V vehicles, and with the new approval protocol (WLTP), considering the most traditional biodiesel and the advanced HVO.
Although it is not an option of high-priority interest, the development of alternative fuels is not stagnant, its evolution allows to reach substances with better and better properties and the advantages of its use are more and more noticeable.
The organization of the paper consists of an introduction followed by the literature review in Section 2. In Section 3 the experimental methodology is explained and in Section 4 and Section 5 the results are respectively discussed, finalized with the last section of conclusions where the most important findings were summarized.
2. Literature Review
The biofuels segment already has an expressive dimension in its variety, both in raw materials used as in production technologies, reaching a terminology of renewable fuels broad and constantly updated. Although “biofuel” is the most pronounced expression in general, this term covers variants with different origins, characteristics, and conditions, so it is relevant to distinguish and specify each element [2].
Although experts have directed their research to use waste and algae as raw materials, first-generation energy sources still symbolize a large part of biofuel production, since there are economic and legislative barriers that create a gap between technical potential and actual production. The truth is that biodiesel, HVO, and bioethanol accounted for more than 95% of biofuel consumption in the European Union in 2017 [3].
The drawbacks associated with the consumption of conventional diesel are already known. In addition to the dependence on a fossil fuel representing a warning sign for its exhaustible character, there is a need to reduce emissions of substances responsible for the greenhouse gas effect (GHG) [4].
European legislation seeks to define and implement increasingly stringent targets to reduce these emissions, considering not only TTW (tank-to-wheel) emissions but also WTT (well-to-tank) emissions. The possible hesitations in relation to biofuel arise due to its direct and indirect environmental effects associated with land use and water consumption [3]. This is because, although the use of biofuels can reduce direct GHG emissions, this benefit might be offset by emissions from indirect land change use (ILUC). However, if the consequences of soil change are considered in the selection of raw material and if, for raw materials produced in soil, lands with high biodiversity and high carbon rates are abolished, new-generation biofuels can significantly reduce total GHG emissions [3,5].
Advanced biofuels respond to this need. Based on lignocellulosic feedstocks (agricultural and forestry residues), non-food crops, or industrial residues, these fuels imply low CO2 and GHG emissions and achieve very low or zero ILUC impacts. Furthermore, the processing of some feedstocks considered advanced is compatible with the current production infrastructure, and the controversies surrounding the consumption of foodstuffs as fuel do not apply to these new raw materials. Europe, including Portugal, intends to invest in advanced fuels and this can be seen in the impositions of the new RED II [3].
The analysis of the direct effects on the engine inherent in the consumption of biofuels has been the object of study for several researchers and the present report also focuses on this matter. Gad et al. [6], when testing a diesel engine with fuel blends from Jatropha oil, achieve power and torque reductions at the engine’s output by increasing the percentage of biodiesel in the mix. Additionally, the average effective pressure, thermal efficiency, volumetric efficiency, CO, and smoke emissions were reduced in these conditions. On the other hand, the consumption of biodiesel resulted in higher NOx emissions when compared to pure diesel. The study by Tamilselvan et al. [7] confirmed a slight reduction in thermal efficiency associated with biodiesel, a reduction in CO and smoke emissions, and an increase in NOx emissions; moreover, it detected an increase in brake specific fuel consumption (BSFC), an increase in CO2 emissions and a reduction in HC emissions. Verma et al. [8] validated most of the observed trends.
Kroyan et al. [9] demonstrate that fuel mixtures with a percentage of HVO result in lower CO2 emissions, although this effect is not evident in the consumption of biodiesel mixtures. According to Dimitriadis et al. [2], mixtures of this nature also promote the reduction of NOx, HC, and particulate emissions.
An et al. [10] demonstrate an increase in BSFC compared to mixtures with a higher percentage of biodiesel, making this difference even more evident with the decrease in engine load. The results of thermal brake efficiency (BTE) show that biodiesel assumes a favorable position in relation to diesel at high loads, inverting this tendency in low loads. The cylinder pressure decreases with the use of biodiesel and the CO emissions vary significantly with the engine load, with the use of biodiesel being favorable only at higher loads. Buyukkay [11] also observed an increase in BSFC with biodiesel from pure rapeseed oil in his tests, as well as an increase in NOx emissions. Chiba et al. [12] confirm an increase in specific consumption associated with biodiesel, as well as higher NOx emissions, although they consider that the variations are insignificant; it was stated that the engine powers obtained through biodiesel and diesel are equivalent.
Some authors conclude that fuel mixtures such as B20 [13] or B40 [14] provide the best energy performance since they establish the most favorable relationship between the engine’s performance and the resulting emissions. Furthermore, the application of biodiesel up to 20% in the fuel mixture (B20) results in fuels that fully comply with the technical specification for diesel (EN590). Therefore, this is a solution with immediate availability, without the need for large additional investment in infrastructure or vehicles.
In general, it is possible to identify a reduction in the average WTW (well-to-wheel) CO2 emissions, when diesel and gasoline are replaced by biofuels, which makes their application promising when using advanced raw materials [3]. Furthermore, the improvements in vehicle performance detected by some researchers, associated with the consumption of fuel mixtures with a percentage of biodiesel, intensifies with the insertion of additives, allowing us to achieve higher efficient energy conversion with a minimum of impact on the environment [4].
The economic and functional potential of biodiesel, associated with the fact that it is compatible with diesel engines without any changes, reflects promising levels of application. This would be very positive, not only for the reduction of emissions but also for the expansion of the industry and for diesel engine manufacturers since new liquid fuels could illuminate a not-so-promising future for traditional internal combustion engines using fossil fuels [4].
In this context, considering the constant evolution of the vehicles and the respective engines, it is important to evaluate the effects on emissions, performance, and consumption in a vehicle with EURO V technology, when using fuels with different proportions of biodiesel, while also evaluating the incorporation of the not so well-known HVO.
Since the 1990s, vehicles have been tested based on the same standard test, to verify that their emissions are within the limit stipulated by the current standard. Until 2017, vehicle evaluation was carried out according to the NEDC test cycle; however, some doubts began to arise regarding the accuracy of its results. For this reason and in addition to constant updates of standards and increasingly ambitious requirements, the test cycle used for approval also revealed a need for optimization [15]. From this date, the WLTP test cycle started to take effect. The specific characteristics of both tests allow realizing that the WLTP cycle is more rigorous and detailed in the approval of vehicles.
The WLTP test cycle achieves higher average and maximum speeds and accelerations than the previous NEDC test cycle, which has a longer cycle time and reproduces a shorter overall stationary period, thus simulating greater distances. Furthermore, the “urban” and “extra-urban” driving phases adopted in the NEDC cycle are replaced by four representative phases of different speeds, the fixed-gear change points start to vary according to the vehicle and additional equipment that can change the results is now accounted for. Theoretically, this gives the WLTP cycle a more dynamic and representative nature of the actual driving. Temperature control also played a key role in this evolution, since measurements previously quantified in a temperature range between 20 °C and 30 °C, are now measured precisely at 23 °C (CO2 emissions corrected to 14 °C), the European average temperature [16,17,18,19].
In addition to achieving more reliable measurements, all these improvements transform WLTP into a test cycle adjustable to different regions of the world, allowing for an egalitarian character worldwide, not only in the comparison of values (polluting emissions, fuel consumption) but also in the attribution of certificates of conformity and fees applied to different vehicles [20]. Tests of the same vehicle, under the same conditions, according to different test cycles, allow proving the influence that the differences between the test cycles have on the final results of the measured values.
Pavlovic et al. [16] tested the impact that the change of the NEDC test cycle for WLTP could have on CO2 emissions through the CO2MPAS simulation tool. Their results confirm the theories of the authors they mention, demonstrating that WLTP can reproduce a 25% increase in CO2 emissions and, therefore, contributes to the eradication of the variances between homologation and real-world values, both in emissions and in fuel consumption.
Additionally, in a simulation scenario, Tsiakmakis et al. [21,22] concluded that, for CO2 emissions, the overall average proportion of WLTP and NEDC is about 1.19, which is equivalent to 23.1 g CO2/km. However, this relationship tends to decrease with the increase in mass, capacity, or power of the vehicle and for higher values of emissions (250 g CO2/km in the NEDC), being able to reach ratios below 1; they also note that this ratio is slightly higher in gasoline vehicles than in diesel vehicles. Even so, the authors consider that the WLTP gives a more reliable character to the homologation.
In an experimental context, Pavlovic et al. [23] tested 31 vehicles (20 gasoline and 11 diesel) with both test cycles to investigate differences in CO2 emissions and energy consumption. The resulting analysis highlights the “worst-case scenario” (vehicle with greater mass, greater rolling resistance, and worse aerodynamics) and the “better case scenario” (vehicle with lower mass, lower rolling resistance, and better aerodynamics) for the parameters measured in WLTP. Compared to NEDC, the results indicate, in a worst-case scenario, increases of 44% in energy consumption and 11% in CO2 emissions and, in conditions of a better scenario, increases of 26% and 1%, respectively. The authors conclude that the implementation of WLTP affects diesel vehicles more than gasoline and that it potentially halves the gap between homologated fuel consumption and actual consumption.
Considering the potential of HVO, Bortel et al. [24] detect that without any changes in ECU settings the use of HVO does not promote significant effects on acquired energetic and emission parameters.
The results in an engine testbed reveal that introducing proper fuel injection strategies allows to take the best of HVO characteristics [25], but this is not easy to do in the current fleet of vehicles and it is important to understand what happens when different fuels are introduced in the market. Additionally, the study of Ahmad et al. reveals an increase in thermodynamic efficiency of 2.2 to 2.7% compared with baseline diesel operation, considering the engine calibration process [26].
The work presented by Rimkus et al. [27] also considers the use of an engine dynamometer and reveals that the energy conversion of HVO seemed more effective than pure diesel fuel. The differences are inexistent or only slightly depend on the load or speed regime. The variations present small increases ranging from 0.5 to 1.4%. In fact, Cheng et al. concluded that HVO presents the air–fuel premixing process and spray formation similarities with conventional diesel [28].
In terms of pollutant emissions some advantages when compared with diesel fuel concerning particulate emissions [29] but did not reveal detectable differences considering NOx [30].
3. Experimental Methodology
For the comparison of the results obtained to be more reliable, it is important that the vehicle is tested with similar conditions in all the tests. For this, the tests were reproduced based on the standard used for vehicle approval, from 1 June 2017.
3.1. Laboratory Procedure and Resources
All the equipment used in the measuring process are presented in Figure 1 and described below (Table 1):
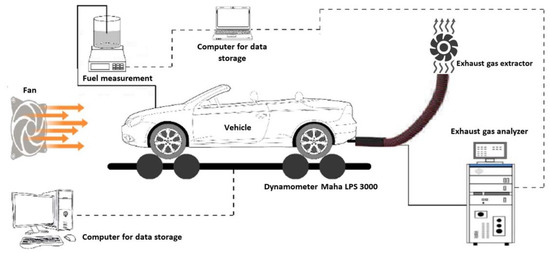
Figure 1.
Assembly diagram of the equipment involved in the tests.

Table 1.
Main characteristics of the measurement equipment of the laboratory test.
- ○
- The vehicle is located on the chassis dynamometer that measures the engine’s performance (power and torque) and wheel speed.
- ○
- The atmospheric conditions inside the laboratory were controlled and acquired to assure similar conditions. By means of a fan, a continuous airflow was maintained, simulating a speed of 90 km/h; this speed does not coincide with the vehicle speed, but it is the same in all tests and allows an effective engine cooling.
- ○
- The fuel that was consumed by the vehicle comes from a vessel positioned on a digital gravimetric weight scale, which continuously measures the mass of the fuel.
- ○
- Emissions from the exhaust pipe were measured through a sample that was picked and driven to the exhaust gas analyzer.
All the parameter data were saved in a computer that stores the values measured throughout the test at a rate of 10 Hz. It should be noted that the experimental activity was designed with reference to the test methods defined by the standards, for both the NEDC and WLTP.
The NEDC and the WLTP tests were performed assuring the same initial condition and were repeated three times. The presented values correspond to the average of these three tests. The fuel consumption results for the same condition (fuel) present a variability below 1%. If any test presented a higher value, it was discarded, and that test was repeated.
The performance tests present an accuracy of at least 2% concerning the measurement of power and torque. Although, for each sample of fuel, the results also present the average of three measurements considering a maximum variation of 1% between comparative tests.
3.2. Vehicle
The vehicle used in the tests is equipped with a 103 kW engine, supplied with a common-rail injection system [31]. The engine specifications are detailed in Table 2.
Table 2.
Engine specifications.
In addition to the specifications, the engine in question and certain surrounding devices have some peculiarities that can influence the combustion behavior, engine performance, and/or the resulting emissions. These factors become crucial in comparing results obtained through different vehicles. Therefore, the following are some characteristics of the system considered relevant [31]:
- -
- The piezo injectors (very precise) assume a vertical and centered position relative to the cylinder, in order to spray in the center of the piston. Furthermore, the injection moment and the injection pressure are parameters controlled according to the engine load and rotation, and the pressure can reach 1800 bar, which greatly favors the air–fuel mixture and there are pre-injections and post-injections, in addition to the main injection.
- -
- The system is equipped with two EGR valves associated with different circuits: high pressure and low pressure. The high-pressure circuit directs part of the gases released by the engine directly to the intake, having its line of action at low loads and engine speeds. The low-pressure circuit guides part of the exhaust gases to the particulate filter outlet for the intake of the turbocharger.
- -
- The exhaust system of the vehicle used in the tests has a catalytic oxidation converter and a particulate filter. The particle filter is located very close to the engine, immediately after the oxidation catalyst. As a result, the temperature may be increased, which aids in the system’s optimal working. Thus, in addition to helping ensure effective regeneration, the amount of fuel inherent to post-injections to increase the temperature is reduced. It is important to note that the oxidation catalytic converter is accountable for transforming hydrocarbons (HC) and carbon monoxide (CO) (polluting gases) into water and carbon dioxide (CO2) and, the particulate filter enables the conversion of soot to CO2.
The emissions measurement point selected was at the end of the exhaust system pipe, which means that the obtained values correspond to the typical use of the vehicle, considering the actuation of the exhaust treatment systems.
3.3. Fuels
Biofuel and pure diesel are fuels with different physical and chemical properties (Table 3). The biofuel was obtained through the esterification of used cooked oils (UCO) and the HVO was obtained through the synthetization of biomass residues.
Table 3.
The properties of the fuels used to carry out the tests (adapted from [30,32,33,34]).
The mixture of these substances in different proportions gives rise to fuels with properties whose values vary between the corresponding properties of their base constituents, depending on each one’s percentage.
Knowing these properties theoretically allows foreseeing the combustion behavior and consequently, presupposing the implications of the transition between fuels, both in polluting gas emissions, as well as in the consumption and performance of the engine.
It should be noted that the HVO100 fuel was not used for the study; however, it was necessary to identify its properties to estimate the properties of HVO15.
4. Results and Discussion
Subjecting different fuels to the same usage condition in vehicles is perhaps the best way to test the viability of a fuel and to understand the benefits inherent to its use, compared to others.
In the present study, the same vehicle was fueled with different fuels and analyzed through power tests and reproductions of the NEDC and WLTP test cycle. The fuels used represent mixtures with different percentages of biofuels and biofuels from different generations. Since all fuels are subjected to the same test under standardized conditions, it is possible to verify the influence of biofuels on performance, consumption, and emissions from the engine. It is important to understand the differences caused by the introduction of the new WLTP face to the oldest NEDC, which was the test procedure considered for the homologation of the significant majority of vehicles circulating at present.
4.1. Fuel Consumption and Gaseous Emissions
As mentioned in Section 3.1, the fuel consumed in the reproduction of the test cycles (NEDC and WLTP) was determined by measuring the fuel mass in the initial and final phases of the test. The difference between the measured mass values corresponds to the mass of fuel consumed.
4.1.1. Mass of Fuel Consumed
As mentioned in Section 3.1, the fuel consumed in the reproduction of the test cycles (NEDC and WLTP) was determined by measuring the fuel mass in the initial and final phases of the test. The difference between the measured mass values corresponds to the mass of fuel consumed.
In view of the analysis of the graph presented in Figure 2, the most prominent verification consists of the similarity of the evolutionary behavior in the two cycles, demonstrating a clear trend in consumption according to the fuel used. This clearly reveals that the use of different homologation cycles does not introduce significant differences in the fuel consumption results for the different fuel blends. The increase in consumption when using B100 fuel is evident and significant. On the other hand, B7 fuel has the lowest amount of fuel mass consumed, being even lower than the consumption obtained with the use of pure diesel. The B100 fuel has a lower calorific value than the calorific value of the other fuels tested, corresponding to energy stored in the fuel that is also lower. Therefore, to achieve the same amount of energy in combustion, the consumption will necessarily have to increase, penalizing the efficiency of energy conversion.
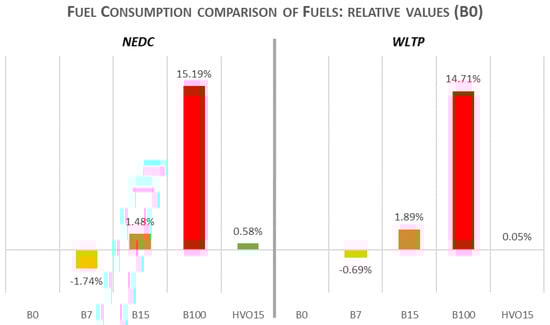
Figure 2.
Percentual differences of the mass of fuel consumed when compared with the B0 fuel, depending on the fuel used.
The use of HVO15 presents an insignificant increase in fuel consumption, which is confirmed in both test cycles. B15 presents a small increase in fuel consumption, above 1% in mass. It is interesting to note that the higher density of B15 allows attaining a similarity among the fuel consumption in a volumetric analysis.
Following the same line of thought, the use of B7 fuel would have to translate into a consumption higher than the consumption of pure diesel, since its calorific value is lower than that of B0. However, as the B7 fuel corresponds to a fuel mixture with only 7% biodiesel, the difference between the calorific powers of B0 and B7 is very small. The combustion quality is highly correlated with the amount of fuel injected requirements to give the necessary energy demands and, subsequently, to the energy conversion efficiency. The energy conversion efficiency is relative to the relationship between specific consumption (“sfc” in g/kWh) and the calorific value of a specific fuel (“LHV” in kWh) [35].
The quality of combustion and consequently the emissions associated with it is closely linked to the efficiency of energy conversion. Biodiesel has a lower calorific value than pure diesel; at the outset, its use would result in an increase in energy conversion efficiency, since the calorific value is in the denominator. However, as previously mentioned, the calorific value reflects the energy involved in the combustion process, so a lower calorific value implies the need for a larger amount of fuel for the same level of energy involved. If the calorific value decreases considerably, the amount of fuel injected into the cylinder will rise, also impairing the energy conversion efficiency.
In short, for the energy conversion efficiency to reach its maximum value, it is necessary to have a balance between the calorific value and the specific fuel consumption (sfc). Therefore, not only the calorific value of biodiesel but all the other properties (viscosity, density, cetane number, oxygen in the molecular formula, ignition advance) play a role for more efficient combustion, and for lower blends, where the energetic content of the fuel is not significantly reduced, the other properties’ contributions prevail. This could lead to more efficient combustion, therefore, leading to a reduction in the necessary fuel. It should be noted that the application of fuel that means less consumption produces the lowest CO2 emissions. This is in accordance with the expectations since there is a connection between these two quantities: the consumption of a greater amount of fuel leads to a higher CO2 emission rate. This should be confirmed in Section 4.1.5, where the CO2 emissions were analyzed.
4.1.2. Carbon Oxide (CO)
Carbon monoxide (CO) is a gas that results from incomplete combustion, caused by a lack of oxygen or very short combustion reaction times. Therefore, the emission of this gas becomes more relevant in engines that operate with rich mixtures, where the amount of oxygen available for carbon atomization is smaller [35]. Since the engine used in the experimental activity corresponds to an engine that operates with lean mixtures (diesel), the emission of this gas would not be a concern at the outset. However, an analysis becomes decisive given that carbon monoxide (CO) is very dangerous, causing severe and often fatal intoxication. Hemoglobin of human blood presents a higher affinity for CO taking oxygen place and make it transported to all parts of the body, causing severe asphyxiation [36].
Biodiesel consists of a greater amount of oxygen in its molecular structure (oxygenated fuel) and is equipped with a higher cetane number when compared to simple diesel. Theoretically, these properties improve the combustion capacity, consequently reducing CO emissions: the greater number of cetane allows “an advance of the mixture’s inflammation, reducing the possibility of rich mixing zones” and in turn, the oxygenation of the fuel itself increases the amount of oxygen available for carbon atomization [37].
By analyzing the graphic shown on the bellow of Figure 3, it is possible to verify the theoretical trend in emissions resulting from the NEDC test cycle. In the values presented for this cycle, a reduction in CO emissions becomes visible due to an increase in the percentage of biodiesel, with this reduction being more evident in the extra-urban cycle. This effect makes sense at a theoretical level since at high speeds the reaction time for combustion becomes shorter and the advantage of having oxygen present in the constitution of biodiesel becomes more noticeable.
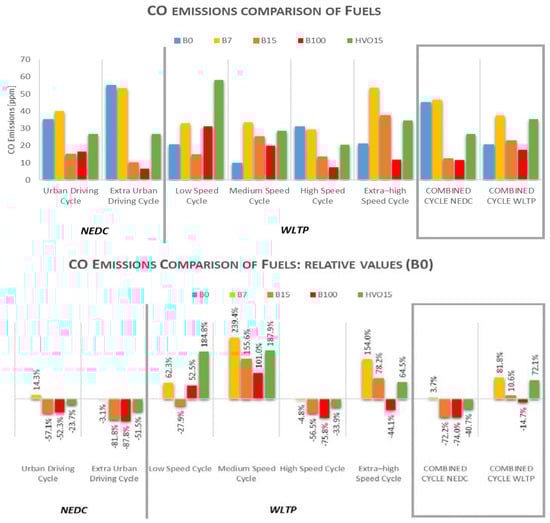
Figure 3.
CO emissions comparison of fuels, in total value and in percentage differences, in relation to the B0 fuel.
Most of the phases of both test cycles show an increase in CO emissions during the transition from B15 fuel to HVO15 fuel. This effect is contrary to what is theoretically expected. Since HVO is a fuel with a higher number of cetane, lower density, and higher calorific power when compared to pure diesel and FAME itself, the quality of combustion from the use of HVO should lead to a reduction in CO emissions.
In the CO emission values for the WLTP test cycle, only the High-Speed Cycle follows the previously mentioned trend. The remaining phases of this cycle do not follow a unanimous trend, even presenting an increase in CO emissions in the Average Speed Cycle with the use of biodiesel (however, it does not show proportionality with the percentage used). This effect may result from the dynamics of the cycle itself since the WLTP test cycle is composed of more frequent and abrupt changes in speed. When increasing the applied load, the amount of fuel injected will necessarily have to be greater; on the other hand, the calorific value of biofuels is less than the calorific value of pure diesel. Since the calorific value “represents the amount of energy stored in the fuel and that can be released in the combustion process” [37], a lower calorific value implies a greater amount of fuel injected to achieve the same amount of energy.
The amount of fuel injected with biodiesel is, therefore, higher, and as the specific consumption increases the air/fuel ratio will decrease, evolving to a greater oxygen deficit. Since we are facing the imposition of richness in the mixture, the oxygen present in biodiesel will not be sufficient to be significant thus increasing CO emissions.
An article published by T. Kaya et al. [35] describes the production of a study like the one presented in this report. Regarding CO emissions, these authors obtained a reduction of values both in the substitution of diesel for biodiesel as well as in the exchange of the test cycle used from NEDC to WLTP.
On the left of the graphic presented in Figure 3, it is possible to perceive the effect described by the authors in some specific cases; for example, if we exclusively highlight the extra-urban phase of the NEDC cycle and the high-speed phase of the WLTP cycle. However, the combined cycle (which includes all phases of the cycle in question) does not demonstrate the trend mentioned by the authors, as it presents higher emission values for B7 compared to B0 (in any of the cycles) and higher emission values for B15 in WLTP, compared to the value obtained in NEDC.
It should be noted that the values of CO emissions obtained through the tests, whatever the cycle used, are extremely low since it is the analysis of a diesel engine. The order of magnitude of the values obtained is equivalent to the order of magnitude of the analyzer’s uncertainty, so the uncertainty of the results and, consequently, of the conclusions, is considerable.
4.1.3. Hydrocarbons (HC)
Hydrocarbons are compounds originated by the reaction of carbon atoms with hydrogen atoms and are part of the group of main air pollutants.
Hydrocarbon emissions, similarly to CO emissions, result from incomplete reactions which have already been mentioned, are the result of a lack of oxygen or a very short combustion reaction time [37]. The fact that these gases come from the same source justifies the similarity of the behavior of their emissions in relation to the variation of the fuel used.
Theoretically and as mentioned, the properties of biodiesel lead to more complete and efficient combustion since a greater number of cetane allows an advance in the ignition, dissipating possible rich mixing zones inside the cylinder and the presence of oxygen in its molecular formula decreases the possibility of oxygen deficit, necessary for complete combustion [37].
Since these emissions are only linked to the whole completion of combustion, a higher percentage of biodiesel in the fuel mixture corresponds, supposedly, to a reduction in emissions.
When analyzing the graph shown on the bellow of Figure 4, it is possible to verify that the results do not correspond to the theoretical foundations.
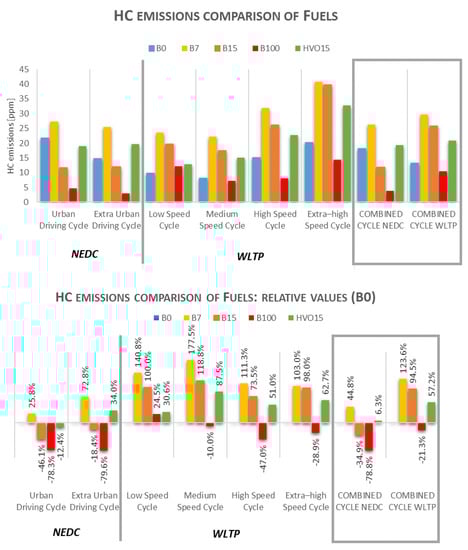
Figure 4.
HC emission comparison of fuels, in total value and in percentage differences, in relation to the B0 fuel.
This effect could be justified, as described in the previous sections, by the fact that the calorific value of biodiesel is lower than the calorific value of pure diesel.
Since a greater amount of fuel is needed to achieve the same amount of energy in combustion, the oxygen present in the biodiesel molecule may not be enough to compensate for the enrichment of the mixture, thus creating an oxygen deficit and consequently increasing HC emissions.
However, the distribution of the values shown in the percentage difference graph shows an interesting trend in all phases of both cycles. When comparing the results obtained through the variation of the fuel used, the values resulting from the use of pure diesel are the only values that do not agree with the theoretical foundations. If B0 is excluded from the analysis, HC emissions are continually reduced due to an increase in the percentage of biodiesel in the fuel mixture. This may reveal a measurement error either from the process or from the measurement equipment itself, in the tests produced using B0.
Contrary to what was seen in CO emissions, the values obtained from HC emissions reflect a reduction in emissions in view of the transition from B15 fuel to HVO15 fuel. As already justified, this effect is consistent with the expectations, since the higher calorific value, lower density, and higher number of cetane from HVO give it a better combustion quality.
The work published by T. Kaya et al. [35], also reports a behavior in HC emissions similar to the behavior of CO emissions, that is, a reduction in their value both in the replacement of diesel with biodiesel and in the exchange of the test cycle used, from NEDC to WLTP.
4.1.4. Nitrogen Oxides (NOx)
Nitrogen oxides (NOx) result from the chemical reaction between a nitrogen atom and one or more oxygen atoms. Only two of its constituents, nitrogen monoxide (NO) and nitrogen dioxide (NO2), are considered primary pollutants, of which nitrogen monoxide assumes the highest percentage of emissions in this family. However, NOx is analyzed as a whole. Firstly, due to the ease with which a nitrogen oxide, in the presence of oxygen, reacts with that atom or molecule, changing its molecular formula. Second, although most NOx do not correspond to primary pollutants, their reaction with volatile organic compounds and the presence of solar radiation results in ozone (O3) which when present in the troposphere can be harmful to health [38,39].
Part of the emissions of these gases, which are released into the atmosphere, result from natural agents, namely electric discharges, or microbial transformations in the soil; however, the vast majority of emissions originate from burning fossil fuels at high temperatures, mainly from the industrial and transport sectors [38,40].
Respiratory problems, acid rain, and detriments to photosynthesis are consequences of the excess of nitrogen oxides in the atmosphere, so the implications of emissions of these gases are significant at an environmental and human level [38,40].
Among several articles and published laboratory tests, NOx emissions are perhaps the most controversial results among authors. This variability of results comes essentially from the considerable extension of parameters that influence the emission of these gases. High temperatures, particularly in combustion, represent the main cause associated with the formation of NOx. Clearly, there are conditions that affect the development of these gases in advance, such as the type of engine considered and the corresponding type of injection, the existence of exhaust gas recirculation (EGR), the regime to which the engine was subjected, and the conditions of the tests to which it was subjected. However, other more specific parameters can affect, directly or indirectly, the production of these compounds: the amount of oxygen available in combustion, the properties of the fuel used (from its cetane number, atomization capacity, viscosity, density, even to its molecular formula), the instant of injection and its progress [37].
The analyzed papers published by other authors reveal some interesting and coherent conclusions about NOx emissions. However, the results obtained in the face of the variation of the fuel used are inconsistent. The various authors of one of the analyzed articles [41] concluded, first of all, that all the fuels tested resulted in a NOx emission that is in accordance with the established standard. By making a differentiation between NO and NO2 emissions, through isolated measurements, it was possible to identify a considerable increase in the percentage of NO2 emitted, in relation to what was hypothetically expected; this effect is justified by the use of a diesel engine since it works with poor mixtures and consequently with excess oxygen. In addition to these checks, they achieved a reduction in NOx emissions through the use of fuel mixtures with a higher percentage of biodiesel. Furthermore, they associated this reduction with an improvement in energy conversion efficiency since biodiesel has a higher viscosity than pure diesel. In turn, and contrary to previous authors, Kaya et al. demonstrate in their article [35] a slight increase in NOx emissions, in view of the use of higher percentages of biodiesel in the fuel mixture. Nonetheless, the most relevant conclusion reached by these authors is based, not on the direct consequences of the fuel variation, but on the evolution of the emissions of these compounds in response to the variation of the regime applied to the engine. Therefore, it was possible to see a considerable increase in these emissions as a result of the transition from the NEDC cycle to WLTP. This effect was justified by the dynamics of the test cycles, since the WLTP cycle adopts peaks and speed variations that are more pronounced when compared to the NEDC cycle, increasing the temperature inside the cylinder.
The graph shown on the bellow part of Figure 5 corresponds to NOx emissions depending on the fuel used. When analyzing its distribution, it becomes clear that an increase in speed implies an increase in NOx emissions. Furthermore, the graphic proves that the production of the WLTP cycle results in higher NOx emissions than the production of the NEDC cycle. These findings, in addition to being consistent with the defense of the authors Kaya et al. [35], are theoretically consistent. A speed increase implies the injection of a larger amount of fuel. In turn, an increase in the amount of fuel inside the cylinder gives rise to an increase in the combustion temperature. As previously mentioned, NOx emissions are closely linked to the combustion temperature, so an increase in this temperature leads to an increase in emissions of these pollutants. Since the WLTP cycle is equipped with higher peaks of speed and more abrupt speed variations, the amount of fuel involved in the course of the cycle is also higher, reaching the highest combustion temperature and consequently more important deviations.
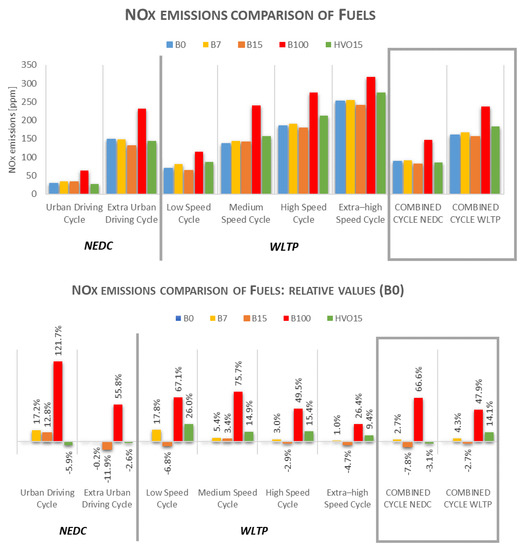
Figure 5.
NOx emissions comparison of fuels, in total value and in percentage differences, in relation to the B0 fuel.
The optimization of energy conversion efficiency translates into more complete and efficient combustion, which reduces NOx emissions. Generally, this is coherent with the results achieved with the application of low percentages of biodiesel in the fuel mixture, on the order of 10–20%.
Biodiesel has properties that influence NOx emissions in a contradictory way, which makes its use paradoxical in this field. On one hand, having a lower calorific value reduces the combustion temperature and consequently NOx emissions. On the other hand, it has a higher cetane number than pure diesel and its molecular formula contains oxygen, which improves combustion and consequently the temperature inside the cylinder increases. Furthermore, the higher viscosity and density of biodiesel promote greater injection penetration, ignition advance, and pressure increase in the cylinder, resulting in an increase in combustion temperature [37].
When analyzing the graph shown on the right of Figure 5, relative to the percentage differences in NOx emissions between the mixtures and the B0, it is possible to see a trend coherent with the theoretical expectations. The use of B7 fuel resulted in a slight increase in NOx emissions, which makes reasonable accordance with the higher energetic efficiency revealed with this fuel. Since we are dealing with a mixture consisting of a very low biodiesel percentage, the reduction in the calorific value of this fuel compared to pure diesel is very thin. However, it is a sufficient percentage for the consequences of its properties to be noticeable.
Optimization of energy conversion efficiency is achieved with the use of B15 fuel, so its application has resulted in a reduction of NOx emissions.
The highest emissions come from using B100 fuel. This is because the calorific value of this fuel is significantly lower when compared to the other fuels analyzed. Since there is lower energy available in this fuel, it will be necessary to use a greater amount of fuel to achieve the same amount of energy, reducing the efficiency of energy conversion. As previously mentioned, a greater amount of fuel means an increase in temperature inside the cylinder, consequently increasing NOx emissions.
Figure 5’s graph reveals yet another intriguing tendency. The percentage differences between NOx emissions obtained through different fuels are more relevant in low-speed regimes than in high-speed regimes. The same is true between the cycles tested, with the percentage differences standing out more in the NEDC cycle, compared to the WLTP cycle. This makes some sense due to the viscosity and density properties of the fuels. The WLTP cycle contains higher speed points and more abrupt speed variations, which translates into an increase in engine temperature. Following the same logic, the combustion temperature associated with a high-speed regime is higher than the temperature at low speeds. Since the combustion temperature is already high, by the regime itself, the properties of biodiesel, namely the higher viscosity and density, do not manifest such a marked effect on combustion, that is, they contribute to the increase of the combustion temperature through the highest pressure, but not in such an obvious way.
4.1.5. Carbon Dioxide (CO2)
Carbon dioxide, called CO2, corresponds to one of the most relevant gases (if not the most relevant) in the so-called greenhouse effect. Its exponential growth in the Earth’s atmosphere has become an increasingly urgent concern and it is essential to act on the maximum number of agents producing CO2 emissions.
The graphs shown on the left of Figure 6 correspond to CO2 emissions according to the fuel used. The difference between the graphs is based on the units of measurement in which they are presented: the values of the first graph are in the percentage of the volume of the exhaust gases and the values of the second graph are in grams per kilometer. Thus, the interpretation of the values obtained becomes more effective.
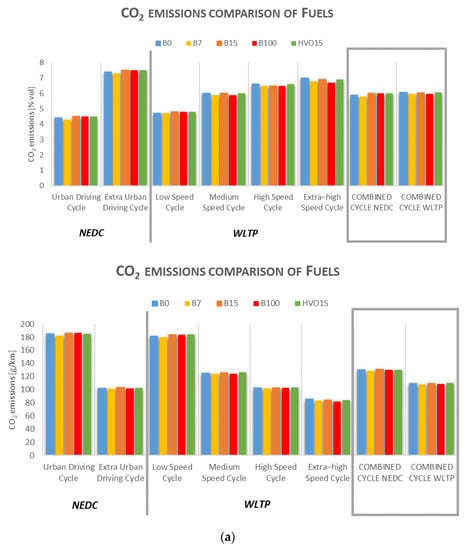
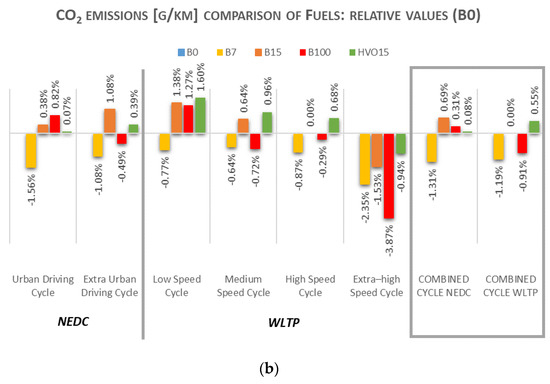
Figure 6.
(a) CO2 emissions comparison of fuels, in total value ((% vol) and (g/km)). (b) CO2 emissions comparison of fuels, in percentage differences, in relation to the B0 fuel.
In view of the two graphs, representing the same emissions in different units, it is possible to perceive a very curious detail. When CO2 emissions are represented as a percentage of volume, the evolution of both cycles leads to an increase in their values due to the increase in speed. Conversely, when CO2 emissions are in grams per kilometer (g/km), the increase in speed over the cycle translates into a reduction in emissions. At first glance, this effect may seem inconsistent. However, if the driving characteristics, namely the speed at which the vehicle is traveling, are accounted for, this effect makes some sense. The reason is that at high and extremely high speeds, the time in which a kilometer is traveled is significantly lower than the corresponding time at low speeds, that is, emissions per time unit are higher at high speed. When counted per kilometer, the time varies.
Among several published articles and laboratory tests, the behavior of CO2 emissions is not unanimous. A test produced at the Vehicle Emissions Laboratory “VELA” [22] obtained results that demonstrate the reduction of CO2 emissions when using higher percentages of HVO, based on the WLTP test cycle. The article published by Kaya et al. [35] presents a contradictory result when using fuel from a mixture of diesel with FAME; in this case, the test resulted in an increase in CO2 emissions, not only with the addition of 30% biodiesel in pure diesel but also in the transition from the NEDC to WLTP test cycle. Another previous work done by the authors of [41,42] confirms these results when it also obtains an increase in CO2 emissions with the mixture of FAME in pure diesel, having reached its maximum emission value with the use of B7.
When analyzing the graphic of Figure 6b, that was obtained from the results of Figure 6a, it is possible to verify that the results show some agreement with the theories of the referred authors, but mostly reveal a controversial character. In view of the NEDC Combined Cycle, CO2 emissions increase their value with the use of mixtures with a percentage of biodiesel, except with B7 fuel. This is justified by the effect of energy conversion efficiency, which, as already mentioned, establishes a relationship between the specific consumption and the calorific value of a given fuel, reaching its maximum value at a point of greater harmony between these two parameters. In this case, the balance of values occurred with the use of B7.
The evolution of CO2 emissions over the WLTP test cycle is also consistent. Biodiesel, due to its chemical composition, contains a greater amount of oxygen. At high speeds, the reaction time for combustion in the cylinder becomes shorter and may not even be enough for combustion to complete. The oxygen that biodiesel itself contains contributes to better combustion, reducing CO2 emissions at high speeds, as shown in the WLTP Very High-Speed Cycle. In contrast, at low speeds, CO2 emissions from the use of biodiesel tend to be higher than emissions from the use of pure diesel, as shown graphically. This effect is justified, as already mentioned, since the calorific value of biodiesel is lower than the calorific value of pure diesel, requiring a greater amount of fuel injected into the cylinder. As the specific consumption increases, the energy conversion efficiency decreases (Equation (1)), causing an increase in CO2 emissions.
4.2. Performance Test
4.2.1. Engine Performance (Power and Torque)
It should be noted that all graphic lines representative of the power and torque resulting from the power tests follow the trend specified in the engine manufacturer data, which makes feasible to reproducing the tests.
Based on the results, it is easy to see that both power and torque adopt considerably lower values throughout the test when using B100. This difference is not so evident when the percentage of biofuel in the mixture is reduced. In fact, at low speeds (≈1250 rpm), engine performance slightly increases when using fuel mixes with a low percentage of biofuel. Characterizing this by values, the use of B100 represented a maximum decrease of 12.1% in power (3.9 kW in 32 kW) and 12% in torque (29.4 N·m in 245 N·m), occurred in low regimes; there was no increase in performance in any regime with this fuel. In contrast, the use of B7 represented a maximum increase of 2% in power (0.7 kW at 35 kW) and 2.1% in torque (5.2 N·m at 248 kW) at low speeds; however, at high speeds, it revealed a slight deficit in engine performance (0.6% in power and torque, that is, 1 kW and 2.4 N·m). HVO15 fuel showed a similar influence to B7 fuel.
4.2.2. Specific Fuel Consumption
Based on the results, the use of B100 fuel translates into a specific consumption considerably higher than that of other fuels, especially in low regimes, which makes sense with all the justifications given up to this point.
In a global assessment, the lowest specific consumption is achieved with B15 fuel, which is also not surprising because of the energy conversion efficiency mentioned throughout this manuscript.
The performance test considering the different fuels in the engine allows achieving the results represented in Figure 7a–c. The similarity of the curves is evident and, as expected, the B100 is the only curve that is detached from all the others. It is also noticeable the increase in specific fuel consumption revealed by HVO15, which is probably explained by the lower LHV of this fuel.
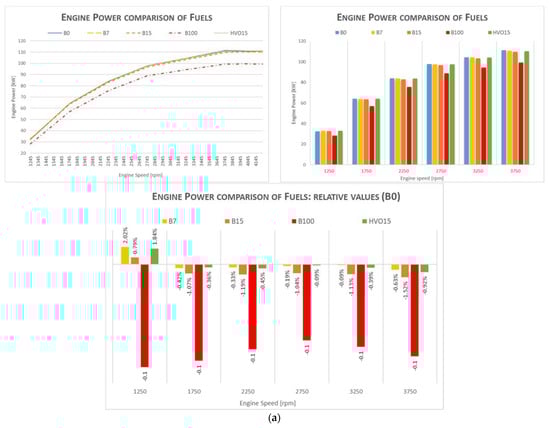
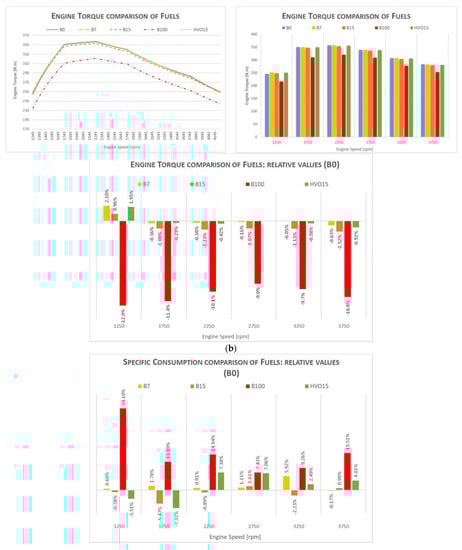
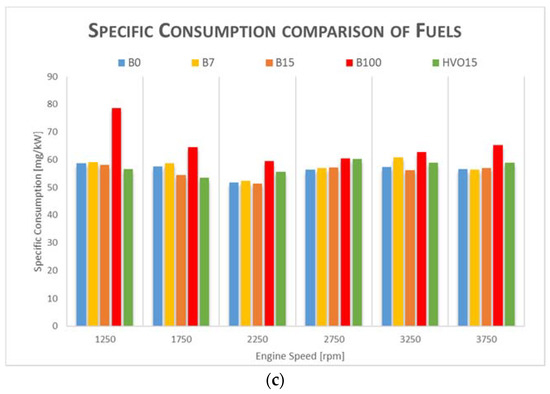
Figure 7.
(a) Results obtained from the power test (power). (b) Results obtained from the power test (torque). (c) Results obtained from the power test (specific fuel consumption).
5. Conclusions
The tests mentioned in this article, produced on a chassis dynamometer, focus on obtaining values related to fuel consumption, pollutant gas emissions, and vehicle performance.
Through the study, it is feasible to confirm various tendencies that are consistent with the theoretically predicted results: The fluctuation in fuel consumption and CO2 and NOx emissions, through the tested fuel mixture, reflects with some consistency the importance of energy conversion efficiency. The properties of biofuel, namely FAME, have contradictory consequences for some emissions and fuel consumption. On one hand, having a higher number of cetane and being an oxygenated fuel improves the combustion quality, reducing CO2 emissions and consumption itself; on the other hand, it has a lower calorific value, that is, a greater amount of fuel is needed to obtain the same energy available in combustion, which increases consumption, CO2 emissions, and combustion temperature, the main cause of NOx emissions. Furthermore, the fact that it has a higher viscosity, although it is an advantage in the lubrication of the engine’s injection components, increases the injection pressure and, consequently, the temperature inside the cylinder, thus negatively affecting NOx emissions. Hence, it is concluded that the most favorable condition for the reduction of emissions and consumption is the search for a fuel mixture that optimizes the balance between calorific value and specific consumption, in order to maximize the efficiency of energy conversion.
If pure diesel is excluded from the analysis, there is a reduction in CO and HC emissions with the increase in the percentage of biofuel in the applied mixture. Since these emissions come from incomplete combustion, this makes perfect sense at a theoretical level. This effect comes from the greater amount of oxygen present in the chemical composition of the biofuel and the greater number of cetane that is characteristic of it, thus facilitating combustion. Moreover, the HC emissions resulting from the use of HVO15 are lower than the emissions resulting from B15, which is consistent, since the greater number of cetane, lower density, and greater calorific power provide HVO15 with a higher combustion quality.
The transition from the NEDC test cycle to the WLTP cycle reflects the continuous search by experts to optimize the efficiency and rigor of the cycles adopted in vehicle approval. This is because it is of the utmost importance that the analysis imposed on the vehicle increasingly represents reality, in all its scope. CO and HC emissions did not show significant differences and clear trends in view of the transition from the NEDC cycle to WLTP. However, for the same vehicle, the application of the WLTP cycle allowed the detection of higher NOx emissions, which can be justified by the greater test dynamics and the higher speeds achieved. CO2 emissions assume lower values in the WLTP cycle. Fuel consumption also assumed lower values in the WLTP cycle, when the mass consumed in 100 km is compared.
The engine performance and the specific consumption gain favorable positions with the use of fuel mixtures with low percentages of biofuel, which is justified, once again, by the efficiency of energy conversion. The lowest specific consumption is achieved with B15 fuel, which is also not surprising due to the effects of energy conversion efficiency, mentioned throughout this manuscript.
The main conclusions obtained in the present work are as follows:
- -
- The use of B7 reveals a decrease in fuel consumption, which is detected with both NEDC and WLTP cycles.
- -
- The use of B15 can contribute to a small reduction of NOx emissions (at 8%). The use of HVO15 in the NEDC cycle reveals a small decrease (−3%) in NOx emissions but for WLTP an increase (14%) was measured.
- -
- The variations in CO2 emissions are small and inside the uncertainty of the method, so the only conclusion is that the use of biofuels does not penalize the CO2 emissions in the combustion process. All the reduction of CO2 obtained in a well-to-tank assessment determines the contribution of biodiesel to global warming mitigation.
- -
- The use of low biofuel blends does not penalize the performance of the engine and at low speeds, where the engine is more frequently used, a small increase (2%) in power was achieved for B7. In this low engine speed operation (1250 to 2250 rpm), a decrease in specific fuel consumption was also detected for B15 (0.8 to 5.5%).
In view of all the verifications throughout the work, it is easily concluded that, in addition to the already recognized advantages that biofuel production has in relation to fossil fuel production, the use of fuel mixtures with a renewable component, in certain percentages, makes it possible to achieve higher efficiencies and, consequently, better performances and consumption, with lower emissions. Furthermore, the fact that for blends of biofuels with diesel around 15%, the mixtures comply with the technical parameters of EN590 (except for the maximum percentage of FAME) and are compatible with existing fuel distribution infrastructure makes them a very practical and universal solution for the rolling fleets. For this reason, the authors believe that these kinds of mixtures can play an important role in the energy transition of existing diesel fleets. The following steps will consist in studying more deeply the use of B15 and HVO15, considering on-road and engine dynamometer tests. This is explained since it is expected that the increase of biodiesel percentage in commercial diesel will be the direction, according to the directives of the EU. Additionally, the introduction of biofuels with different origins from residues will be the focus of a near-future work.
Author Contributions
Conceptualization, L.S. and C.C.; methodology, L.S. and N.P.; validation, L.S., N.P. and B.S.; formal analysis, L.S.; investigation, L.S. and B.S.; resources, L.S. and N.P.; data curation, L.S., N.P. and B.S.; writing—original draft preparation, B.S.; writing—review and editing, L.S. and C.C.; supervision, L.S. All authors have read and agreed to the published version of the manuscript.
Funding
This research received no external funding.
Institutional Review Board Statement
Not applicable.
Informed Consent Statement
Not applicable.
Data Availability Statement
Not applicable.
Acknowledgments
The authors would like to thank PRIO Energy and Sintética for the support of this work. The authors also want to thank Daniel Simão for their active participation in the entire study.
Conflicts of Interest
The authors declare no conflict of interest.
References
- Martins, J.; Brito, F.P. Alternative Fuels for Internal Combustion Engines. Energies 2020, 13, 4086. [Google Scholar] [CrossRef]
- Dimitriadis, A.; Seljak, T.; Vihar, R.; Baškovič, U.Ž.; Dimaratos, A.; Bezergianni, S.; Samaras, Z.; Katrašnik, T. Improving PM-NOx trade-off with paraffinic fuels: A study towards diesel engine optimization with HVO. Fuel 2020, 265, 116921. [Google Scholar] [CrossRef]
- Puricelli, S.; Cardellini, G.; Casadei, S.; Faedo, D.; Grosso, A. A review on biofuels for light-duty vehicles in Europe. Renew. Sustain. Energy Rev. 2021, 137, 110398. [Google Scholar] [CrossRef]
- Ahmed, O.O. w3A review of global current scenario of biodiesel adoption and combustion in vehicular diesel engines. Energy Rep. 2019, 5, 1560–1579. [Google Scholar]
- Tamburini, E.; Gaglio, M.; Fano, G.C. Is Bioenergy Truly Sustainable WhenLand-Use-Change (LUC) Emissions Are Accounted for? The Case-Study of Biogas from Agricultural Biomass in Emilia-Romagna Region, Italy. Sustainability 2020, 12, 3260. [Google Scholar] [CrossRef]
- Gad, M.S.; Hashish, A. Assessment of diesel engine performance, emissions and combustion characteristics burning biodiesel blends from jatropha seeds. Process. Saf. Environ. Prot. 2021, 147, 518–526. [Google Scholar] [CrossRef]
- Tamilselvan, P.; Rajkumar, N.N. A comprehensive review on performance, combustion and emission characteristics of biodiesel fuelled diesel engines. Renew. Sustain. Energy Rev. 2017, 79, 1134–1159. [Google Scholar] [CrossRef]
- Sharma, P.V. Performance and Emission Characteristics of Biodiesel Fueled Diesel Engines. Int. J. Renew. Energy Res. 2015, 5, 183–188. [Google Scholar]
- Kroyan, Y.; Wojcieszyk, M.; Kaario, O.; Zenger, M.L. Modeling the end-use performance of alternative fuels in light-duty vehicles. Energy 2020, 205, 117854. [Google Scholar] [CrossRef]
- An, H.; Yang, W.M.; Chua, S. Combustion and emissions characteristics of diesel engine fueled by biodiesel at partial load conditions. Appl. Energy 2012, 99, 363–371. [Google Scholar] [CrossRef]
- Buyukkaya, E. Effects of biodiesel on a DI diesel engine performance, emission and combustion characteristics. Fuel 2010, 89, 3099–3105. [Google Scholar] [CrossRef]
- Chiba, M.; Shimizu, K.; Takahashi, H.; Sugiura, Y.; Harano, E.S.M. Diesel Engine Performance and Emissions When Using Biodiesel Fuel. Jpn. Agric. Res. Q. JARQ 2014, 48, 133–137. [Google Scholar] [CrossRef][Green Version]
- Islam, M.S.; Ahmed, A.S.; Islam, A.; Aziz, S.A.; Mridha, L. Study on Emission and Performance of Diesel Engine Using Castor Biodiesel. J. Chem. 2014, 2014, 451526. [Google Scholar] [CrossRef]
- Muralidharan, K.; Sheeba, D.V. Performance, emission and combustion characteristics of biodiesel fuelled variable compression ratio engine. Energy 2011, 36, 5385–5393. [Google Scholar] [CrossRef]
- Lease Plan. Estudo Leaseplan Sobre Impacto Do WLTP. Fleet Magazine. 2018. Available online: https://www.leaseplan.com/pt-pt/wltp/ (accessed on 18 December 2020).
- Pavlovic, J.; Ciuffo, B.; Fontaras, G.; Marotta, V.V. How much difference in type-approval CO2 emissions from passenger cars in Europe can be expected from changing to the new test procedure (NEDC vs. WLTP)? Transp. Res. Part A Policy Pract. 2018, 111, 136–147. [Google Scholar] [CrossRef]
- VDA. Exhaust Emissions. Available online: https://www.vda.de/en/topics/environment-and-climate/exhaust-emissions/exhaust-emissions-legislation-in-europe.html (accessed on 6 December 2020).
- WLTPfacts.eu. From NEDC to WLTP: What will Change? Available online: https://wltpfacts.eu/from-nedc-to-wltp-change/ (accessed on 8 December 2020).
- WLTPfacts.eu. What are the Benefits of WLTP? Available online: https://wltpfacts.eu/wltp-benefits/ (accessed on 10 December 2020).
- WLTPfacts. What is the Purpose of Lab Tests Like WLTP? Available online: https://www.wltpfacts.eu/purpose-lab-tests-wltp/ (accessed on 12 December 2020).
- Tsiakmakis, S.; Fontaras, G.; Samaras, B.C. A simulation-based methodology for quantifying European passenger car fleet CO2 emissions. Appl. Energy 2017, 199, 447–465. [Google Scholar] [CrossRef]
- Tsiakmakis, S.; Fontaras, G.; Cubito, C.; Pavlovic, J.; Ciuffo, K. From NEDC to WLTP: Effect on the Type-Approval CO2 Emissions of Light-Duty Vehicles; Publications Office of the European Union: Bruxelles, Belgium, 2017. [Google Scholar]
- Pavlovic, J.; Ciuffo, A.M. CO2 emissions and energy demands of vehicles tested under the NEDC and the new WLTP type approval test procedures. Appl. Energy 2016, 177, 661–670. [Google Scholar] [CrossRef]
- Bortel, J.V. Effect of HVO fuel mixtures on emissions and performance of a passenger car size diesel engine. Renew. Energy 2019, 140, 680–691. [Google Scholar] [CrossRef]
- Blasio, G. Hydrotreated vegetable oil as enabler for high-efficient and ultra-low emission vehicles in the view of 2030 targets. Fuel 2022, 310, 122206. [Google Scholar] [CrossRef]
- Omari, A.; Pischinger, S.; Bhardwaj, O.; Holderbaum, B. Improving Engine Efficiency and Emission Reduction Potential of HVO by Fuel-Specific Engine Calibration in Modern Passenger Car Diesel Applications. SAE Int. J. Fuels Lubr 2017, 10. [Google Scholar] [CrossRef]
- Rimkus, A.; Žaglinskis, J.; Stravinskas, S.; Rapalis, P.; Matijošius, J.; Bereczky, Á. Research on the Combustion, Energy and Emission Parameters of Various Concentration Blends of Hydrotreated Vegetable Oil Biofuel and Diesel Fuel in a Compression-Ignition Engine. Energies 2019, 12, 2978. [Google Scholar] [CrossRef]
- Cheng, Q.; Tuomo, H.; Kaario, O.T.; Martti, L. Spray dynamics of HVO and EN590 diesel fuels. Fuel 2019, 245, 198–211. [Google Scholar] [CrossRef]
- Kotek, M.; Marík, J.; Zeman, P.; Hartová, V.; Hart, J.; Hönig, V. The Impact of Selected Biofuels on the Skoda Roomster 1.4TDI Engine’s Operational Parameters. Energies 2019, 12, 1388. [Google Scholar] [CrossRef]
- Suarez-Bertoa, R.; Kousoulidou, M.; Clairotte, M.; Giechaskiel, B.; Nuottimäki, J.; Sarjovaara, T.; Lonza, L. Impact of HVO blends on modern diesel passenger cars emissions during real world operation. Fuel 2019, 235, 1427–1435. [Google Scholar] [CrossRef]
- Volkswagen of America. 2.0 Liter TDI Common Rail BIN5 ULEV Engine; Volkswagen of America, Inc.: Herndon, VA, USA, 2008. [Google Scholar]
- Oil Neste. Hydrotreated Vegetable Oil (HVO); Neste: Espo, Finland, 2014. [Google Scholar]
- Guru, M.; Koca, A.; Can, O.; Sahin, C.Ç. Biodiesel production from waste chicken fat based sources and evaluation with Mg based additive in a diesel engine. Renew. Energy 2009, 35, 637–643. [Google Scholar] [CrossRef]
- Ministério da Educação Superintendência De Comunicação Social Coordenadoria de Comunicação Social Universidade Federal Do Piau. Boletim De Ensaio No 145/LBB/V.2/2019; Ministério da Educação Superintendência de Comunicação Social Coordenadoria de Comunicação Social Universidade Federal Do Piau: Piau, Brasil, 2019.
- Kaya, T.; Taskiran, O. Evaluation of the Effects of Biodiesel on Emissions and Performance by Comparing the Result of the New European Drive Cycle and Worldwide Harmonized Light Vehicles Test Cycle. Energies 2018, 11, 2814. [Google Scholar] [CrossRef]
- Secretaria Regional da Saúde. Intoxicação por Monóxido de Carbono (CO). 2011. Available online: http://iasaude.pt/attachments/article/1887/Intoxicacao_CO.pdf (accessed on 8 September 2020).
- Serrano, L.M.V. Análise Comparativa do Desempenho de Motores de Combustão Interna Quando Utilizam Biocombustíveis. Ph.D. Thesis, Faculdade de Ciências e Tecnologia, Universidade de Coimbra, Coimbra, Portugal, 2012. [Google Scholar]
- eCycle. Óxidos de Nitrogénio: O que são os NOx e Quais os Seus Impactos. May 2019. Available online: https://www.ecycle.com.br/3052-oxidos-de-nitrogenio (accessed on 8 September 2020).
- Viva, Ciência, Ozono. May 2019. Available online: http://www.cienciaviva.pt/divulgacao/eventos/diasemcarros/ozono.asp (accessed on 8 September 2020).
- Governo dos Açores. Fontes e Efeitos dos Poluentes Atmosféricos. May 2019. Available online: http://www.azores.gov.pt/Portal/pt/entidades/sreat-dra/livres/fontes+e+efeitos+dos+poluentes+atmosfericos.htm (accessed on 8 September 2020).
- Lopes, M.; Serrano, L.; Ribeiro, I.; Cascão, P.; Pires, N.; Rafael, S.; Tarelho, L.; Monteiro, A.; Nunes, T.; Evtyugina, M.; et al. Emissions characterization from EURO 5 diesel/biodiesel passenger car operating under the new European driving cycle. Atmos. Environ. 2014, 84, 339–348. [Google Scholar] [CrossRef]
- Serrano, L.; Lopes, M.; Pires, N.; Ribeiro, I.; Cascão, P.; Tarelho, L.; Monteiro, A.; Nielsen, O.; da Silva, M.G.; Borrego, C. Evaluation on effects of using low biodiesel blends in a EURO 5 passenger vehicle equipped with a common-rail diesel engine. Appl. Energy 2015, 146, 230–238. [Google Scholar] [CrossRef]


Publisher’s Note: MDPI stays neutral with regard to jurisdictional claims in published maps and institutional affiliations. |
© 2021 by the authors. Licensee MDPI, Basel, Switzerland. This article is an open access article distributed under the terms and conditions of the Creative Commons Attribution (CC BY) license (https://creativecommons.org/licenses/by/4.0/).