
Systematic Comparison of Different Compartmental Models for Predicting COVID-19 Progression


Abstract
1. Introduction
- We examine the predictive accuracy of a range of models, from simpler models like SIR and SEIR to more complex models such as SIDARTHE and adaptive/non-adaptive SEAIRD.
- We conduct numerical analyses by applying these models to actual COVID-19 data from the U.S.
- We provide insights into the conditions under which each model performs best, offering critical guidance for healthcare policymakers in terms of resource allocation and predicting both short- and long-term pandemic impacts.
2. Materials and Methods
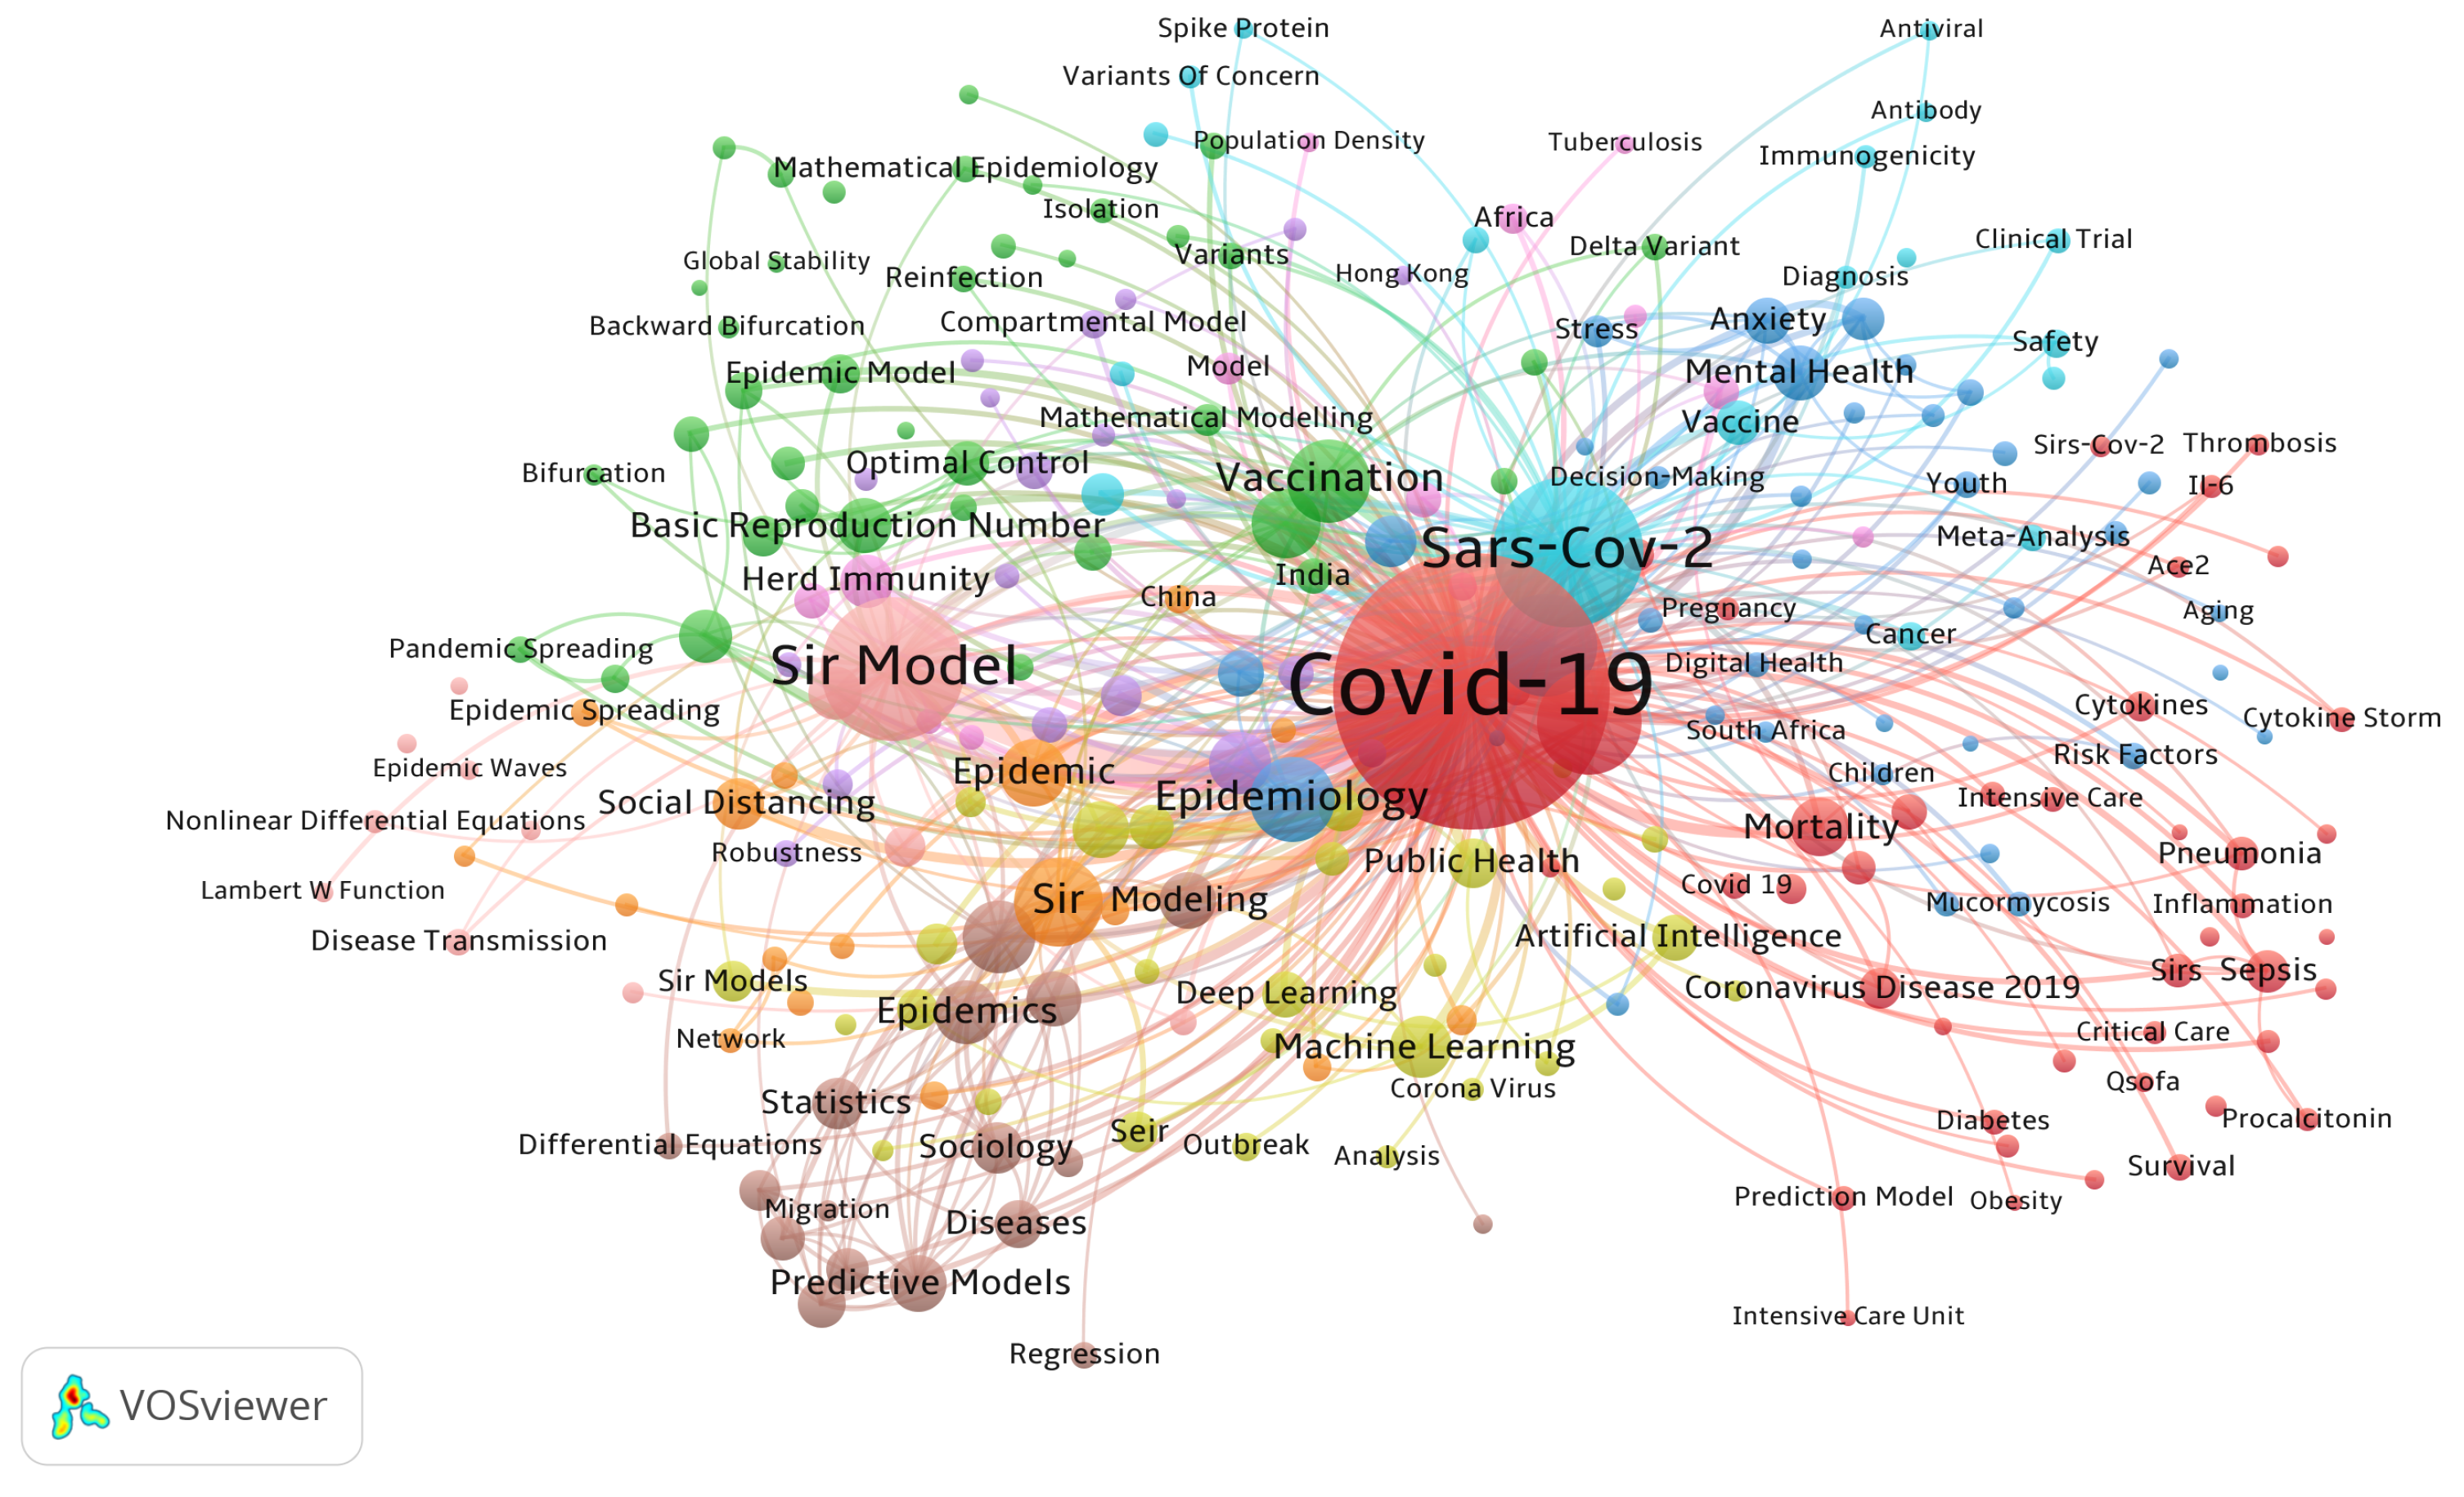
2.1. Literature Search Strategy
2.2. Compartmental Models and Relevant Literature
3. Case Study
3.1. Simplified Mathematical Formulation of Epidemic Models
3.2. Model Calibration and Data Sources
- 1 March 2020: Captures the early stages of the pandemic, including the first wave of infections before large-scale public health interventions and before the emergence of COVID-19 variants.
- 1 July 2020: Reflects the summer wave, caused by reopening policies and a resurgence of cases.
- 1 November 2020: Captures the major winter surge, characterized by the highest infection peaks before vaccine distribution.
- 1 April 2021: Corresponds to the post-vaccine introduction period and the rise of the Alpha variant.
- 1 November 2021: Represents the period dominated by the Delta variant and the emergence of Omicron, with renewed public health responses such as booster campaigns and travel restrictions.
4. Results and Discussions
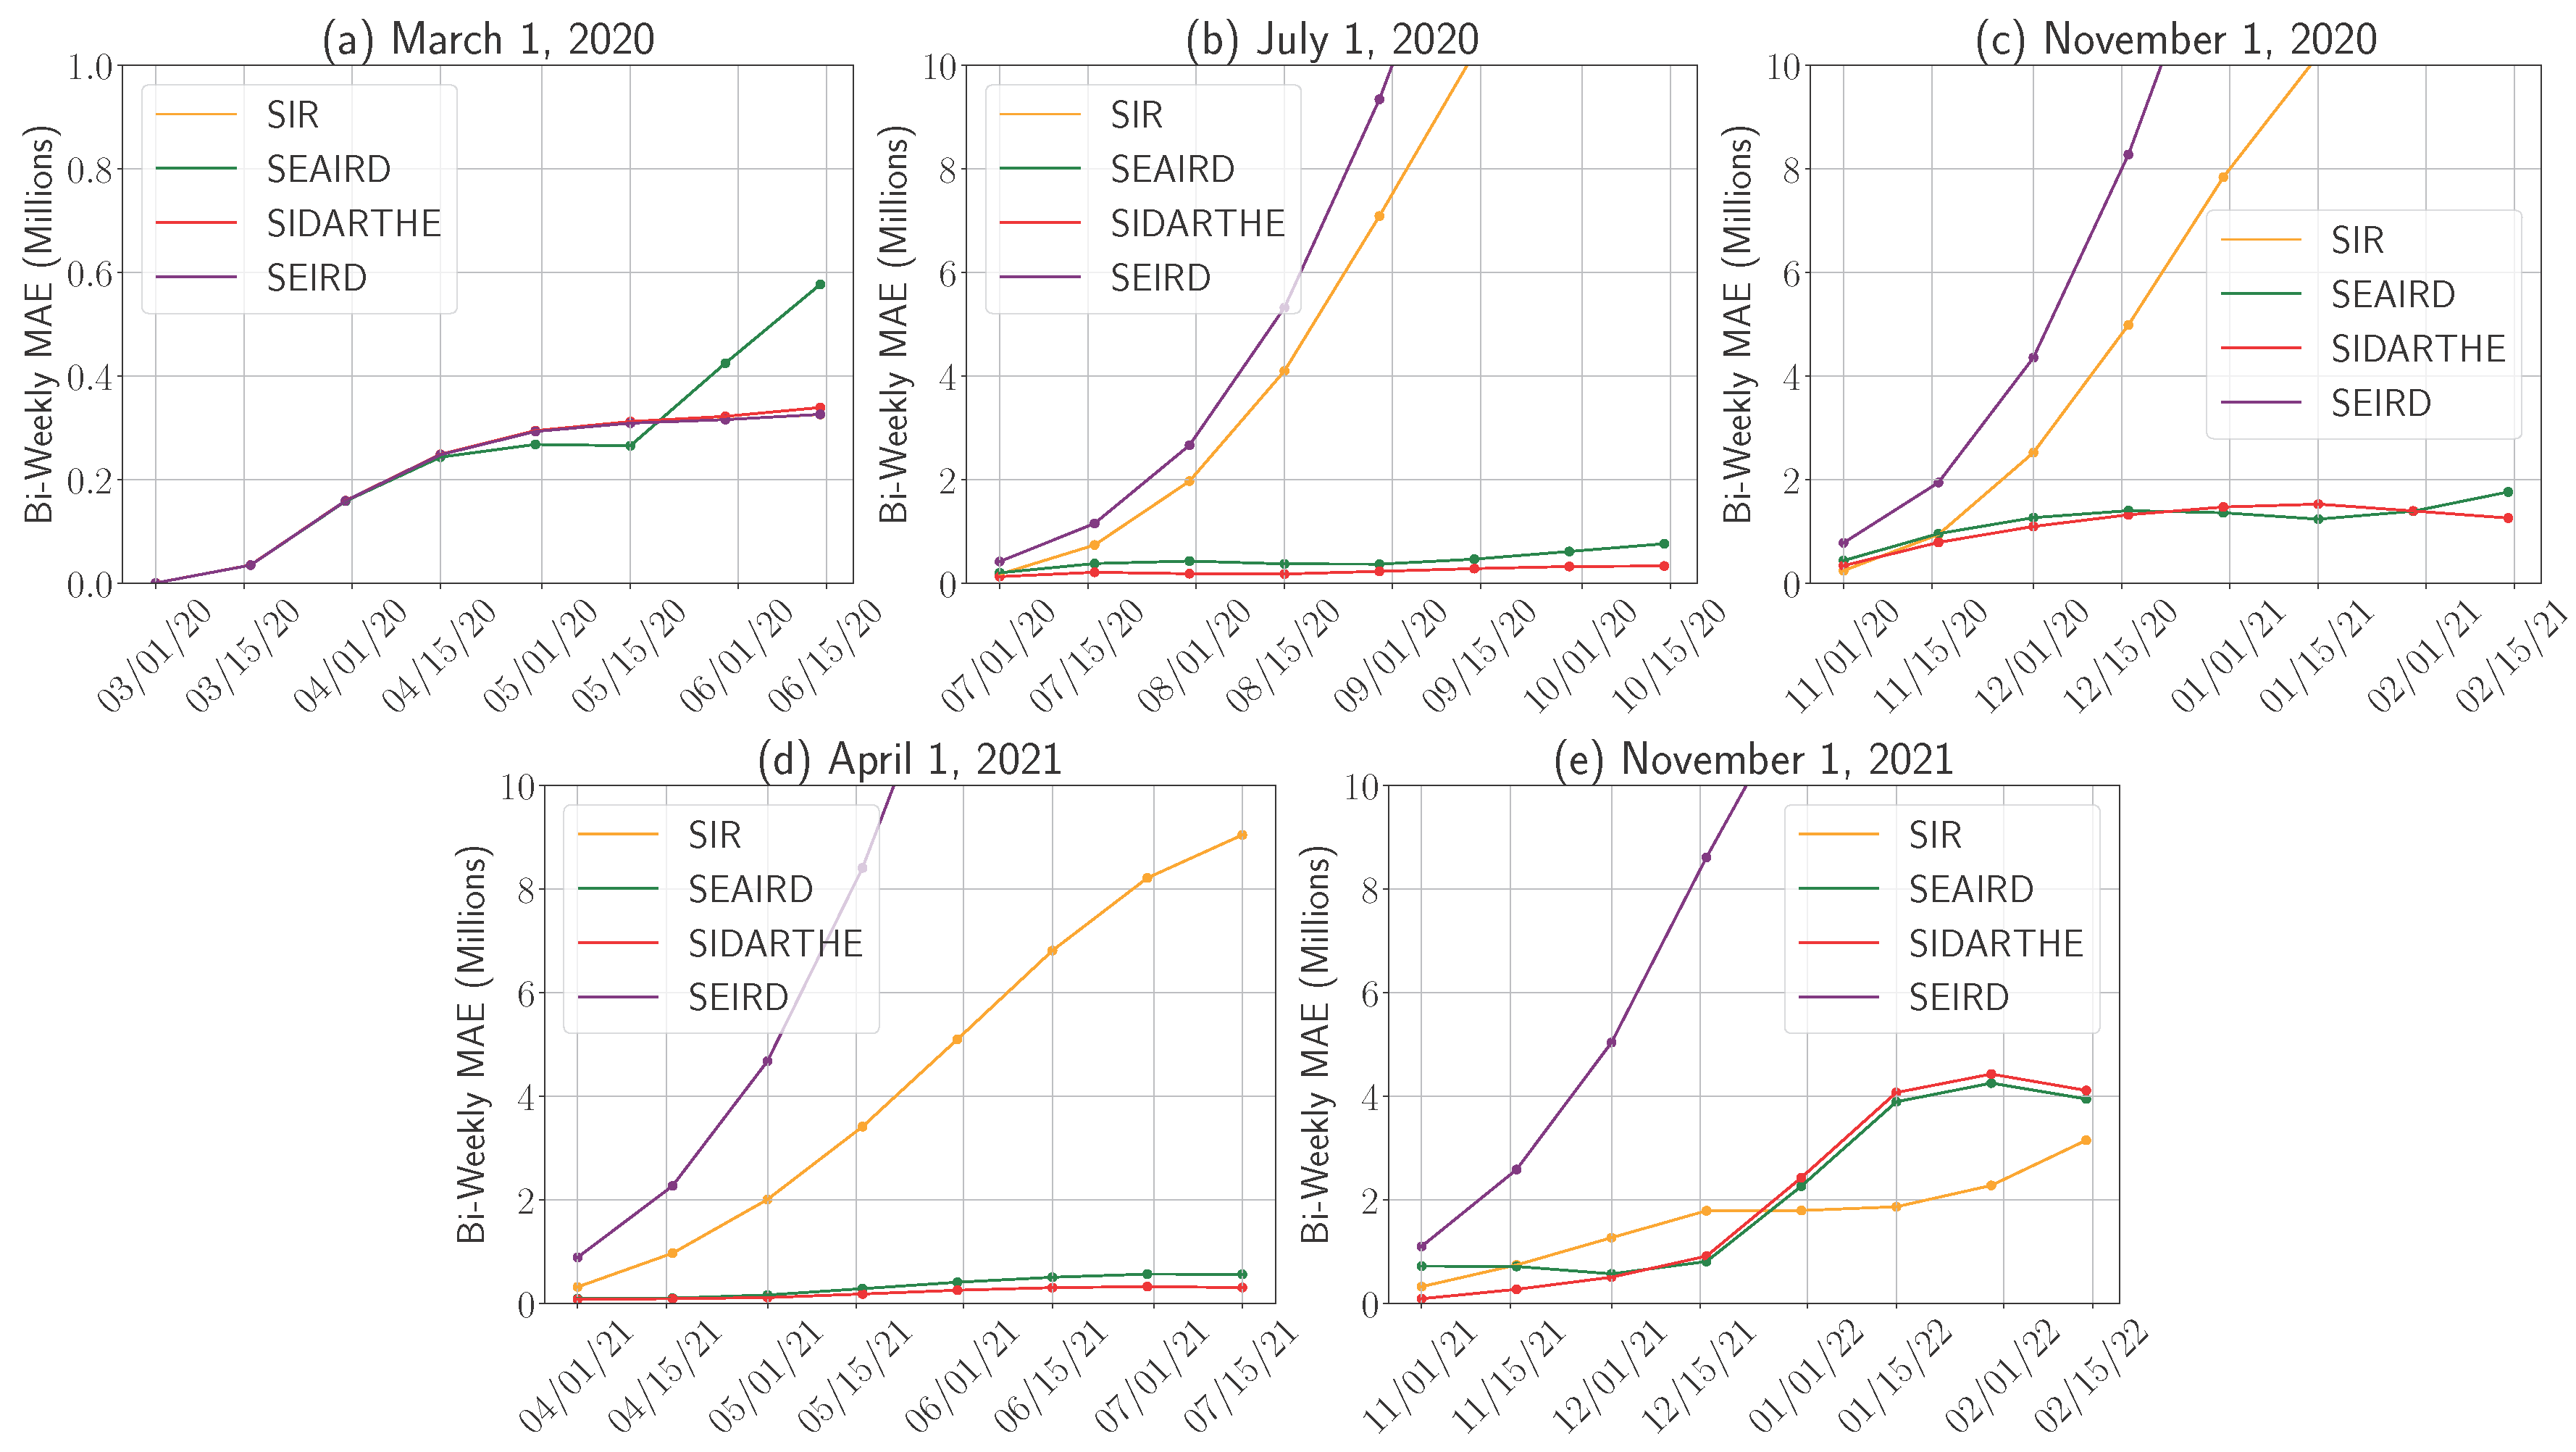
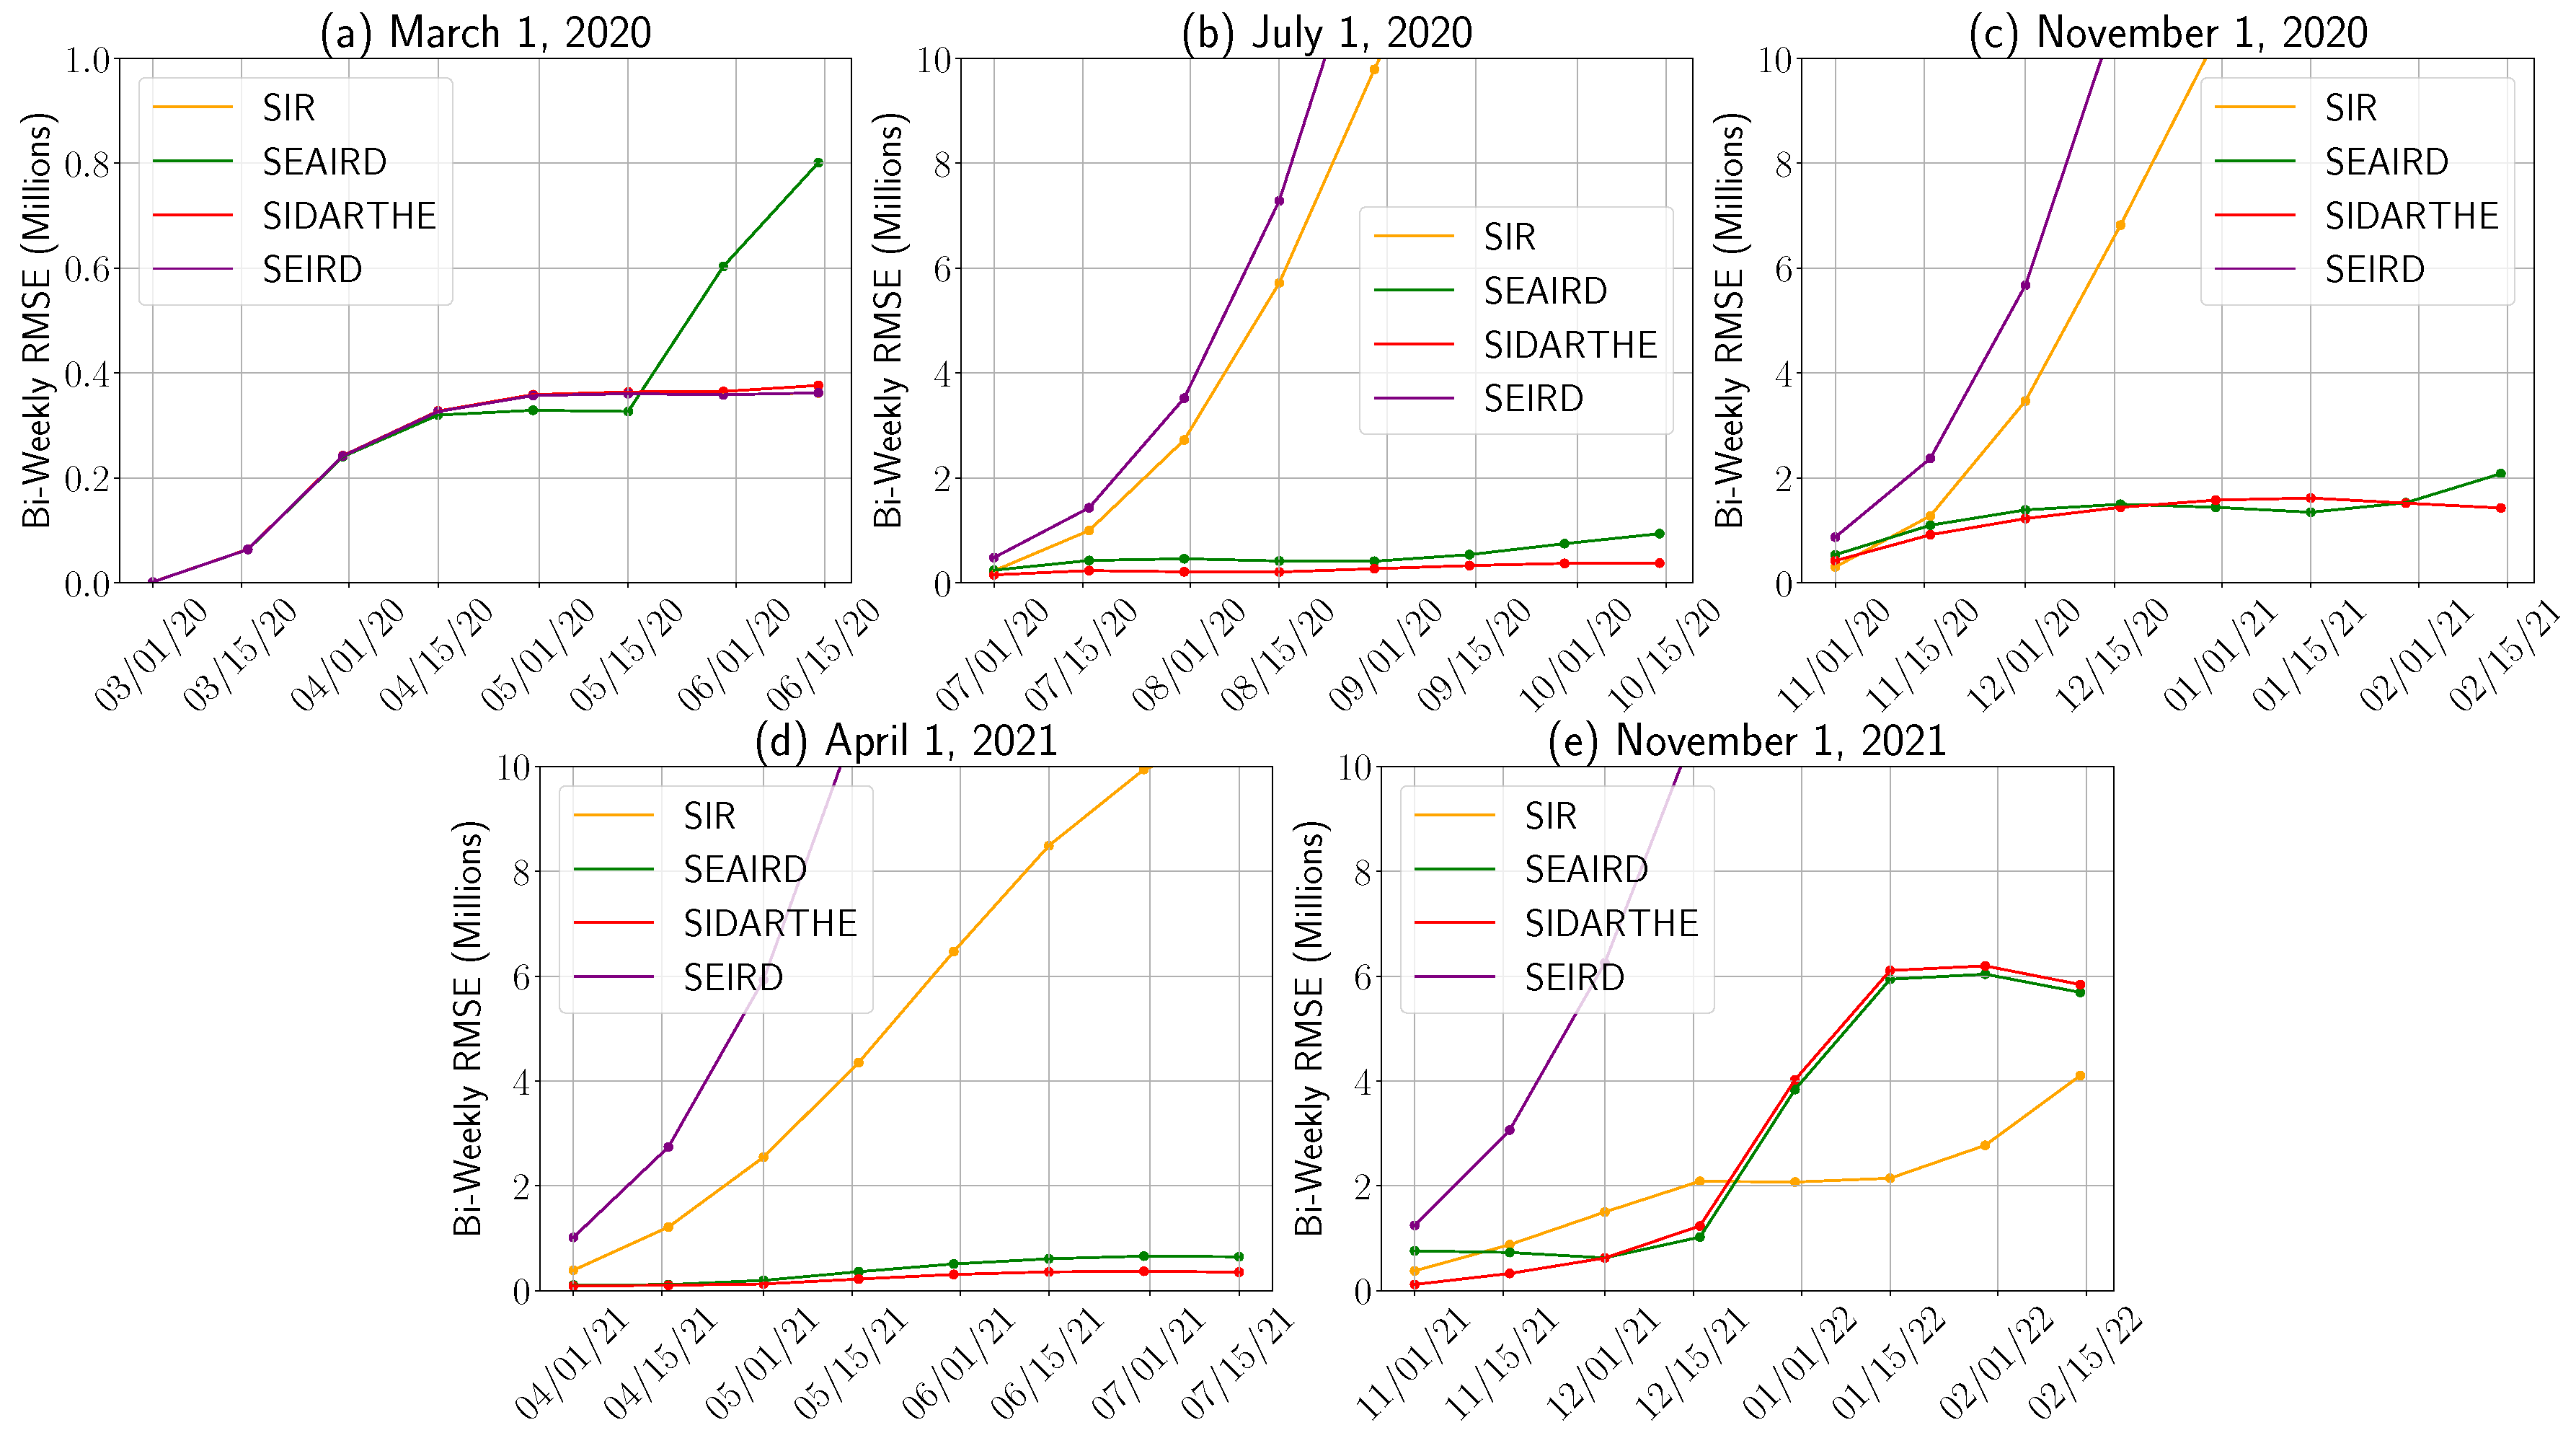
4.1. Model Performance Evaluation
4.1.1. Model Performance Across Pandemic Phases
4.1.2. Prediction Orientation: Over- and Underestimation Analysis
4.1.3. Time to Peak Prediction Error
4.2. Models’ Predictability for Symptomatic and Asymptomatic Infections
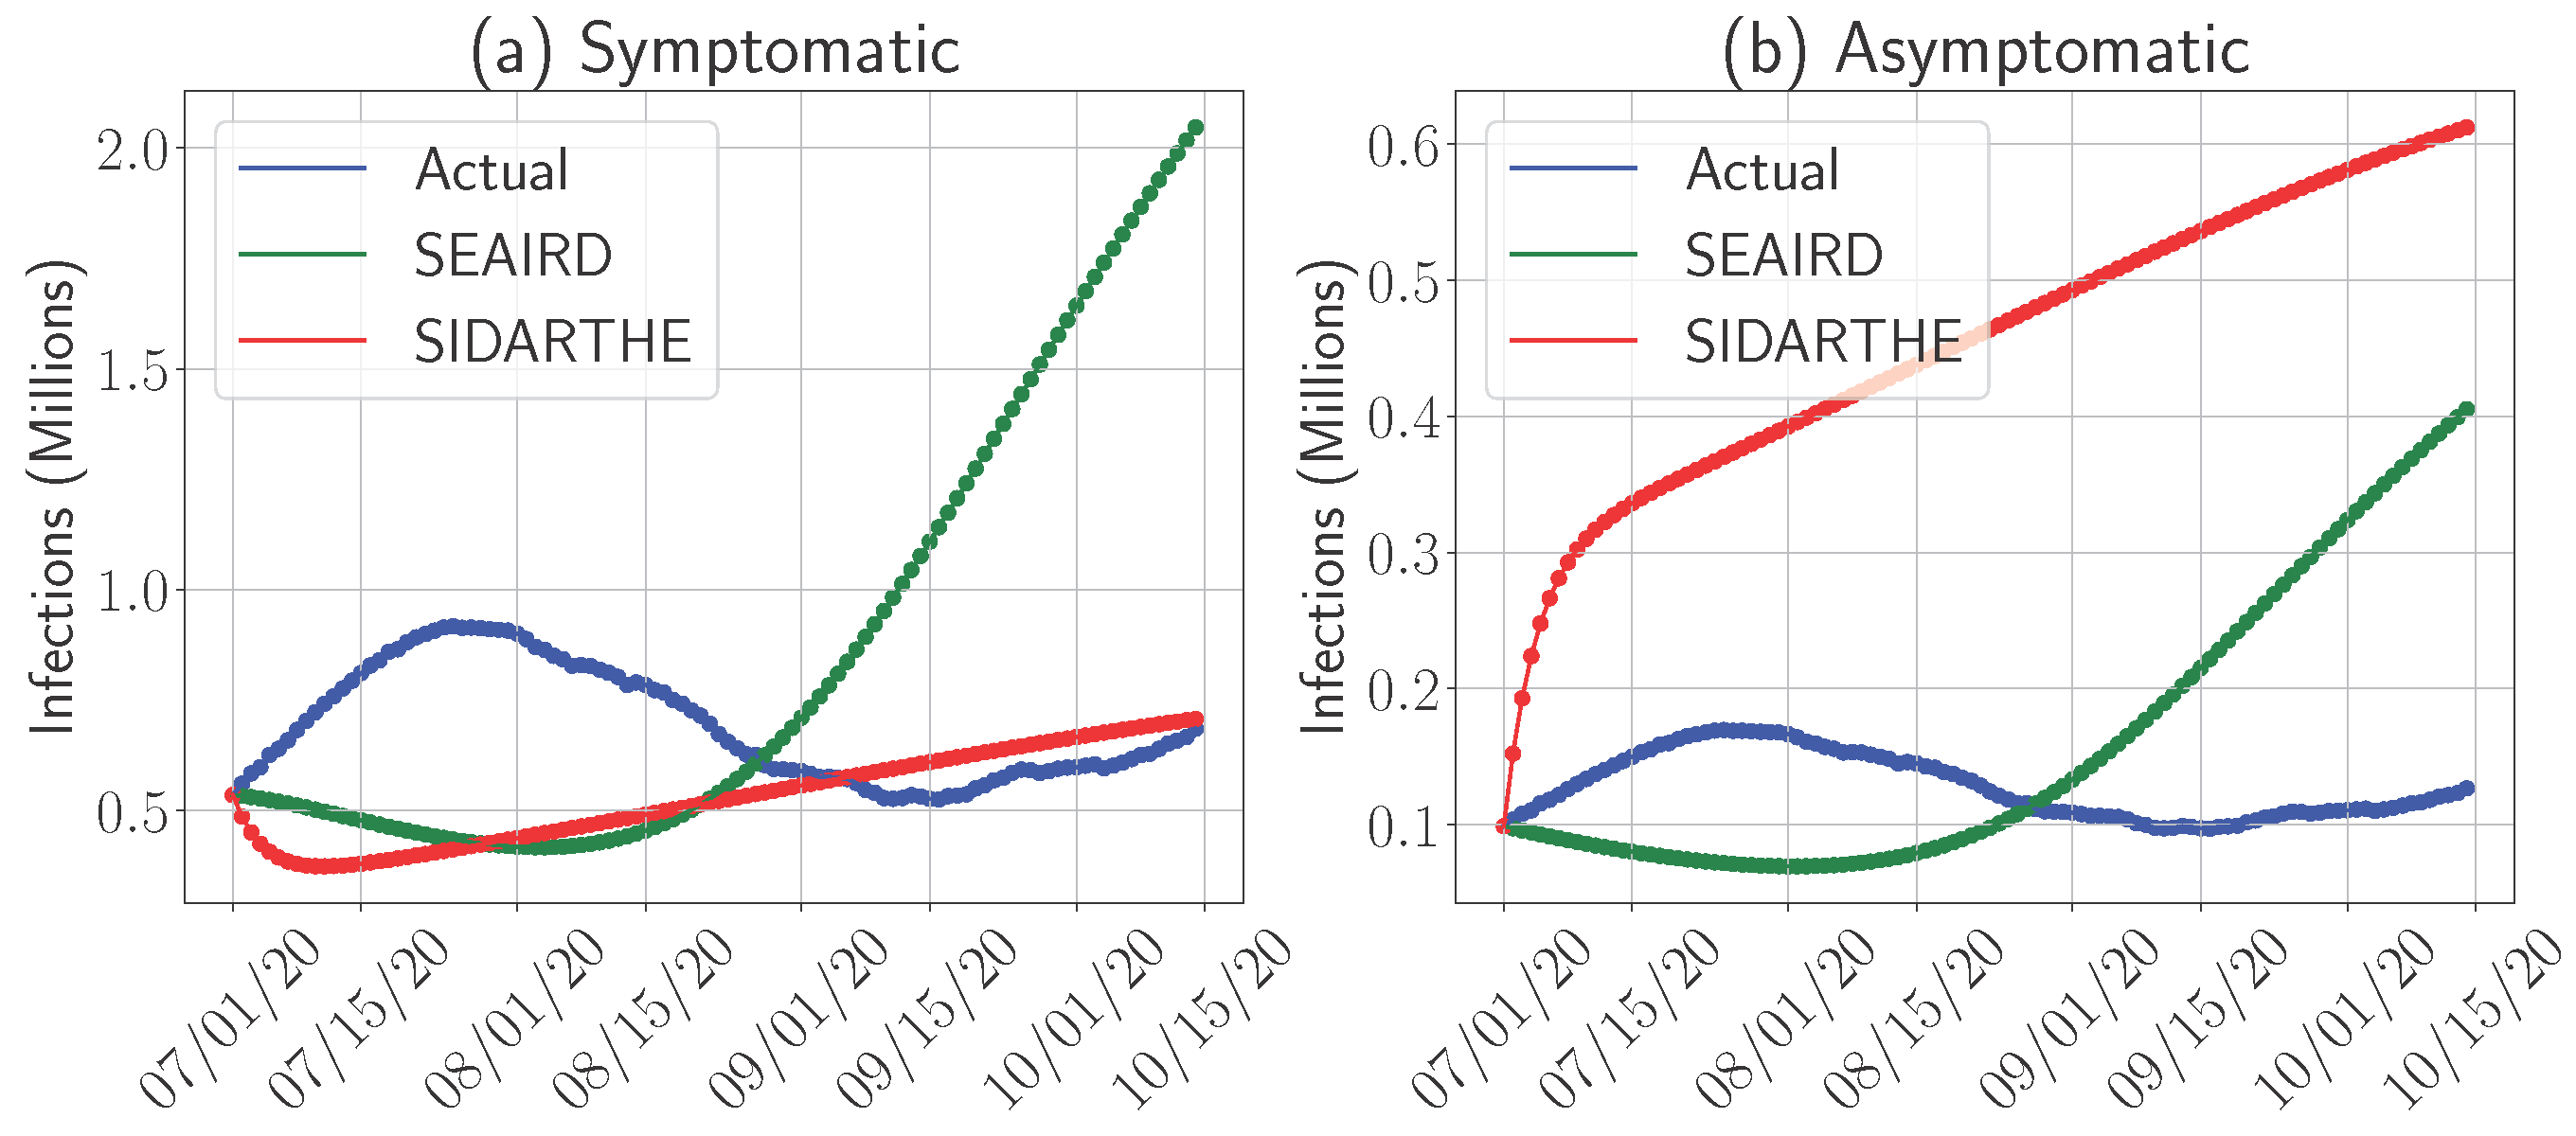
- Predicting Symptomatic Cases: As shown in Figure 6a, the SIDARTHE model demonstrates better accuracy in predicting the number of symptomatic cases compared to SEAIRD. SIDARTHE’s calibrated approach allows it to capture the established dynamics of symptomatic infections, which are easier to track due to observable symptoms and subsequent quarantine or hospitalization.
- Predicting Asymptomatic Cases: Conversely, Figure 6b shows that the SEAIRD model performs better in predicting the number of asymptomatic cases. Since asymptomatic individuals do not self-quarantine or seek treatment, their movement and interaction patterns are harder to track and model. SEAIRD’s dynamic parameter optimization allows it to better adapt to these complex dynamics. However, this adaptability comes with a trade-off: SEAIRD tends to overestimate symptomatic cases, as seen in Figure 6a, likely due to the focus on capturing asymptomatic dynamics.
4.3. Summary of Compartmental Model Evaluation
4.4. Adaptive Versus Non-Adaptive Models
4.5. Sensitivity Analysis
5. Conclusions
5.1. Summary of Insights Gained and Further Discussion
5.2. Limitations and Future Work
Author Contributions
Funding
Informed Consent Statement
Data Availability Statement
Conflicts of Interest
Appendix A. Summary of Parameter Values

| Parameter | Definition | Value |
|---|---|---|
| Rate of transmission | 0.16 | |
| Rate of recovery | 0.1 |
| Parameter | Definition | Value |
|---|---|---|
| Rate of exposure to infected individuals | 1 | |
| Probability of incubated individuals turning negative | 0.1 | |
| Rate of incubated individuals turning infectious | 0.16 | |
| Rate of recovery | 0.08 | |
| Rate of mortality | 0.02 |
| Parameter | Definition | Value |
|---|---|---|
| Rate of exposure to incubated individuals | Optimized | |
| Probability of exposure to infection | Optimized | |
| Probability of incubated individuals turning negative | Optimized | |
| Ratio of reverting to the susceptible after recovery | Optimized | |
| Rate of incubated individuals turning infectious | Optimized | |
| Fraction of exposed individuals becoming symptomatic | Optimized | |
| Rate of cured individuals turning positive | Optimized | |
| Rate of recovery | Optimized | |
| Rate of mortality | Optimized |
| Parameter | Definition | Value |
|---|---|---|
| Rate of transmission of symptomatic individuals | 0.124 | |
| Rate of transmission of asymptomatic individuals | 0.155 | |
| Rate of asymptomatic individuals developing symptoms | 0.14 | |
| Fraction of symptomatic individuals turning threatened | 0.017 | |
| Rate of recovery of symptomatic individuals | 0.1 | |
| Rate of recovery of asymptomatic individuals | 0.14 | |
| Rate of recovery of threatened individuals (severe symptoms) | 0.1 | |
| Rate of mortality | 0.007 |
Appendix B. Additional Modeling Aspects for SIDARTHE
Appendix C. Mean Absolute Error Evaluation
References
- Girardi, P.; Gaetan, C. An SEIR Model with Time-Varying Coefficients for Analyzing the SARS-CoV-2 Epidemic. Risk Anal. 2021, 43, 144–155. [Google Scholar] [CrossRef] [PubMed]
- Arabi, Y.M.; Myatra, S.N.; Lobo, S.M. Surging ICU during COVID-19 pandemic: An overview. Curr. Opin. Crit. Care 2022, 28, 638–644. [Google Scholar] [CrossRef] [PubMed]
- Bertsimas, D.; Boussioux, L.; Cory-Wright, R.; Delarue, A.; Digalakis, V.; Jacquillat, A.; Kitane, D.L.; Lukin, G.; Li, M.; Mingardi, L.; et al. From predictions to prescriptions: A data-driven response to COVID-19. Health Care Manag. Sci. 2021, 24, 253–272. [Google Scholar] [CrossRef] [PubMed]
- Anand, N.; Sabarinath, A.; Geetha, S.; Somanath, S. Predicting the spread of COVID-19 using SIR model augmented to incorporate quarantine and testing. Trans. Indian Natl. Acad. Eng. 2020, 5, 141–148. [Google Scholar] [CrossRef]
- Kermack, W.O.; McKendrick, A.G. A contribution to the mathematical theory of epidemics. Proc. R. Soc. Lond. Ser. A Contain. Pap. Math. Phys. Character 1927, 115, 700–721. [Google Scholar]
- Kucharski, A.J.; Russell, T.W.; Diamond, C.; Liu, Y.; Edmunds, J.; Funk, S.; Eggo, R.M.; Sun, F.; Jit, M.; Munday, J.D.; et al. Early dynamics of transmission and control of COVID-19: A mathematical modelling study. Lancet Infect. Dis. 2020, 20, 553–558. [Google Scholar] [CrossRef]
- Fang, Y.; Nie, Y.; Penny, M. Transmission dynamics of the COVID-19 outbreak and effectiveness of government interventions: A data-driven analysis. J. Med. Virol. 2020, 92, 645–659. [Google Scholar] [CrossRef]
- Tatsuki, O.; Naoki, H.; Igarashi, Y. Optimal COVID-19 testing strategy on limited resources. PLoS ONE 2023, 18, e0281319. [Google Scholar] [CrossRef]
- Liu, X.; Fong, S.J.; Dey, N.; Crespo, R.G.; Herrera-Viedma, E. A new SEAIRD pandemic prediction model with clinical and epidemiological data analysis on COVID-19 outbreak. Appl. Intell. 2021, 51, 4162–4198. [Google Scholar] [CrossRef]
- Giordano, G.; Blanchini, F.; Bruno, R.; Colaneri, P.; Di Filippo, A.; Di Matteo, A.; Colaneri, M. Modelling the COVID-19 epidemic and implementation of population-wide interventions in Italy. Nat. Med. 2020, 26, 855–860. [Google Scholar] [CrossRef]
- Juvet, T.M.; Corbaz-Kurth, S.; Roos, P.; Benzakour, L.; Cereghetti, S.; Moullec, G.; Suard, J.C.; Vieux, L.; Wozniak, H.; Pralong, J.A.; et al. Adapting to the unexpected: Problematic work situations and resilience strategies in healthcare institutions during the COVID-19 pandemic’s first wave. Saf. Sci. 2021, 139, 105277. [Google Scholar] [CrossRef]
- Pahlevani, M.; Taghavi, M.; Vanberkel, P. A systematic literature review of predicting patient discharges using statistical methods and machine learning. Health Care Manag. Sci. 2024, 27, 458–478. [Google Scholar] [CrossRef] [PubMed]
- Van Eck, N.; Waltman, L. Software survey: VOSviewer, a computer program for bibliometric mapping. Scientometrics 2010, 84, 523–538. [Google Scholar] [CrossRef] [PubMed]
- El Hajj, H.; Gzara, F.; Elhedhli, S. A review of analytical models and methods for COVID-19: Vaccination and testing. INFOR Inf. Syst. Oper. Res. 2025, 1–40. [Google Scholar] [CrossRef]
- El Hajj, H.; Gzara, F.; Elhedhli, S. Analytical models and methods for the COVID-19 pandemic: A survey focused on progression and mitigation via non-pharmaceutical interventions. INFOR Inf. Syst. Oper. Res. 2025, 1–41. [Google Scholar] [CrossRef]
- Brauer, F. Mathematical epidemiology: Past, present, and future. Infect. Dis. Model. 2017, 2, 113–127. [Google Scholar] [CrossRef]
- Hethcote, H.W. The mathematics of infectious diseases. SIAM Rev. 2000, 42, 599–653. [Google Scholar] [CrossRef]
- Saxena, R.; Jadeja, M.; Bhateja, V. Exploring Susceptible-Infectious-Recovered (SIR) Model for COVID-19 Investigation; Springer: Cham, Switzerland, 2022. [Google Scholar]
- Cooper, I.; Mondal, A.; Antonopoulos, C.G. A SIR model assumption for the spread of COVID-19 in different communities. Chaos Solit. Fractals 2020, 139, 110057. [Google Scholar] [CrossRef]
- Putra, S.; Mutamar, Z.K.; Zulkarnain, K. Estimation of parameters in the SIR epidemic model using particle swarm optimization. Am. J. Math. Comput. Model 2019, 4, 83–93. [Google Scholar] [CrossRef]
- Chen, Y.C.; Lu, P.E.; Chang, C.S.; Liu, T.H. A time-dependent SIR model for COVID-19 with undetectable infected persons. IEEE Trans. Netw. Sci. Eng. 2020, 7, 3279–3294. [Google Scholar] [CrossRef]
- Cooke, K.L. Functional-Differential Equations: Some Models and Perturbation Problems; Academic Press: New York, NY, USA, 1967. [Google Scholar]
- Tang, L.; Zhou, Y.; Wang, L.; Purkayastha, S.; Zhang, L.; He, J.; Wang, F.; Song, P.X.K. A review of multi-compartment infectious disease models. Int. Stat. Rev. 2020, 88, 462–513. [Google Scholar] [CrossRef] [PubMed]
- Tang, B.; Wang, X.; Li, Q.; Bragazzi, N.L.; Tang, S.; Xiao, Y.; Wu, J. Estimation of the transmission risk of the 2019-nCoV and its implication for public health interventions. J. Clin. Med. 2020, 9, 462. [Google Scholar] [CrossRef] [PubMed]
- He, S.; Peng, Y.; Sun, K. SEIR modeling of the COVID-19 and its dynamics. Nonlinear Dyn. 2020, 101, 1667–1680. [Google Scholar] [CrossRef]
- Wu, J.T.; Leung, K.; Leung, G.M. Nowcasting and forecasting the potential domestic and international spread of the 2019-nCoV outbreak originating in Wuhan, China: A modelling study. Lancet 2020, 395, 689–697. [Google Scholar] [CrossRef]
- Rabil, M.J.; Tunc, S.; Bish, D.R.; Bish, E.K. Benefits of integrated screening and vaccination for infection control. PLoS ONE 2022, 17, e0267388. [Google Scholar] [CrossRef]
- Rabil, M.J.; Tunc, S.; Bish, D.R.; Bish, E.K. Effective screening strategies for safe opening of universities under Omicron and Delta variants of COVID-19. Sci. Rep. 2022, 12, 21309. [Google Scholar]
- CDC. What Is COVID-19 Reinfection? 2023. Available online: https://archive.cdc.gov/www_cdc_gov/coronavirus/2019-ncov/your-health/reinfection.html (accessed on 6 April 2023).
- Loli Piccolomini, E.; Zama, F. Monitoring Italian COVID-19 spread by a forced SEIRD model. PLoS ONE 2020, 15, e0237417. [Google Scholar] [CrossRef]
- He, J.; Guo, Y.; Mao, R.; Zhang, J. Proportion of asymptomatic coronavirus disease 2019: A systematic review and meta-analysis. J. Med. Virol. 2021, 93, 820–830. [Google Scholar] [CrossRef]
- Sun, T.; Wang, Y. Modeling COVID-19 epidemic in Heilongjiang province, China. Chaos Solit. Fractals 2020, 138, 109949. [Google Scholar] [CrossRef]
- Kim, Y.J.; Koo, P.H. Effectiveness of Testing and Contact-Tracing to Counter COVID-19 Pandemic: Designed Experiments of Agent-Based Simulation. Healthcare 2021, 9, 625. [Google Scholar] [CrossRef]
- Skoll, D.; Miller, J.C.; Saxon, L.A. COVID-19 testing and infection surveillance: Is a combined digital contact-tracing and mass-testing solution feasible in the United States? Cardiovasc. Digit. Health J. 2020, 1, 149–159. [Google Scholar] [CrossRef] [PubMed]
- Shams Eddin, M.; El-Amine, H.; Aprahamian, H. The impact of early large-scale screening on the evolution of pandemics. IISE Trans. 2024, 57, 509–523. [Google Scholar] [CrossRef]
- CSSE. CSSEGISandData. 2024. Available online: https://github.com/CSSEGISandData (accessed on 1 October 2024).
- Van Kampen, J.J.; van de Vijver, D.A.; Fraaij, P.L.; Haagmans, B.L.; Lamers, M.M.; Okba, N.; van den Akker, J.P.; Endeman, H.; Gommers, D.A.; Cornelissen, J.J.; et al. Duration and key determinants of infectious virus shedding in hospitalized patients with coronavirus disease-2019 (COVID-19). Nat. Commun. 2021, 12, 267. [Google Scholar] [CrossRef] [PubMed]
- Gregory, C.O.; Hall, A.J. COVID-19. In CDC Yellow Book: Health Information for International Travel; Oxford University Press: New York, NY, USA, 2025. [Google Scholar]
- Zhang, L.; Zhu, J.; Wang, X.; Yang, J.; Liu, X.F.; Xu, X.K. Characterizing COVID-19 transmission: Incubation period, reproduction rate, and multiple-generation spreading. Front. Phys. 2021, 8, 589963. [Google Scholar] [CrossRef]
- Gunzler, D.D.; Sehgal, A.R. Time-varying COVID-19 reproduction number in the United States. MedRxiv 2020. [Google Scholar] [CrossRef]
- Yoshikura, H. Epidemic Curves of COVID-19 in the World which are Similar Within but not Across Regions. Epidemiol. Int. J. 2024, 8, 1–5. [Google Scholar] [CrossRef]
- CDC. COVID DATA TRACKER WEEKLY REVIEW. 2021. Available online: https://archive.cdc.gov/www_cdc_gov/coronavirus/2019-ncov/covid-data/covidview/past-reports/08272021.html (accessed on 23 June 2025).
- CDC. COVID-19 Update for the United States. 2025. Available online: https://covid.cdc.gov/covid-data-tracker/#datatracker-home (accessed on 23 June 2025).
- Park, A. The First Authorized COVID-19 Vaccine in the U.S. Has Arrived. 2020. Available online: https://time.com/5920134/first-authorized-covid-19-vaccine-us/ (accessed on 21 June 2025).


| Model | Compartments | Key Feature | Application Example | Limitations |
|---|---|---|---|---|
| SIR | S, I, R | Simple baseline model | [4,18] | Ignores exposed/asymptomatic states |
| SEIR | S, E, I, R | Adds incubation (latent) period | [24,25] | No explicit asymptomatic differentiation |
| SEIRD | S, E, I, R, D | Tracks mortality explicitly | [30] | Assumes permanent immunity |
| SIQRD | S, I, Q, R, D | Models quarantine for false positives | [35] | Requires detailed testing/quarantine data |
| SEAIRD | S, E, A, I, R, D | Includes asymptomatic spread dynamics | [9,32] | Needs asymptomatic prevalence data |
| SIDARTHE | S, I, D, A, R, T, H, E | High compartmental granularity (diagnosis stages) | [10] | High data and parameter demands |
| Model | Equations | Parameters |
|---|---|---|
| SIR | , , | : Rate of transmission. : Rate of recovery. |
| SEIRD | : Rate of exposure to infected individuals. : Probability of incubated individuals turning negative. : Rate of incubated individuals turning infectious. : Rate of mortality. | |
| SEAIRD | : Rate of exposure to incubated individuals. : Probability of exposure to infection. : Ratio of reverting to the susceptible after recovery. : Fraction of exposed individuals becoming symptomatic. : Rate of cured individuals turning positive. | |
| SIDARTHE | and : Rates of transmission of symptomatic and asymptomatic individuals, respectively. : Rate of asymptomatic individuals developing symptoms. : Fraction of symptomatic individuals turning threatened. and : Rates of recovery of symptomatic and asymptomatic individuals, respectively. : Rate of recovery of threatened individuals (severe symptoms) |
| Model | Susceptible | Exposed | Asymptomatic Infectious | Symptomatic Infectious | Diagnosed | Recognised | Threatened | Recovered | Dead |
|---|---|---|---|---|---|---|---|---|---|
| SIR | ✓ | ✓ | ✓ | ||||||
| SEIRD | ✓ | ✓ | ✓ | ✓ | ✓ | ||||
| SEAIRD | ✓ | ✓ | ✓ | ✓ | ✓ | ✓ | |||
| SIDARTHE | ✓ | ✓ | ✓ | ✓ | ✓ | ✓ | ✓ | ✓ | |
| Simplified SIDARTHE | ✓ | ✓ | ✓ | ✓ | ✓ | ✓ |
| Date | SIR Dev. | SIR Prop. | SEAIRD Dev. | SEAIRD Prop. | SIDARTHE Dev. | SIDARTHE Prop. |
|---|---|---|---|---|---|---|
| 31 March 2020 | −39.99 | 0 | −39.91 | 0 | −40.11 | 0 |
| 30 April 2020 | −447.01 | 0 | −436.90 | 0 | −448.14 | 0 |
| 31 May 2020 | −398.69 | 0 | −16.68 | 0.3871 | −406.34 | 0 |
| 30 June 2020 | −352.35 | 0 | 1468.40 | 1 | −396.83 | 0 |
| 30 April 2021 | 938.19 | 1 | −87.57 | 0.1333 | −86.70 | 0.0667 |
| 31 May 2021 | 5673.71 | 1 | 455.68 | 1 | 267.22 | 1 |
| 30 June 2021 | 13,032.57 | 1 | 899.20 | 1 | 522.53 | 1 |
| 31 July 2021 | 14,754.88 | 1 | 684.15 | 1 | 195.95 | 0.7586 |
| 30 November 2021 | 719.22 | 0.9667 | 691.04 | 1 | −263.66 | 0.0667 |
| 31 December 2021 | 2670.63 | 1 | −885.95 | 0.2258 | −1562.00 | 0 |
| 31 January 2022 | −1271.81 | 0.2581 | −9713.99 | 0 | −9966.65 | 0 |
| 28 February 2022 | 7009.39 | 1 | −3496.24 | 0 | −3559.17 | 0 |
| Date | SIR | SEIR | SEAIRD | SIDARTHE |
|---|---|---|---|---|
| 1 March 2020 | 0 | 12 | 0 | 0 |
| 1 July 2020 | 29 | 0 | 0 | 22 |
| 1 November 2020 | 7 | 46 | 8 | 11 |
| 1 April 2021 | 81 | 59 | 15 | 72 |
| 1 November 2021 | 23 | 64 | 79 | 5 |
| Model | RMSE/MAE | Estimation Orientation | Time to Peak | ||||
|---|---|---|---|---|---|---|---|
| Early | Mid | Late | Early | Mid | Late | Accuracy | |
| SIR | Moderate | High | Low | Under | Over | Over-Under | High |
| SIRD | Moderate | High | High | Under | Over | Over | High |
| SEAIRD | High | Low | High | Over | Over | Under | Low |
| SIDARTHE | Moderate | Low | High | Under | Over-Under | Under | Low |
Disclaimer/Publisher’s Note: The statements, opinions and data contained in all publications are solely those of the individual author(s) and contributor(s) and not of MDPI and/or the editor(s). MDPI and/or the editor(s) disclaim responsibility for any injury to people or property resulting from any ideas, methods, instructions or products referred to in the content. |
© 2025 by the authors. Licensee MDPI, Basel, Switzerland. This article is an open access article distributed under the terms and conditions of the Creative Commons Attribution (CC BY) license (https://creativecommons.org/licenses/by/4.0/).
Share and Cite
Shams Eddin, M.; El Hajj, H.; Zayyat, R.; Lee, G. Systematic Comparison of Different Compartmental Models for Predicting COVID-19 Progression. Epidemiologia 2025, 6, 33. https://doi.org/10.3390/epidemiologia6030033
Shams Eddin M, El Hajj H, Zayyat R, Lee G. Systematic Comparison of Different Compartmental Models for Predicting COVID-19 Progression. Epidemiologia. 2025; 6(3):33. https://doi.org/10.3390/epidemiologia6030033
Chicago/Turabian StyleShams Eddin, Marwan, Hussein El Hajj, Ramez Zayyat, and Gayeon Lee. 2025. "Systematic Comparison of Different Compartmental Models for Predicting COVID-19 Progression" Epidemiologia 6, no. 3: 33. https://doi.org/10.3390/epidemiologia6030033
APA StyleShams Eddin, M., El Hajj, H., Zayyat, R., & Lee, G. (2025). Systematic Comparison of Different Compartmental Models for Predicting COVID-19 Progression. Epidemiologia, 6(3), 33. https://doi.org/10.3390/epidemiologia6030033