
Carbon Nanotubes Blended Nematic Liquid Crystal for Display and Electro-Optical Applications

 ,
, 

Abstract
:
1. Introduction
2. Materials and Methods
3. Results and Discussion
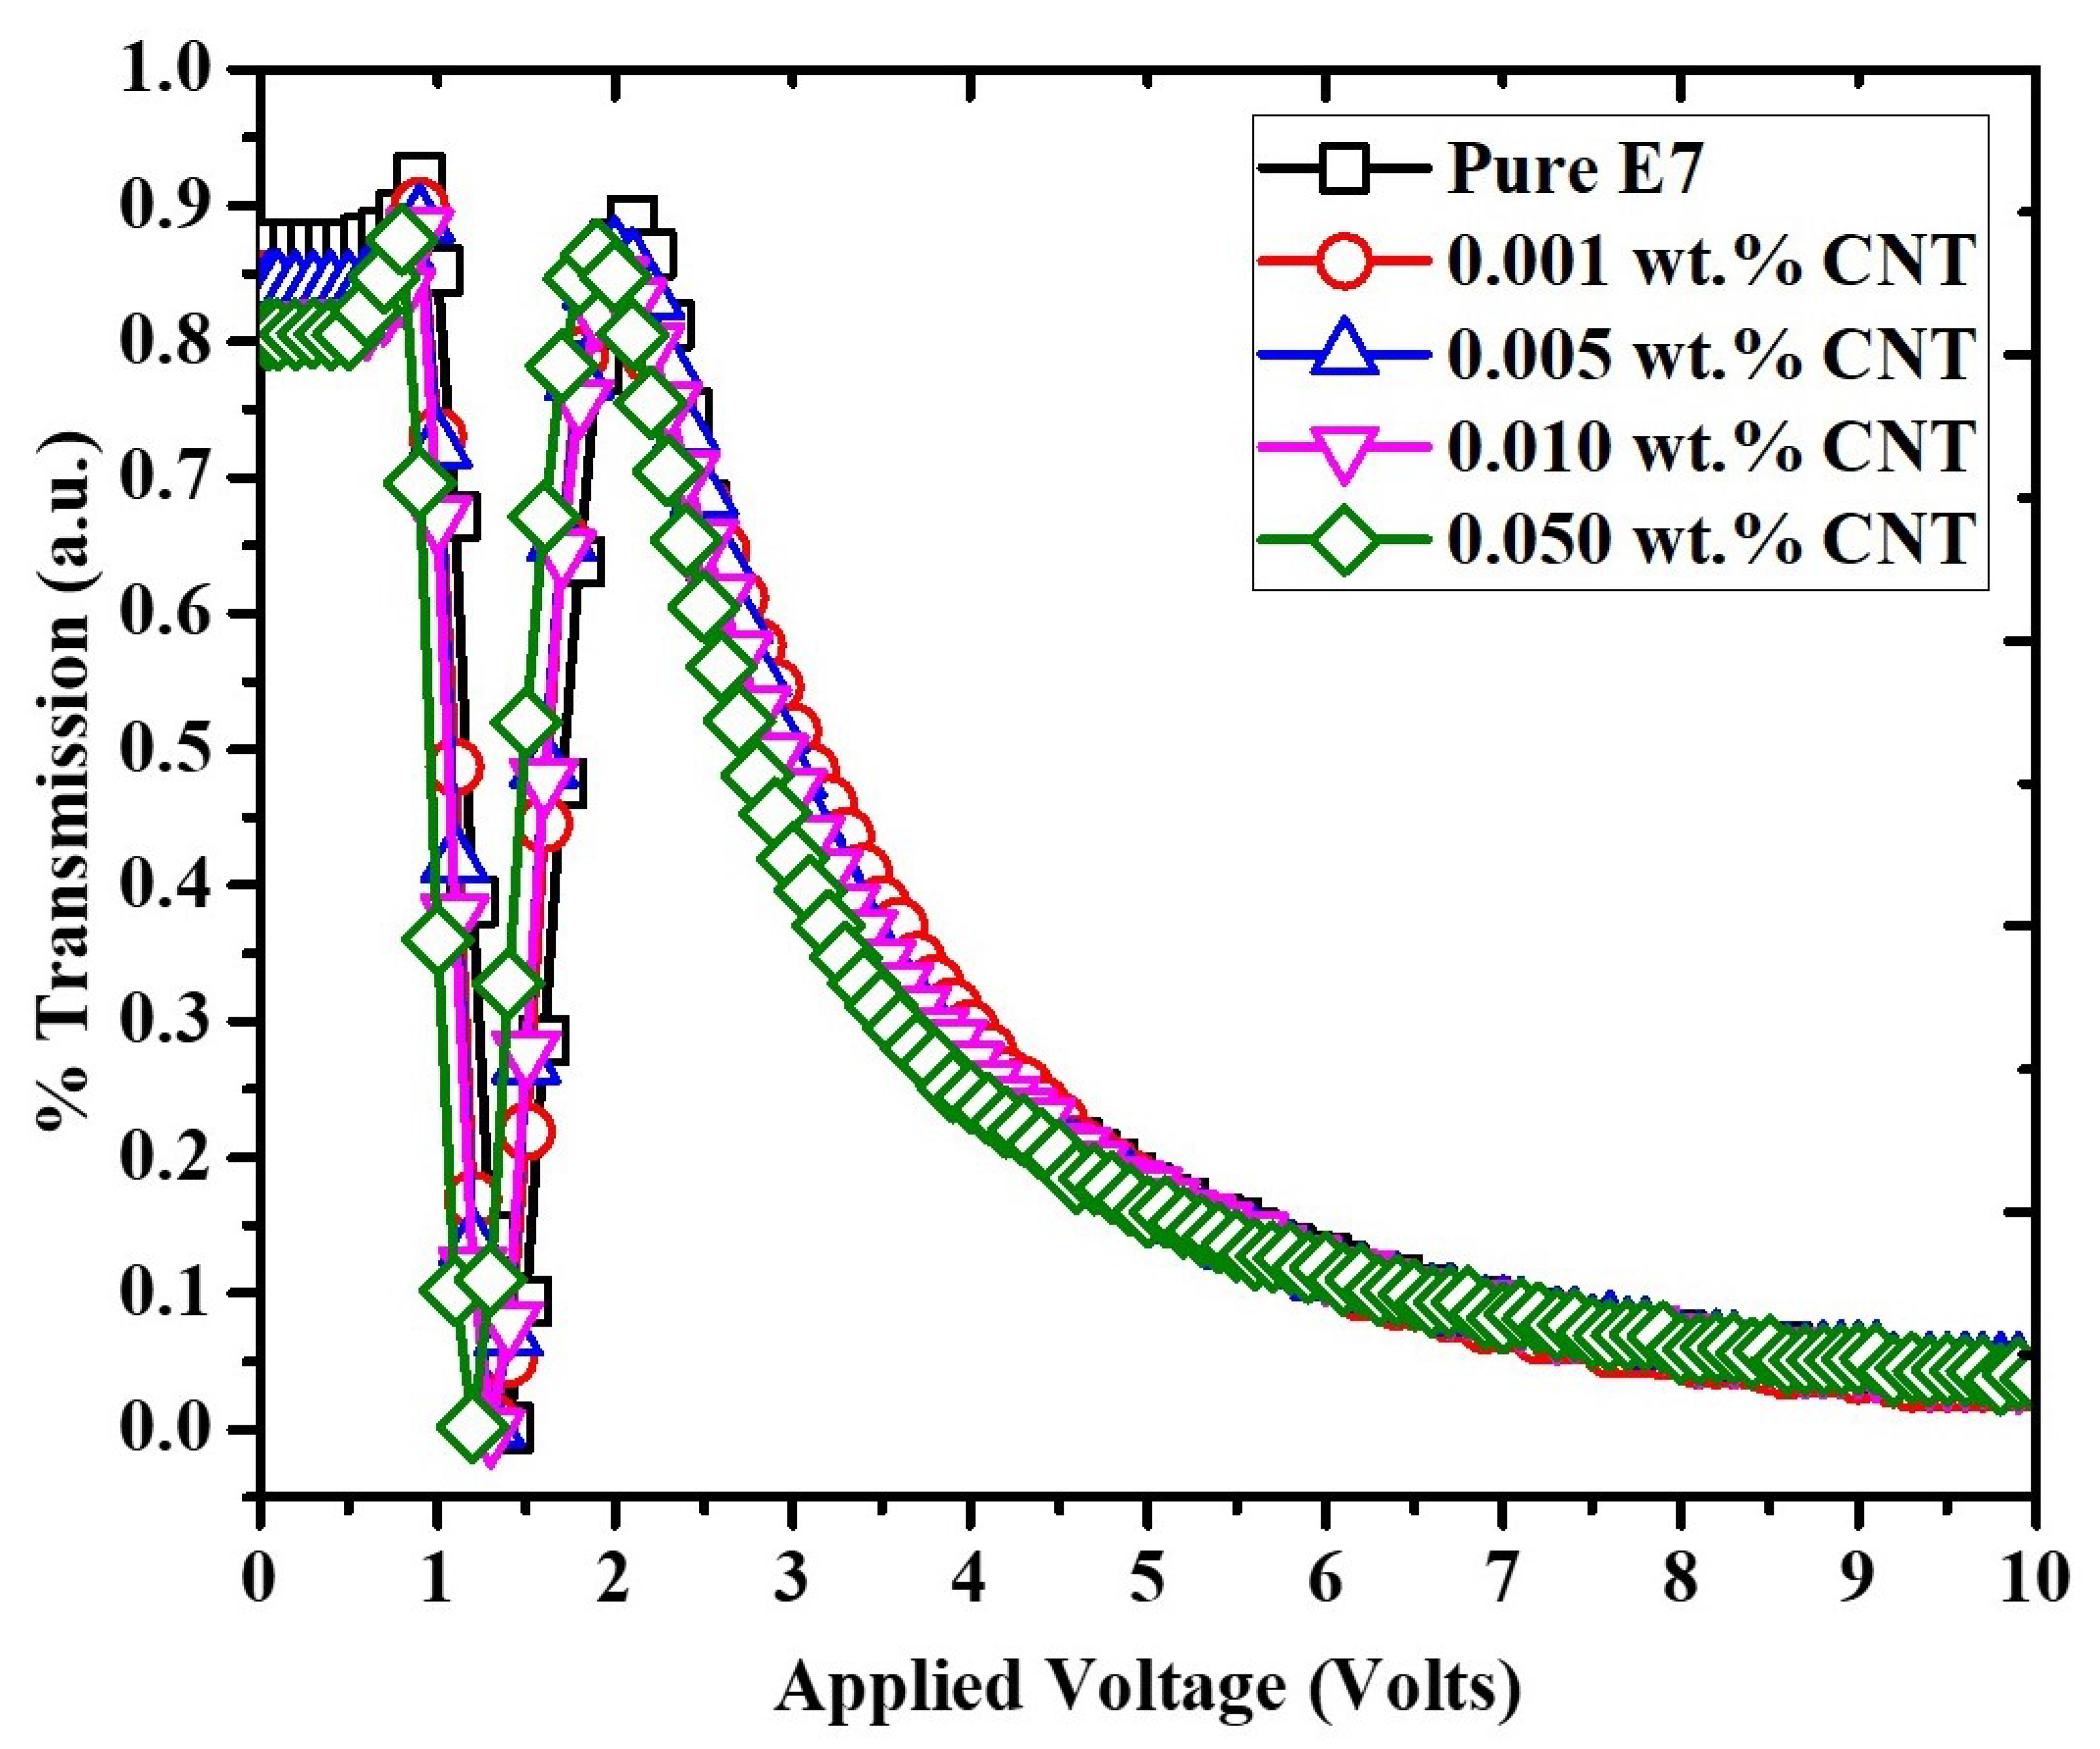
- By V-T curve: V is defined as the voltage corresponding to which initial transmission of the V-T curve starts changing; however, this method is not so accurate as one can be confused between the V and distortion of transmitted light.
- By phase curve: To define the V for MWCNT-doped LC composites, the V-T curves were transferred to voltage-dependent phase retardations in which V is described as the voltage required for the change in phase retardation from 100% to 90% of maximum value.
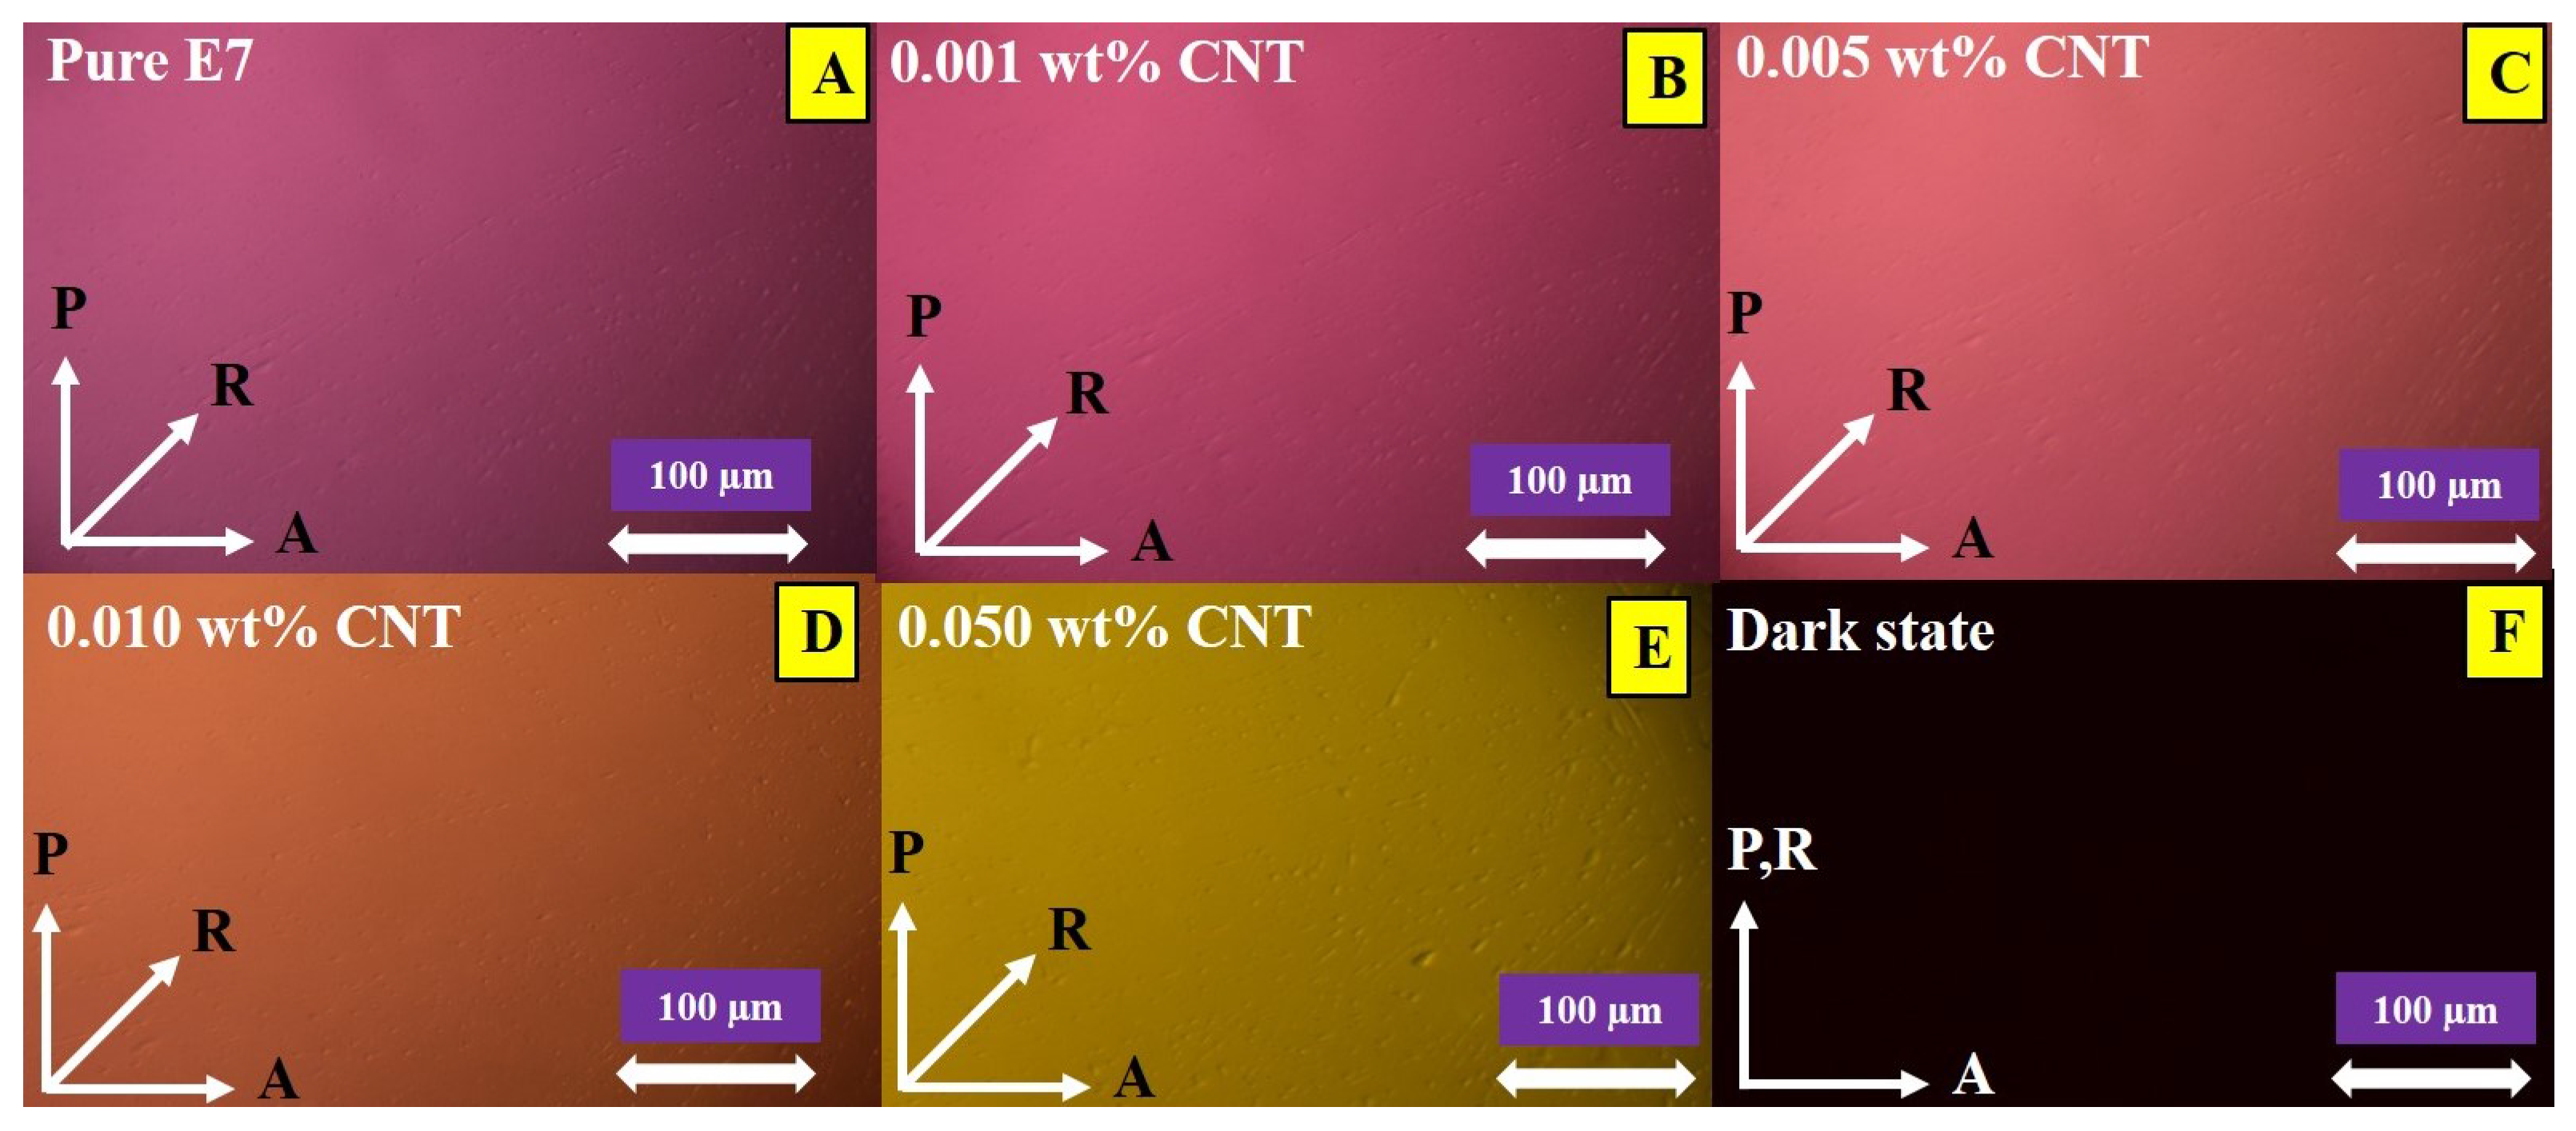
- By POM image: The V is determined via POMs of the MWCNT-doped LC cells recorded at different voltages. The V is termed to be a particular voltage at which we observe a color change in POM. This color change evinces distortions in the LC cell.
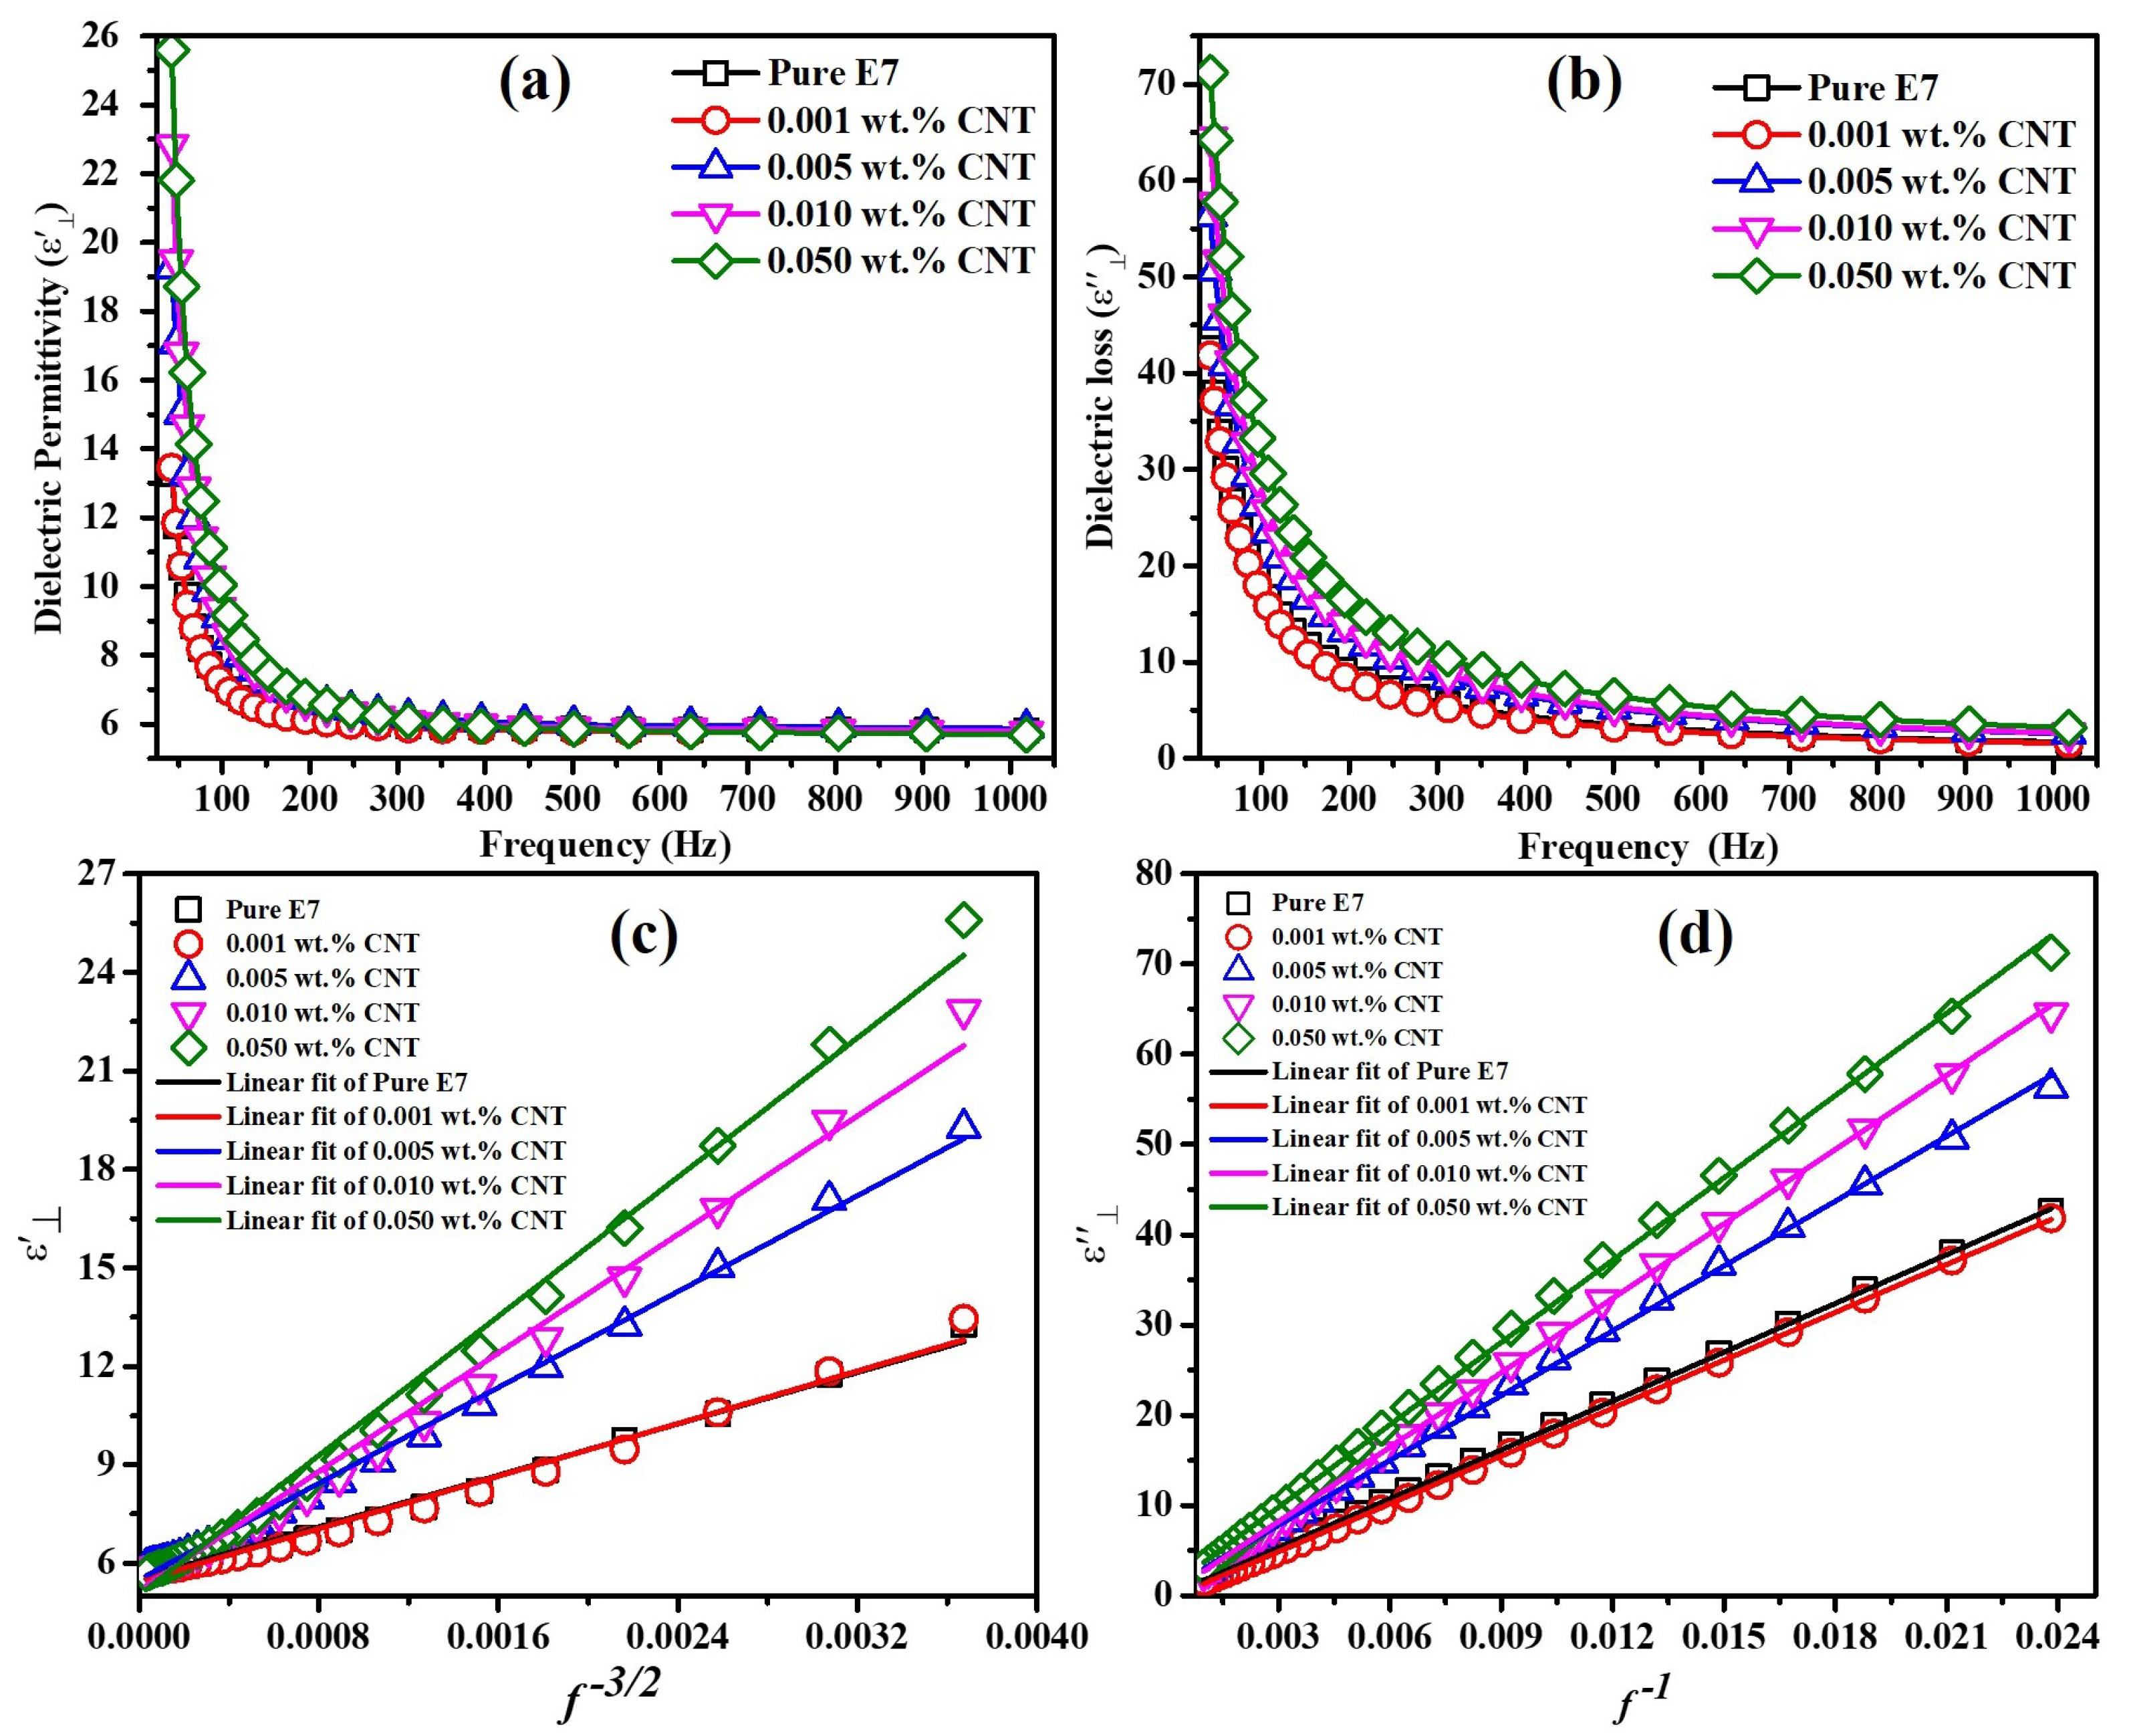
- By C-V curve: The V via C-V curves in MWCNT doped homogeneously aligned LC cells is defined as the voltage at which capacitance begins to increase. Among all four techniques, we have observed approximately the same value of V (∼0.96 Volts) for the pure E7 LC and LC-MWCNT composites at RT.
4. Conclusions
Supplementary Materials
Author Contributions
Funding
Institutional Review Board Statement
Informed Consent Statement
Data Availability Statement
Acknowledgments
Conflicts of Interest
References
- Jain, K.; Klosner, M.; Zemel, M.; Raghunandan, S. Flexible Electronics and Displays: High-Resolution, Roll-to-Roll, Projection Lithography and Photoablation Processing Technologies for High-Throughput Production. Proc. IEEE 2005, 93, 1500–1510. [Google Scholar] [CrossRef]
- Hsu, C.J.; Singh, B.P.; Antony, M.; Selvaraj, P.; Manohar, R.; Huang, C.Y. Liquid crystal lens with doping of rutile titanium dioxide nanoparticles. Opt. Express 2020, 28, 22856–22866. [Google Scholar] [CrossRef] [PubMed]
- Driencourt, L.; Federspiel, F.; Kazazis, D.; Tseng, L.T.; Frantz, R.; Ekinci, Y.; Ferrini, R.; Gallinet, B. Electrically Tunable Multicolored Filter Using Birefringent Plasmonic Resonators and Liquid Crystals. ACS Photonics 2020, 7, 444–453. [Google Scholar] [CrossRef]
- Chen, C.W.; Brigeman, A.N.; Ho, T.J.; Khoo, I.C. Normally transparent smart window based on electrically induced instability in dielectrically negative cholesteric liquid crystal. Opt. Mater. Express 2018, 8, 691–697. [Google Scholar] [CrossRef]
- Zhang, Y.; Yang, X.; Zhan, Y.; Zhang, Y.; He, J.; Lv, P.; Yuan, D.; Hu, X.; Liu, D.; Broer, D.J.; et al. Electroconvection in Zwitterion-Doped Nematic Liquid Crystals and Application as Smart Windows. Adv. Opt. Mater. 2021, 9, 2001465. [Google Scholar] [CrossRef]
- Wang, Z.; Xu, T.; Noel, A.; Chen, Y.C.; Liu, T. Applications of liquid crystals in biosensing. Soft Matter 2021, 17, 4675–4702. [Google Scholar] [CrossRef] [PubMed]
- Christodoulou, C.G.; Tawk, Y.; Lane, S.A.; Erwin, S.R. Reconfigurable Antennas for Wireless and Space Applications. Proc. IEEE 2012, 100, 2250–2261. [Google Scholar] [CrossRef]
- Carlton, R.J.; Hunter, J.T.; Miller, D.S.; Abbasi, R.; Mushenheim, P.C.; Tan, L.N.; Abbott, N.L. Chemical and biological sensing using liquid crystals. Liq. Cryst. Rev. 2013, 1, 29–51. [Google Scholar] [CrossRef]
- Singh, D.P.; Gupta, S.K.; Yadav, S.P.; Sharma, P.K.; Pandey, A.C.; Manohar, R. Guest–host interaction in ferroelectric liquid crystal–nanoparticle composite system. Bull. Mater. Sci. 2014, 37, 511–518. [Google Scholar] [CrossRef] [Green Version]
- Singh, B.P.; Huang, C.Y.; Singh, D.P.; Palani, P.; Duponchel, B.; Sah, M.; Manohar, R.; Pandey, K.K. The scientific duo of TiO2 nanoparticles and nematic liquid crystal E204: Increased absorbance, photoluminescence quenching and improving response time for electro-optical devices. J. Mol. Liq. 2021, 325, 115130. [Google Scholar] [CrossRef]
- Latypov, Z.Z.; Pozdnyakov, O.F. Determining conditions for the preparation of polymer films containing an ordered structure of carbon nanotubes and higher fullerenes. Tech. Phys. Lett. 2006, 32, 381–383. [Google Scholar] [CrossRef]
- Mayer, A. Formulation in terms of normalized propagators of a charge-dipole model enabling the calculation of the polarization properties of fullerenes and carbon nanotubes. Phys. Rev. B 2007, 75, 045407. [Google Scholar] [CrossRef] [Green Version]
- Macutkevic, J.; Seliuta, D.; Valusis, G.; Banys, J.; Kuzhir, P.; Maksimenko, S.; Kuznetsov, V.; Moseenkov, S.; Shenderova, O.; Lambin, P. Dielectric properties of onion-like carbon based polymer films: Experiment and modeling. Solid State Sci. 2009, 11, 1828–1832. [Google Scholar] [CrossRef]
- Sabirov, D.S. Polarizability as a landmark property for fullerene chemistry and materials science. RSC Adv. 2014, 4, 44996–45028. [Google Scholar] [CrossRef]
- Basu, R.; Iannacchione, G.S. Orientational coupling enhancement in a carbon nanotube dispersed liquid crystal. Phys. Rev. E 2010, 81, 051705. [Google Scholar] [CrossRef] [PubMed] [Green Version]
- Basu, R.; Iannacchione, G.S. Nematic anchoring on carbon nanotubes. Appl. Phys. Lett. 2009, 95, 173113. [Google Scholar] [CrossRef] [Green Version]
- Rahman, M.; Lee, W. Scientific duo of carbon nanotubes and nematic liquid crystals. J. Phys. D Appl. Phys. 2009, 42, 063001. [Google Scholar] [CrossRef]
- Moghadas, F.; Poursamad, J.B.; Sahrai, M.; Emdadi, M. Flexoelectric coefficients enhancement via doping carbon nanotubes in nematic liquid crystal host. Eur. Phys. J. E 2019, 42, 103. [Google Scholar] [CrossRef]
- Petrov, D.A.; Skokov, P.K.; Zakhlevnykh, A.N.; Makarov, D.V. Magnetic segregation effect in liquid crystals doped with carbon nanotubes. Beilstein J. Nanotechnol. 2019, 10, 1464–1474. [Google Scholar] [CrossRef]
- Garbovskiy, Y. Conventional and unconventional ionic phenomena in tunable soft materials made of liquid crystals and nanoparticles. Nano Express 2021, 2, 012004. [Google Scholar] [CrossRef]
- Varshini, G.V.; Shankar Rao, D.S.; Mukherjee, P.K.; Krishna Prasad, S. Nanophase Segregation of Nanostructures: Induction of Smectic A and Re-Entrance in a Carbon Nanotube/Nematic Liquid Crystal Composite. J. Phys. Chem. B 2018, 122, 10774–10781. [Google Scholar] [CrossRef]
- Dolgov, L.; Yaroshchuk, O.; Lebovka, M. Effect of Electro-Optical Memory in Liquid Crystals Doped with Carbon Nanotubes. Mol. Cryst. Liq. Cryst. 2008, 496, 212–229. [Google Scholar] [CrossRef]
- Petrov, D.A.; Skokov, P.K.; Zakhlevnykh, A.N. Magnetic field induced orientational transitions in liquid crystals doped with carbon nanotubes. Beilstein J. Nanotechnol. 2017, 8, 2807–2817. [Google Scholar] [CrossRef] [PubMed] [Green Version]
- Chen, H.Y.; Lee, W. Suppression of field screening in nematic liquid crystals by carbon nanotubes. Appl. Phys. Lett. 2006, 88, 222105. [Google Scholar] [CrossRef]
- Qiao, X.; Zhang, X.; Guo, Y.; Yang, S.; Tian, Y.; Meng, Y. Boundary layer viscosity of CNT-doped liquid crystals: Effects of phase behavior. Rheol. Acta 2013, 52, 939–947. [Google Scholar] [CrossRef]
- Gupta, S.K.; Kumar, A.; Srivastava, A.K.; Manohar, R. Modification in dielectric properties of SWCNT doped ferroelectric liquid crystals. J. Non-Cryst. Solids 2011, 357, 1822–1826. [Google Scholar] [CrossRef]
- Malik, P.; Chaudhary, A.; Mehra, R.; Raina, K.K. Electro-optic, thermo-optic and dielectric responses of multiwalled carbon nanotube doped ferroelectric liquid crystal thin films. J. Mol. Liq. 2012, 165, 7–11. [Google Scholar] [CrossRef]
- Basu, R. Effect of carbon nanotubes on the field-induced nematic switching. Appl. Phys. Lett. 2013, 103, 241906. [Google Scholar] [CrossRef] [Green Version]
- Basu, R.; Petschek, R.G.; Rosenblatt, C. Nematic electroclinic effect in a carbon-nanotube-doped achiral liquid crystal. Phys. Rev. E 2011, 83, 041707. [Google Scholar] [CrossRef] [Green Version]
- Basu, R.; Iannacchione, G.S. Dielectric response of multiwalled carbon nanotubes as a function of applied ac-electric fields. J. Appl. Phys. 2008, 104, 114107. [Google Scholar] [CrossRef]
- Yadav, S.P.; Singh, S. Carbon nanotube dispersion in nematic liquid crystals: An overview. Prog. Mater. Sci. 2016, 80, 38–76. [Google Scholar] [CrossRef]
- Singh, B.P.; Sikarwar, S.; Agrahari, K.; Tripathi, S.; Gangwar, R.K.; Manohar, R.; Pandey, K.K. Electro-optical characterization of a weakly polar liquid crystalline compound influenced polyvinyl pyrrolidone capped gold nanoparticles. J. Mol. Liq. 2021, 325, 115172. [Google Scholar] [CrossRef]
- Arora, V.K.; Bhattacharyya, A. Cohesive band structure of carbon nanotubes for applications in quantum transport. Nanoscale 2013, 5, 10927–10935. [Google Scholar] [CrossRef] [PubMed]
- Hanwell, M.D.; Curtis, D.E.; Lonie, D.C.; Vandermeersch, T.; Zurek, E.; Hutchison, G.R. Avogadro: An advanced semantic chemical editor, visualization, and analysis platform. J. Cheminform. 2012, 4, 17. [Google Scholar] [CrossRef] [PubMed] [Green Version]
- Baur, G.; Wittwer, V.; Berreman, D.W. Determination of the tilt angles at surfaces of substrates in liquid crystal cells. Phys. Lett. A 1976, 56, 142–144. [Google Scholar] [CrossRef]
- Nastishin, Y.A.; Polak, R.D.; Shiyanovskii, S.V.; Bodnar, V.H.; Lavrentovich, O.D. Nematic polar anchoring strength measured by electric field techniques. J. Appl. Phys. 1999, 86, 4199–4213. [Google Scholar] [CrossRef] [Green Version]
- Singh, B.P.; Pathak, G.; Roy, A.; Hegde, G.; Tripathi, P.K.; Srivastava, A.; Manohar, R. Investigation of dielectric and electro-optical properties of nematic liquid crystal with the suspension of biowaste-based porous carbon nanoparticles. Liq. Cryst. 2019, 46, 1808–1820. [Google Scholar] [CrossRef]
- Lagerwall, J.P.F.; Scalia, G. Carbon nanotubes in liquid crystals. J. Mater. Chem. 2008, 18, 2890–2898. [Google Scholar] [CrossRef] [Green Version]
- Chang, C.; Zhao, Y.; Liu, Y.; An, L. Liquid crystallinity of carbon nanotubes. RSC Adv. 2018, 8, 15780–15795. [Google Scholar] [CrossRef] [Green Version]
- Vimal, T.; Singh, D.; Gupta, S.; Pandey, S.; Agrahari, K.; Manohar, R. Thermal and optical study of semiconducting CNTs-doped nematic liquid crystalline material. Phase Transit. 2016, 89, 632–642. [Google Scholar] [CrossRef]
- Raina, K.; Kumar, P.; Malik, P. Morphological control and polarization switching in polymer dispersed liquid crystal materials and devices. Bull. Mater. Sci. 2006, 29, 599–603. [Google Scholar] [CrossRef]
- Singh, D.P.; Visvanathan, R.; Duncan, A.E.; Duponchel, B.; Boussoualem, Y.; Kumar, S.; Clark, N.A.; Blach, J.F.; Douali, R.; Daoudi, A. CdSe quantum dots in chiral smectic C matrix: Experimental evidence of smectic layer distortion by small and wide angle X-ray scattering and subsequent effect on electro-optical parameters. Liq. Cryst. 2018. [Google Scholar] [CrossRef]
- Singh, D.P.; Duponchel, B.; Boussoualem, Y.; Agrahari, K.; Manohar, R.; Kumar, V.; Pasricha, R.; Pujar, G.H.; Inamdar, S.R.; Douali, R.; et al. Dual Photoluminescence and Charge Transport in alkoxy biphenyl benzoate ferroelectric liquid crystalline-Graphene Oxide Composite. New J. Chem. 2018, 42, 16682–16693. [Google Scholar] [CrossRef]
- Singh, D.P.; Misra, A.K.; Pandey, K.K.; Pal, B.; Kumar, N.; Singh, D.; Kondratenko, K.; Duponchel, B.; Genevray, P.; Douali, R. Spectroscopic, dielectric and nonlinear current–voltage characterization of a hydrogen-bonded liquid crystalline compound influenced via graphitic nanoflakes: An equilibrium between the experimental and theoretical studies. J. Mol. Liq. 2020, 302, 112537. [Google Scholar] [CrossRef]
- Lee, J.H.; Lee, J.J.; Lim, Y.J.; Kundu, S.; Kang, S.W.; Lee, S.H. Enhanced contrast ratio and viewing angle of polymer-stabilized liquid crystal via refractive index matching between liquid crystal and polymer network. Opt. Express 2013, 21, 26914–26920. [Google Scholar] [CrossRef]
- Kumar, P.; Sharma, V.; Jaggi, C.; Malik, P.; Raina, K.K. Orientational control of liquid crystal molecules via carbon nanotubes and dichroic dye in polymer dispersed liquid crystal. Liq. Cryst. 2017, 44, 843–853. [Google Scholar] [CrossRef]
- Shukla, R.K.; Chaudhary, A.; Bubnov, A.; Hamplova, V.; Raina, K.K. Electrically switchable birefringent self-assembled nanocomposites: Ferroelectric liquid crystal doped with the multiwall carbon nanotubes. Liq. Cryst. 2020, 47, 1379–1389. [Google Scholar] [CrossRef]
- Uemura, S. Ionic contribution to the complex dielectric constant of a polymer under dc bias. J. Polym. Sci. Polym. Phys. Ed. 1972, 10, 2155–2166. [Google Scholar] [CrossRef]
- Uemura, S. Low-frequency dielectric behavior of poly(vinylidene fluoride). J. Polym. Sci. Polym. Phys. Ed. 1974, 12, 1177–1188. [Google Scholar] [CrossRef]
- Yadav, S.P.; Manohar, R.; Singh, S. Effect of TiO2 nanoparticles dispersion on ionic behaviour in nematic liquid crystal. Liq. Cryst. 2015, 42, 1095–1101. [Google Scholar] [CrossRef]
- Shin, H.K.; Seo, J.H.; Yoon, T.H.; Kim, J.C.; Woo, H.S.; Shin, S.T. Effects of Pentacene on the Properties of Negative Anisotropy Nematic Liquid Crystal in Vertical Alignment Cell. Jpn. J. Appl. Phys. 2009, 48, 111502. [Google Scholar] [CrossRef]
- Wrobel, S.; Gestblom, B.; Jadzyn, J.; Kedziora, P.; Hellemans, L.; Wurflinger, A.; Urban, S. Dielectric Relaxation Spectroscopy. In Relaxation Phenomena; Springer: Berlin/Heidelberg, Germany, 2003; pp. 13–88. [Google Scholar] [CrossRef]
- Liao, S.W.; Hsieh, C.T.; Kuo, C.C.; Huang, C.Y. Voltage-assisted ion reduction in liquid crystal-silica nanoparticle dispersions. Appl. Phys. Lett. 2012, 101, 161906. [Google Scholar] [CrossRef]
- Perkowski, P. Dielectric spectroscopy of liquid crystals. Theoretical model of ITO electrodes influence on dielectric measurements. Opto-Electron. Rev. 2009, 17, 180–186. [Google Scholar] [CrossRef]
- Perkowski, P. Dielectric spectroscopy of liquid crystals. Electrodes resistivity and connecting wires inductance influence on dielectric measurements. Opto-Electron. Rev. 2012, 20, 79–86. [Google Scholar] [CrossRef]
- Schadt, M. Liquid crystal materials and liquid crystal displays. Annu. Rev. Mater. Sci. 1997, 27, 305–379. [Google Scholar] [CrossRef] [Green Version]
- Chen, Z.; Jiang, L.; Ma, H. Calculation on frequency and temperature properties of birefringence of nematic liquid crystal 5CB in terahertz band. Chem. Phys. Lett. 2016, 645, 205–209. [Google Scholar] [CrossRef]
- Prasad, A.; Das, M.K. Optical birefringence studies of a binary mixture with the nematic–smectic Ad-re-entrant nematic phase sequence. J. Phys. Condens. Matter 2010, 22, 195106. [Google Scholar] [CrossRef]
- Pushpavathi, N.; Sandhya, K.L.; Prasad, S.K. Effect of graphene flakes, titanium dioxide and zinc oxide nanoparticles on the birefringence, I–V characteristics and photoluminescence properties of liquid crystal. J. Mol. Liq. 2020, 302, 112571. [Google Scholar] [CrossRef]
- Pushpavathi, N.; Sandhya, K.L.; Pratibha, R. Photoluminescence and electrical conductivity measurement of liquid crystal doped with ZnO nanoparticles. Liq. Cryst. 2019, 46, 666–673. [Google Scholar] [CrossRef]
- Tough, R.J.A.; Bradshaw, M.J. The determination of the order parameters of nematic liquid crystals by mean field extrapolation. J. Phys. 1983, 44, 447–454. [Google Scholar] [CrossRef]
- Ozbek, H.; Ustunel, S.; Kutlu, E.; Cetinkaya, M.C. A simple method to determine high-accuracy refractive indices of liquid crystals and the temperature behavior of the related optical parameters via high-resolution birefringence data. J. Mol. Liq. 2014, 199, 275–286. [Google Scholar] [CrossRef]
- Li, J.; Wu, S.T.; Brugioni, S.; Meucci, R.; Faetti, S. Infrared refractive indices of liquid crystals. J. Appl. Phys. 2005, 97, 073501. [Google Scholar] [CrossRef]
- Selvaraj, P.; Subramani, K.; Srinivasan, B.; Hsu, C.J.; Huang, C.Y. Electro-optical effects of organic N-benzyl-2-methyl-4-nitroaniline dispersion in nematic liquid crystals. Sci. Rep. 2020, 10, 14273. [Google Scholar] [CrossRef]
- Kalakonda, P.; Basu, R.; Nemitz, I.R.; Rosenblatt, C.; Iannacchione, G.S. Studies of nanocomposites of carbon nanotubes and a negative dielectric anisotropy liquid crystal. J. Chem. Phys. 2014, 140, 104908. [Google Scholar] [CrossRef] [PubMed] [Green Version]
- Basu, R.; Kinnamon, D.; Garvey, A. Nano-electromechanical rotation of graphene and giant enhancement in dielectric anisotropy in a liquid crystal. Appl. Phys. Lett. 2015, 106, 201909. [Google Scholar] [CrossRef] [Green Version]
- Duran, H.; Gazdecki, B.; Yamashita, A.; Kyu, T. Effect of carbon nanotubes on phase transitions of nematic liquid crystals. Liq. Cryst. 2005, 32, 815–821. [Google Scholar] [CrossRef]
- Reznikov, Y.; Buchnev, O.; Tereshchenko, O.; Reshetnyak, V.; Glushchenko, A.; West, J. Ferroelectric nematic suspension. Appl. Phys. Lett. 2003, 82, 1917–1919. [Google Scholar] [CrossRef]
- Mrukiewicz, M.; Kowiorski, K.; Perkowski, P.; Mazur, R.; Djas, M. Threshold voltage decrease in a thermotropic nematic liquid crystal doped with graphene oxide flakes. Beilstein J. Nanotechnol. 2019, 10, 71–78. [Google Scholar] [CrossRef] [PubMed]


| MWCNTs wt% /Parameters | 0 wt% | 0.001 wt% | 0.005 wt% | 0.010 wt% | 0.050 wt% |
|---|---|---|---|---|---|
| W (10 J/m) | 1.20 | 1.32 | 1.46 | 1.57 | 1.72 |
| Pretilt in HA cell (degree) | 2.55 | 2.42 | 2.36 | 2.16 | 2.00 |
| Pretilt in VA cell (degree) | 88.40 | 88.52 | 88.66 | 88.76 | 88.96 |
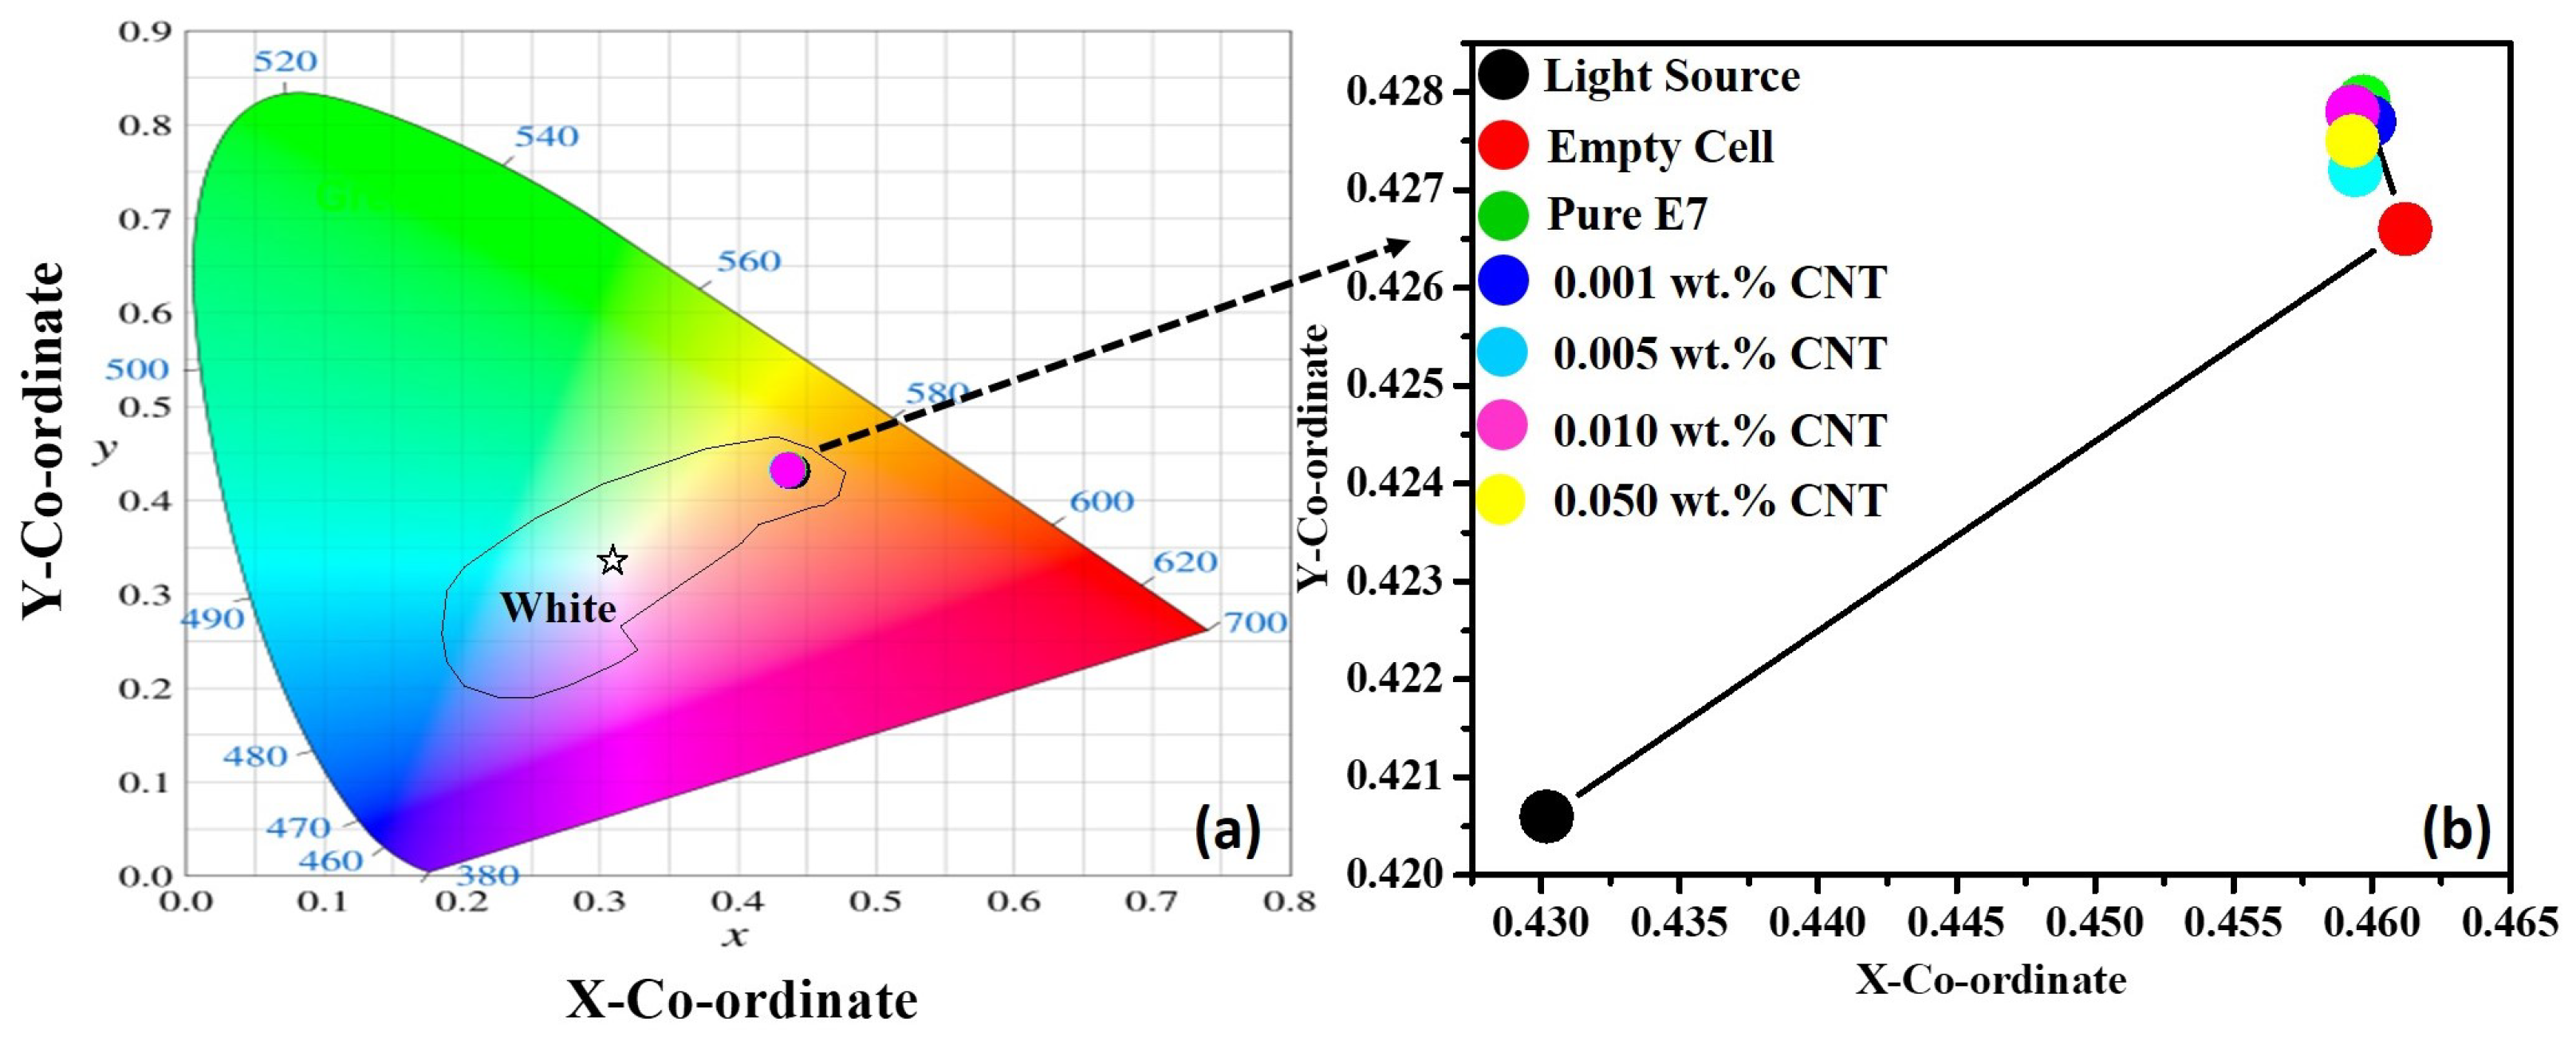
| MWCNTs wt% | x | y |
|---|---|---|
| Light source | 0.4302 | 0.4206 |
| Empty Cell | 0.4612 | 0.4266 |
| Pure E7 | 0.4597 | 0.4279 |
| 0.001 wt% | 0.4599 | 0.4277 |
| 0.005 wt% | 0.4594 | 0.4272 |
| 0.010 wt% | 0.4593 | 0.4278 |
| 0.050 wt% | 0.4593 | 0.4275 |
| MWCNTs wt% | V (in V) | V (in V) | CR |
|---|---|---|---|
| Pure E7 | 0.96 | 2.01 | 27.25 |
| 0.001 wt% | 0.96 | 2.01 | 25.88 |
| 0.005 wt% | 0.96 | 2.00 | 24.68 |
| 0.010 wt% | 0.96 | 2.00 | 23.83 |
| 0.050 wt% | 0.96 | 2.00 | 22.75 |
| MWCNTs wt% | A | B | C | n (×10 m) | D ( m/s) | (×10 S/m) | (×10 m/V·s) |
|---|---|---|---|---|---|---|---|
| Pure E7 | 1962.41 | 5.53 | 1803.37 | 1.28 | 1.01 | 7.98 | 3.89 |
| 0.001 wt% | 2002.23 | 5.45 | 1768.59 | 1.16 | 1.09 | 7.83 | 4.21 |
| 0.005 wt% | 3653.13 | 5.51 | 2393.83 | 0.866 | 1.98 | 10.6 | 7.64 |
| 0.010 wt% | 4514.48 | 5.18 | 2747.96 | 0.858 | 2.29 | 12.2 | 8.86 |
| 0.050 wt% | 5301.61 | 5.04 | 3040.79 | 0.843 | 2.58 | 13.5 | 9.97 |
| MWCNTs wt% | n | T (in °C) | S |
|---|---|---|---|
| Pure E7 | 0.216 | 60.50 | 0.583 |
| 0.001 wt% | 0.219 | 61.50 | 0.592 |
| 0.005 wt% | 0.226 | 63.00 | 0.611 |
| 0.010 wt% | 0.232 | 65.00 | 0.627 |
| 0.050 wt% | 0.248 | 66.50 | 0.670 |
Publisher’s Note: MDPI stays neutral with regard to jurisdictional claims in published maps and institutional affiliations. |
© 2021 by the authors. Licensee MDPI, Basel, Switzerland. This article is an open access article distributed under the terms and conditions of the Creative Commons Attribution (CC BY) license (https://creativecommons.org/licenses/by/4.0/).
Share and Cite
Singh, B.P.; Sikarwar, S.; Pandey, K.K.; Manohar, R.; Depriester, M.; Singh, D.P. Carbon Nanotubes Blended Nematic Liquid Crystal for Display and Electro-Optical Applications. Electron. Mater. 2021, 2, 466-481. https://doi.org/10.3390/electronicmat2040032
Singh BP, Sikarwar S, Pandey KK, Manohar R, Depriester M, Singh DP. Carbon Nanotubes Blended Nematic Liquid Crystal for Display and Electro-Optical Applications. Electronic Materials. 2021; 2(4):466-481. https://doi.org/10.3390/electronicmat2040032
Chicago/Turabian StyleSingh, Bhupendra Pratap, Samiksha Sikarwar, Kamal Kumar Pandey, Rajiv Manohar, Michael Depriester, and Dharmendra Pratap Singh. 2021. "Carbon Nanotubes Blended Nematic Liquid Crystal for Display and Electro-Optical Applications" Electronic Materials 2, no. 4: 466-481. https://doi.org/10.3390/electronicmat2040032
APA StyleSingh, B. P., Sikarwar, S., Pandey, K. K., Manohar, R., Depriester, M., & Singh, D. P. (2021). Carbon Nanotubes Blended Nematic Liquid Crystal for Display and Electro-Optical Applications. Electronic Materials, 2(4), 466-481. https://doi.org/10.3390/electronicmat2040032