Article

Aerodynamic Lift Modeling and Analysis of a Bat-like Flexible Flapping-Wing Robot

1
School of Mechanical Engineering, Zhejiang University, Hangzhou 310000, China
2
State Key Laboratory of Fluid Power and Mechatronic Systems, Hangzhou 310000, China
3
Zhejiang Key Laboratory of Atomic Level Manufacturing, Hangzhou 310000, China
*
Author to whom correspondence should be addressed.
Modelling 2025, 6(4), 117; https://doi.org/10.3390/modelling6040117
Submission received: 11 August 2025 / Revised: 18 September 2025 / Accepted: 22 September 2025 / Published: 1 October 2025

Abstract

In the research and development system of bat-like flapping-wing flying robots, lift modeling and numerical analysis are the key theoretical basis, which will directly affect the construction of the body structure and flight control system. However, due to the complex three-dimensional flapping motion mechanism of bats and the flexible deformation characteristics of their wing membranes, the existing lift theory lacks a mature calculation method suitable for bionic flapping-wing flying robots. In this paper, the wing membrane deformation mechanism of a bat-like flapping-wing flying robot is studied, and the coupling effect of wing membrane motion and deformation on flight parameters is analyzed. A set of calculation methods for flexible morphing wing membrane lift is improved by using a quasi-steady model and the blade element method. By comparing and analyzing the theoretical calculation and experimental results under various working conditions, the error is less than 4%, which proves the effectiveness of this method.

1. Introduction

With regard to flapping-wing flight, there were attempts to cut bamboo for magpies in the Spring and Autumn period in China. Following sketches of flapping-wing aircraft in the Renaissance period, various research institutions at home and abroad began to develop stable and reliable flapping-wing aircraft. Since the 1990s, aerodynamic theory, new material technology and micro-electromechanical technology have developed rapidly, providing a large number of basic conditions for micro air vehicles (MAVs), and MAVs have entered a trend of development [1].
According to the aerodynamic configuration and lift generation mechanism, the flying robot can be divided into four types of systems: fixed wing, rotor wing, composite wing and flapping wing. All kinds of systems show significant differences in aerodynamic characteristics and task applicability [2]: The fixed-wing system relies on the continuous angle of attack of the wing to generate steady-state lift, which has the characteristics of high cruise speed, endurance and large payload. However, its high aspect ratio design results in a turning radius generally exceeding 10 m, which limits mobility in complex urban environments. The rotor–wing system generates dynamic lift through the high-speed rotating wing surface and has the characteristics of omnidirectional maneuvering, hovering positioning and compact structure. However, due to induced drag and tip loss, its energy efficiency restricts its application in long-endurance missions. The composite-wing system adopts a variable configuration design, which integrates the rotor mode and the fixed-wing mode. After increasing the motor model, the flight time of the robot is greatly reduced. When the mode is converted, the instantaneous power required surges. The energy density of the battery system is limited and cannot be efficiently supported. There is also a nonlinear fluctuation of the aerodynamic lift-to-drag ratio during the conversion process. Modal conversion generates additional consumption and payload reduction [3,4,5]. The flapping-wing system realizes multi-dimensional motion coupling control by imitating the unsteady aerodynamic mechanism of the biological aircraft. Flapping-wing flying robots are a new type of intelligent aircraft, which can realize complex functions such as hovering, vertical take-off, side flight and reverse flight. It has the advantages of low flight noise, good flexibility, high concealment and high flight efficiency. The bionic flapping-wing flying robot with multi-modal motion function can play an important role in military applications. The painting and loading tasks of the flapping-wing flying robot can enable it to play a role in various tasks and occasions, and it can complete the tasks of stealth reconnaissance and cruising. At the same time, there are also many application scenarios in civil use, such as animal husbandry patrol, farmland bird driving and animal protection observation [6].
Modeling and analysis of aerodynamic lift is a key point in the research of bat-like flapping-wing flying robots. There are many kinds of flying creatures in nature, which can be roughly divided into three categories: insects, birds and bats [7,8]. Among them, bats have different mechanisms from most fixed-shaped wings such as insects [9] and birds [10]. Insects and birds beat back and forth through fixed-shaped wings to generate lift and thrust. During the flapping of the wings, the flexible wing membrane connected between the leading edge and the trailing edge will change the area of the wing membrane through the movement of the joints [11,12]. The bat flight mechanism has higher efficiency, which has attracted the attention of many institutions. The main achievements are as follows: Bat Bot B2 developed by the University of Illinois [13], SMA memory alloy driven flapping-wing robot from Saar University [14], and the Soft Bat Robot of Harvard University [15].
At the same time, it also increases the difficulty of aerodynamic theory calculation, so few people have analyzed the aerodynamic theory. There are two main directions in the research of bat-like flapping-wing flying robots: one is to study the wing membrane [16], and the other is to study the flapping-wing movement [17,18,19], using new materials or constructing a flight control architecture based on deep reinforcement learning [20]. In the research field of the aerodynamic effect of deformable wing membranes, scholars at home and abroad have revealed their complex aerodynamic coupling characteristics through experimental methods. In view of the regulation mechanism of flexible wing membranes on flight attitude, some scholars use the wind tunnel test method to carry out empirical analysis. For example, Lixuepeng’s team revealed the vortex recombination phenomenon caused by dynamic deformation of flexible wing membranes during gliding through flow field visualization technology. Its aerodynamic effect can significantly improve the robustness and dynamic response speed of aircraft attitude adjustment [21]. However, the nonlinear deformation characteristics of flexible materials also bring about the trade-off problem of aerodynamic performance. In the airfoil wind tunnel test, N.I. Ismail found that although the flexibility of the wing membrane can increase the lift coefficient [22], the accompanying turbulent separation phenomenon will lead to an increase in the drag coefficient and affect the overall flight efficiency. Hedenstrom used PIV technology to analyze the vortex structure generated by the movement of bats and pointed out that the aerodynamic force of bats was related to geometric parameters and motion parameters such as flight speed, wing area and angle of attack, and the maximum lift–drag ratio of bat wings was about 6.9~7.5 [23]. The existing research on the deformation of flexible wing membranes is mostly experimental analysis, and there is a gap in the theoretical calculation method, which restricts the development of flapping-wing flying robots. The lack of theoretical models leads to the fact that the selection of wing membrane structure parameters of existing bionic aircraft depends on the empirical trial and error method, which seriously limits the further improvement of robots and the expansion of application scenarios.
Addressing these issues, this study investigates the aerodynamic coupling mechanism in the flexible wing membrane of a bat-inspired flapping-wing robot. It systematically analyzes the biomimetic wing’s morphological characteristics and kinematic parameters, while also detailing its configuration and motion law.
Then, considering that the bat wing has a special motion mode—that is, the unique stretching motion characteristics in the flapping period—and the passive torsion behavior of the flexible wing membrane around the leading edge axis driven by aerodynamic force, a calculation framework including chord length dynamic change, passive torsion angle distribution and local flow velocity related parameters is established. Based on the blade element theory, the applicable boundary of quasi-steady conditions is verified. The attached vortex model is used to analyze the coupling mechanism of translational lift and rotation effect. By incorporating unsteady virtual mass effects and inertial coupling dynamics, a comprehensive lift calculation model is developed. Wind tunnel testing validates this model, and error analysis comparing theoretical predictions with experimental results across various typical conditions confirms the method’s correctness and practicality.

2. The Structure and Movement of Wings

2.1. Definition of Coordinate System

In this paper, based on the analysis of the prototype structure characteristics of the winged chiroptera creatures, the bionic structure topology optimization design method is used to construct a flexible-wing system, so that it can realize the motion form of folding up and stretching down. The deformation of flexible wings includes active deformation and passive deformation. Duan et al. made a specific description of the deformation [24]. The prototype model of the bat-like flapping-wing flying robot is shown in Figure 1.
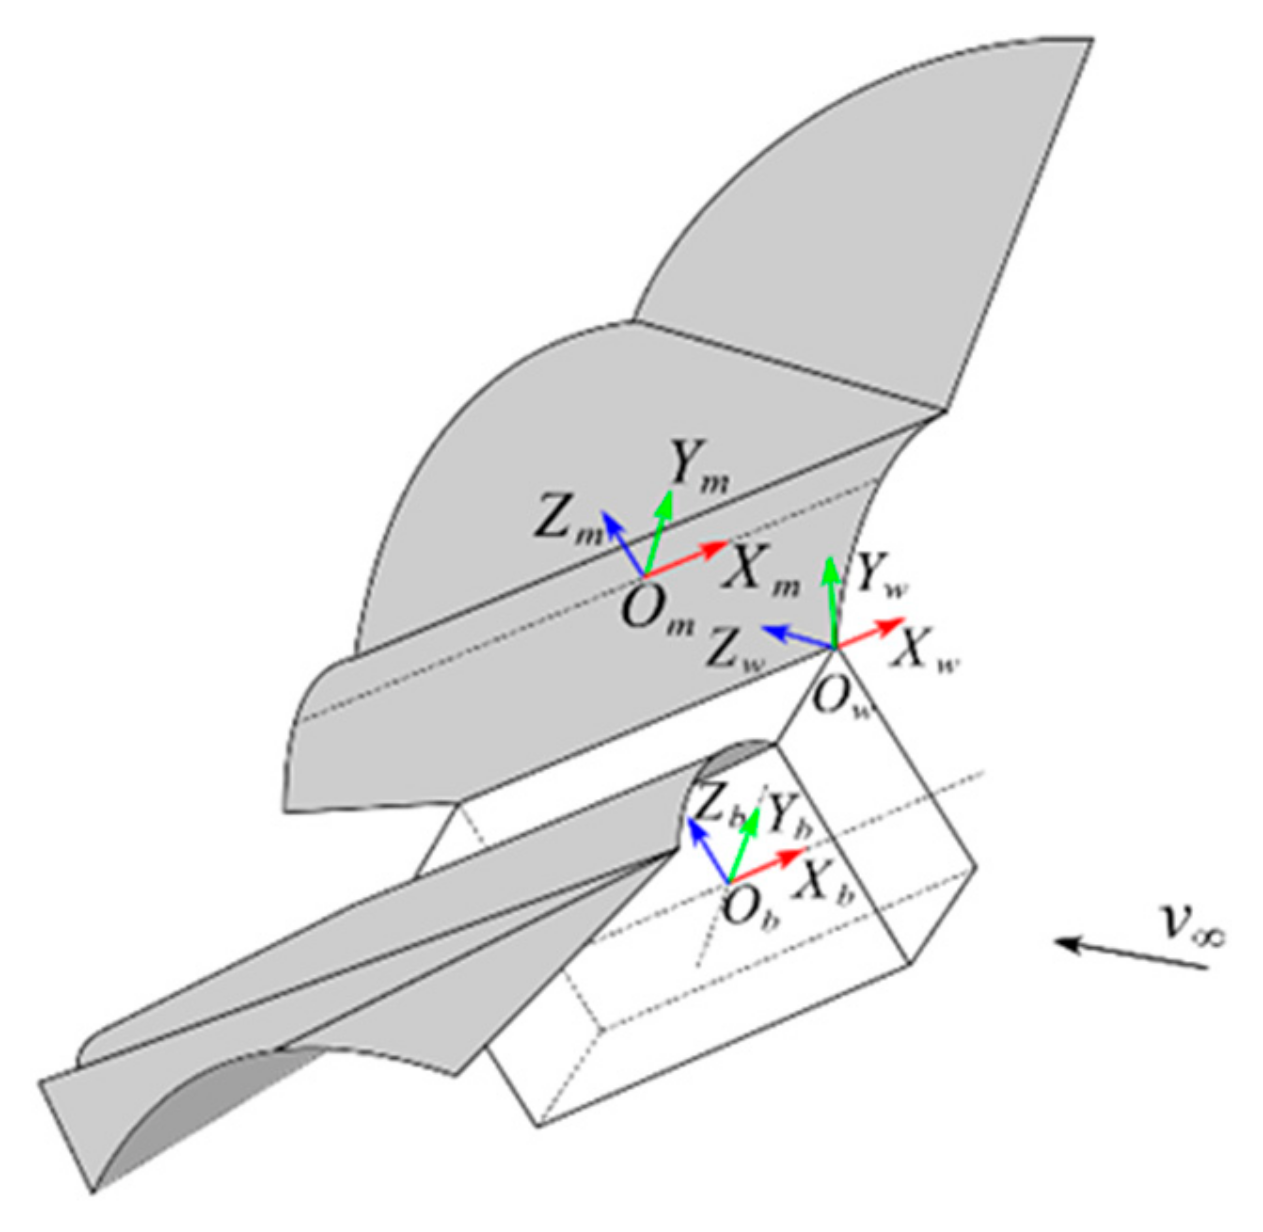
In order to facilitate the calculation of lift, Duan et al. established a flapping-wing flight robot coordinate system, as shown in Figure 2 [24].
The body coordinate system based on the center of mass is adopted. Taking the right wing as an example, the coordinate system Ow-XwYwZw of the flapping wing is fixed at the proximal joint of the leading edge of the wing, and the coordinate system Om-XmYmZm on the wing membrane is located on the wing membrane of the wing.
The flapping angle of the wing varies with time, as follows:
θ o t = A f s i n ( 2 π f t )
where θ o is the flapping angle, A f is the amplitude of the flapping angle and f is the flapping frequency.
In the active morphing motion of wing folding and unfolding, the structure diagram of Watt six-bar linkage is shown in Figure 3. The dynamic characteristics of the wing skeleton are quantitatively characterized by five key points (P1~P5) and the motion driving point (P7). Point P0 is fixed at the origin Ow of the wing-flapping coordinate system Ow-XwYwZw. The variable y P 2 denotes wing morphing displacement. Red and green arrows in the figure indicate the kinematic directions of the wing skeleton. Red represents the extension of wings, and green represents the contraction of wings.

2.2. Calculation of Chord Length and Passive Torsion Angle of the Flexible Wing Membrane Based on the Blade Element Method

The chord length and relative velocity are the key parameters of lift calculation. Affected by the flapping and folding motion of the wing, the wing membrane exhibits dynamic deformation characteristics, resulting in different chord lengths and relative velocities at each position at each moment. In order to accurately capture such unsteady aerodynamic characteristics, it is usually necessary to divide the wing membrane into strips based on the blade element method [25]. The wing membrane is discretized into several aerodynamic strips, and the instantaneous aerodynamic load is derived by solving the local chord length and relative motion speed of each strip in real time. In the conceptual diagram in Figure 4, the left side of the flapping axis presents static morphological features, and the right side shows the discretization processing scheme.
The wing membrane is subjected to its own elastic properties and aerodynamic forces during the flapping process to produce three-dimensional deformation, and its deformation mechanism can be explained by Figure 5. The deformation is caused by two kinds of mechanical factors. The first kind is due to the periodic swing of the wing skeleton around the flapping axis, which forms a geometric difference with the tail. On the horizontal plane, because the wing membrane is connected to the skeleton and tail, there is a height difference between the front and rear edges of the wing membrane. The second factor is due to the deformation of the elastic wing caused by aerodynamic force. The three-dimensional change in the wing membrane can be decomposed into the superposition effect of the skeleton-driven deformation and the elastic deformation caused by the aerodynamic force. Figure 5a shows the three-dimensional model of the downward process of the wing membrane, focusing on the dynamic deformation characteristics of the wing membrane and its projection on the initial plane (dotted line marks the projection contour). The simplified model of Figure 5b further illustrates the deformation of the wing membrane during the deformation process, including the deformation morphology and the projection on the initial plane. Figure 5c,d are the schematic diagrams after decomposing and analyzing the deformation of the wing membrane in Figure 5b. After dividing along the surface P1P2P3P4P5P6P10, Figure 5c represents the elastic deformation of the wing membrane caused by aerodynamic force. Figure 5d represents the height difference formed by the torsional deformation of the leading edge and the trailing edge of the wing membrane during the flapping process.
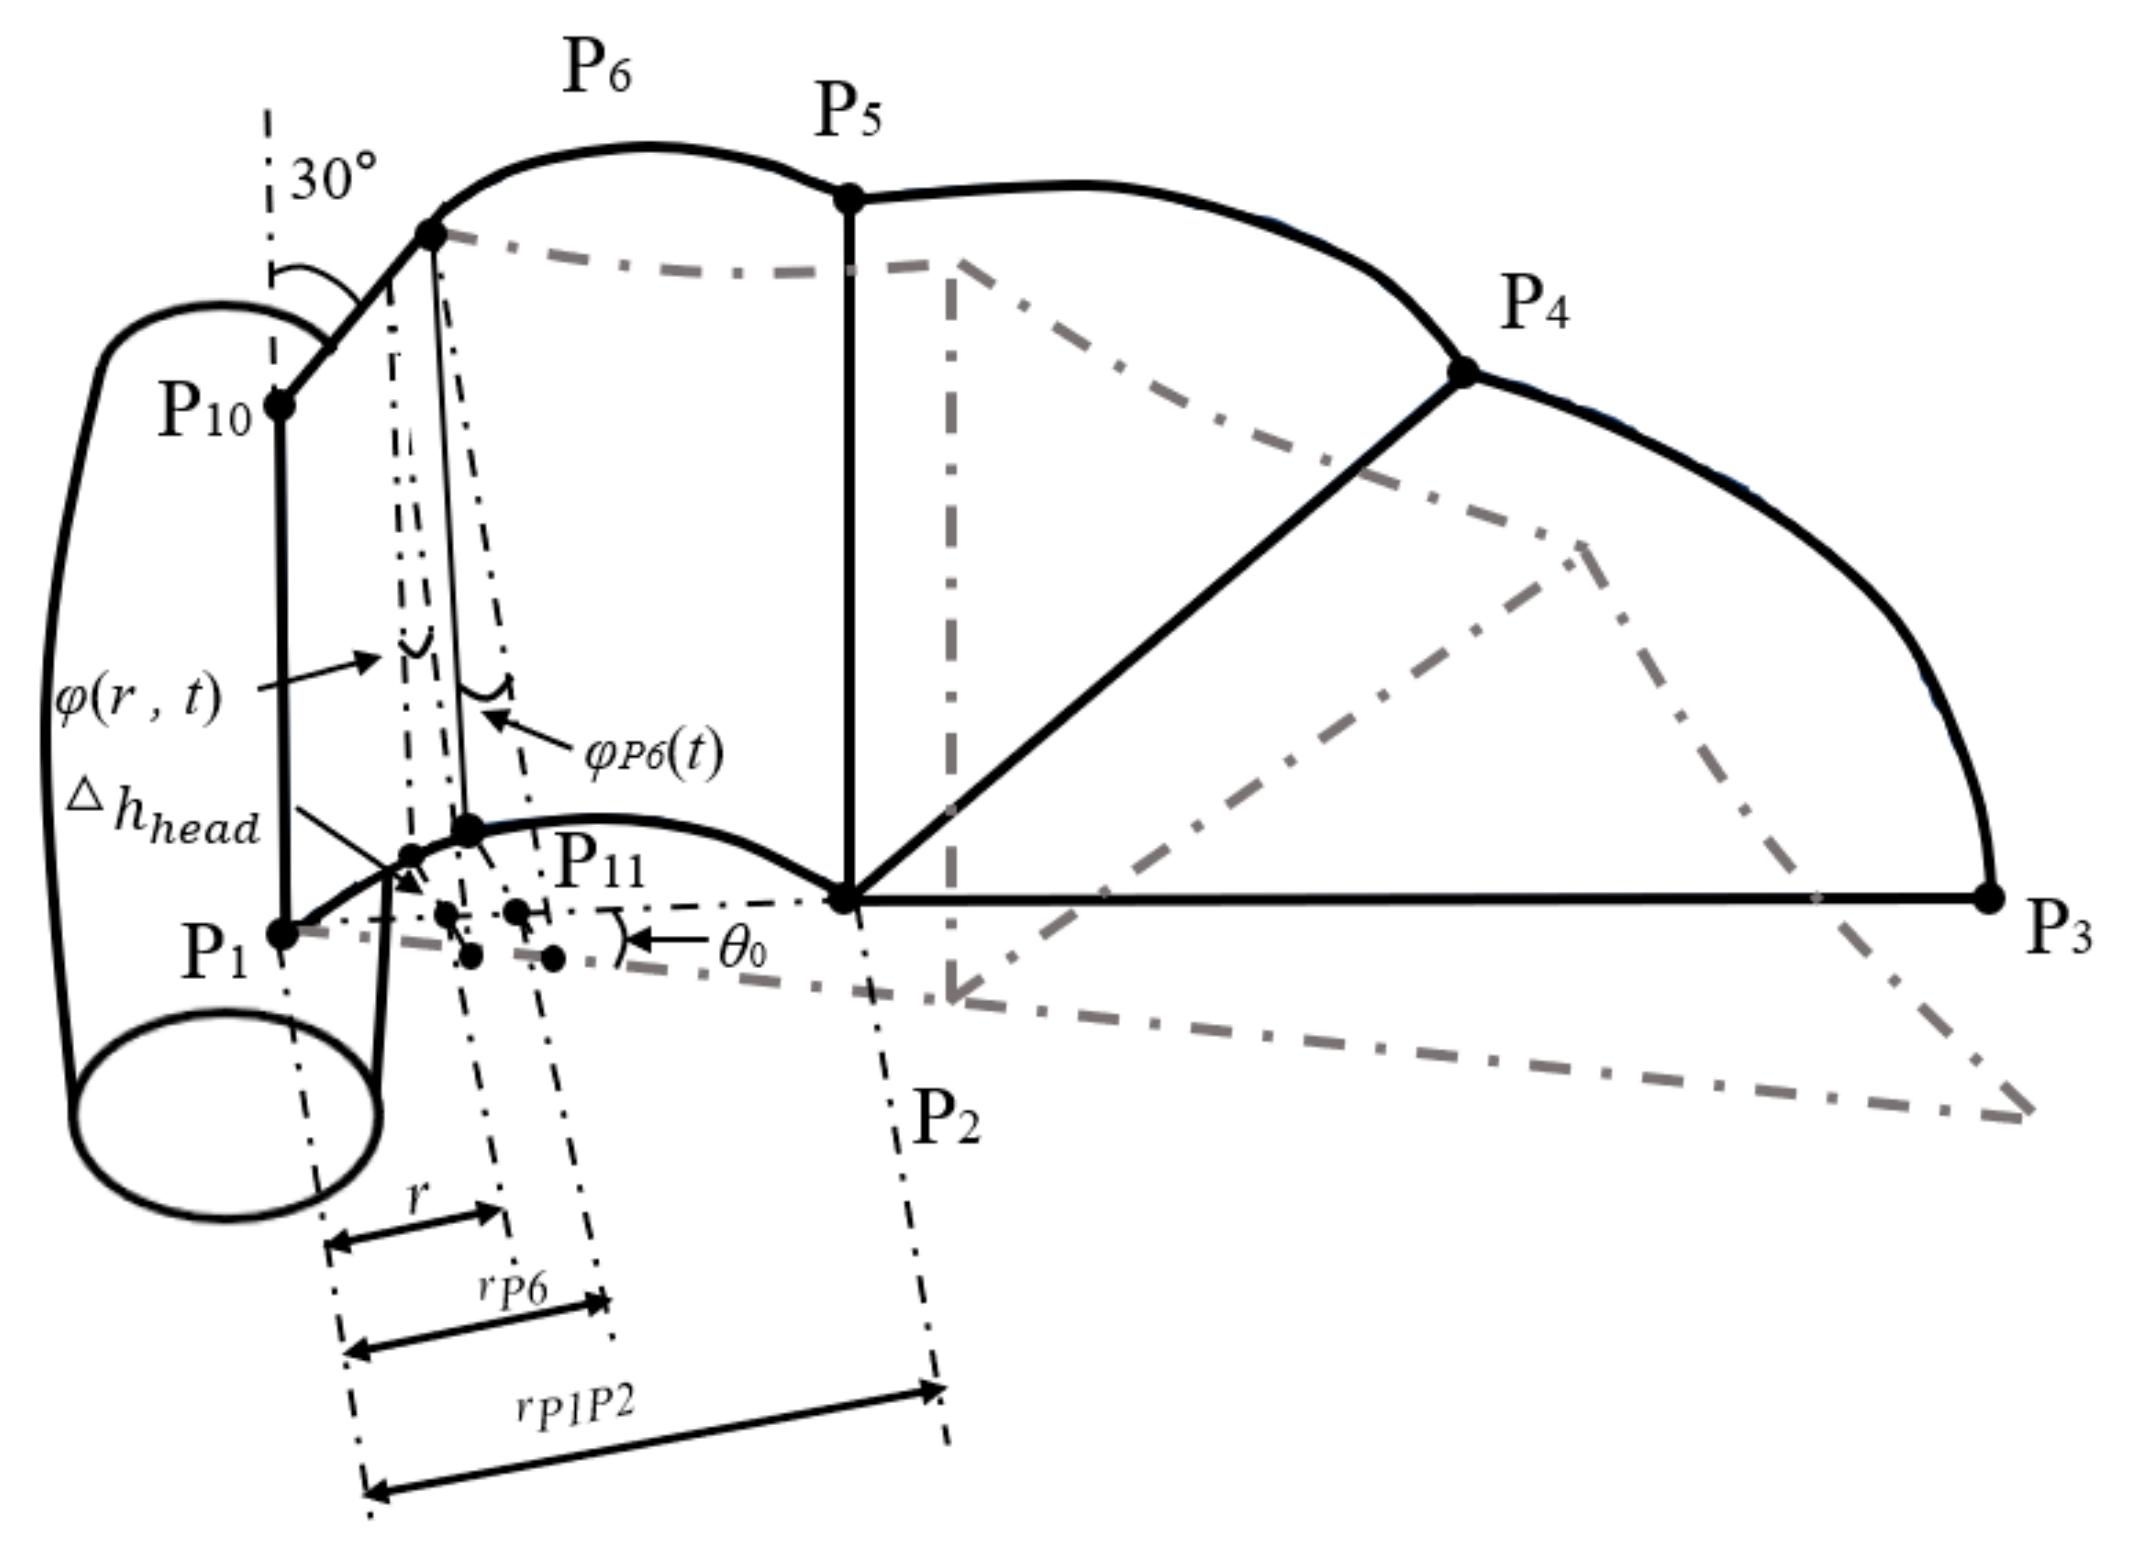
In Figure 5, the passive torsion angle φ r , t is defined as the tilt angle of the wing film strip relative to the initial plane at time t from the flapping axis P1P10. This physically represents the angular relationship between a strip’s chord and the flapping axis after torsion about the leading edge axis. Here, h P r 1 denotes leading-edge membrane height from flapping, while   h P r 2   is its trailing-edge counterpart. Deformation-induced height differences are defined as h h e a d (leading edge) and h b a c k (trailing edge). These parameters—including φ r , t , h P r 1 , h P r 2 , h h e a d , h b a c k , etc.—are specified in the wing coordinate system (Om-XmYmZm), precisely quantifying wing geometric deformation within its local frame.
The special structure of bat wing hands is different from that of birds. The deformation of the lateral wing membrane, the middle part of the wing membrane and the hand wing membrane fixed to the fuselage is different. Therefore, it needs to be divided into three parts for research [26].
The structural system can be divided into three functional areas: The first area (P1-P10-P6-P11) is the fixed connection between the wing membrane and the torso. The P1-P10 section is rigidly fixed with the main structure, and the P10-P6 section extends to the tail wing to maintain stability, as shown in Figure 6. The deformation analysis of this area only needs to be carried out for the leading edge part. The mechanical properties of the intermediate transition region (P11-P6-P5-P2) have complex characteristics, and the synergistic deformation of the front and rear edges should be considered at the same time. The third region (P2-P5-P4-P3) is the joint of the wing membrane and the wing limb. The leading edge has good rigidity, and the research on the deformation mechanism focuses on the torsional displacement of the trailing edge relative to the leading edge.
As shown in Figure 6, the geometric parameter system includes key variables defining wing deformation within the region r < r P 6 , where r denotes the radial distance from the flapping axis P1P10 to the blade-element strip. φ r , t   represents the passive torsional deflection at distance r from the flapping axis P1P10 at time t . Within the dynamic response system, r P 6   denotes the radial distance between the strip P6P11 and the flapping axis. The peak parameter in the first term of the expression   φ P 6 r , t corresponds to the maximum absolute torsional value in this segment. The system parameter θ o is the overall flapping angular displacement of the wing membrane, and h h e a d quantifies the radial height change in the leading edge of the wing membrane caused by the flexible deformation, which is manifested as the deformation height of the leading edge of the strip at the distance from the flapping axis r .
Based on the instantaneous fixed-support beam structure, the leading edge P1P2 component is assumed to be an elastic beam structure with instantaneous fixed ends (a beam with significant elastic deformation characteristics). In this mechanical model, the dynamic aerodynamic load is equivalent to a uniform force. Through mechanical analysis, the bending deformation of the beam under uniform force can be obtained. The expression of the height due to elastic deformation is as follows:
h l e a d = q 2 1 12 r 4 r P 1 P 2 6 r 3 + q r P 1 P 2 3 24 r E I l e a d
where E I l e a d   denotes the leading edge’s bending rigidity, q is the uniform aerodynamic load and the distance between points P1 and P2 is r P 1 P 2 .
Figure 5’s geometry yields expressions for chord length and passive torsion angle.
c r , t = 2 r · sin θ o 2 s i g n θ o d θ o d t h l e a d 2 + P 1 P 10 + r tan 30 ° 2
φ r , t = ± a r c t a n 2 r · sin θ o 2 s i g n θ o d θ o d t h l e a d P 1 P 10 + r tan 30 °
Next, the second part is r P 6 r r P 1 P 2 , and Figure 5c,d can represent the structure.
Similar to the leading edge, the trailing edge P5P6 is also assumed to be an elastic beam structure with instantaneous fixed ends. The height of the leading and trailing edges due to elastic deformation can be obtained as follows:
h l e a d = q 2 1 12 r 4 r P 1 P 2 6 r 3 + q r P 1 P 2 3 24 r E I l e a d
h b a c k = q 2 1 12 r r P 6 4 r P 5 P 6 6 r r P 6 3 + q r P 5 P 6 3 24 r r P 6 E I b a c k
where E I b a c k denotes the leading edge’s bending rigidity, r P 5 P 6 is the distance between P5 and P6, and r P 6 is the distance between P6 and the flapping axis.
The chord length and passive torsion angle expressions are as follows:
r , t = a t a n r P r 2 r P 6 r P 1 P 2 r P 6 h P 2 s i g n θ o d θ o d t h b a c k P 2 P 5 + r P 1 P 2 r P r 1 r P 1 P 2 r P 6 r P 6 · tan 30 ° + P 1 P 10 P 2 P 5           2 r P r 1 · sin θ o 2 s i g n θ o d θ o d t h l e a d P 2 P 5 + r P 1 P 2 r P r 1 r P 1 P 2 r P 6 r P 6 · tan 30 ° + P 1 P 10 P 2 P 5
c r , t = r P r 2 r P 6 r P 1 P 2 r P 6 h P 2 s i g n θ o d θ o d t h b a c k           2 r P r 1 · sin θ o 2 s i g n θ o d θ o d t h l e a d 2                                 + P 2 P 5 + r P 1 P 2 r P r 1 r P 1 P 2 r P 6 r P 6 · tan 30 ° + P 1 P 10 P 2 P 5 2
In the third part of the r r P 1 P 2 interval, the kinematic model needs special consideration. This part is securely connected with the wing hand, and the actual variable shows low strain characteristics. In the modeling process, by removing the constraints at the P2P4 connection and retaining the torsional degree of freedom of the trailing edge relative to the leading edge, the calculation dimension can be effectively simplified.
The deformation height of the trailing edge of the wing hand is as follows:
h h a n d = q 2 · 1 12 r r P 1 P 2 · r P 2 P 3 2 + r P 2 P 5 2 r P 2 P 3 4 E I h a n d                               q 2 · 1 6 r P 2 P 3 2 + r P 2 P 5 2 r r P 1 P 2 · r P 2 P 3 2 + r P 2 P 5 2 r P 2 P 3 3 E I h a n d                               + q 24 · r r P 1 P 2 · r P 2 P 3 2 + r P 2 P 5 2 r P 2 P 3 · r P 2 P 3 2 + r P 2 P 5 2 3 E I h a n d
The third segment’s chord length and passive torsion angle are derived:
c r , t = P 2 P 5 · 1 r r P 1 P 2 r m a x r P 1 P 2 I 2 + h h a n d 2
Here, I represents the dimensionless wingtip shape index. I is used to represent the wingtip shape index, and its physical meaning is to characterize the shape of the wingtip. Since the relative angles and positions of the fingers remain constant, I is a constant. The shape index of wingtip I does not depend on parameters such as aspect ratio and wing membrane area. It is only determined by the relative size of the fingers and the arm, as well as the relative size of the hand film and the arm film.
φ r , t = a t a n h h a n d P 2 P 5 · 1 r r P 1 P 2 r P 2 P 3 I
Using initial parameters, we compute chord length and passive torsion angle. Their periodic variations are shown in Figure 7.
In Figure 7a, the transverse coordinate corresponds to wing membrane span length. However, dynamic membrane deformation during motion causes time-dependent variation in the absolute spanwise dimension. In this paper, the span direction is divided into 1000 strips by the blade element method, and the span length is replaced by strip algebra.
The brown region in Figure 7 shows real-time chord length variation along the span during one period. For clarity, we illustrate instantaneous chord length and passive torsion angle using the red curve at an arbitrary timepoint. The four points on the red curve correspond to chords P1P10, P6P11 and P2P5 and wingtip P3 in Figure 6. The three curve segments between these points represent chord lengths in the wing membrane regions defined in Figure 6. Cross-referencing Figure 6 and Figure 7 clarifies this relationship.

2.3. Calculation of Relative Velocity and Relative Angle of Attack of Flexible Wing Membranes Based on the Blade Element Method

On the basis of the flexible deformation chord length calculation formula proposed in Section 2.2, this section analyzes the relative velocity of each strip at this point. The relative velocity consists of the passive torsion velocity, the flapping velocity and the free flow velocity. In the process of analysis, the mathematical expression of the speed of each part is derived first, and then the combined speed is solved; that is, the required relative speed is obtained.
The passive torsional velocity v n t r , t is
v n t r , t = 1 4 c r , t φ r , t t
The flapping linear velocity v f r , t   at radial distance r from the flapping axis is
v f r , t = r d d t θ o t = π f A f r · cos 2 π f t
Then, the corresponding airflow velocity v p f r , t is
v p f r , t = v f r , t = π f A f r · cos 2 π f t
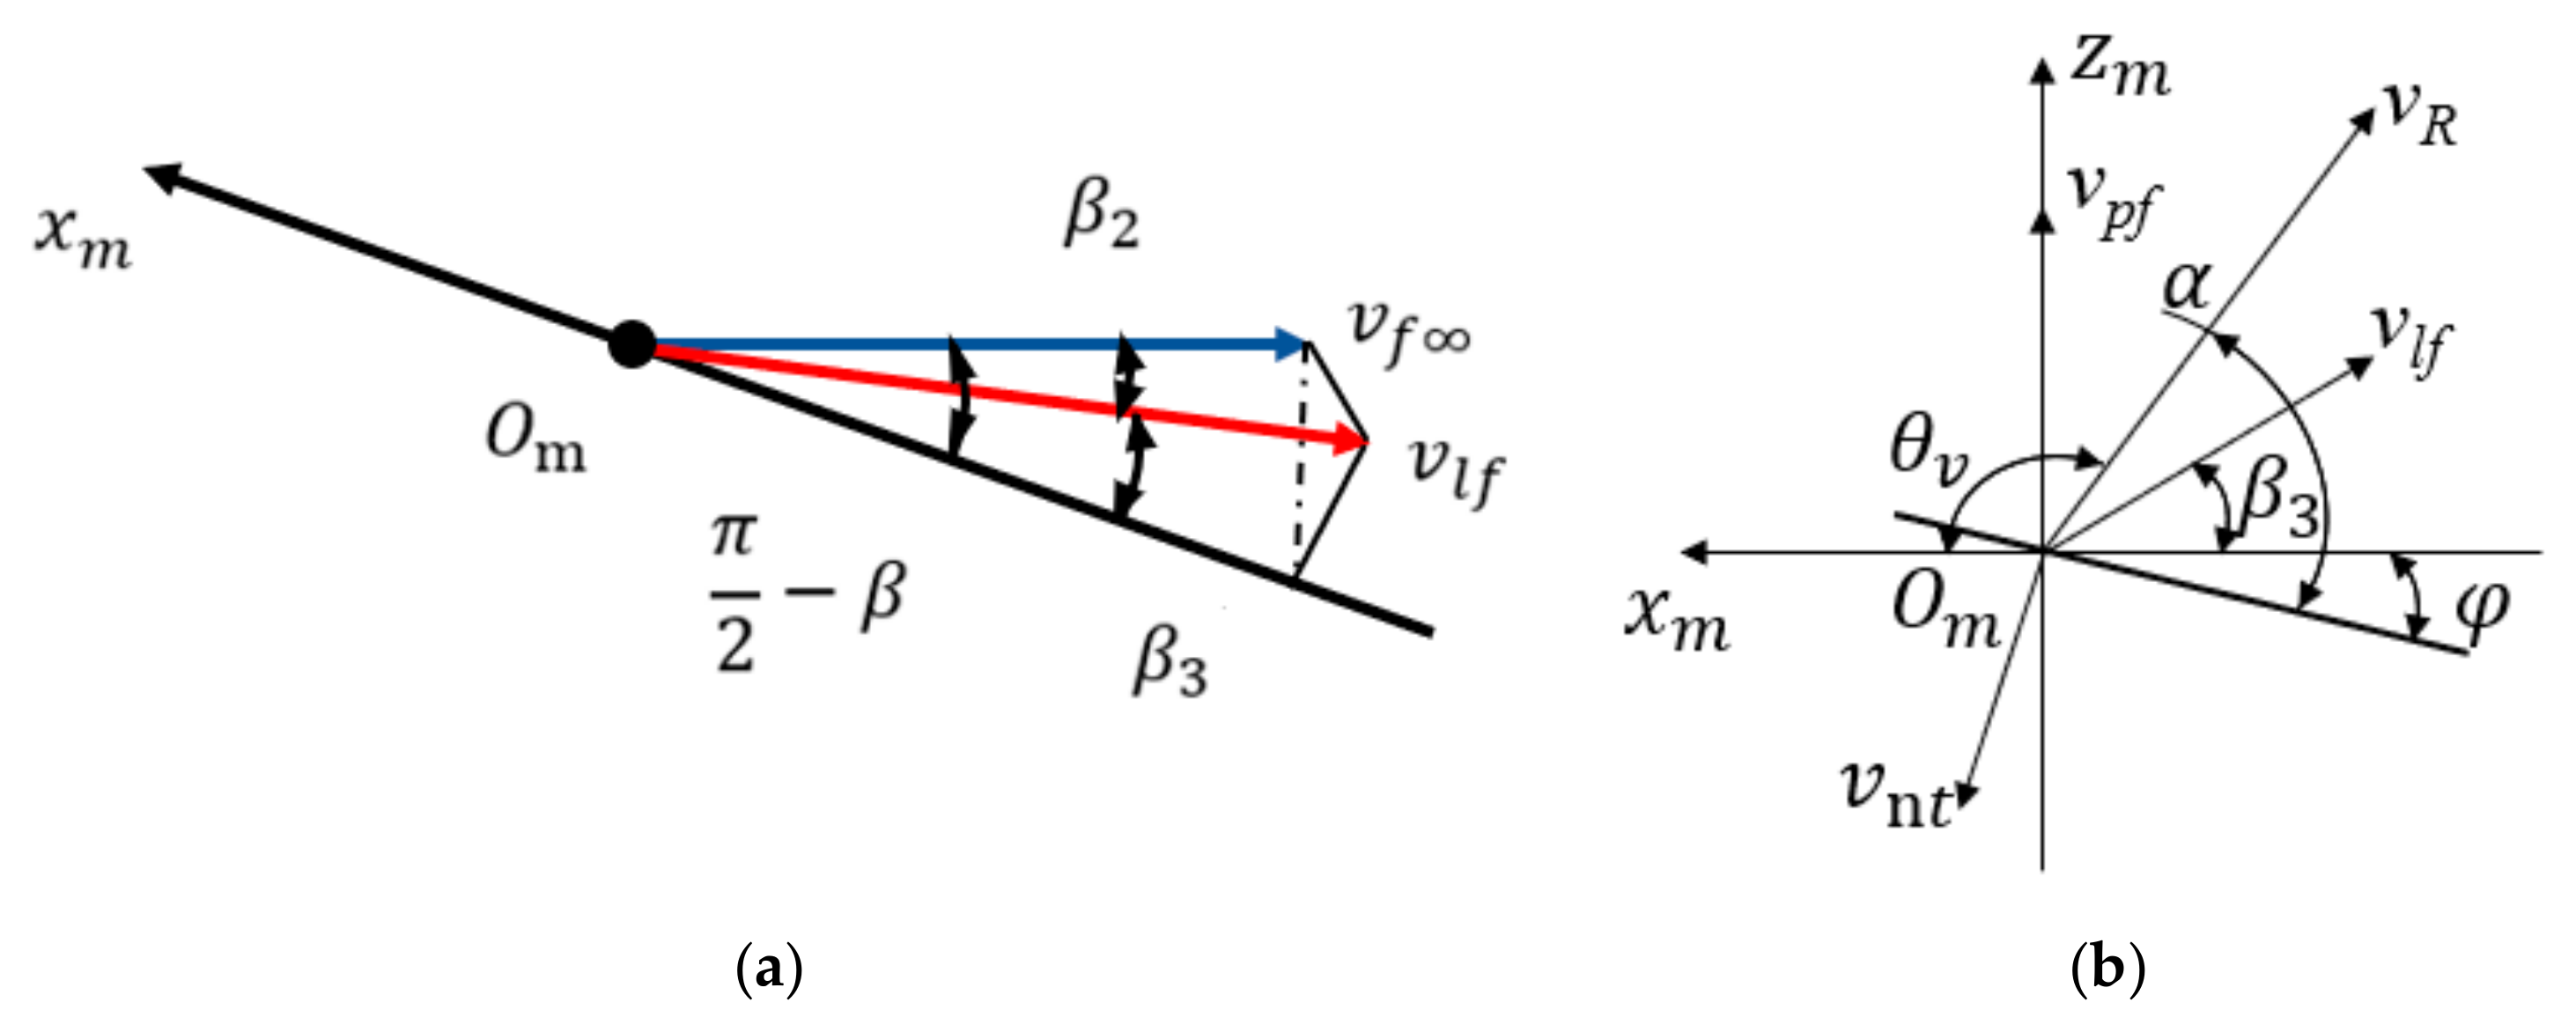
Figure 8a depicts the projection velocity v l f t of freestream velocity onto the XmOmZm plane.
v l f t = v f · 1 sin 2 θ o cos 2 β
where v f = freestream velocity;
β 2 = angle between freestream velocity and XmOmZm plane;
θ o = flapping angle;
β = dihedral angle (between flapping plane and horizontal plane;
β 3 = angle between   v l f t   and OmXm axis.
Figure 8b shows the resultant velocity from combining the three components in the XmOmZm plane.
The relative resultant velocity v R r , t has components   v R x r , t   and v   R z r , t   along the Xm and Zm axes, obtained by summing projections of all velocity vectors onto each axis.
Therefore, the component of the relative resultant velocity is as follows:
v R x r , t = v l f s i n β c o s β 2 + v n t sin φ v R z r , t = v p f + v l f 1 s i n β c o s β 2 2 v n t cos φ v R r , t = v R x 2 + v R z 2

3. Building on the Extended Quasi-Steady-State Lift Model

3.1. Lift Model of Libration Circulation from Freestream

Wing translation circulation comprises two components: circulation induced by freestream interaction and circulation from flow field alterations due to wing flapping. In the wing membrane coordinate system, quasi-steady lift can be obtained by vector synthesis of orthogonal lift and drag. Due to the lack of friction, the resistance can be ignored, and the tangential component of the translational lift can be ignored because of its small contribution. In view of the lift mechanism of this translational circulation, the two-dimensional quasi-steady lift and drag coefficients of the local strip flow field can be calculated according to the empirical formula summarized by Dickinson [27]:
C L = 0.225 + 1.58 sin π 180 2.13 α t r a n s f r e e 180 π 7.20
The empirical formula involved in the study is derived from the empirical research basis of insect experiments. In view of the significant scale difference between the bat biological model and the original research object, the formula cannot be directly applied to the numerical calculation scenario. In order to construct a mathematical model suitable for bat flight mechanics analysis, the original formula must be calibrated and optimized according to the bat-related experimental data set, so that the iterative formula after parameter correction can be used to estimate the lift coefficient during bat movement.
The above formulas were modified by using the data of bat lift coefficient and angle of attack, thrust coefficient and angle of attack obtained by Colorado [20]. The revised formula is as follows:
C L = 8.487 9.588 sin 4.304 + 0.0233 α
After the differentiation of the bands by the blade element method, the lift force on each strip is
d L t r a n s f r e e = 1 2 ρ v f 2 + v 2 C L c d r
The pressure on the vertical surface is
d N t r a n s f r e e = d L t r a n s f r e e = 1 2 ρ v f 2 + v 2 C L c d r

3.2. Lift Model Derived from the Translational Circulation of the Beat Around the Beat Axis

Although the wing shows periodic oscillating motion around the flapping axis, the two-dimensional aerodynamic model of each strip still belongs to the category of translational motion. In view of the fact that the angle of attack caused by the motion around the axis is in a dynamic state and the numerical value is uncertain, the traditional thin wing theory is no longer applicable to the mechanical analysis of this model. For the calculation of lift, it is necessary to realize the numerical solution of aerodynamic parameters through the newly established mathematical relationship. The analytical expression of the lift component corresponding to each strip can be obtained by derivation:
d L t r a n s f l a p = 1 2 ρ v f 2 C L c d r
The normal lift force on the chord length is as follows:
d N t r a n s f l a p = d L t r a n s f l a p

3.3. Lift Model of Rotational Circulation Derived from Flexible Deformation

The wing membrane material has flexible characteristics, and it will produce passive torsional deformation under the action of aerodynamic force during periodic flapping, resulting in the formation of additional angular velocity components in the leading edge direction. The established lift model fails to capture circulation effects from torsional dynamics. This omission becomes significant for large-area, soft-material membranes where rotational circulation cannot be neglected [28]. Then, the relevant lift component of the normal rotational circulation of any strip can be expressed as follows:
d F r o t = 1 2 ρ · π f A f cos 2 π f t · d d t φ · 0.75 π r c 2 d r
where φ is the passive torsion angle.

3.4. Added-Mass Force Model

While the current model uses attached vortex theory to characterize circulation lift, non-circulatory mechanisms significantly contribute to total lift—especially for large-span wings. This necessitates incorporating non-circulatory factors into the lift formulation.
In the study of lifting mechanics, the non-circulation effect is usually reflected in the additional inertial force generated by the added-mass effect. Based on the method system mentioned by Wood [29], the added-mass force on the wing membrane plane is derived and calculated.
According to the blade element method, the wing membrane is discretized into several strips along the span direction. For the two-dimensional strip with a thickness of nearly 0, the normal virtual mass force component it bears can be expressed as follows:
d F a d d , N = m a d d , m i d , N α N m a d d , φ , N φ ¨
where m a d d , m i d , N represents the normal virtual mass coefficient at the midpoint of the strip, α N represents the linear acceleration of the strip pitching around the leading edge axis and m a d d , φ , N represents the normal virtual mass coefficient for the pitch axis due to the pitch angular acceleration.
For any infinitely thin two-dimensional span strip in the plane, the coefficients are
α N = r θ ¨ + φ ˙ ϕ ˙ = r θ ¨
m a d d , m i d , N = 1 4 π ρ c 2
m a d d , φ , N = 1 4 π ρ c 2 c d i s
where c d i s   denotes the distance between the pitch axis and the strip’s chordwise midpoint.
Substituting each coefficient into the calculation formula of added-mass force, we can obtain
d F a d d , N = 1 4 π ρ c 2 θ ¨ r 2 d r 1 4 π ρ c 2 c d i s φ ¨ r d r

3.5. Inertia Force Model

Experimental studies confirm significant inertial effects in flapping-wing aerodynamics [30]; during wing pitch reversal, inertial loads approach added-mass force magnitudes, necessitating their mathematical representation in dynamic models.
Due to kinematic coupling between the wing membrane and skeletal structure, inertial forces on discretized strips require computation via the blade element method to account for complex geometry.
The inertial force of each strip is
d F i n e r t , x = d m s t r i p · v R x ˙ r , t
d F i n e r t , z = d m s t r i p · v R z ˙ r , t
and
d m s t r i p = ρ m e m · h m e m c r , t d r
where d m s t r i p = strip mass, ρ m e m = membrane density and h m e m = membrane thickness.
The inertial force and normal force of the strip are
d F i n e r t = d F i n e r t , x , 0 , d F i n e r t , z T
d F i n e r t , N = d m s t r i p · v R ˙ r , t

3.6. Combined Lift Model

d F r e s = d N t r a n s f r e e + d N t r a n s f l a p + d F r o t + + d F a d d , N + d F i n e r t , N
This aerodynamic modeling is limited to the force analysis of the wing under the quasi-steady state assumption and does not include unsteady dynamic characteristics, such as starting vortex effect, vortex shedding effect, wake capture effect and so on.

4. Instructions

The core application value of the bionic flapping-wing flying robot is to complete reconnaissance and cruise tasks in a specific area for a long time by relying on the concealment advantages given by its bionic morphological characteristics. There are two main methods to achieve long-term stable flight function. The first is to increase the capacity of the battery, and the second is to optimize the parameters of the flapping-wing flying robot to minimize the energy consumption during flight. Due to the technical limitations of the micro-battery and the great influence of the weight of the battery on the flapping-wing robot, it is difficult to achieve the requirement of long-term flight by simply increasing the battery capacity. For the second method, based on the existing GPSO algorithm, that is, a hybrid algorithm that integrates the advantages of genetic algorithms (GAs) and the particle swarm optimization algorithm (PSO), adaptive inertia parameters and adaptive mutation parameters are added to improve the global optimization ability of the algorithm, and the algorithm is used to solve the minimum power consumption density model of the bat-like flapping-wing flying robot. The geometric parameters and motion parameters are shown in Table 1, and Figure 3 is the wing-hand skeleton structure model diagram.
The wing film of the finger part is Polyester 31 Newtons, with a thickness of 0.05 mm, an elastic modulus of 200 MPa, a Poisson’s ratio of 0.3 and a density of 1.14 g/m2. The wing membrane of the arm part is polydimethylsiloxane film. The thickness of the film product is 0.05 mm, with an elastic modulus of 2.3 MPa, a Poisson’s ratio of 0.4, a density of 1.1 g/m3 and an elongation at break of 300%.
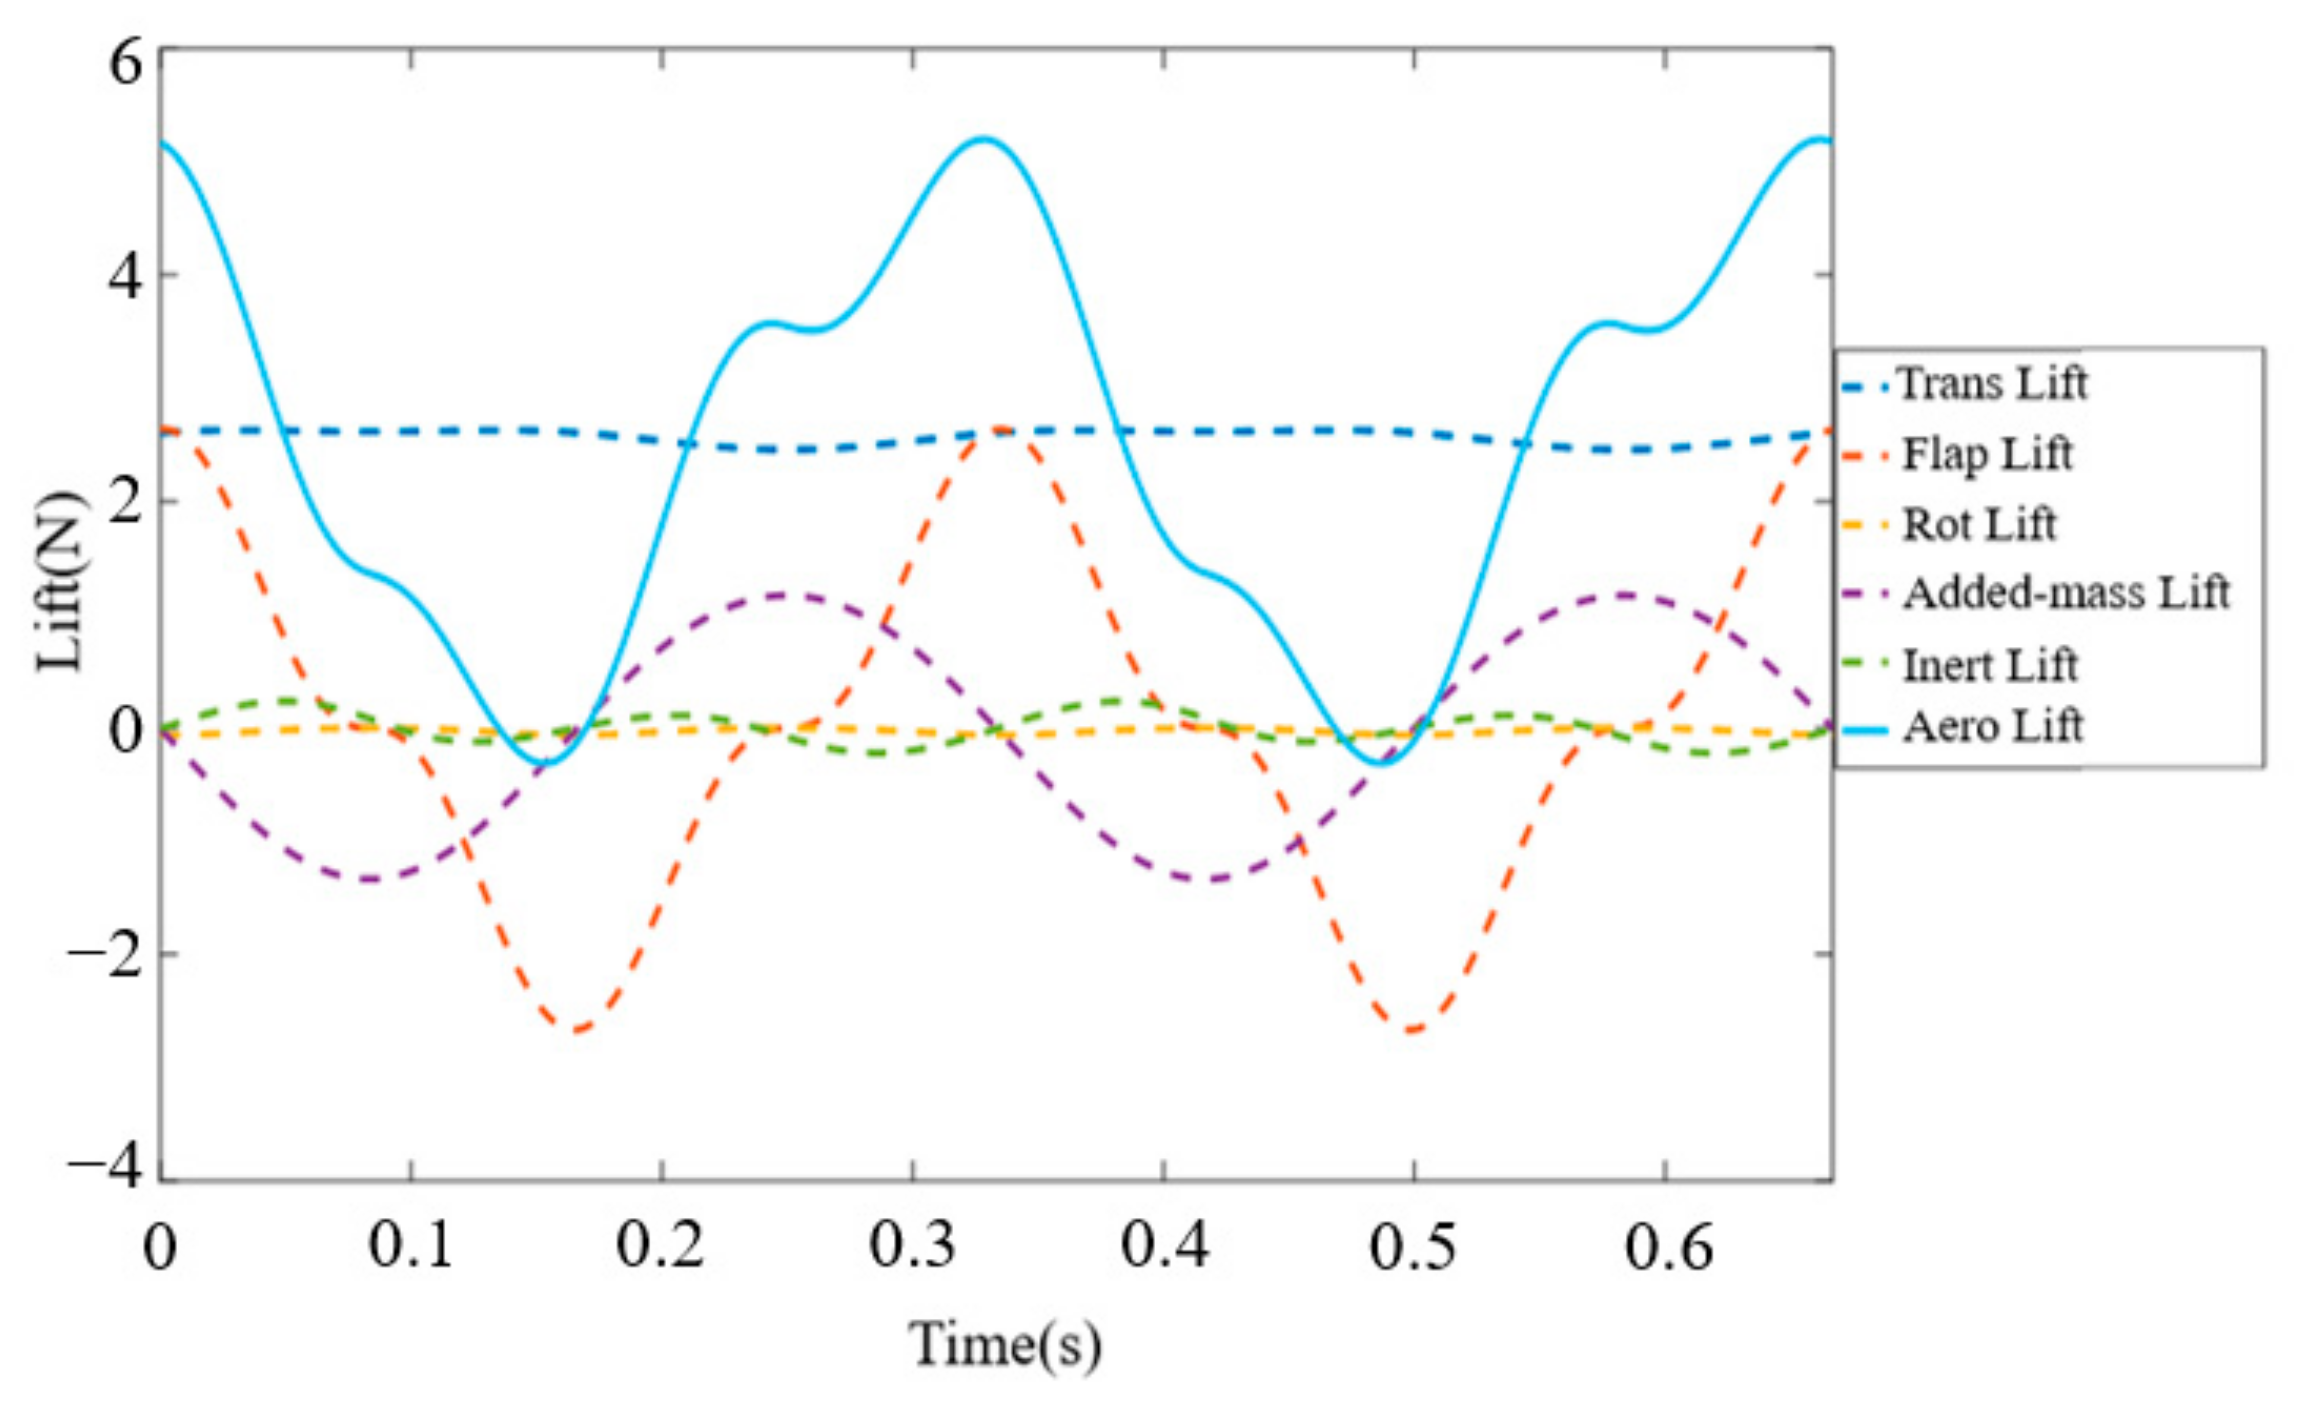
The lift curve obtained according to the basic parameters is shown in Figure 9.
It can be seen from Figure 9 that the translation circulation of free flow mainly affects the average lift, with a higher proportion of influence on the average lift in one cycle, and it plays a leading role in the total average lift, which is an important part of maintaining flight. The translation circulation of flapping around the flapping axis mainly affects the instantaneous lift. However, the wing hand is symmetrically flapping, and the positive lift and negative lift generated in one cycle are equivalent, which makes little contribution to the average lift but dominates instantaneous lift generation and critically enables bat take-off. The moment of inertia lift generated by flexible deformation has little effect on the average lift. The added-mass force has a certain influence on the average lift and the instantaneous lift. The effect of the inertial force of the wing membrane is similar to the moment of inertia lift generated by the flexible deformation, and the effect is very small.
Based on the above research conclusions, the translational circulation component and the added-mass force in the free flow field dominate the average lift force, which constitute the core mechanical elements of the continuous flight of the aircraft. The translational circulation and added-mass force around the flapping axis play a decisive role in the instantaneous lift force, which provides the power source for the take-off stage of the bat-like flapping-wing flying robot.

5. Comparative Analysis of Wind Tunnel Test Results

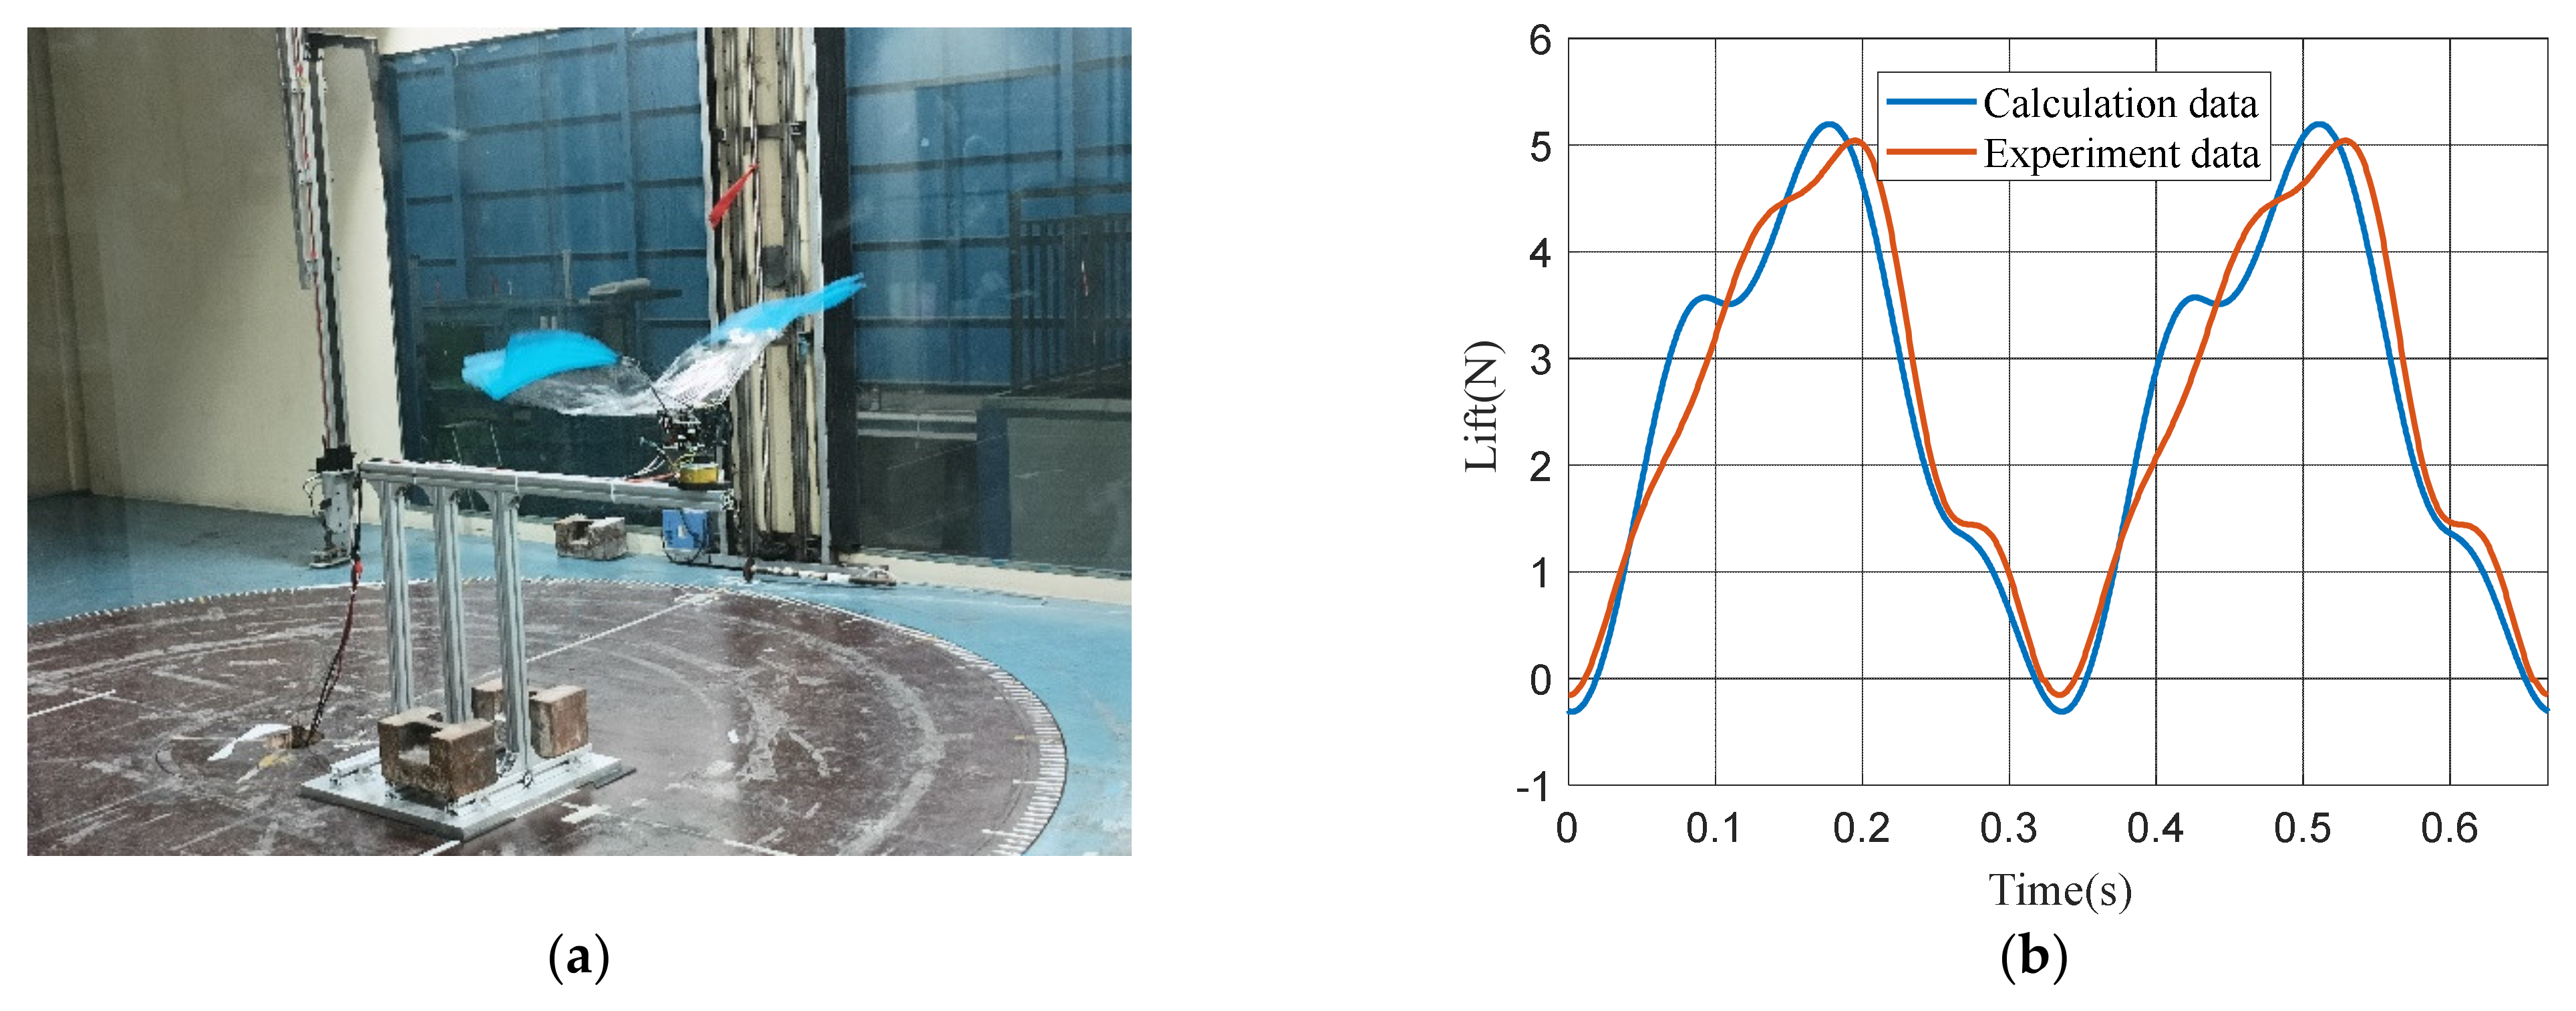
In order to further verify the accuracy of the lift calculation model, this section carried out a wind tunnel test under the same parameters. The experimental environment is shown in Figure 10a, and the specific experimental parameters are shown in Table 2. After fixing the prototype and the sensor on the platform, the parameters are adjusted. By recording the data of the sensor during the movement of the prototype and processing it through the low-pass filter, the average lift data of the experiment is obtained.
Since the movement direction of the wing membrane at the upper limit and the lower limit of the wing movement will change, the velocity here is 0, but the acceleration is the largest. The flexible wing membrane material will change from the concave state to the convex state at this time, resulting in a relatively large deformation force. Therefore, in the lift curve, there will be a large fluctuation at the dotted line.
In order to further verify the accuracy of the theoretical results, the lift curve of the theoretical calculation is compared with the lift curve of the wind tunnel experiment, as shown in Figure 10b.
From the lift characteristic curve, the evolution trend of the two is highly consistent, and the fitting degree is very high. Due to the effect of attached vortex shedding hysteresis, positive lift is almost generated in one cycle, and the overall lift is improved. At the same time, because the wing membrane is accompanied by the expansion of the downbeat process and the retraction of the upbeat process, the time of the attached vortex shedding in the downbeat process is more than that in the upbeat process, which leads to the lift lag effect in the downbeat process, resulting in a certain phase difference between the maximum values of the two curves.
Numerical results show both models achieve 5 N peak lift and near-zero maximum negative lift with similar curve profiles. Theoretical mean lift (2.30 N) compares favorably with experimental data (2.36 N), yielding 2.75% relative error. Wind tunnel validation confirms model accuracy within acceptable limits.
From the numerical results, the maximum lift of the two is near 5 N, the maximum negative lift is near 0 N and the peak value of the curve is similar. The average lift calculated by the theory is 2.3 N, and the average lift obtained by the experiment is 2.3632 N. The relative error is 2.75%, which is within the acceptable range; the wind tunnel experiment thus proves the correctness of the theoretical model.
Because the bat prototype is in the process of flight, the parameters such as beat frequency, wind velocity and angle of attack will be adjusted accordingly during flight. The error of a single working condition cannot meet the conditions to explain the accuracy of the theoretical calculation. The following will change different parameters, calculate the average lift error of each working condition under different parameters and form a comparison: an average lift and error of the incoming wind velocity of 2 m/s, 3 m/s, 4 m/s, 5 m/s and 6 m/s; an angle of attack of 0°, 5°, 10°, 15° and 20°; and a beat frequency of 1 Hz, 1.5 Hz, 2 Hz, 2.5 Hz and 3 Hz. As shown in Figure 11, the experimental data curve is similar to Figure 10b, comparing only the error.
In Figure 11, the abscissa v2 represents the working condition of the wind velocity of 2 m/s, the angle of attack of 10° and the beat frequency of 3 Hz, and v3 represents the working condition of the wind velocity of 3 m/s, the angle of attack of 10° and the beat frequency of 3 Hz, only changing the size of the wind velocity. The abscissa 0 represents the working condition of the angle of attack of 0°, the wind velocity of 5 m/s and the beat frequency of 3 Hz, and 5 represents the working condition of the angle of attack of 5°, the wind velocity of 5 m/s and the beat frequency of 3 Hz, only changing the angle of attack. The abscissa 1 represents the working condition with the beat frequency of 1 Hz, the angle of attack of 10° and the wind velocity of 5 m/s, and 1.5 represents the working condition with the beat frequency of 1.5 Hz, the angle of attack of 10° and the wind velocity of 5 m/s, only changing the beat frequency.
The average lift between the theoretical calculation and the wind tunnel test is presented by the orange and blue histograms. The green line represents the error between the theoretical calculation and the wind tunnel test. From the wind velocity diagram, it can be seen that the lift increases with the increase in wind velocity. This is because as the wind speed increases, the surface pressure of the wing membrane also increases, resulting in an increase in lift. Figure analysis reveals that increasing the angle of attack enlarges the wing membrane’s windward area, resulting in higher mean lift values. It can be seen from the beat frequency diagram that the lift increases with the increase in beat frequency. This is because the relative flow velocity on both sides of the wing membrane increases with the increase in beat frequency, which increases the pressure difference between the front and back sides of the wing membrane during the beat process. Under different working conditions, the influence of wind velocity, angle of attack and beat frequency on lift force shows the same rule, that is, as the three increase, the relative velocity or circulation intensity is changed, and the lift force increases gradually.
The error curve shows the theoretical value and experimental value under all working conditions. The error value is within 3.98%, and the minimum error value is 0.72%, which is within the acceptable range, which verifies the validity of the theoretical calculation model. In addition, when the flow velocity, angle of attack and flapping frequency decrease, the error shows an accelerating convergence trend. This is due to the fact that the unsteady characteristics of the flow field are weakened when the three values decrease. The calculation results of the theoretical model are closer to the wind tunnel test results, and the correctness of the theoretical model is also verified.

6. Conclusions

In this paper, the bionic bat flapping-wing robot is taken as the object. According to the aerodynamic characteristics of the bat wing membrane, a set of calculation methods for calculating the lift of the deformable wing membrane is established, and the lift modeling and analysis of the bat-like flying robot under the extended steady state can be carried out. By establishing the body coordinate system, the wing hand coordinate system and the wing membrane coordinate system, it provides the basis for the settlement of key aerodynamic parameters. Based on the blade element method, the analytical expressions of the chord length and passive torsion angle of the flexible wing membrane are derived, and the relative velocity and relative angle of attack parameters of the flexible wing membrane are calculated.
According to the results of lift calculation, it is concluded that the translational circulation and added-mass force of free flow mainly affect the average lift and play a leading role in maintaining flight stability. The translational circulation and added-mass force of beating around the beat axis have a significant effect on the instantaneous lift amplitude, which constitutes the core factor in the take-off stage.
A wind tunnel test under the same motion parameters as the theoretical model was carried out, in which the average lift calculated by the theory is 2.3 N, the average lift calculated by the wind tunnel test is 2.3632 N and the relative error is 2.75%, which is within the acceptable range. The lift curve under the theoretical calculation is well fitted with the lift curve obtained by the wind tunnel test, and the average lift is close, which proves the effectiveness of the algorithm. By comparing the theoretical data and experimental data of the average lift under multiple working conditions, the error curve shows the theoretical value and experimental value under all working conditions. The maximum error value is 3.98%, and the minimum is 0.72%. The error is within the acceptable range, indicating the accuracy of the theoretical calculation. At the same time, the error curve is analyzed, and the law that the error between theoretical calculation and experimental data gets smaller and smaller with the weakening of unsteady effect is summarized, which further illustrates the accuracy and stability of the theoretical model.

Author Contributions

Conceptualization, B.D.; methodology, B.D. and S.W.; software, J.L.; validation, B.D., Z.C. and J.L.; formal analysis, B.D. and Z.C.; resources, Z.C. and S.W.; data curation, J.L. and S.W.; writing—original draft preparation, B.D.; writing—review and editing, Z.C.; visualization, Z.C.; supervision, B.J.; project administration, B.J. and A.S.; funding acquisition, A.S. All authors have read and agreed to the published version of the manuscript.

Funding

This work is supported by the National Natural Science Foundation of China (No. 52405037) and Aviation Science Fund (No. 2024Z006076001).

Data Availability Statement

The paper will display my email address and that of the author responsible for handling the data. The data that support the findings of this study are available from the corresponding author upon reasonable request.

Conflicts of Interest

The authors declare no conflicts of interest.

References

  1. Gerdes, J.W.; Gupta, S.K.; Wilkerson, S.A. A review of bird-inspired flapping wing miniature air vehicle designs. J. Mech. Robot.-Trans. ASME 2012, 4, 5484–5494. [Google Scholar] [CrossRef]
  2. Couceiro, M.; Luz, J.M.A.; Figueiredo, C.M.; Ferreira, N.F. Modeling and control of biologically inspired flying robots. Robotica 2011, 30, 107–121. [Google Scholar] [CrossRef]
  3. Pan, Y.; Guo, S.; Huang, X. Research progress on bio-inspired flapping-wing rotor micro aerial vehicle development. J. Bionic Eng. 2024, 21, 1621–1643. [Google Scholar] [CrossRef]
  4. Kan, Z.; Yao, Z.; Li, D.; Bie, D.; Wang, Z.; Li, H.; Xiang, J.W. Design and flight test of the fixed-flapping hybrid morphing wing aerial vehicle. Aerosp. Sci. Technol. 2023, 143, 108705. [Google Scholar] [CrossRef]
  5. Zhang, M.; Song, B.; Yang, X.; Lang, X.; Xuan, J.; Wang, L. Analysis of the integrated pattern of hoverable flapping wing micro-air vehicle. J. Eng. Res. 2024, 13, 1901–1915. [Google Scholar] [CrossRef]
  6. Han, J.K.; Hui, Z.; Tian, F.B.; Chen, G. Review on bio-inspired flight systems and bionic aerodynamics. Chin. J. Aeronaut. 2021, 34, 170–186. [Google Scholar] [CrossRef]
  7. Wang, J.X.; Xuan, J.L.; Yang, X.J.; Zheng, R. Research progress of flapping wing aircraft with multimodal motion ability. Acta Aeronaut. Astronaut. Sin. 2024, 45, 029842. [Google Scholar]
  8. Dadashi, S.; Gregory, J.; Lei, Y.; Kurdila, A.; Bayandor, J.; Mueller, R. Adaptive control of a flapping wing robot inspired by bat flight. In Proceedings of the AIAA Guidance, Navigation, and Control Conference, National Harbor, MD, USA, 13–17 January 2014. [Google Scholar]
  9. Fei, F.; Zhan, T.; Yang, Y.L.; Zhang, J.; Deng, X.Y. Flappy Hummingbird: An Open Source Dynamic Simulation of Flapping Wing Robots and Animals wing robots and animals. In Proceedings of the International Conference on Robotics and Automation (ICRA), Montreal, QC, Canada, 20–24 May 2019; IEEE: Piscataway, NJ, USA; pp. 9223–9229.
  10. Jafferis, N.T.; Helbling, E.F.; Karpelson, M.; Wood, R.J. Untethered flight of an insect-sized flapping-wing microscale aerial vehicle. Nature 2019, 570, 491–495. [Google Scholar] [CrossRef]
  11. Sihite, E.; Alireza, R. A morphology-centered view towards describing bats dynamically versatile wing conformations. Int. J. Robot. Res. 2025, 44, 431–464. [Google Scholar] [CrossRef]
  12. Norberg, U.M.; Rayner, J.M. Ecological morphology and flight in bats (Mammalia; Chiroptera): Wing adaptations, flight performance, foraging strategy and echolocation. Philos. Trans. R. Soc. Lond. B Biol. Sci. 1985, 316, 335–427. [Google Scholar]
  13. Ramezani, A.; Chung, S.J.; Hutchinson, S. A biomimetic robotic platform to study flight specializations of bats. Sci. Robot. 2017, 2, eaal2505. [Google Scholar] [CrossRef]
  14. Hoff, J.; Ramezani, A.; Chung, S.J.; Hutchinson, S. Synergistic Design of a Bio-Inspired Micro Aerial Vehicle with Articulated Wings. In Proceedings of the Robotics: Science and Systems, Online, 12–16 July 2016; Volume 22. [Google Scholar]
  15. Zhang, K.; Chen, S.; Yang, Q.; Guo, S.; Chen, Q.; Liu, Z.; Mo, W. The Oligodendrocyte Transcription Factor 2 OLIG2 regulates transcriptional repression during myelinogenesis in rodents. Nat. Commun. 2022, 13, 1423. [Google Scholar] [CrossRef] [PubMed]
  16. Bender, M.; Guo, J.; Powell, N.; Kurdila, A.; Müller, R. Learning bioinspired joint geometry from motion capture data of bat flight. Bioinspiration Biomim. 2019, 14, 036013. [Google Scholar] [CrossRef]
  17. Hoeijmakers, H.W. Aerodynamics Flapping-Flight Robotic Bird using Unsteady Lifting-Line Method. In Proceedings of the AIAA Aviation, San Diego, CA, USA, 12–16 June 2023; p. 4527. [Google Scholar]
  18. Timmermans, S.; Vanierschot, M.; Vandepitte, D. Aerodynamic model updating using wind-tunnel setup for hummingbirdlike flapping wing nanorobot. AIAA J. 2022, 60, 902–912. [Google Scholar] [CrossRef]
  19. Iriarte-Díaz, J.; Riskin, D.K.; Willis, D.J.; Breuer, K.S.; Swartz, S.M. Whole-body kinematics of a fruit bat reveal the influence of wing inertia on body accelerations. J. Exp. Biol. 2011, 214, 1546. [Google Scholar] [CrossRef]
  20. Colorado, J.; Barrientos, A.; Rossi, C.; Breuer, K.S. Biomechanics of smart wings in a bat robot: Morphing wings using SMA actuators. Bioinspir. Biomim. 2012, 7, 036006. [Google Scholar] [CrossRef]
  21. Li, X.P.; Wang, W.; Tang, Y.; Wang, L.; Bai, T.; Zhao, F.; Bai, Y. Research on gliding aerodynamic effect of deformable membrane wing for a robotic flying squirrel. J. Bionic Eng. 2018, 15, 379–396. [Google Scholar] [CrossRef]
  22. Ismail, N.I.; Zulkifli, A.H.; Abdullah, M.Z.; Basri, M.H.; Abdullah, N.S. Computational aerodynamic analysis on perimeter reinforced (PR)-compliant wing. Chin. J. Aeronaut. 2013, 26, 1093–1105. [Google Scholar] [CrossRef]
  23. Hedenström, A.; Johansson, L.C. Bat flight: Aerodynamics, kinematics and flight morphology. J. Exp. Biol. 2015, 218, 653–663. [Google Scholar] [CrossRef]
  24. Duan, B.; Guo, C.; Liu, H. Aerodynamic analysis for a bat-like robot with a deformable flexible wing. Robotica 2023, 41, 306–325. [Google Scholar] [CrossRef]
  25. Ramezani, A.; Shi, X.; Chung, S.J.; Hutchinson, S. Modeling and nonlinear flight controller synthesis of a bat-inspired micro aerial vehicle. In Proceedings of the AIAA Guidance, Navigation, and Control Conference, AIAA Paper, San Diego, CA, USA, 4–8 January 2016; p. 1376. [Google Scholar]
  26. Joshi, V.; Jaiman, R.K.; Li, G.; Breuer, K.; Swartz, S. Full-scale aeroelastic simulations of hovering bat flight. In Proceedings of the AIAA Scitech, Orlando, FL, USA, 6–10 January 2020. [Google Scholar]
  27. Dickinson, M.H.; Lehmann, F.O.; Sane, S.P. Wing Rotation and the Aerodynamic Basis of Insect Flight. Science 1999, 284, 1954–1960. [Google Scholar] [CrossRef]
  28. Sane, S.P.; Dickinson, M.H. The aerodynamic effects of wing rotation and a revised quasi-steady model of flapping flight. J. Exp. Biol. 2002, 205, 1087–1096. [Google Scholar] [CrossRef]
  29. Whitney, J.P.; Wood, R.J. Aeromechanics of passive rotation in flapping flight. J. Fluid Mech. 2010, 660, 197–220. [Google Scholar] [CrossRef]
  30. Ke, X.; Zhang, W.; Shi, J.; Chen, W. The modeling and numerical solution for flapping wing hovering wingbeat dynamics. Aerosp. Sci. Technol. 2021, 110, 106474. [Google Scholar] [CrossRef]
Figure 1. The prototype model.
Modelling 06 00117 g001
Figure 2. The definition of the coordinate system.
Modelling 06 00117 g002
Figure 3. The Watt six-link structure diagram (Red represents the extension of wings, and green represents the contraction of wings).
Modelling 06 00117 g003
Figure 4. Wing membrane shape and strip division (The shadow on the left is the area where lift is generated by the flapping of wings, and the shadow on the right is the band divided by the blade element theory).
Modelling 06 00117 g004
Figure 5. Bat wing membrane deformation, (a) A simple diagram of the structure of a single wing of a bat and its corresponding horizontal projection. (b) A simplified diagram of the structure of a bat’s wings after they flap upwards from the horizontal side for a certain distance. (c) The elastic change diagram of the bat wing model when it flaps. After the wing membrane undergoes elastic deformation, h h e a d represents the height generated relative to the leading edge, and h b a c k represents the height generated relative to the trailing edge. (d) After the bat wing model is flapped, the changes in the wing skeleton relative to the horizontal plane.
Modelling 06 00117 g005
Figure 6. The deformation diagram of the wing membrane when r < r P 6 .
Modelling 06 00117 g006
Figure 7. Periodic variation diagrams of chord length and passive torsion angle. (a) The brown area in the figure represents the real-time variation curve of the chord length along the spread direction within one period. The horizontal coordinate indicates the number of dividing strips, and the larger the number, the farther away from the wing flapping axis. The vertical coordinate represents the range of chord length variation. (b) The brown area in the figure represents the real-time variation curve of a periodic passive torsion Angle, with the horizontal axis representing the number of dividing strips. The larger the number, the farther away from the wing flapping axis. The vertical coordinate rep-resents the range of variation of the torsion Angle.
Modelling 06 00117 g007
Figure 8. Projection velocity and composite of relative velocity, (a) The projection velocity v l f t of freestream velocity onto the XmOmZm plane, v f is freestream velocity, β is dihedral angle (between flapping plane and horizontal plane), β 2 is angle between freestream velocity and XmOmZm plane, θ o is flapping angle, β 3 is angle between   v l f t   and OmXm axis. (b) The resultant velocity from combining the three components in the XmOmZm plane, v R is the relative resultant velocity, v l f t   is the projection velocity, v n t r , t is the passive torsional velocity. θ v is the angle between the relative velocity v R and the positive half axis of OmXm.
Modelling 06 00117 g008
Figure 9. The lift curve.
Modelling 06 00117 g009
Figure 10. Wind tunnel experimental measurement platform and comparison of lift curves. (a) The bat prototype is undergoing experiments in a wind tunnel. (b) After signal processing of the lift data measured under the wind tunnel experiments, the average lift data is obtained. The orange part represents the average lift curve obtained from the wind tunnel experiments, and the blue part represents the average lift curve calculated by the theoretical model.
Modelling 06 00117 g010
Figure 11. Theoretical calculation and wind tunnel test of the average lift under various conditions.
Modelling 06 00117 g011
Table 1. Geometric parameters and motion parameters.
Structural ParameterNumerical Value
Arm1 (mm)100
Arm2 (mm)100
Arm3 (mm)132
Arm4 (mm)132
Finger1 (mm)300
Finger2 (mm)275
Finger3 (mm)247
Angle of attack (°)10
Beat amplitude (°)30
Beat frequency (Hz)3
Wind velocity (m/s)5
Table 2. Experimental environment.
Experimental ParametersNumerical Value
Angle of attack10°
Wind velocity5 m/s
Beat frequency3 Hz
Disclaimer/Publisher’s Note: The statements, opinions and data contained in all publications are solely those of the individual author(s) and contributor(s) and not of MDPI and/or the editor(s). MDPI and/or the editor(s) disclaim responsibility for any injury to people or property resulting from any ideas, methods, instructions or products referred to in the content.